1. Introduction
Design studio education is one of the most intensive learning environments in higher education. Unlike lecture courses where learning is concentrated in scheduled classroom meetings, studio education is rooted in learning-by-doing and requires sustained presence. Students in design fields spend long hours engaged in iterative design processes, collaborative problem solving and desk critiques while alternating between digital and analog work. In this sense, the studio is not merely where instruction happens; it is the material dimension of studio culture [
1]. As the space becomes inseparable from the experience, the spatial affordances may influence students’ cognitive and perceptual load, capacity for sustained attention, and well-being.
Student well-being has become an increasingly important backdrop for learning environments across higher education. National Healthy Minds Study data for 2023–2024 indicate that 35.1% of U.S. college student survey respondents screened positive for moderate-to-severe anxiety and 16.2% for severe anxiety [
2]. Anxiety screening rates were higher among students in art and design fields (45.6% moderate-to-severe; 21.9% severe) and elevated among students in architecture or urban planning (38.2% moderate-to-severe; 19.0% severe) compared with the overall sample (35.1% any; 16.2% severe).
These design discipline-linked anxiety patterns underscore the importance of understanding how studio environments support or undermine restoration. In studio-based curricula, the question is especially consequential because students may have fewer practical opportunities to step away from the studio environment during demanding project cycles, especially if the studio environment does not afford opportunities for restoration. While research has documented the restorative benefits of campus greenness, and studies of classrooms and open workplaces have examined indoor environmental quality, comfort, and biophilia, the restorative affordances of design studios, where students must find restoration within the same space that demands their sustained effort, need more systematic attention.
1.1. Related Work
Research on restorative campus environments has largely focused on outdoor greenspaces and landscapes, demonstrating their psychophysiological benefits for students experiencing stress or mental fatigue. A substantial body of evidence links campus greenness to student well-being outcomes across multiple measurement approaches [
3,
4,
5,
6]. The studies are commonly grounded in the Attention Restoration Theory (ART) and Stress Recovery Theory (SRT) as both theories converge on the prediction that exposure to natural elements can benefit individuals experiencing environmental stress or mental fatigue [
7,
8,
9].
Attention restoration theory (ART) proposes that depleted directed attention can recover in environments that provide psychological distance from routine demands, sufficient scope or coherence, compatibility with a person’s purposes, and fascination that captures attention without effort [
7]. Stress recovery theory (SRT) emphasizes affective and physiological recovery from stress in response to nonthreatening environmental qualities, including natural content [
8,
9]. Affordance theory addresses a complementary question: what possibilities for perception and action emerge from the relationship between an environment and a particular user [
10,
11,
12]. In the present study, ART and SRT help identify why some environmental qualities may be relevant to restoration, whereas affordance theory provides a framework to interpret how students recognize or desire environmental possibilities. None of these theories is directly tested through a measured restorative outcome.
Gulwadi et al.’s cross-cultural analysis of campuses in Turkey and the United States showed positive associations among objective greenness, students’ perceived greenness and perceived restorativeness, and quality of life [
3]. Comparing campuses, the researchers identified that in the U.S. sample, green areas adjacent to buildings were not necessarily aligned with students’ perceived campus greenness, whereas central campus greenness related more consistently to perceived greenness, suggesting that where students actually engage with the campus and what counts as perceptually salient greenness both matter. Beyond self-report, emerging neuropsychological campus research has begun to connect campus environmental attributes to physiological indicators consistent with restoration. Asim and colleagues combined a survey approach to identify student “hotspots” with a mobile EEG study and Perceived Restorativeness Scale (PRS) assessments at those locations [
5]. Their findings also suggest that vegetation and expansive vistas are associated with positive approach behaviors, and can improve emotional regulation. GPS and mobile app-based tracking has also been used to examine the association between university students’ time in nature and positive mood [
4]. A systematic review of studies using physiological indicators found inconsistencies, particularly when EEG and salivary cortisol were used as indicators of restoration [
13]. Related methodological work has shown that green-space assessments can be improved by combining two- and three-dimensional representations, including visibility maps, rather than relying solely on GIS-based data [
14].
The findings establish the value of campus nature for student restoration and show that restoration can occur through ordinary, repeated encounters with supportive environments. However, nature access can be limited across programs of study or during daily routines. In particular, studio-based curricula include long design work sessions and deadline pressures, which can reduce the feasibility of leaving the studio for restorative breaks. In the design studio contexts, restoration may depend less on whether a campus has greenspace and more on whether restorative opportunities are proximal, compatible, and available [
3].
Campus research and learning environment studies are also increasingly interpreted through a biophilic-design lens that translates restoration mechanisms into design-relevant attributes [
15,
16,
17,
18]. Peters and D’Penna reviewed literature on biophilic design and university learning environments and highlighted the necessity of studying classroom and lecture spaces and engaging participants with actual experiences. They compiled campus, building and classroom scale design guidelines for incorporating biophilia into learning environments [
19]. Alves et al. discussed how campus biophilic attributes may foster student connectedness and quality-of-life benefits through both direct and indirect nature engagement and place-based experience [
20].
Research on learning environment design has often emphasized environmental quality and comfort through attribute-based satisfaction and performance metrics including visual and thermal comfort, acoustic conditions and air quality [
21,
22,
23,
24,
25]. Together with post-occupancy evaluations, these measures provide strong methodological precedents but rarely explain how specific spatial features enable or constrain well-being. Emerging computational approaches using image analysis and machine learning have enabled automated estimation of student engagement and attention in classroom settings [
26,
27]. Although these approaches have not been adopted to study restoration, they can help identify cognitive loads and environmental stressors in different educational contexts.
To connect environmental conditions with user-environment possibilities, this study uses Gibson’s affordance theory as an interpretive lens [
10]. An affordance is not simply a physical feature; it is a possibility for perception or action that arises in relation to a user’s capacities, goals, and context. In a studio, for example, a window may afford looking outward, while a controllable task light may afford local adjustment. Whether either possibility produces restoration is an empirical question and cannot be inferred from the feature alone.
Applications of affordance theory in learning environments vary across disciplines, and previous authors have called for greater attention to the qualities and abilities of users in evaluative contexts [
11,
12]. This relational perspective is useful for interpreting why students situated at different desks may propose different environmental changes. It does not, however, make the sketches direct measures of affordance perception or use.
Accordingly, this study distinguishes among restorative outcomes, restoration-oriented preferences, and affordances. A restorative outcome is an observed or reported recovery in attention, affect, stress, or effective functioning. This study did not measure such outcomes. A restoration-oriented preference is an environmental modification proposed in response to a prompt about a restorative studio. An affordance is a user-environment possibility and is used here as an interpretive framework rather than as a directly measured variable. The sketches document proposed modifications, VWS and WSA quantify geometric window visibility, and the later survey describes cohort-level perceptions and reported view use. No category, including technology, is assumed to be inherently restorative, and the study does not test whether any proposed modification would produce restoration.
1.2. Aim and Scope
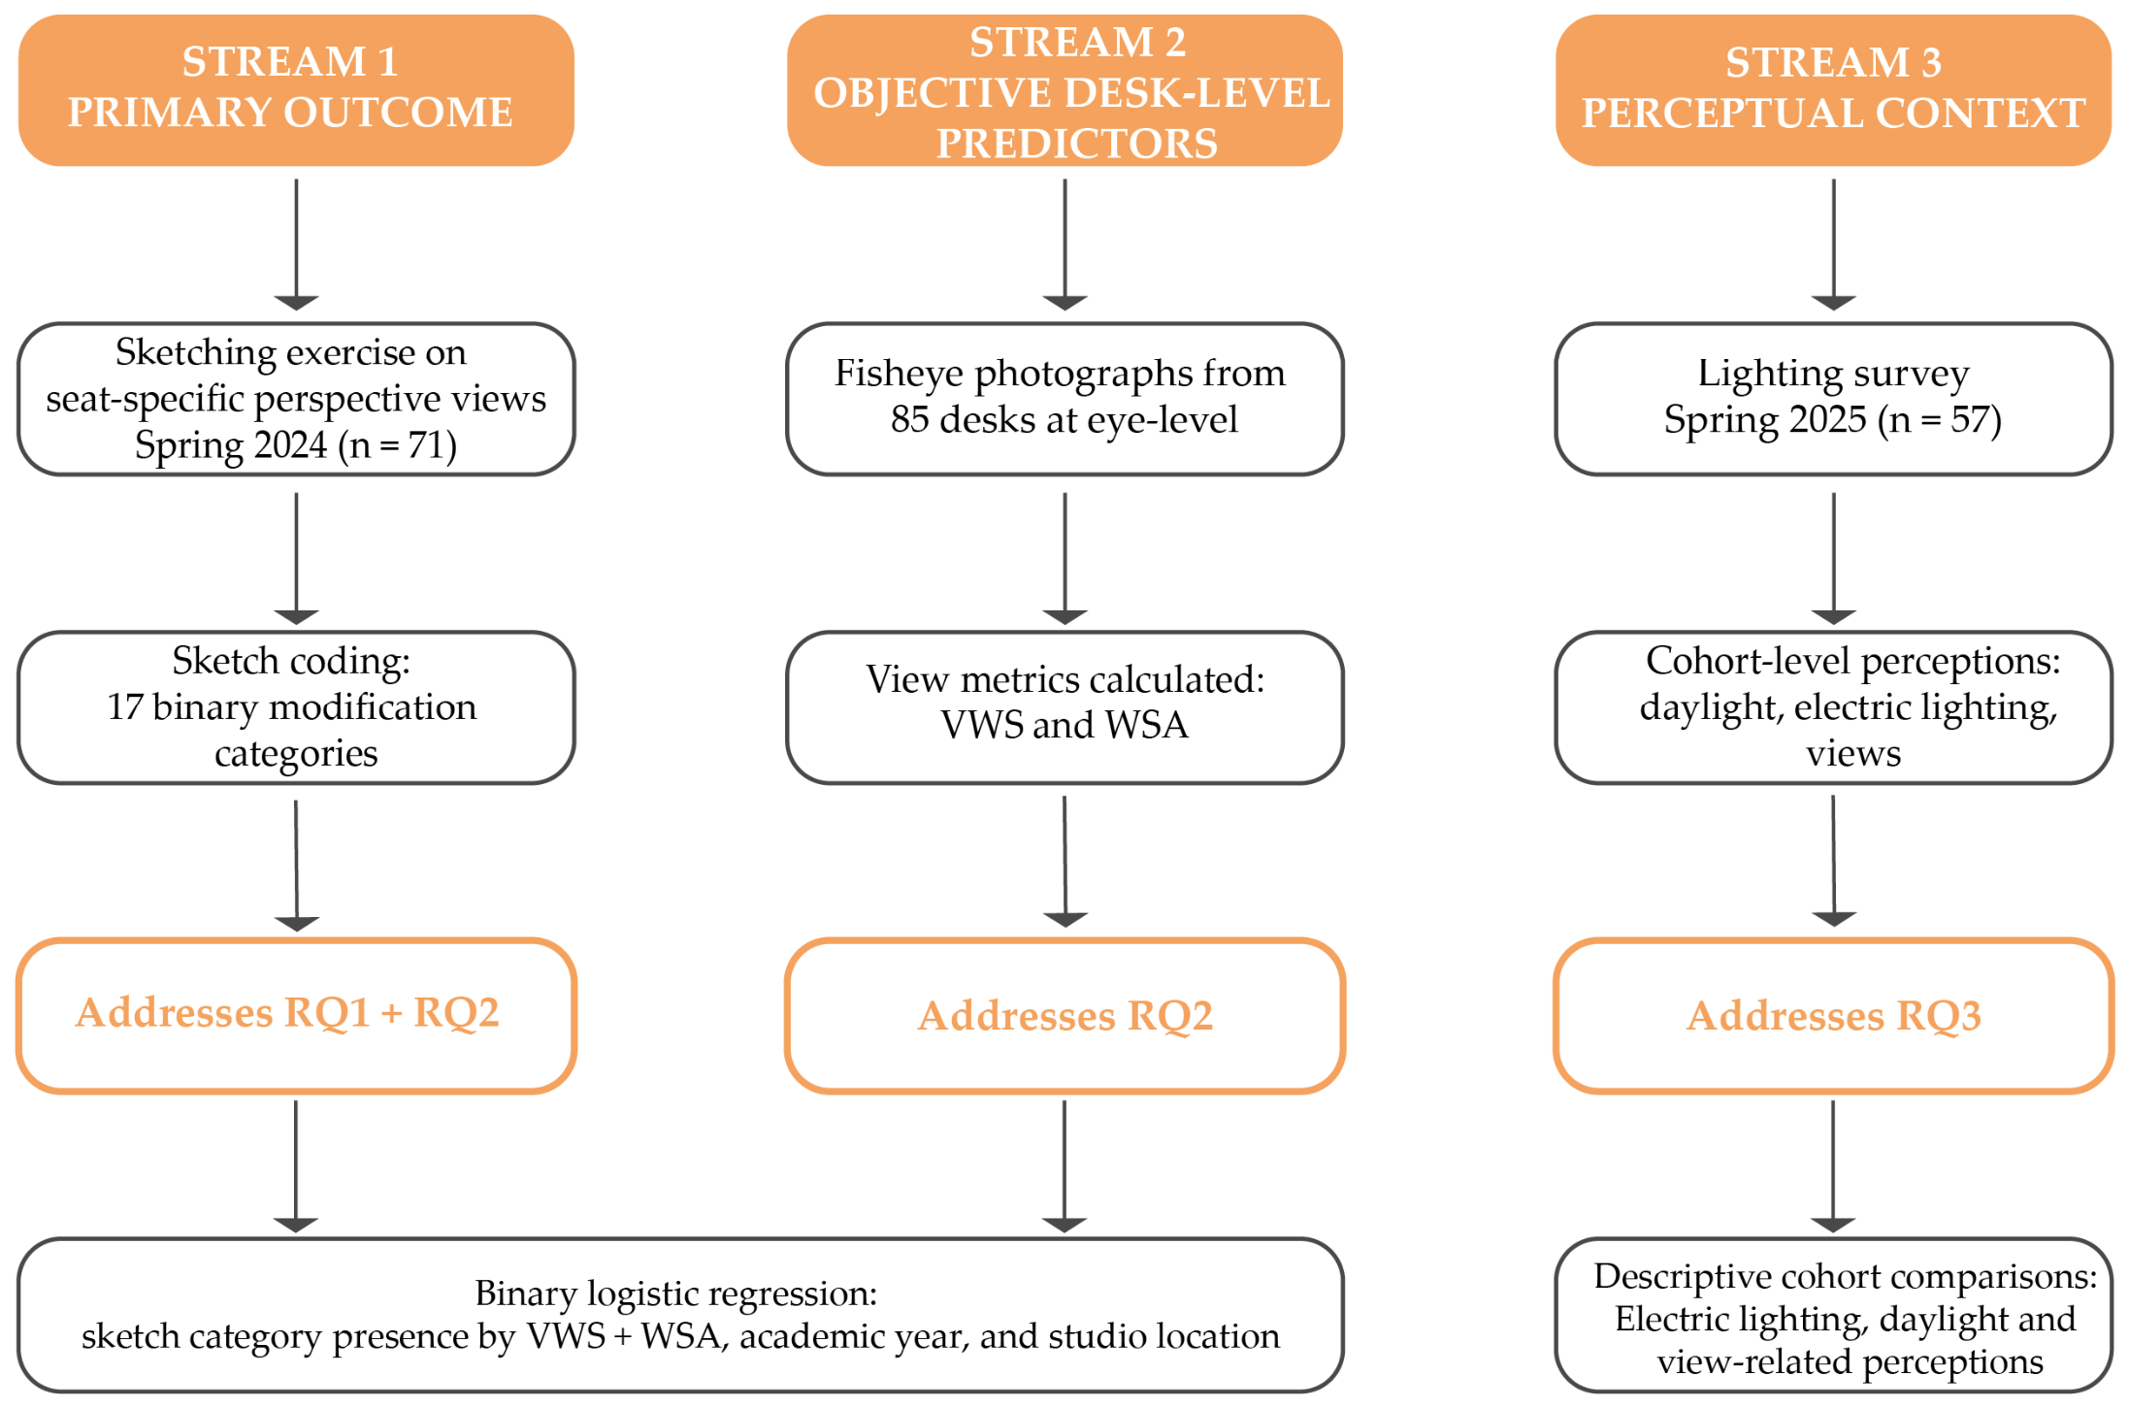
Despite robust evidence that campus nature can support restoration and a growing body of guidance for biophilic learning environments, less is known about the environmental modifications that design students propose to support restoration while conducting sustained work at their studio desks. This exploratory study examines those proposals and uses affordance theory to interpret them as situated environmental possibilities rather than as measured restorative outcomes. Desk-level view measures describe spatial exposure and are used in exploratory association models. A lighting survey characterizes cohort-level perceptions of daylight, electric lighting, window views, and reported view use.
By integrating desk-level view metrics, participatory sketching, and lighting survey data within an affordance framework, this study contributes to learning environment research in three ways. It documents user-generated environmental modifications from standardized, desk-specific viewpoints; evaluates whether sketch content varies with academic year, studio location, and geometric window view access while explicitly addressing multicollinearity; and places the desk-level findings alongside a later cohort-level survey without conflating the analytical levels. Because attention restoration, stress recovery, well-being, and observed affordance use were not directly measured, the contribution is hypothesis-generating and design-oriented.
Research questions:
RQ1. What environmental modifications, including explicitly restoration-oriented and broader functional or supportive proposals, do students express in response to a restorative-studio prompt?
RQ2. How are academic year, studio location, and desk-level view-access measures associated with the presence of commonly endorsed modification categories?
RQ3. What cohort-level patterns are evident in the later survey of daylight, electric lighting, window views, and reported view use?
3. Results
3.1. Sample Characteristics and View Access Metrics
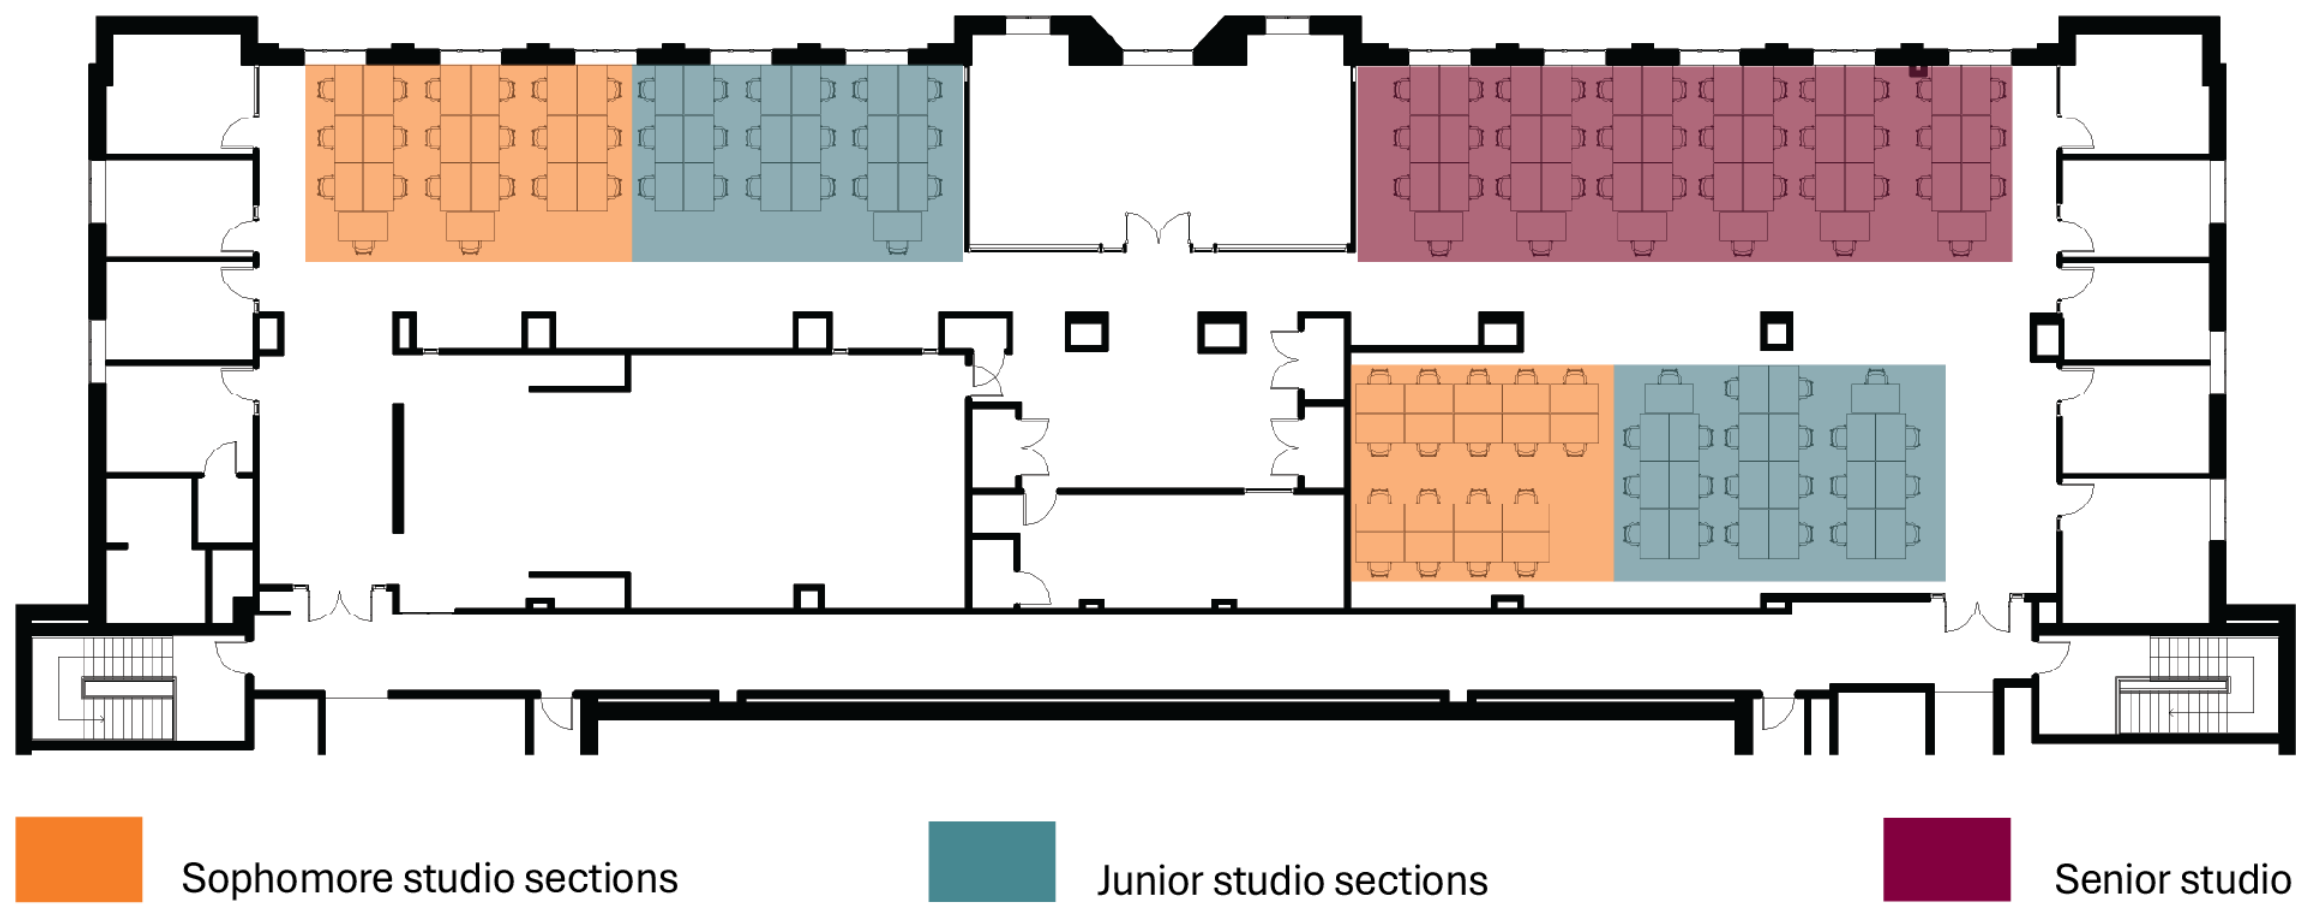
Of the 85 students enrolled in the design studios, 71 completed the sketching exercise (83.5% response rate): 36 were sophomores and 35 were juniors; 37 were in the core zone and 34 in the façade zone.
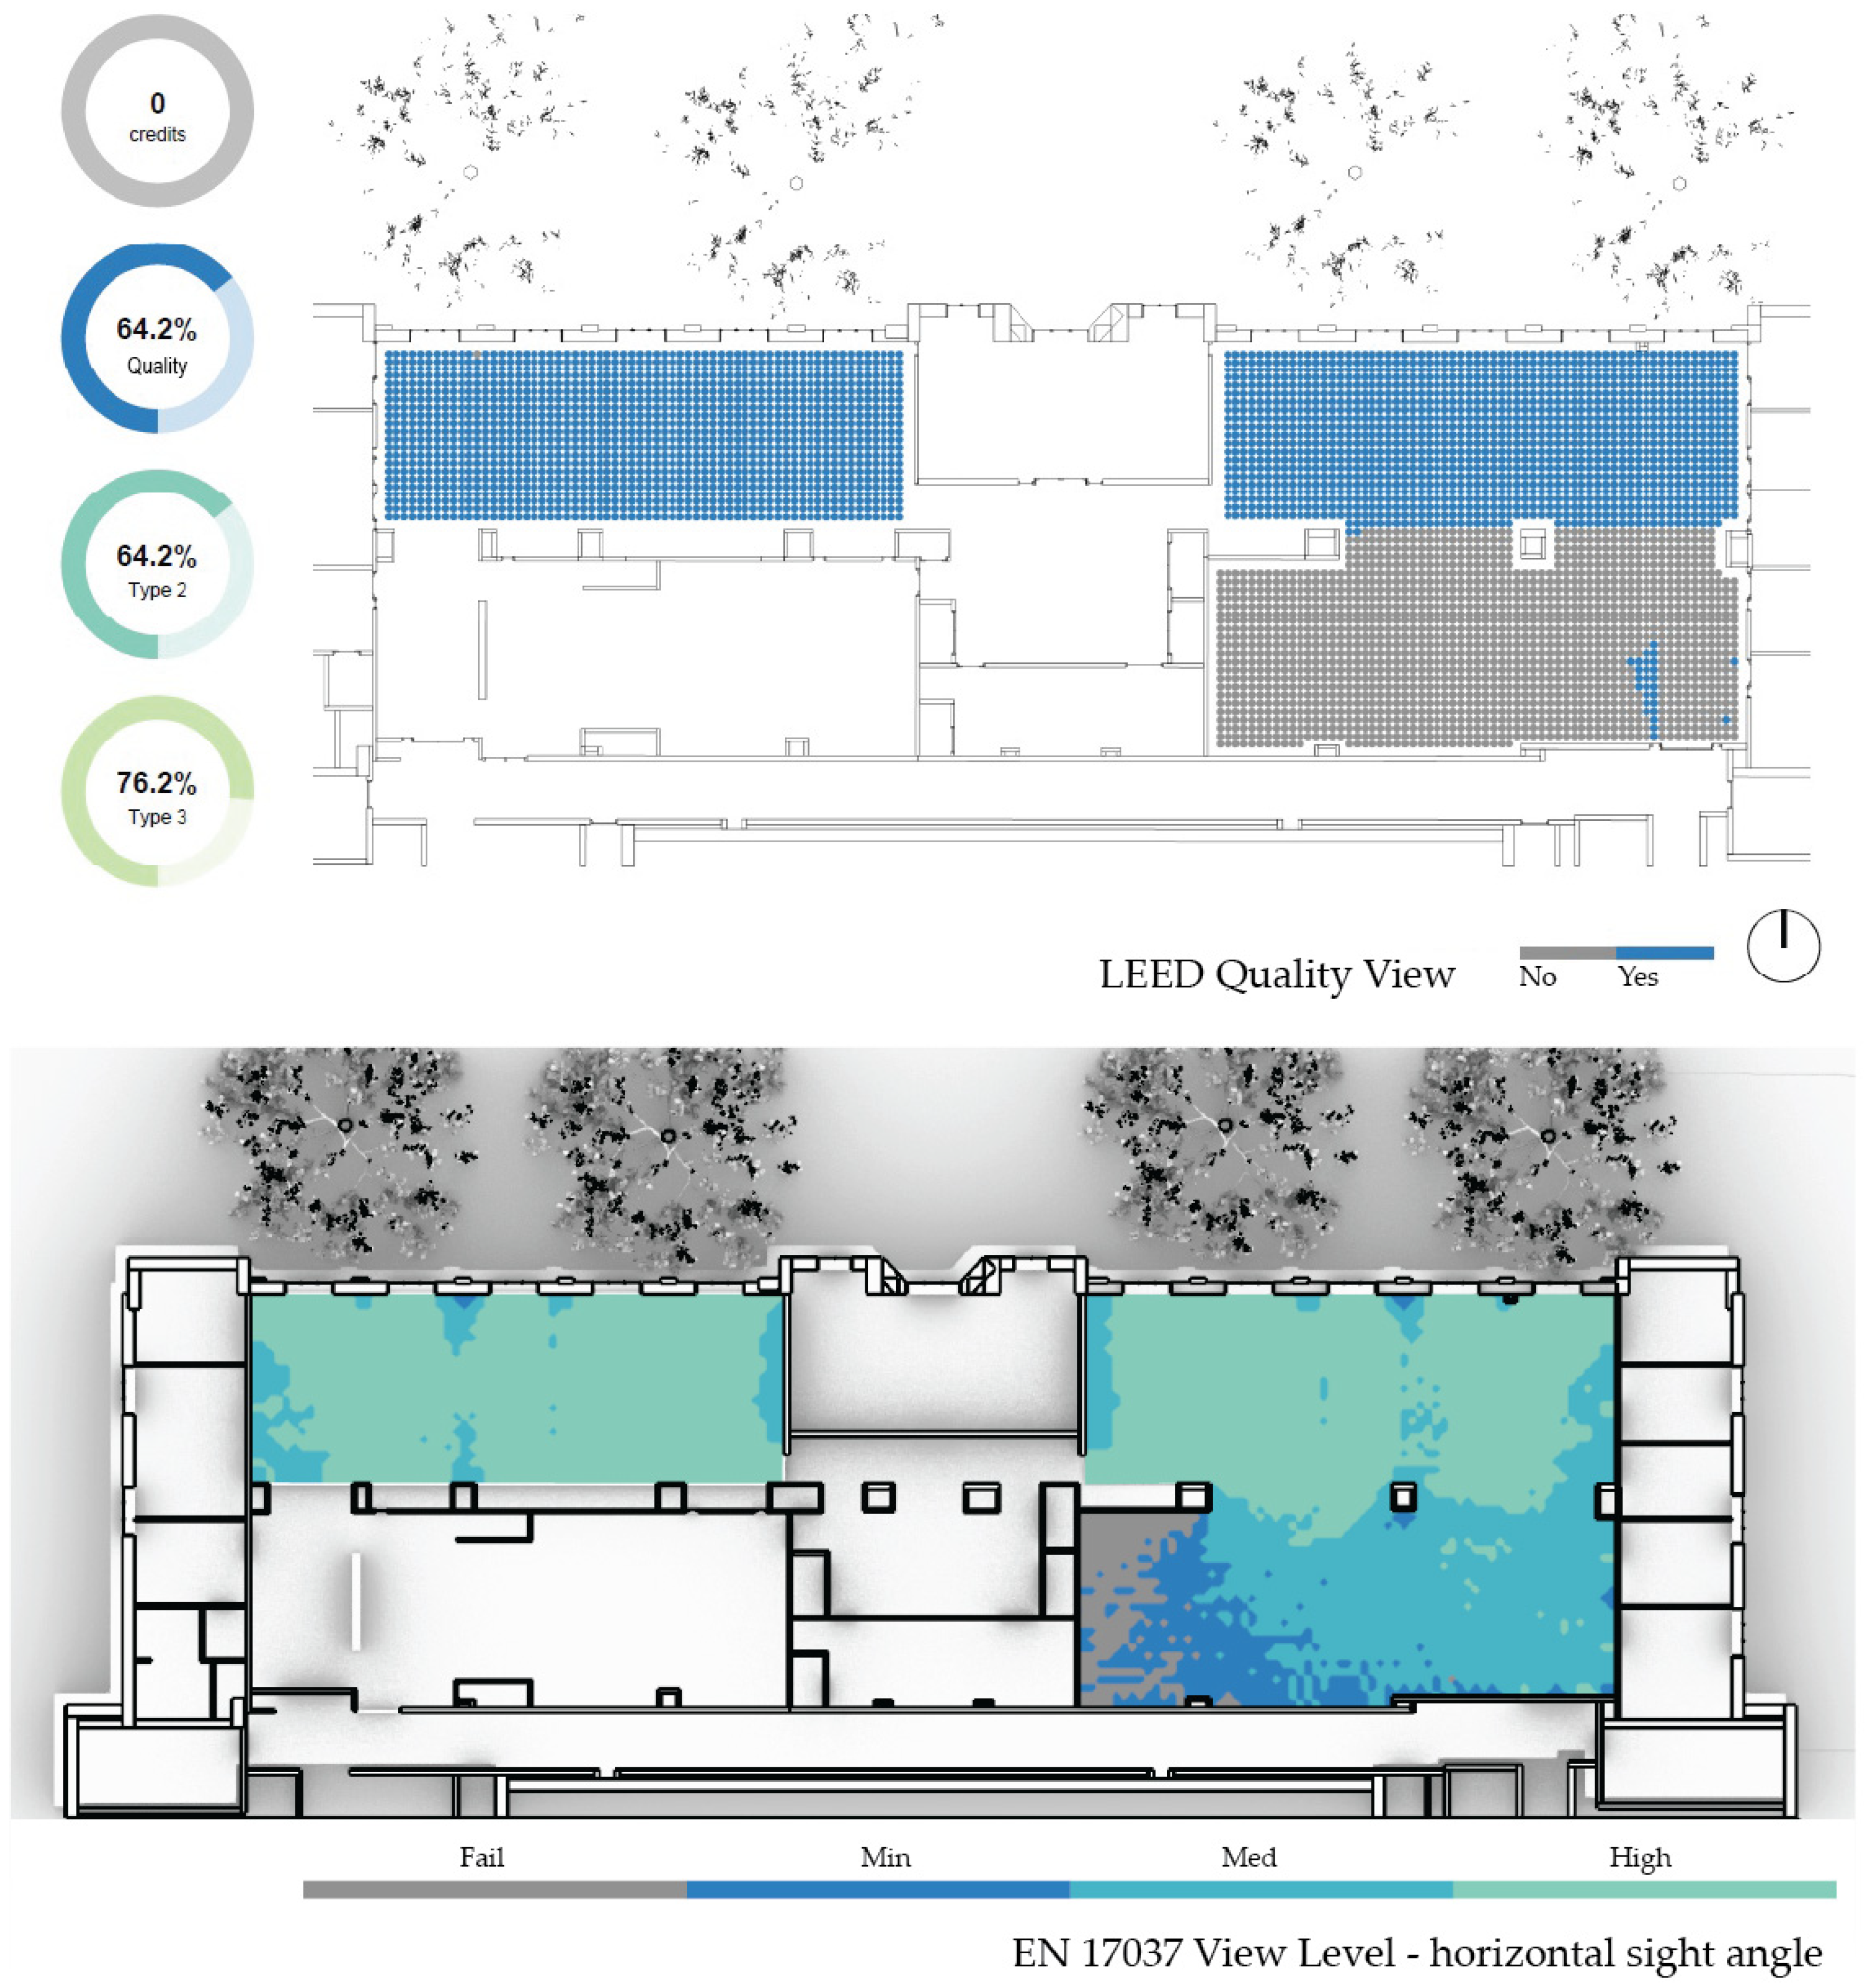
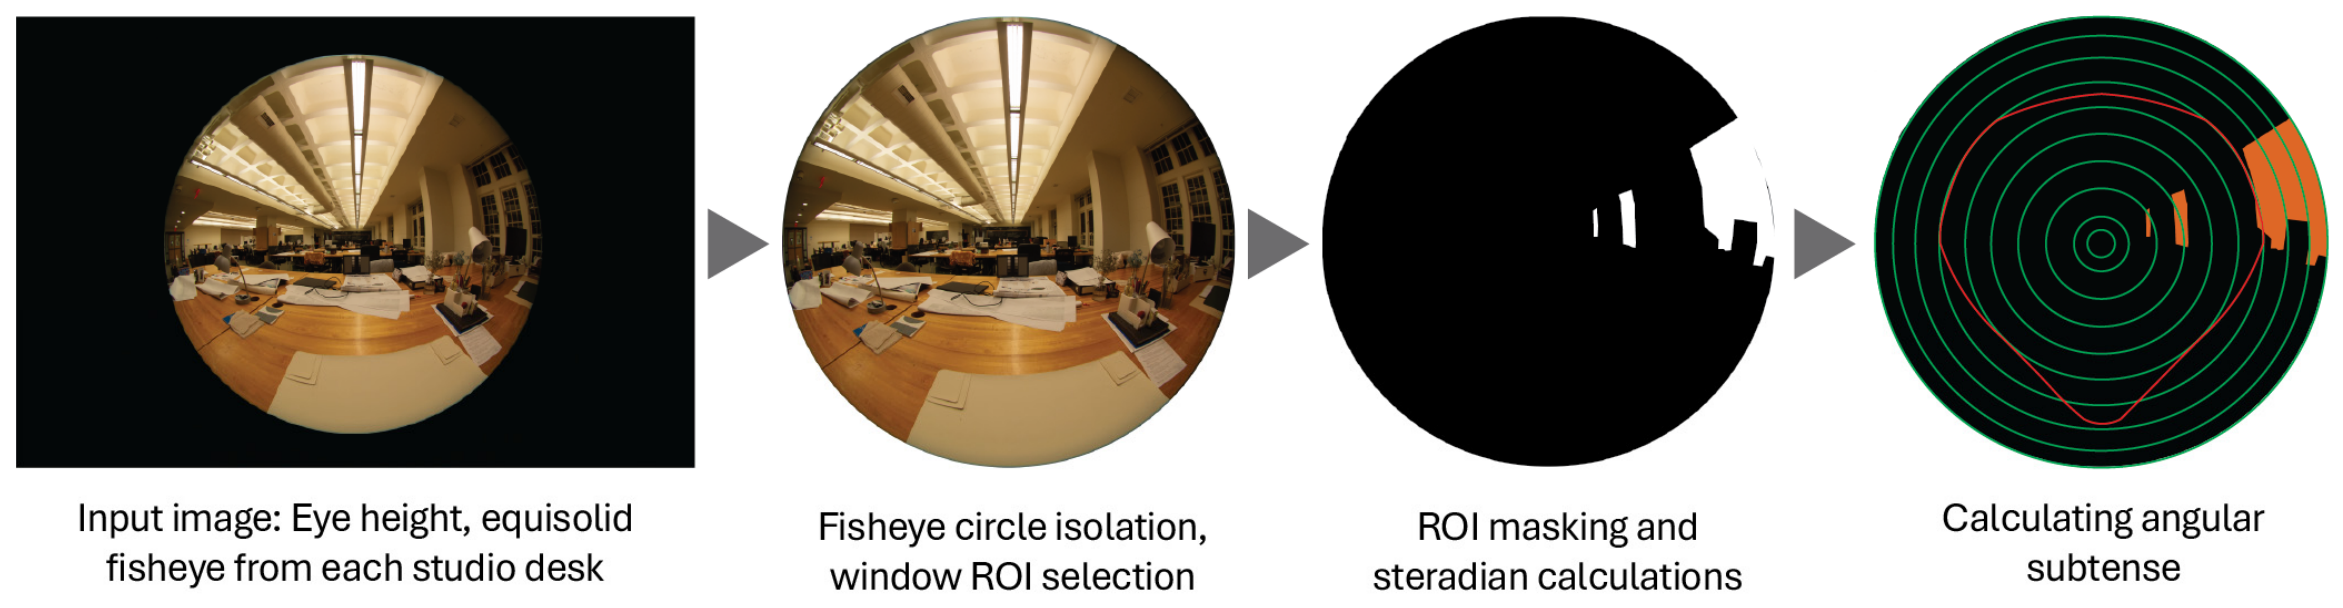
View access metrics showed considerable variability across student desks. Visible window steradians (VWS) ranged from 0.00 to 0.99 (
M = 0.16,
SD = 0.21,
Mdn = 0.06), reflecting limited direct window visibility for most desks. Window subtended angle (WSA) ranged from 0.00° to 232.33° (
M = 41.20°,
SD = 50.16°,
Mdn = 28.84°), showing substantial variability in the angular extent of window views. As expected, given the spatial organization of the studios, core studio desks had much lower VWS (
M = 0.02,
SD = 0.02) and WSA (
M = 16.12°,
SD = 35.26°) than façade studio workstations (VWS:
M = 0.30,
SD = 0.23; WSA:
M = 66.87°,
SD = 50.47°). When the WSA is classified according to the EN 17037 horizontal sight angle criterion, at the individual desk level, core studio workstations exhibited substantially lower compliance: 86.0% of core desks (37 of 43) failed to meet the minimum threshold (14°), with no core desk reaching the medium level (28°). By contrast, 50% of the façade studio desks reached the medium-level and 42.9% reached the high-level compliance. These desk-level classifications are more spatially resolved than zone-level angle assessments derived from simulation, as they directly reflect the perceptual conditions at each occupied desk (
Table 3).
3.2. Perceived View and Lighting Conditions
The lighting-survey response rates were 74.3% for seniors (Class of 2025; façade studio, n = 26) and 86.1% for juniors (Class of 2026; core studio, n = 31). The median respondent in each cohort reported spending 15–20 h per week in the studio. Twenty-seven juniors (87.1%) and 15 seniors (57.7%) reported spending at least 15 h per week there.
Daylight perceptions differed descriptively between cohorts. Among juniors in the core studio, 12 (38.7%) reported that no daylight reached their desk, 7 (22.6%) rated daylight as too little, and 11 (35.5%) rated it as slightly insufficient. Among seniors in the façade studio, 14 (53.8%) rated daylight as just right, 8 (30.8%) as slightly insufficient, and 4 (15.4%) as too little. Trees or vegetation were reported as visible by 24 seniors (92.3%) and 18 juniors (58.1%); the adjacent plaza by 18 seniors (69.2%) and 4 juniors (12.9%); and moving elements such as people or vehicles by 13 seniors (50.0%) and 4 juniors (12.9%). Fourteen juniors (45.2%) reported that they could not see outside from their desk.
Most respondents in both cohorts agreed or strongly agreed that window views provide mental refreshment (seniors: 25 of 26, 96.2%; juniors: 28 of 31, 90.3%). Reported use differed descriptively. Among seniors, 61.5% used views for mental breaks and 57.7% used them to rest their eyes from close work at least half of the time. Among juniors who reported some outdoor view access (n = 17), 64.7% reported never using views for mental breaks and 52.9% reported never using them to rest their eyes. Use of views to check weather or time was more similar: 21 seniors (80.8%) and 12 juniors with some view access (70.6%) reported doing so at least half of the time.
Perceptions of personal control over electric lighting were also generally negative. Twenty-two seniors (84.6%) and 20 juniors (64.5%) rated personal control as poor or below average. Although this finding cannot be correlated with the lighting survey due to the year gap, 52.1% of students (n = 37) included electric light quality improvements in their sketches.
3.3. Descriptive Patterns in Environmental Modification Preferences
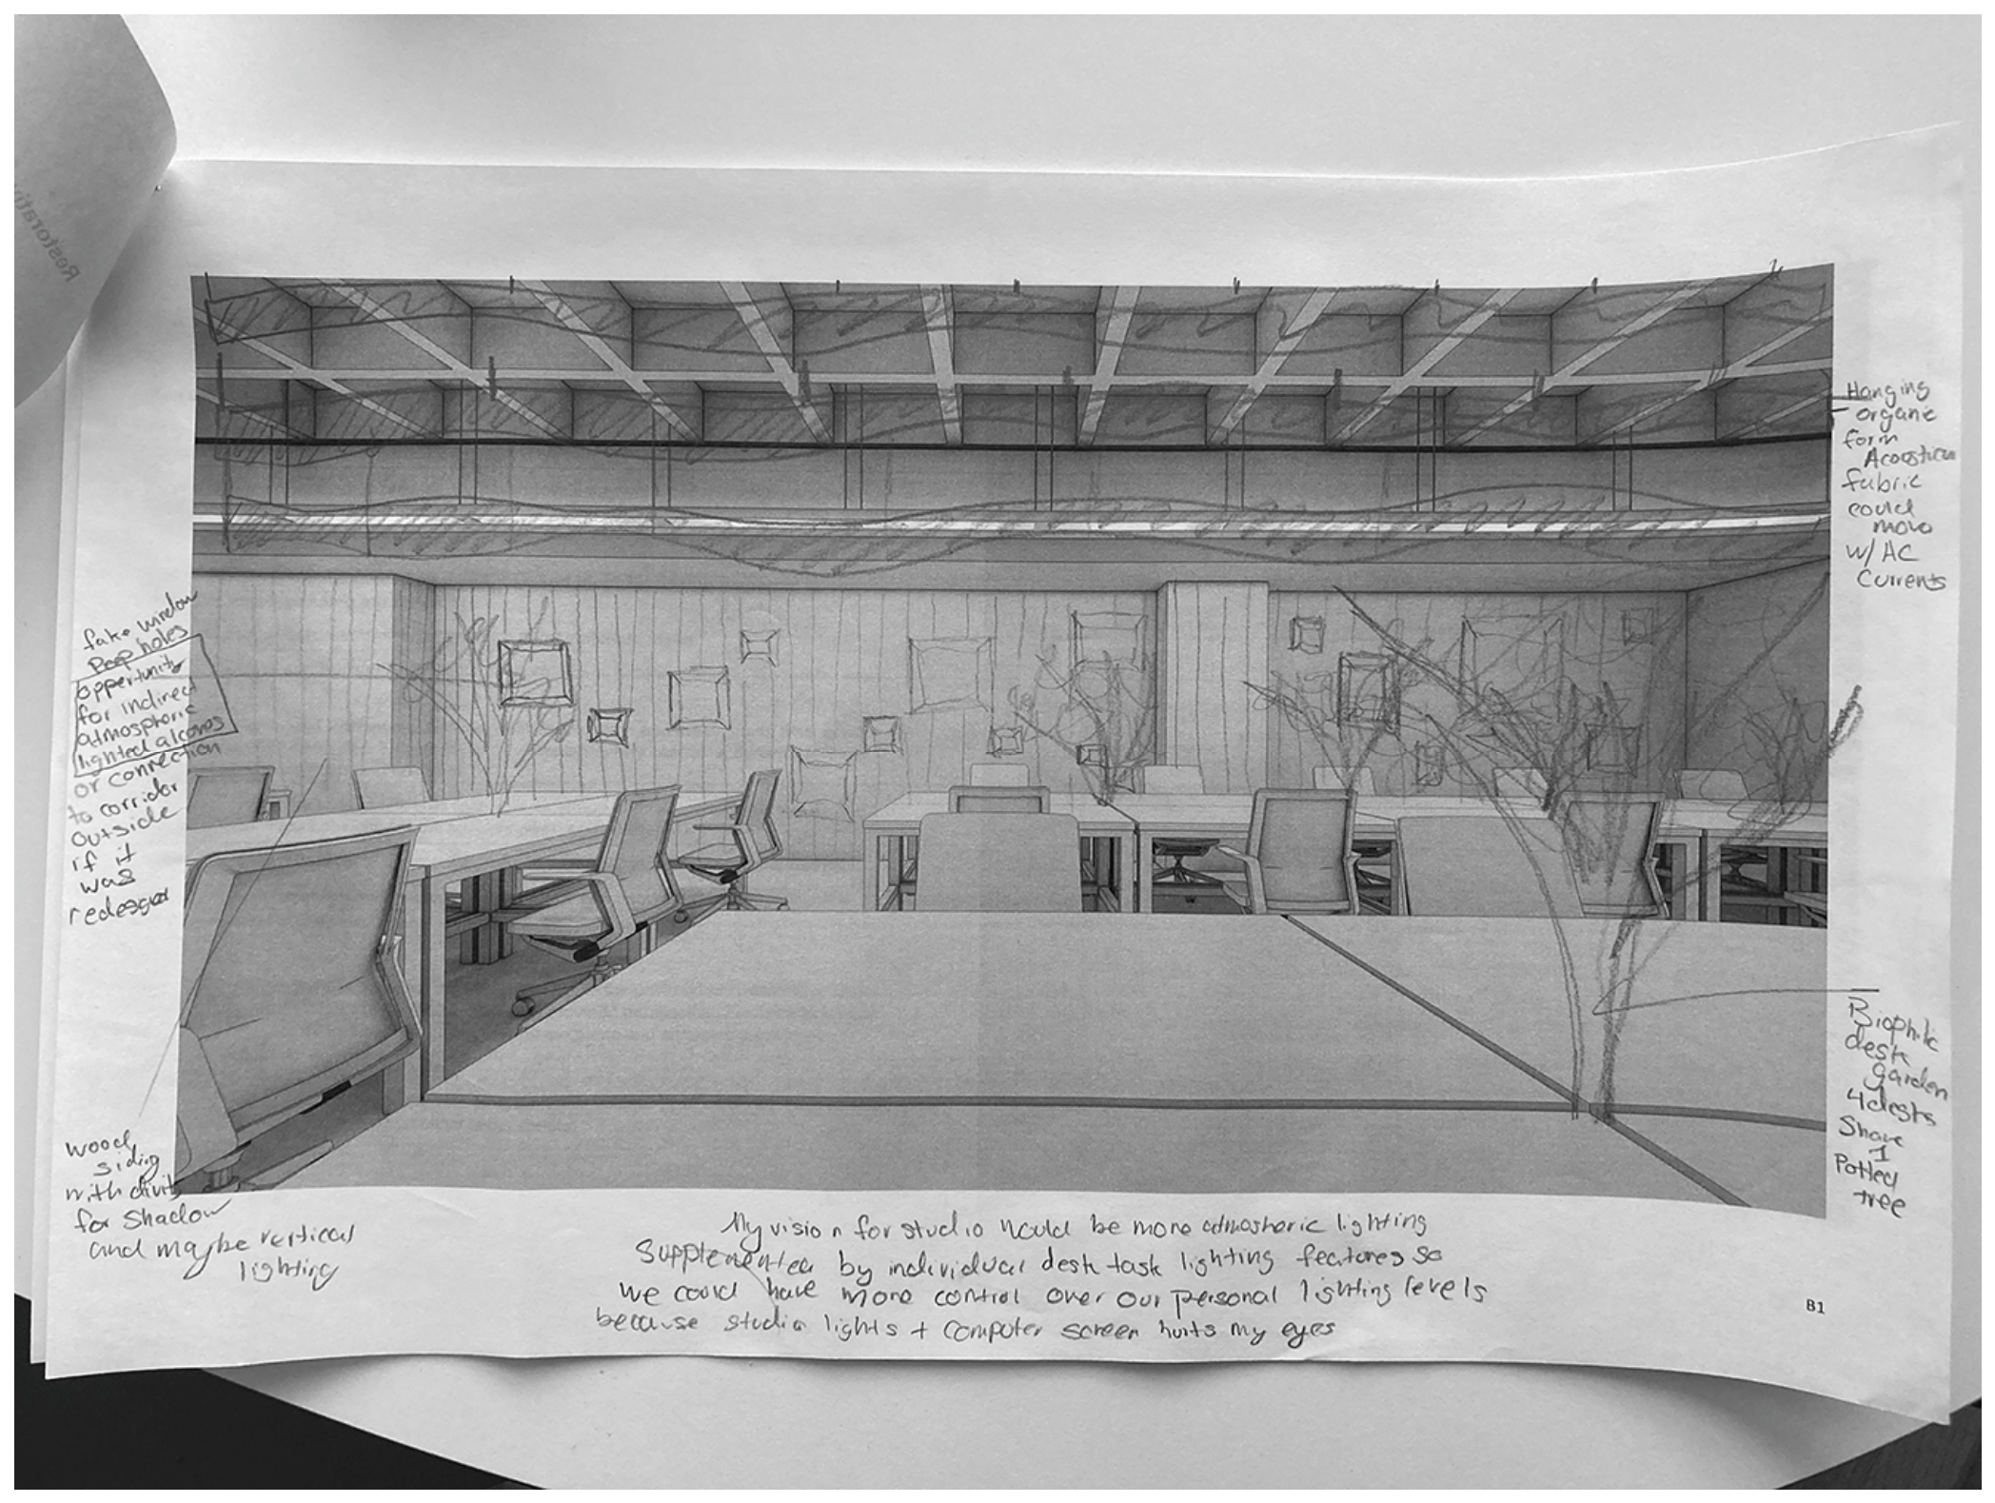
Table 4 presents the percentage of students who included each environmental modification category in their sketches, organized by academic year and studio location. Across the 71 sketches, Plants was the most frequent modification category (73.2%,
n = 52), followed by Natural Shapes/Patterns (52.1%,
n = 37) and Electric Light Quality (52.1%,
n = 37). Technology (43.7%,
n = 31), Color (39.4%,
n = 28), and Natural Light/Outdoor Connection (35.2%,
n = 25) were also common. Water (5.6%,
n = 4), Identity/Culture (9.9%,
n = 7), and Collaborative/Social Space (11.3%,
n = 8) were least frequent.
3.4. Patterns by Academic Year
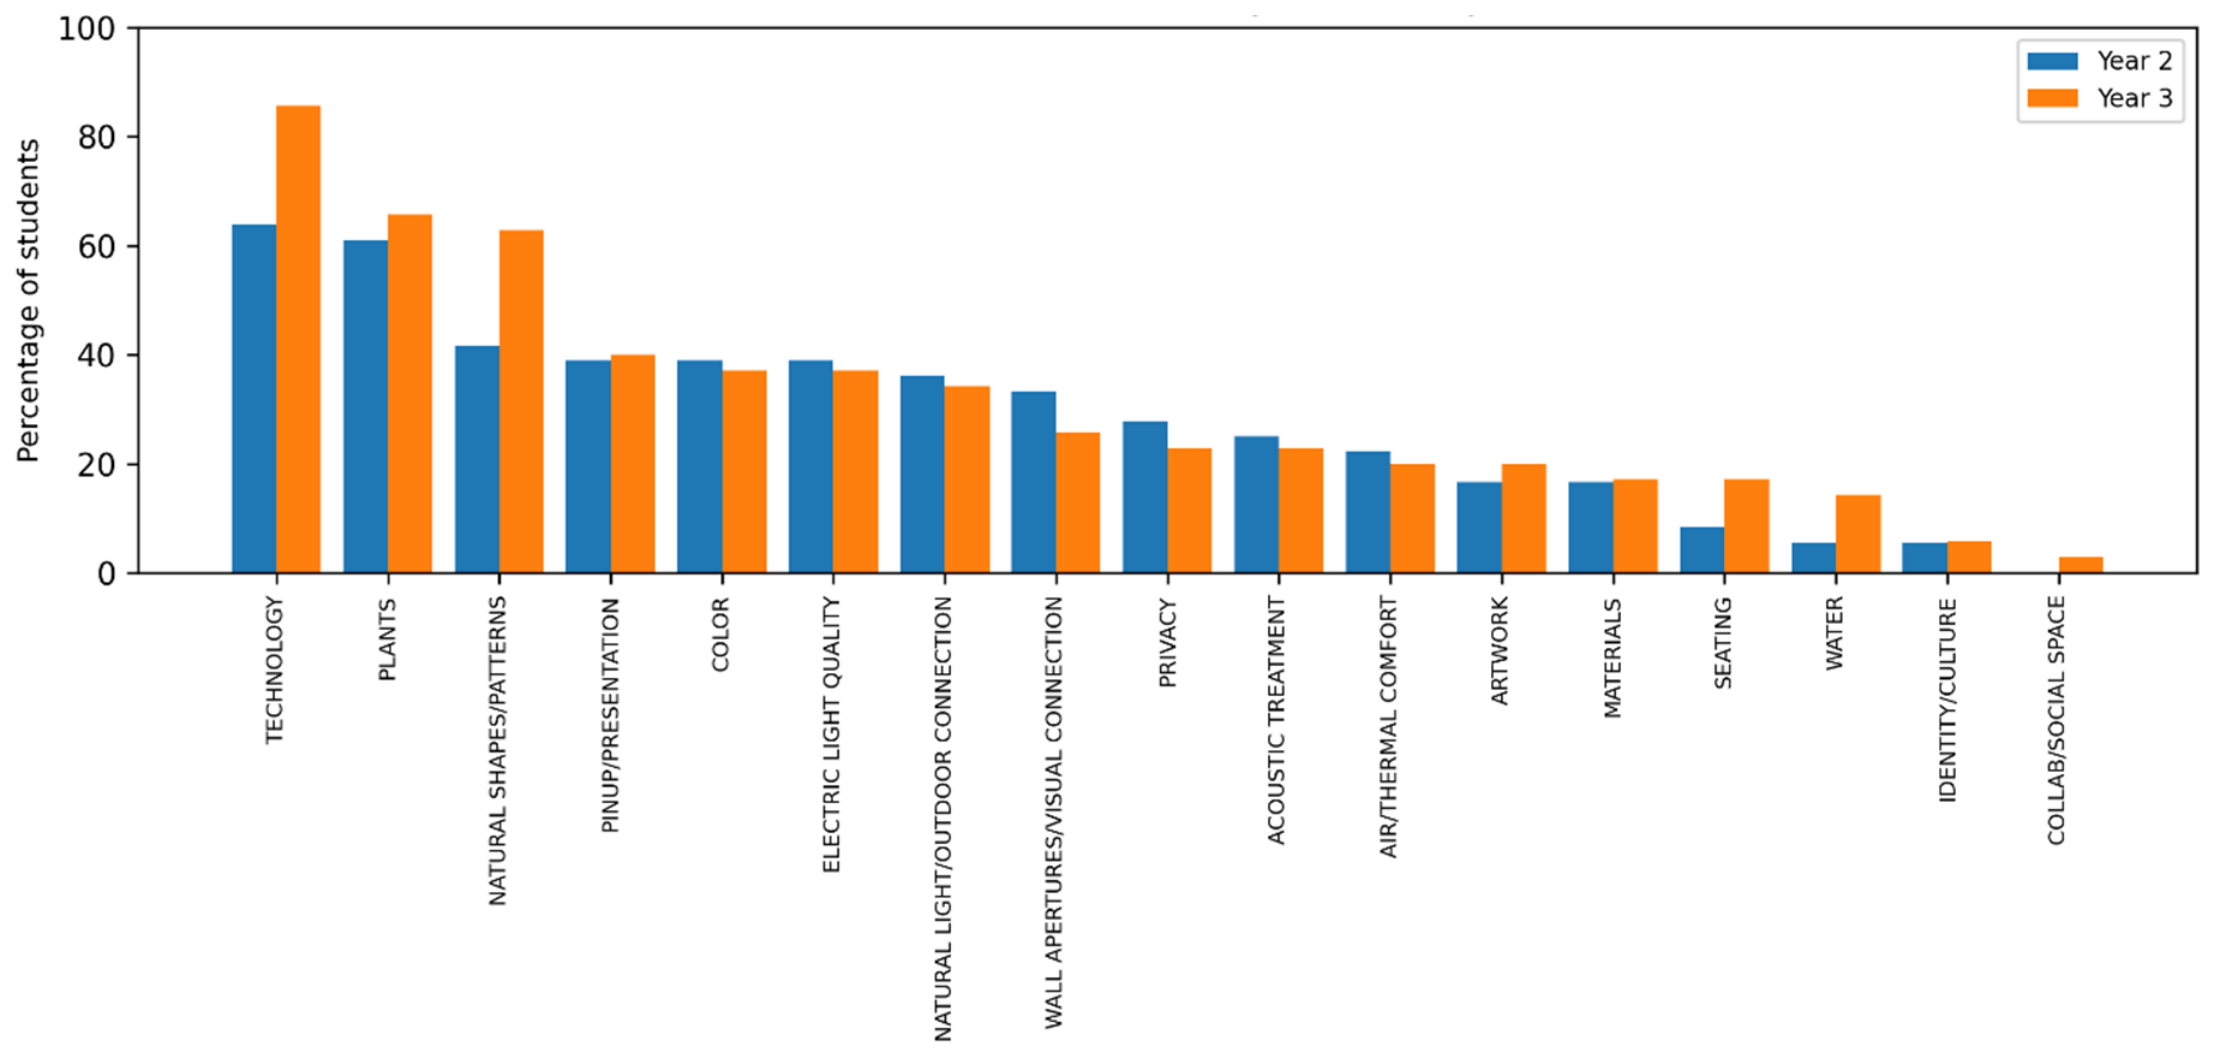
Descriptive patterns suggested notable differences between sophomores and juniors across several modification categories (
Figure 7). Juniors more often included Plants (85.7% vs. 61.1%), Electric Light Quality (65.7% vs. 38.9%), Natural Shapes/Patterns (62.9% vs. 41.7%), Materials (37.1% vs. 16.7%), and Collaborative/Social Space (22.9% vs. 0.0%). Sophomores more often included Technology (63.9% vs. 22.9%), Air/Thermal Comfort (22.2% vs. 2.9%), and Pinup/Presentation (38.9% vs. 25.7%). Artwork, Water, and Color showed little descriptive difference by academic year.
3.5. Patterns by Studio Location
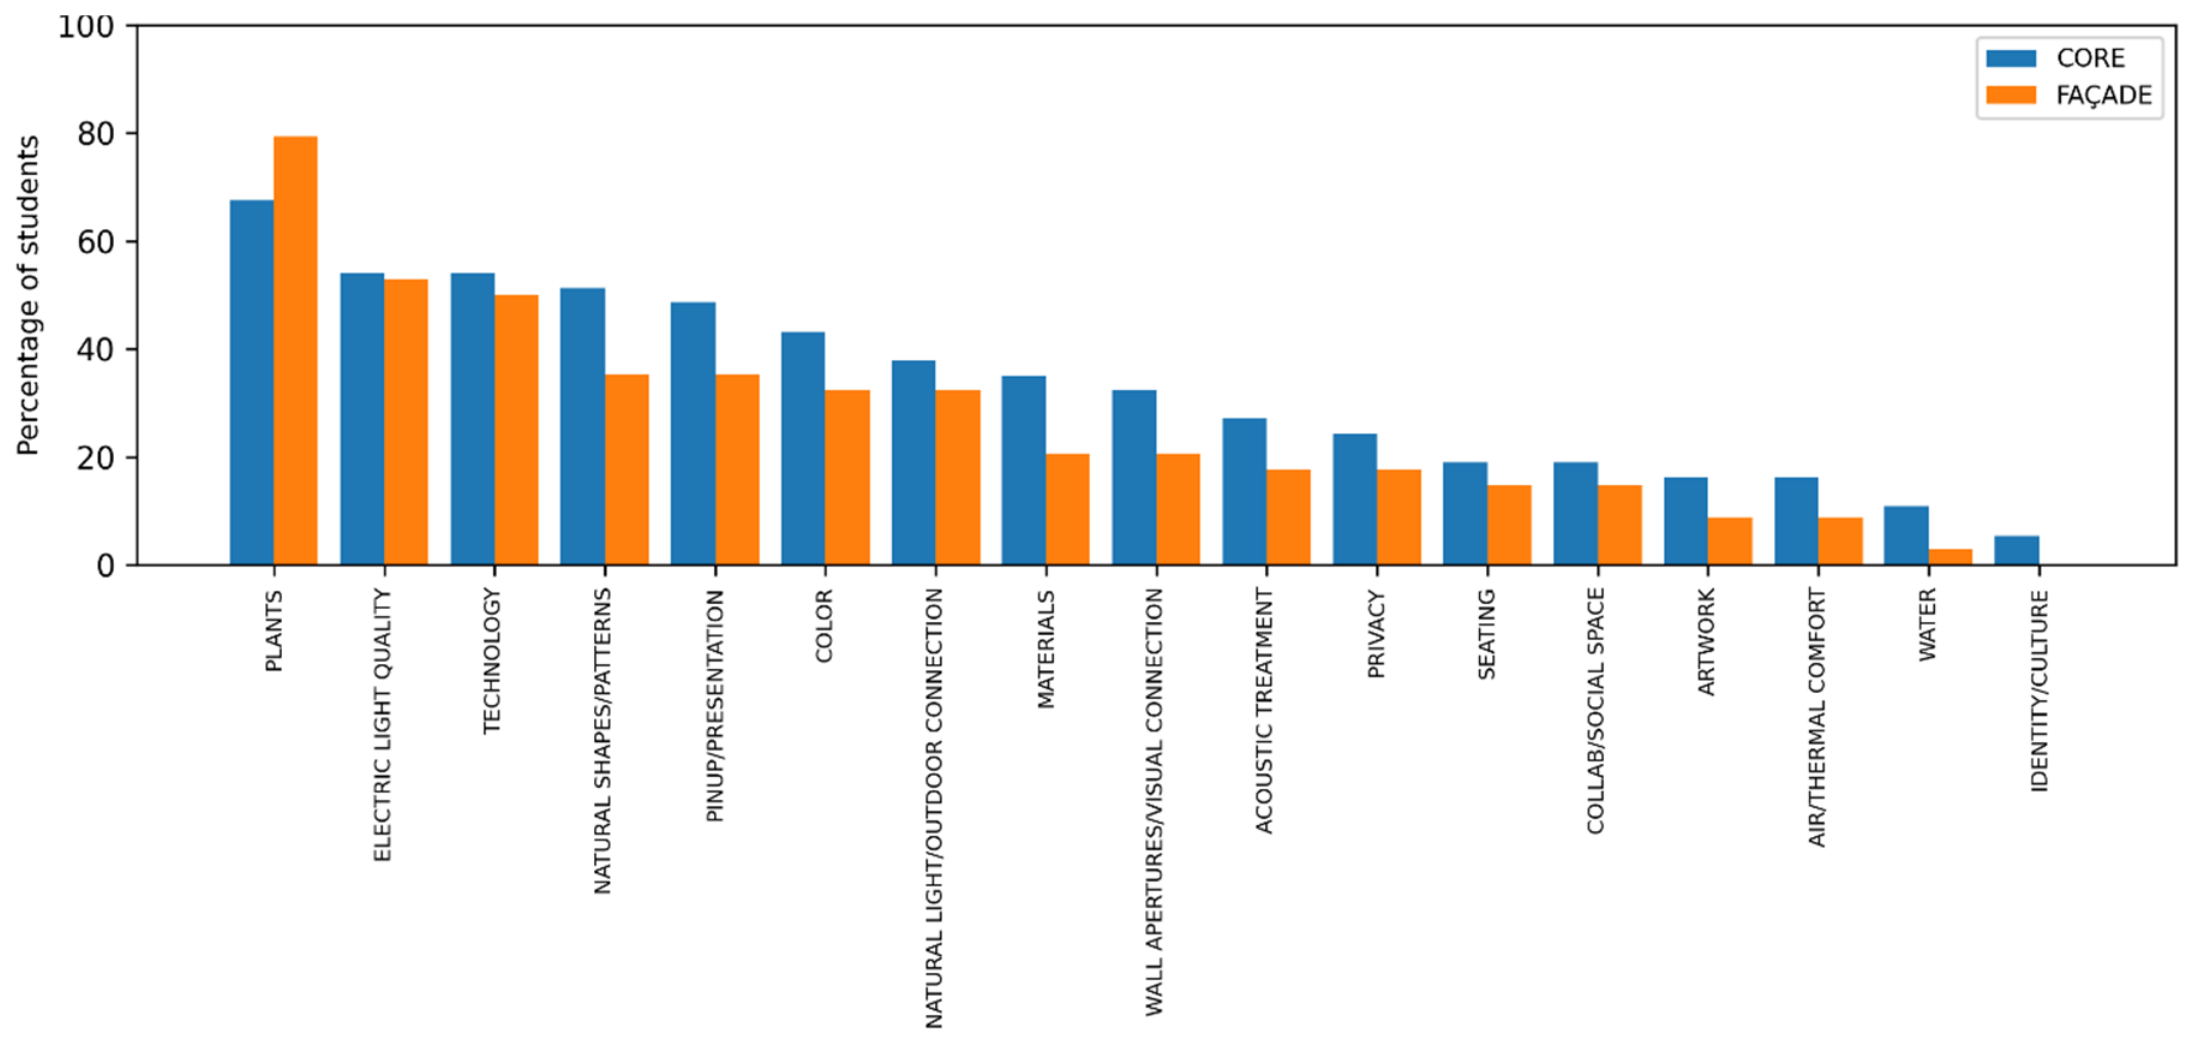
Studio location was associated with different patterns for several modification categories (
Figure 8). Core-zone students more often included Pinup/Presentation (48.6% vs. 14.7%), Materials (35.1% vs. 17.6%), Technology (54.1% vs. 32.4%), Collaborative/Social Space (18.9% vs. 2.9%), and Water (10.8% vs. 0.0%). Façade-zone students more often included Plants (79.4% vs. 67.6%), Acoustic Treatment (35.3% vs. 27.0%), and Identity/Culture (14.7% vs. 5.4%). Natural Shapes/Patterns was similar across locations (52.9% façade; 51.4% core). These percentages describe the sample and are interpreted separately from the multiplicity-adjusted regression results.
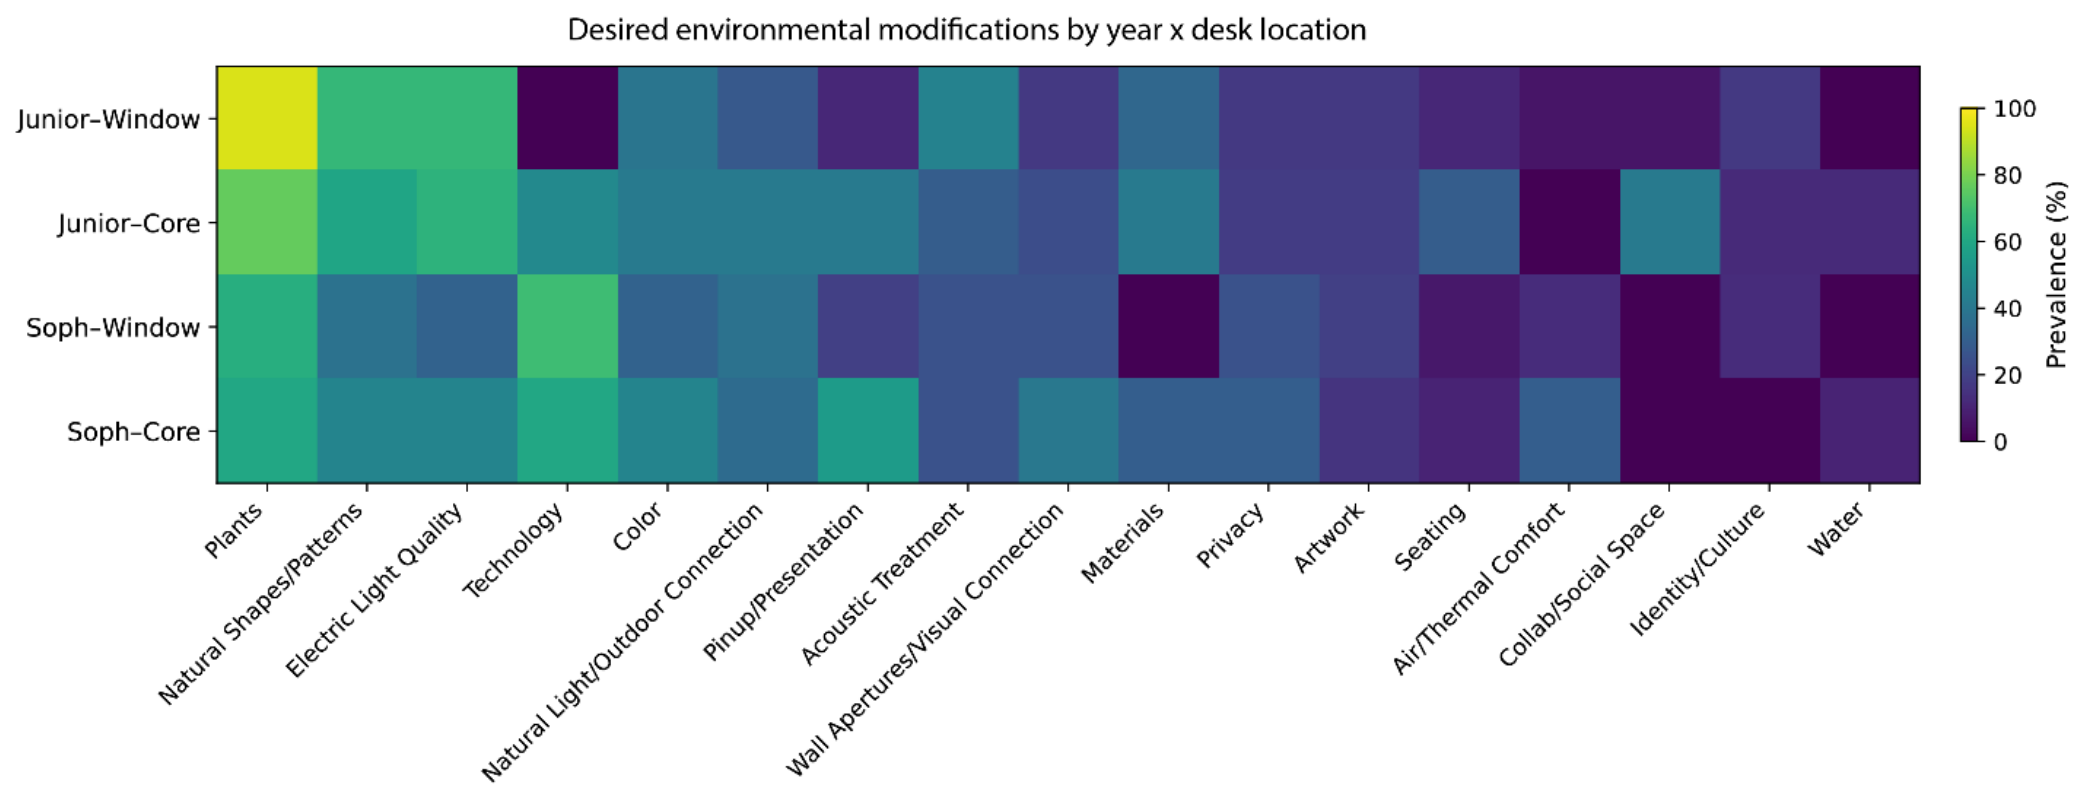
Figure 9 visualizes the prevalence of environmental modification by year and studio location.
3.6. Predictor Diagnostics
Both academic-year groups were represented in both studio zones (sophomores: 20 core, 16 façade; juniors: 17 core, 18 façade), and academic year was not associated with studio location, χ2(1, n = 71) = 0.35, p = 0.556, φ = 0.07. Academic year was likewise unrelated to the view metrics (VWS: r = 0.10, p = 0.430; WSA: r = −0.10, p = 0.414). Studio location, by contrast, was correlated with VWS (r = 0.65, p < 0.001) and WSA (r = 0.50, p < 0.001), and the two view metrics were moderately correlated (r = 0.40, p < 0.001). Variance-inflation factors were 1.04 for academic year, 1.98 for studio location, 1.78 for VWS, and 1.38 for WSA; the maximum condition index of the standardized predictor matrix was 2.47. These diagnostics indicate shared spatial variance between location and view access, concentrated in a restricted within-core range of VWS (variance = 0.0004 sr2 in the core zone vs. 0.0447 sr2 on the façade), rather than problematic multicollinearity. A view coefficient in the full model therefore estimates a conditional, primarily within-zone association. The complementary specification without studio location assessed whether this shared variance altered the view-access conclusions.
3.7. Overall Model Fit
Table 5 summarizes model fit for the 15 estimable categories. After BH correction across the 15 omnibus likelihood-ratio tests, two models remained below the false-discovery threshold: Technology, χ
2(4) = 16.69,
p = 0.002,
q = 0.033, Nagelkerke
R2 = 0.28, and Plants, χ
2(4) = 14.36,
p = 0.006,
q = 0.047, Nagelkerke
R2 = 0.27. The unadjusted omnibus tests for Pinup/Presentation (
p = 0.011,
q = 0.055), Air/Thermal Comfort (
p = 0.021,
q = 0.079), and Materials (
p = 0.039,
q = 0.117) did not remain below
q = 0.05; all remaining omnibus
q values were 0.296 or greater. Water and Collaborative/Social Space are reported descriptively only in
Table 4 because sparse cells produced quasi-complete separation and unstable estimates.
3.8. Academic Year Associations
After BH correction across the 15 academic-year coefficients, only the Technology association remained below q = 0.05: compared with sophomores, juniors had lower odds of including technology modifications, OR = 0.17, 95% CI [0.06, 0.50], p = 0.001, q = 0.021. The unadjusted year coefficients for Plants (OR = 4.72, 95% CI [1.41, 15.88], p = 0.012, q = 0.091), Electric Light Quality (OR = 3.14, 95% CI [1.16, 8.48], p = 0.024, q = 0.100), Materials (OR = 4.05, 95% CI [1.17, 13.95], p = 0.027, q = 0.100), and Air/Thermal Comfort (OR = 0.10, 95% CI [0.01, 0.97], p = 0.047, q = 0.140) did not remain below the threshold and are treated as hypothesis-generating cohort contrasts rather than independently supported associations.
3.9. Studio Location Associations
No studio-location coefficient remained below
q = 0.05 after BH correction across the 15 location tests. The smallest unadjusted value was observed for Materials, OR = 0.14, 95% CI [0.02, 0.80],
p = 0.027,
q = 0.407. The Artwork estimate was highly imprecise (OR = 11.08, 95% CI [0.87, 141.33],
p = 0.064,
q = 0.481) and is not interpreted as evidence of an association. The location-specific percentages in
Table 4 are therefore retained as descriptive patterns, and no category is described as having an independently supported studio-location association.
3.10. View Access Associations and Complementary Analysis
No VWS or WSA coefficient remained below q = 0.05 after correction within the respective 15-test predictor families (VWS: all q ≥ 0.592; WSA: all q ≥ 0.516). The WSA coefficient for Plants (OR = 1.03 per degree, 95% CI [1.00, 1.07], p = 0.087, q = 0.516) was the smallest view-metric value. These results indicate that the geometric view variables were not independently associated with sketch-category inclusion at the corrected threshold in this sample. Yet they do not suggest that window views are unimportant for restoration or well-being.
A complementary analysis omitted studio location while retaining academic year, VWS, and WSA. After BH correction across the 15 omnibus tests in this specification, three models remained below
q = 0.05: Technology, χ
2(3) = 16.29,
p < 0.001,
q = 0.015, Nagelkerke
R2 = 0.28; Plants, χ
2(3) = 13.84,
p = 0.003,
q = 0.023; and Pinup/Presentation, χ
2(3) = 12.35,
p = 0.006,
q = 0.031. At the coefficient level, the Technology academic-year association again remained below
q = 0.05 (OR = 0.17, 95% CI [0.06, 0.49],
p = 0.001,
q = 0.018), and no VWS or WSA coefficient survived its family correction (VWS
q ≥ 0.246; WSA
q ≥ 0.641). The strongest uncorrected view association was a negative VWS coefficient for Pinup/Presentation (OR = 0.39 per 0.1 sr, 95% CI [0.18, 0.84],
p = 0.016,
q = 0.246), mirroring the descriptive core-façade contrast for that category in
Table 4. Because studio location and desk-level view geometry divide shared spatial variance, the pattern cannot be attributed uniquely to either variable. The absence of FDR-supported view coefficients was unchanged when studio location was omitted, and the Technology and Plants model-level results were robust to the specification change. See
Supplemental Table S1 for coefficient estimates for the 15 models, and
Supplemental Table S2 for complementary analysis without studio location.
4. Discussion
This exploratory study examined the environmental modification categories that design students represented from their actual desk positions in response to a restoration-oriented studio prompt and whether category occurrence was associated with academic year, studio location, and desk-level view geometry. Three findings are most consequential. First, Plants, Natural Shapes/Patterns, and Electric Light Quality were the most frequently represented categories, with Technology, Color, and Natural Light/Outdoor Connection also commonly included. Second, after controlling the false discovery rate, Technology and Plants retained model-level support, whereas the only coefficient-level result that remained supported was the lower likelihood of Technology modifications among juniors. Third, geometric window-view access varied noticeably across desks as expected, but neither visible window steradians nor window subtended angle retained an association with sketch-category inclusion, including in the complementary analysis without studio location. The survey provided cohort-level context regarding lighting conditions, view perceptions, and reported view use but was not used to explain individual sketches. Because the sketches were analyzed at the category level, the findings concern category prevalence and statistical association rather than the relative scale, prominence, priority, or intended meaning of elements within individual drawings. They therefore identify contextualized environmental preferences and generate hypotheses rather than demonstrate restorative effects.
The breadth of the category distribution is itself informative. Plants and natural forms have a direct conceptual relationship to biophilic design and restorative-environment research, whereas lighting, thermal comfort, privacy, seating, and acoustic modifications concern sensory comfort and environmental control. Technology, pin-up and presentation areas, and collaborative space may be more closely connected to task performance, studio production, or educational requirements. The sketches therefore indicate that students responded to the idea of a restorative studio through a combination of nature-related enrichment, environmental comfort, control, and functional support. This does not mean that all 17 categories are equally or inherently restorative. Rather, it suggests that, in a setting characterized by long occupancy and sustained visual and cognitive work, students may not sharply separate well-being from the environmental conditions that make ongoing work more manageable. Glare, inadequate lighting control, noise, thermal discomfort, or insufficient equipment may contribute to strain even though reducing those problems is not equivalent to demonstrating psychological restoration [
21,
22,
23,
24,
25]. The findings thus broaden the design problem without collapsing restoration, comfort, productivity, and learning support into a single construct.
The prominence of Plants and Natural Shapes/Patterns is consistent with literature connecting nature-related environmental qualities with restoration and well-being [
3,
7,
19,
29]. In addition, many frequently sketched categories, i.e., plants, natural forms, lighting changes, technology, and color, could be incorporated within the setting in which studio work already occurs rather than requiring a separate restorative space. At the category level, this pattern directs attention to environmental qualities that are available during ongoing work and suggests that evaluations of supportive studio environments should consider ordinary work settings alongside dedicated break or retreat spaces. It does not establish that students intended each depicted feature to produce restoration or that the proposed changes would have restorative effects. The Plants model remained supported after false-discovery-rate correction, but no single academic-year, studio-location, or view-access coefficient accounted for that result. Plant inclusion should therefore be understood as a prevalent category displaying a multivariable pattern within this sample, rather than as a preference attributable to one measured cohort or spatial characteristic. Its prevalence warrants more focused investigation using samples and measures capable of distinguishing the amount, placement, accessibility, maintenance, and use of vegetation.
The clearest coefficient-level finding concerned Technology. Juniors were less likely than sophomores to include technology-related modifications; descriptively, 22.9% of juniors included this category compared with 63.9% of sophomores. This contrast may point to developmental progression from functional concerns toward more atmospheric, material, or biophilic concerns. Academic year in this setting also represents different curricular stages, assignment demands, equipment needs, accumulated familiarity with the studio, and potentially section-specific practices and cultures. Technology may have been more important to sophomores because of their immediate workflow or resource requirements, whereas juniors may have regarded existing equipment as sufficient or prioritized other environmental changes. The finding therefore identifies a robust cohort contrast within this setting but does not establish its underlying mechanism. The remaining unadjusted academic-year differences did not remain supported after correction and are better treated as hypotheses for longitudinal research that follows the same students as their coursework, design practices, and studio environments change.
View access presented a different pattern. The desk-level measures documented substantial spatial inequality in visible window area and horizontal view extent, yet neither geometric view measure was associated with sketch-category inclusion after correction. Because studio location shared variance with view geometry, the complementary specification without studio location provided an important check and yielded the same conclusion for the view coefficients. This reduces concern that studio location simply absorbed an otherwise detectable view-access association, while not demonstrating that windows or views are unimportant. Visible window steradians and window subtended angle quantify geometric extent, but they do not capture view content, depth, vegetation, sky, movement, visual interest, temporary obstruction during actual work, or perceived restorativeness. A desk may have measurable window exposure without offering a desirable view. Conversely, even a restricted view may support orientation, time awareness, or brief visual relief. The analysis therefore indicates that geometric access alone did not explain which modification categories students included. The specific contribution of windows or exterior views to restoration and well-being remains to be examined.
The lighting survey offers a compatible but limited context for this interpretation. Both cohorts generally valued window views for mental refreshment, while the cohort with greater view access reported more frequent use of views for mental breaks and resting the eyes from close work. Perceptions of personal electric-lighting control were also generally unfavorable, which is contextually consistent with the high descriptive frequency of Electric Light Quality modifications in the sketches. The survey was administered one year later; participants had progressed academically, environmental exposure and awareness may have changed, and responses were not matched to individual sketches. Future studies should collect these measures concurrently and correlate them at the individual level.
Even though no studio location coefficient remained supported after correction, the findings still suggest that students with limited exterior views may redirect attention toward modifiable interior qualities. Section-based differences, immediate task demands, cohort characteristics, and other features of the existing studio spaces provide plausible explanations for the descriptive differences. Selective compensation can remain a useful proposition for future research, but testing it would require a research design capable of distinguishing environmental scarcity from cohort and curricular influences, for example, by following students as they move between studio settings, comparing matched studios with different view conditions, or prospectively varying access to interior and exterior environmental resources. In the present study, environmental-modification categories varied within a spatially unequal studio context, while the measured studio-location and view variables did not independently account for those differences.
Affordance theory nevertheless remains useful as an interpretive framework. A window may offer the possibility of looking outward, a task light the possibility of localized adjustment, and a divider the possibility of visual or spatial separation. Whether those possibilities are perceived, accessible, useful, or supportive depends on the relationship among environmental configuration, user position, task demands, and opportunities for control [
10,
12]. The desk-specific prompt and view measures capture part of this situated relationship by linking students’ proposed modifications to their actual work positions. The present study did not, however, directly observe affordance perception or use, nor did it measure restoration resulting from any environmental feature. Its theoretical contribution is therefore not to demonstrate restorative affordances as outcomes, but to show how a relational perspective can inform the study of environmental modification preferences in a setting where position, access, and environmental control vary within the same learning environment.
The findings support a layered approach to the future design and evaluation of studio environments. Student preferences point toward desk-level opportunities for control, such as task lighting and localized adjustment, shared interior qualities, such as planting, color, materials, acoustic treatment, and flexible support spaces, and architectural conditions, including daylight, exterior views, and visual connection. This layered approach is consistent with design guidance emphasizing nature-related features, sensory quality, and environmental control [
13,
29,
34]. The effectiveness of these options should be evaluated prospectively through studies that combine environmental measurement, individually linked perceptions and behaviors, and direct measures of restorative outcomes. Within these limits, the study contributes evidence that students’ conceptions of a more supportive studio extend beyond a single environmental feature and encompass the broader everyday ecology of sustained design work.
5. Practical Implications and Sustainable Development Goals
The study provides a practical starting point for low-risk studio improvements, but findings should be treated as candidates for testing rather than proven restorative interventions. Plants, nature-related patterns, improved electric-light quality and user control, and technology support were among the most common proposals. Design programs and facilities teams could use short, reversible pilot interventions, such as task-light controls, movable planting, improved display and charging infrastructure, or visually richer interior surfaces, and evaluate them through post-occupancy measures that include comfort, use, attention, stress, and perceived restoration.
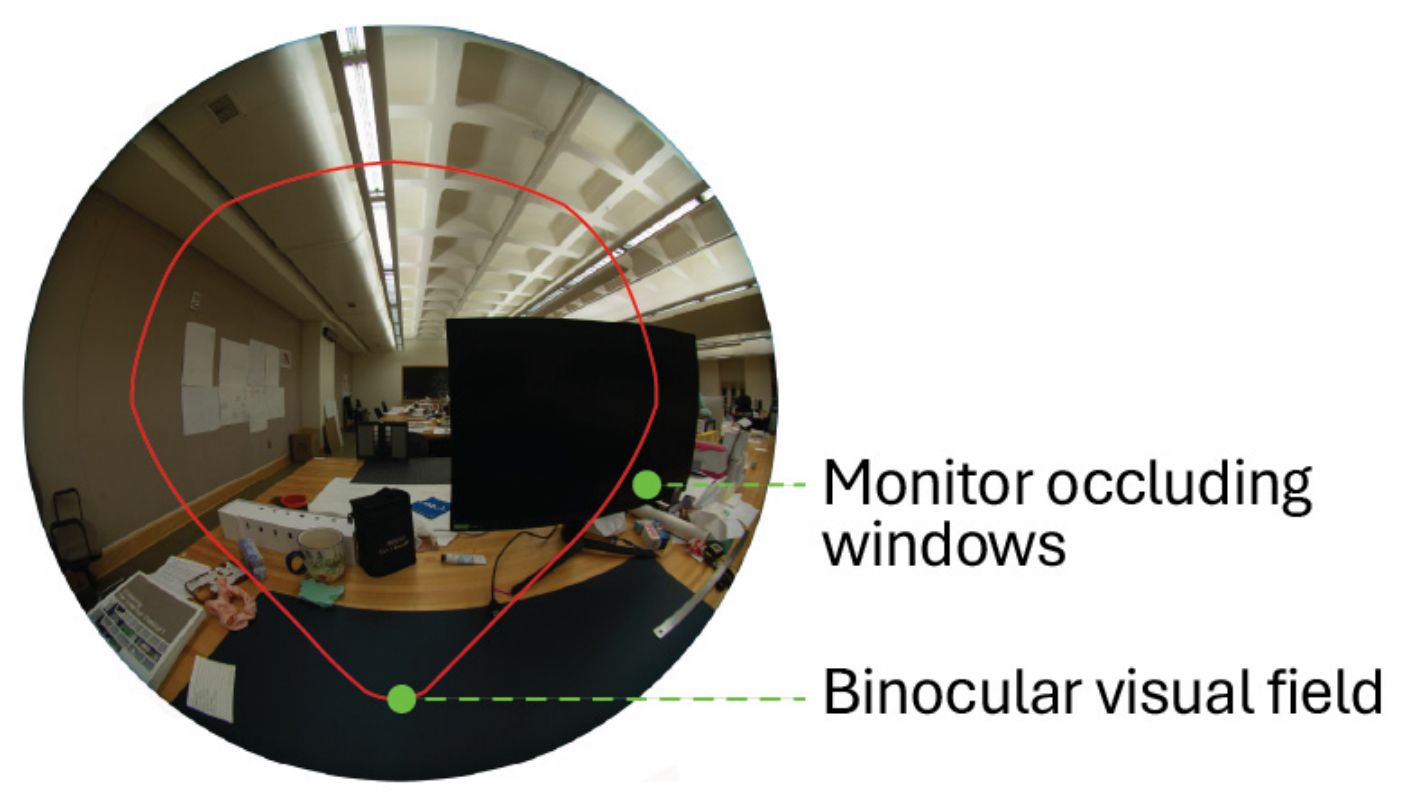
The desk-specific method also highlights the value of evaluating environmental access from occupied work positions rather than relying only on room-level provision. Designers should examine whether outward views remain visible above monitors and stored materials and whether workstation orientation permits brief glances outside, since these cannot be assessed through room-level simulations alone. Where exterior views cannot be equitably provided, interior strategies should be considered as complementary environmental resources rather than as proven substitutes for outdoor connection.
This study has indirect relevance to Sustainable Development Goal 3, Good Health and Well-Being, and Sustainable Development Goal 4, Quality Education, through its examination of environmental conditions that students identify as supportive within an intensive learning setting [
40]. It also draws attention to the equitable distribution of environmental resources, including daylight and exterior-view access, within a shared educational environment. The study did not measure SDG indicators or evaluate whether the proposed modifications improve health or educational outcomes. Its contribution is therefore limited to identifying student-informed priorities that may guide the future design and evaluation of healthier and more supportive learning environments.
6. Limitations and Future Research Directions
This study has several limitations that should be considered when interpreting the findings. First, the study was conducted in a single interior design program with a modest sketch sample. The results may reflect characteristics of this program, its curriculum, studio culture, building, or student population and should not be generalized to other design disciplines or learning environments without replication. The observational design also prevents causal interpretation. Although both academic-year groups were represented in the core and façade zones and academic year was only weakly related to studio location, year, curricular stage, accumulated studio experience, cohort practices, schedules, and environmental exposure could not be experimentally separated.
Second, statistical power and model stability were limited by the number of participants and the frequency of several sketch categories. Water and Collaborative/Social Space were retained in the descriptive results but excluded from inferential interpretation because sparse cells produced quasi-complete separation. Benjamini–Hochberg adjustment was applied to the remaining 15 omnibus tests and separately within each predictor family to reduce false-positive interpretation. This correction appropriately narrowed the inferential findings but also reduced power to identify small associations. Unadjusted results that did not remain below the false-discovery threshold are reported for transparency and should be treated as hypotheses for future research rather than as independently supported effects.
Third, the sketch analysis was intentionally conducted at the category-occurrence level. Binary coding enabled consistent comparison across students and supported the regression analyses, but it compressed visual and textual information contained in the drawings. The analysis did not distinguish, for example, between a small desk-level addition and a room-scale intervention, nor did it preserve variation in prominence, spatial arrangement, co-occurrence, visual hierarchy, or written rationale. Accordingly, the results identify whether a category was represented, not its intensity, priority, or meaning within an individual sketch. A rigorous visual and annotation-based qualitative analysis would require distinct research questions, a multimodal analytic framework, and separate procedures for establishing interpretive trustworthiness. Such an analysis is beyond the scope of the present category-level study but represents a valuable direction for a dedicated investigation of the sketch dataset. The restoration-oriented prompt and examples may also have increased the frequency of nature-related or environmental-control features.
Fourth, desk-level VWS and WSA captured geometric access to window openings but not the full experiential quality of a view. Future research should combine geometric measures with image-based classification of view content, assessments of visual quality and usability, and concurrent reports of how students use views during studio work.
Fifth, the lighting survey and sketching exercise were not administered concurrently. Future studies should collect sketch, environmental, behavioral, and perceptual data during the same period and link them at the participant and workstation levels.
Finally, the study did not directly measure attentional recovery, stress reduction, well-being, or other restorative outcomes. Future research could test selected student-generated proposals, incorporating measures such as perceived restorativeness, affect, mental fatigue, visual discomfort, and physiological or behavioral indicators. Longitudinal research following the same students across different studios would be useful.