Article

Microplastics in Pristine Caves of the Classic Karst (NE Italy): A First Assessment of Contamination Levels


1
Department of Chemical and Pharmaceutical Sciences, University of Trieste, Via L. Giorgieri 1, 34127 Trieste, Italy
2
Società Adriatica di Speleologia, Via Domenico Rossetti, 59/a, 34141 Trieste, Italy
3
Department of Life Sciences, University of Trieste, via L. Giorgieri 10, 34127 Trieste, Italy
4
Consorzio Nazionale Interuniversitario per le Scienze del Mare (CoNISMa), Piazzale Flaminio, 9, 00196 Roma, Italy
5
Bioscience Research Center, Via Aurelia Vecchia, 32, 58015 Orbetello, Italy
6
Fédération Française d’Études et de Sports Sous-Marins, 24 Quai de Rive-Neuve, 13284 Marseille, France
*
Authors to whom correspondence should be addressed.
Deceased author.
Microplastics 2026, 5(1), 24; https://doi.org/10.3390/microplastics5010024
Submission received: 30 October 2025 / Revised: 4 December 2025 / Accepted: 15 January 2026 / Published: 3 February 2026

Abstract

Data on microplastic contamination in pristine caves are rare, thus limiting our understanding of its pervasiveness in intact underground ecosystems. Here, we quantified microplastics in sediments from two newly discovered, extremely remote caves (Maucci and Luftloch) and compared them with a frequently visited cave (Trebiciano), all three of which are hydraulically connected to the Reka/Timavo River in the Classic Karst (NE Italy). Sediment samples were collected along river-to-slope transects and analyzed for microplastics using density separation and μFT-IR spectroscopy. Average contamination levels were comparable across caves, ranging from 84.7 to 105.9 items kg−1 (dry weight). Fibers and fragments dominated, with similar polymer spectra across sites—polypropylene (PP, 29–42%), polyethylene (PE, 19–27%), and polyethylene terephthalate (PET, 33–46%). Microplastic abundance systematically increased with elevation, up to ~4–12× from river-proximal to high-bench sediments. Polymer-resolved trends reflected density-coupled, flood-driven sorting with low-density PP and PE accumulated on higher benches and denser PET depleted aloft, indicating slackwater retention at flood crests and re-entrainment of lower benches during recession. These findings suggest that indirect riverine inputs of microplastics outweigh direct human contamination and provide the first baseline for pristine Timavo caves—serving as reference sites for background microplastic levels in the Classic Karst and similar karst systems worldwide.

1. Introduction

Plastic production has soared from approximately 288 million tons in 2012 to more than 430 million tons in 2024 and comprises up to 80% of global anthropogenic waste [1]. Even if plastic production ceased today, the environmental concentration of plastic debris would increase for decades due to the long lifetime of plastic objects and the long-lasting degradation of plastic waste [2]. While macroplastics (items > 5 mm) represent the most evident outcome of plastic release in the environment, the more elusive form of pollution related to smaller particles, namely microplastics (particles ranging from 1 μm to 5 mm) and nanoplastics (particles smaller than 1 μm) [3,4,5,6], has raised wide concerns due to its pervasiveness. One major issue lies in the toxicity of plastic polymers and additives, which can include chemicals and heavy metals [7,8]. These small and tiny plastic particles not only persist in the environment, but can also enter the food chain, affecting both wildlife and human health [9,10,11]. Evidence suggests they may accumulate in lungs and digestive systems, potentially causing oxidative stress, neurodegenerative disorders, immune dysfunction, and altered gut microbiota [12,13]. Moreover, they can act as carriers for pollutants such as pesticides, persistent organic pollutants, and antibiotics, further amplifying their harmful impacts on ecosystems and human health [14,15,16].
Microplastics (MPs) have been detected in almost every habitat on Earth [17,18,19]. They are transported by winds, ocean currents, and rivers, spreading everywhere from open sea to remote islands and polar ice [20,21,22,23]. In terrestrial environments, rivers are crucial in transporting MPs, carrying these particles into the soil, groundwater, and underground systems such as aquifers and natural caves [24,25]. Karst aquifers and caves form through long-term dissolution of carbonate rocks by groundwater and are highly susceptible to contamination as fractures allow water to move rapidly underground [26,27,28]. Thin soil cover in karst regions offers little natural filtration, so that pollutants such as landfill leachates, sewage, and agricultural runoff can easily penetrate the subsurface [29]. Analogously, sinking rivers may act as direct vectors of MPs and other contaminants into aquifers and underground caves, extending the reach of plastic pollution to these apparently isolated environments [30,31,32].
Natural caves host fragile subterranean ecosystems with unique species [33,34]. They represent valuable natural laboratories for multidisciplinary research, require strict conservation due to their extreme vulnerability [35,36], and are essential for the water supply of local human populations [37,38,39]. Hence, quantifying MP pollution in these environments and understanding the role of the potential sources of contamination are crucial steps to implement effective management strategies to mitigate ecological impacts of MPs and ensure public health. To date, however, assessments of MP pollution in caves are sparse [40] and mostly focused on show caves, where the introduction of MPs can be predominantly attributed to the presence of infrastructures and tourism [41]. Very few attempts have been made to quantify MPs in truly pristine caves, thus limiting our comprehension of background levels of MP pollution in subterranean systems and the possible role of indirect sources of contamination over and beyond direct human frequentation [42,43].
In this study, we contributed to filling this gap by investigating MP contamination of sediments in two newly discovered caves from the Classic Karst (NE Italy), namely the Maucci cavern and the Luftloch cave, connected to the Timavo river. The river, located in the Classic Karst region (between NE Italy and Slovenia), originates on Mount Snežnik (Croatia), flows for 54 km aboveground before sinking into the karst, flowing underground for 34 km, and finally emerging on the Italian coast in the Gulf of Trieste (NE Adriatic Sea) [44,45]. Both caves, which belong to the complex underground flow of the Timavo River, had remained untouched by direct human activity since their discovery between 2022 and 2024, and offered a unique opportunity to establish baseline MP levels in cave sediments. Specifically, we (i) quantified MPs in cave sediments in the two pristine caves; (ii) analyzed MPs in sediments along a river-to-slope gradient, from areas close to the water flow to areas less affected by flooding, to understand whether seasonal hydrological variations influence MP deposition; (iii) compared MP contamination between the two pristine caves and a third cave in the same region connected to the Timavo River underground system, which has a long history of human frequentation.

2. Materials and Methods

2.1. Study Area

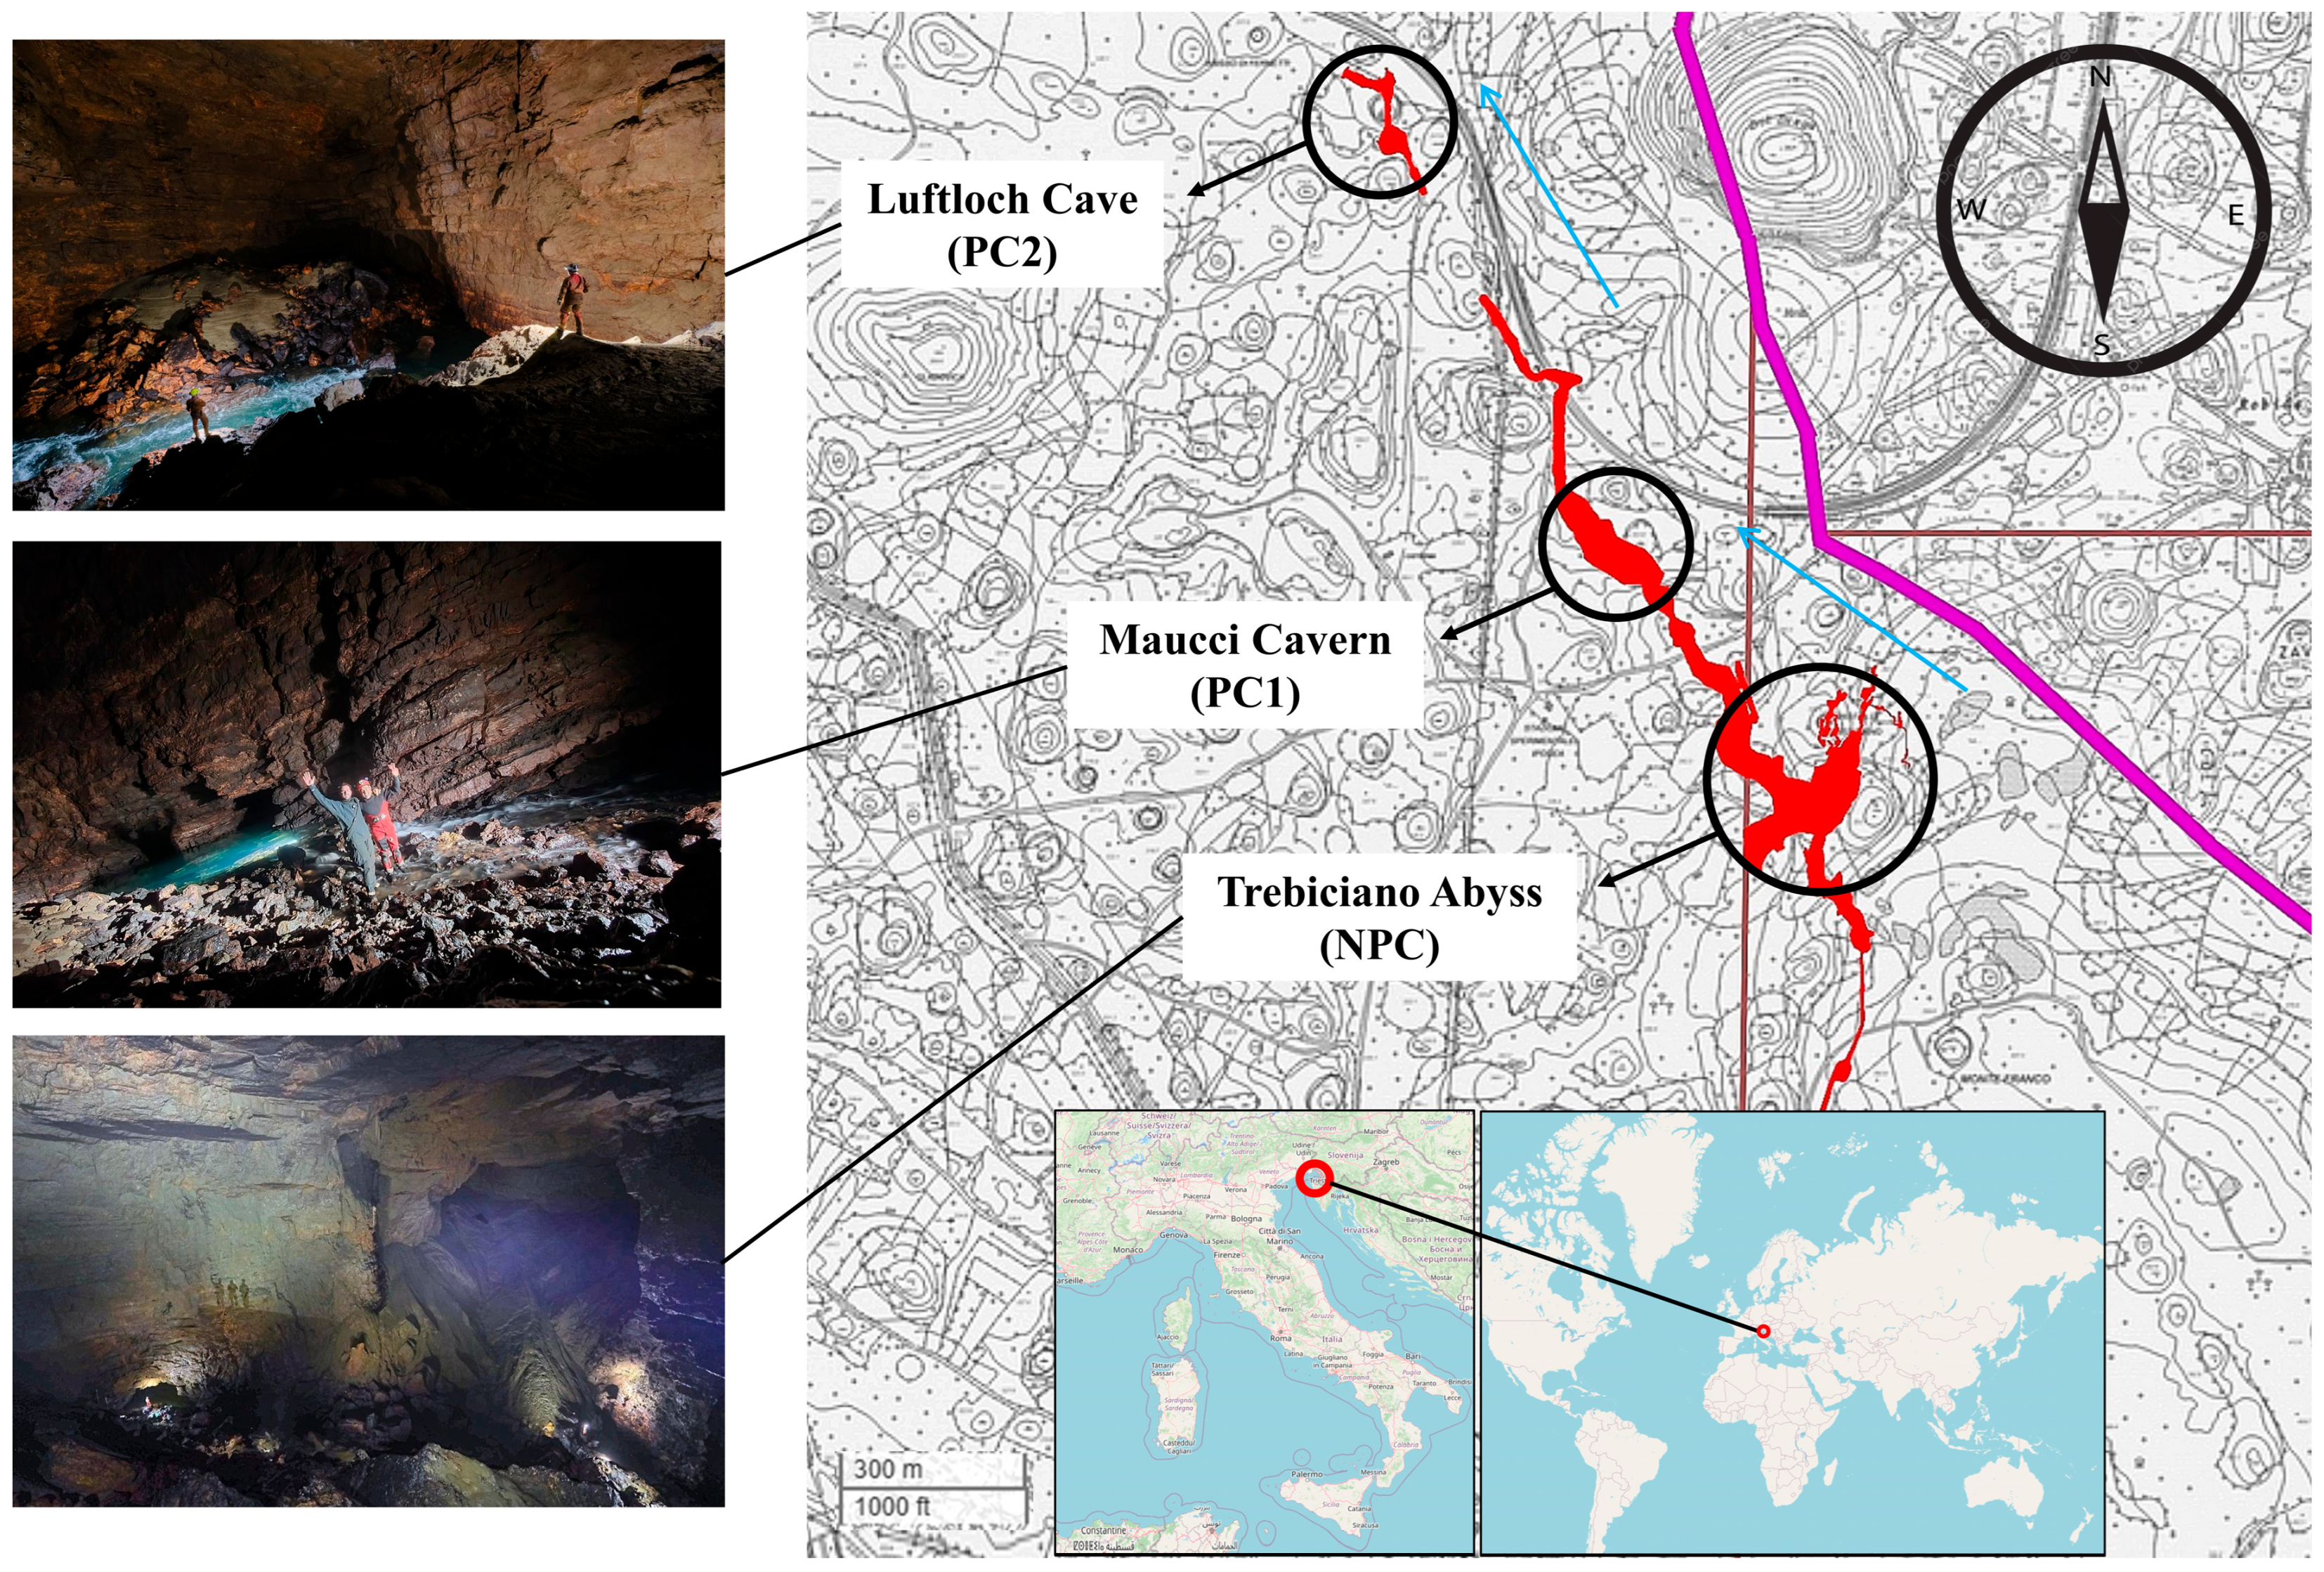
Sediment samples were collected from three caves located in the morphokarst unit of the Classic Trieste Karst in the northeastern part of the Italian peninsula, namely, Trebiciano Abyss (45.6858° N, 13.3808° E, WGS84), Maucci cavern (45.6853° N, 13.8335° E, WGS84), and Luftloch cave (45.6911° N, 13.8268° E, WGS84), hereafter referred to as non-pristine cave (NPC), pristine cave 1, and 2 (PC1, PC2), respectively (Figure 1). All three caves are hydrologically connected to the underground Timavo River and are aligned along its path, with PC1 and PC2 located progressively downstream from NPC.
PC1 is considered one of the most remote caves in the whole Classic Karst area, which poses extreme challenges to access. It is located around 300 m belowground and accessible only to expert cave divers through an underwater passage of >200 m horizontal and 50 m vertical extension along the Timavo river, starting from the Trebiciano Abyss (NPC). Discovered during the 2022 Timavo System Exploration mission, the cave has a vast chamber approximately 160 m long, 50 m wide, and >60 m high, where the Timavo River flows among boulders and into a terminal lake. The cave has been reached only twice, preserving a pristine environment virtually absent of human impact. The sampling was made on the second exploration on 11 August 2024.
The entrance of PC2 is located at an altitude of 312 m a.s.l. The access to the cave requires descending a series of pits, narrow passages, and meanders using speleological progression techniques. The cave descends to a final chamber crossed by Timavo River. The chamber measures approximately 100 m in length, 30 m in width, and about 50 m in height, with a floor composed of large boulders and sand. The first access to this chamber was made on 23 March 2024, and the sampling was made during the second descent on 27 July 2024.
The NPC has its entrance at an altitude of 341 m a.s.l. The final chamber hosts a visible stretch of the underground Timavo River [46]. The chamber measures approximately 100 m in length, 100 m in width, and 100 m in height. Discovered in 1841, it has been intensely visited, and due to its historical and scientific significance the cave has been equipped with fixed rigging to facilitate repeated access for both scientific speleological and hydrogeological investigations and non-expert recreational frequentation. Sampling was carried out on 6 August 2024.
The three caves lie within the Classical Karst plateau, a NW–SE-oriented anticlinorium composed of Cretaceous–Paleogene limestones and dolomites locally capped by Eocene flysch [47]. Chamber “walls” in NPC, PC1, and PC2 consist of massive shallow-marine limestones [46], while the floors are mantled by unconsolidated, mixed carbonate–siliciclastic sands and fine gravels interpreted as young flood-derived deposits periodically reworked by the underground river [39,44]. Hydrologically, the caves belong to the Reka–Timavo karst system, in which the Reka River sinks at Škocjan (Slovenia) and flows for ~40 km underground (straight-line distance) before re-emerging at the Timavo springs near San Giovanni di Duino (NE Italy) [46,48]. Long-term monitoring along this conduit system shows an average Timavo discharge at the springs of ~30 m3 s−1, with historical flood peaks reaching up to ~150–160 m3 s−1 and water-level fluctuations often exceeding 100 m, with rising and recession rates up to ~10 m h−1 during major events [46,48,49]. Although no site-specific hydrological records are available for PC1 and PC2, their alignment along the same master conduit and their comparable base levels to NPC strongly suggest that these chambers experience similar flood pulses, which periodically inundate the floors and redistribute sediments along the river-to-slope gradient. This interpretation is consistent with the known flood dynamics of the Reka–Timavo epiphreatic system.

2.2. Sampling Design

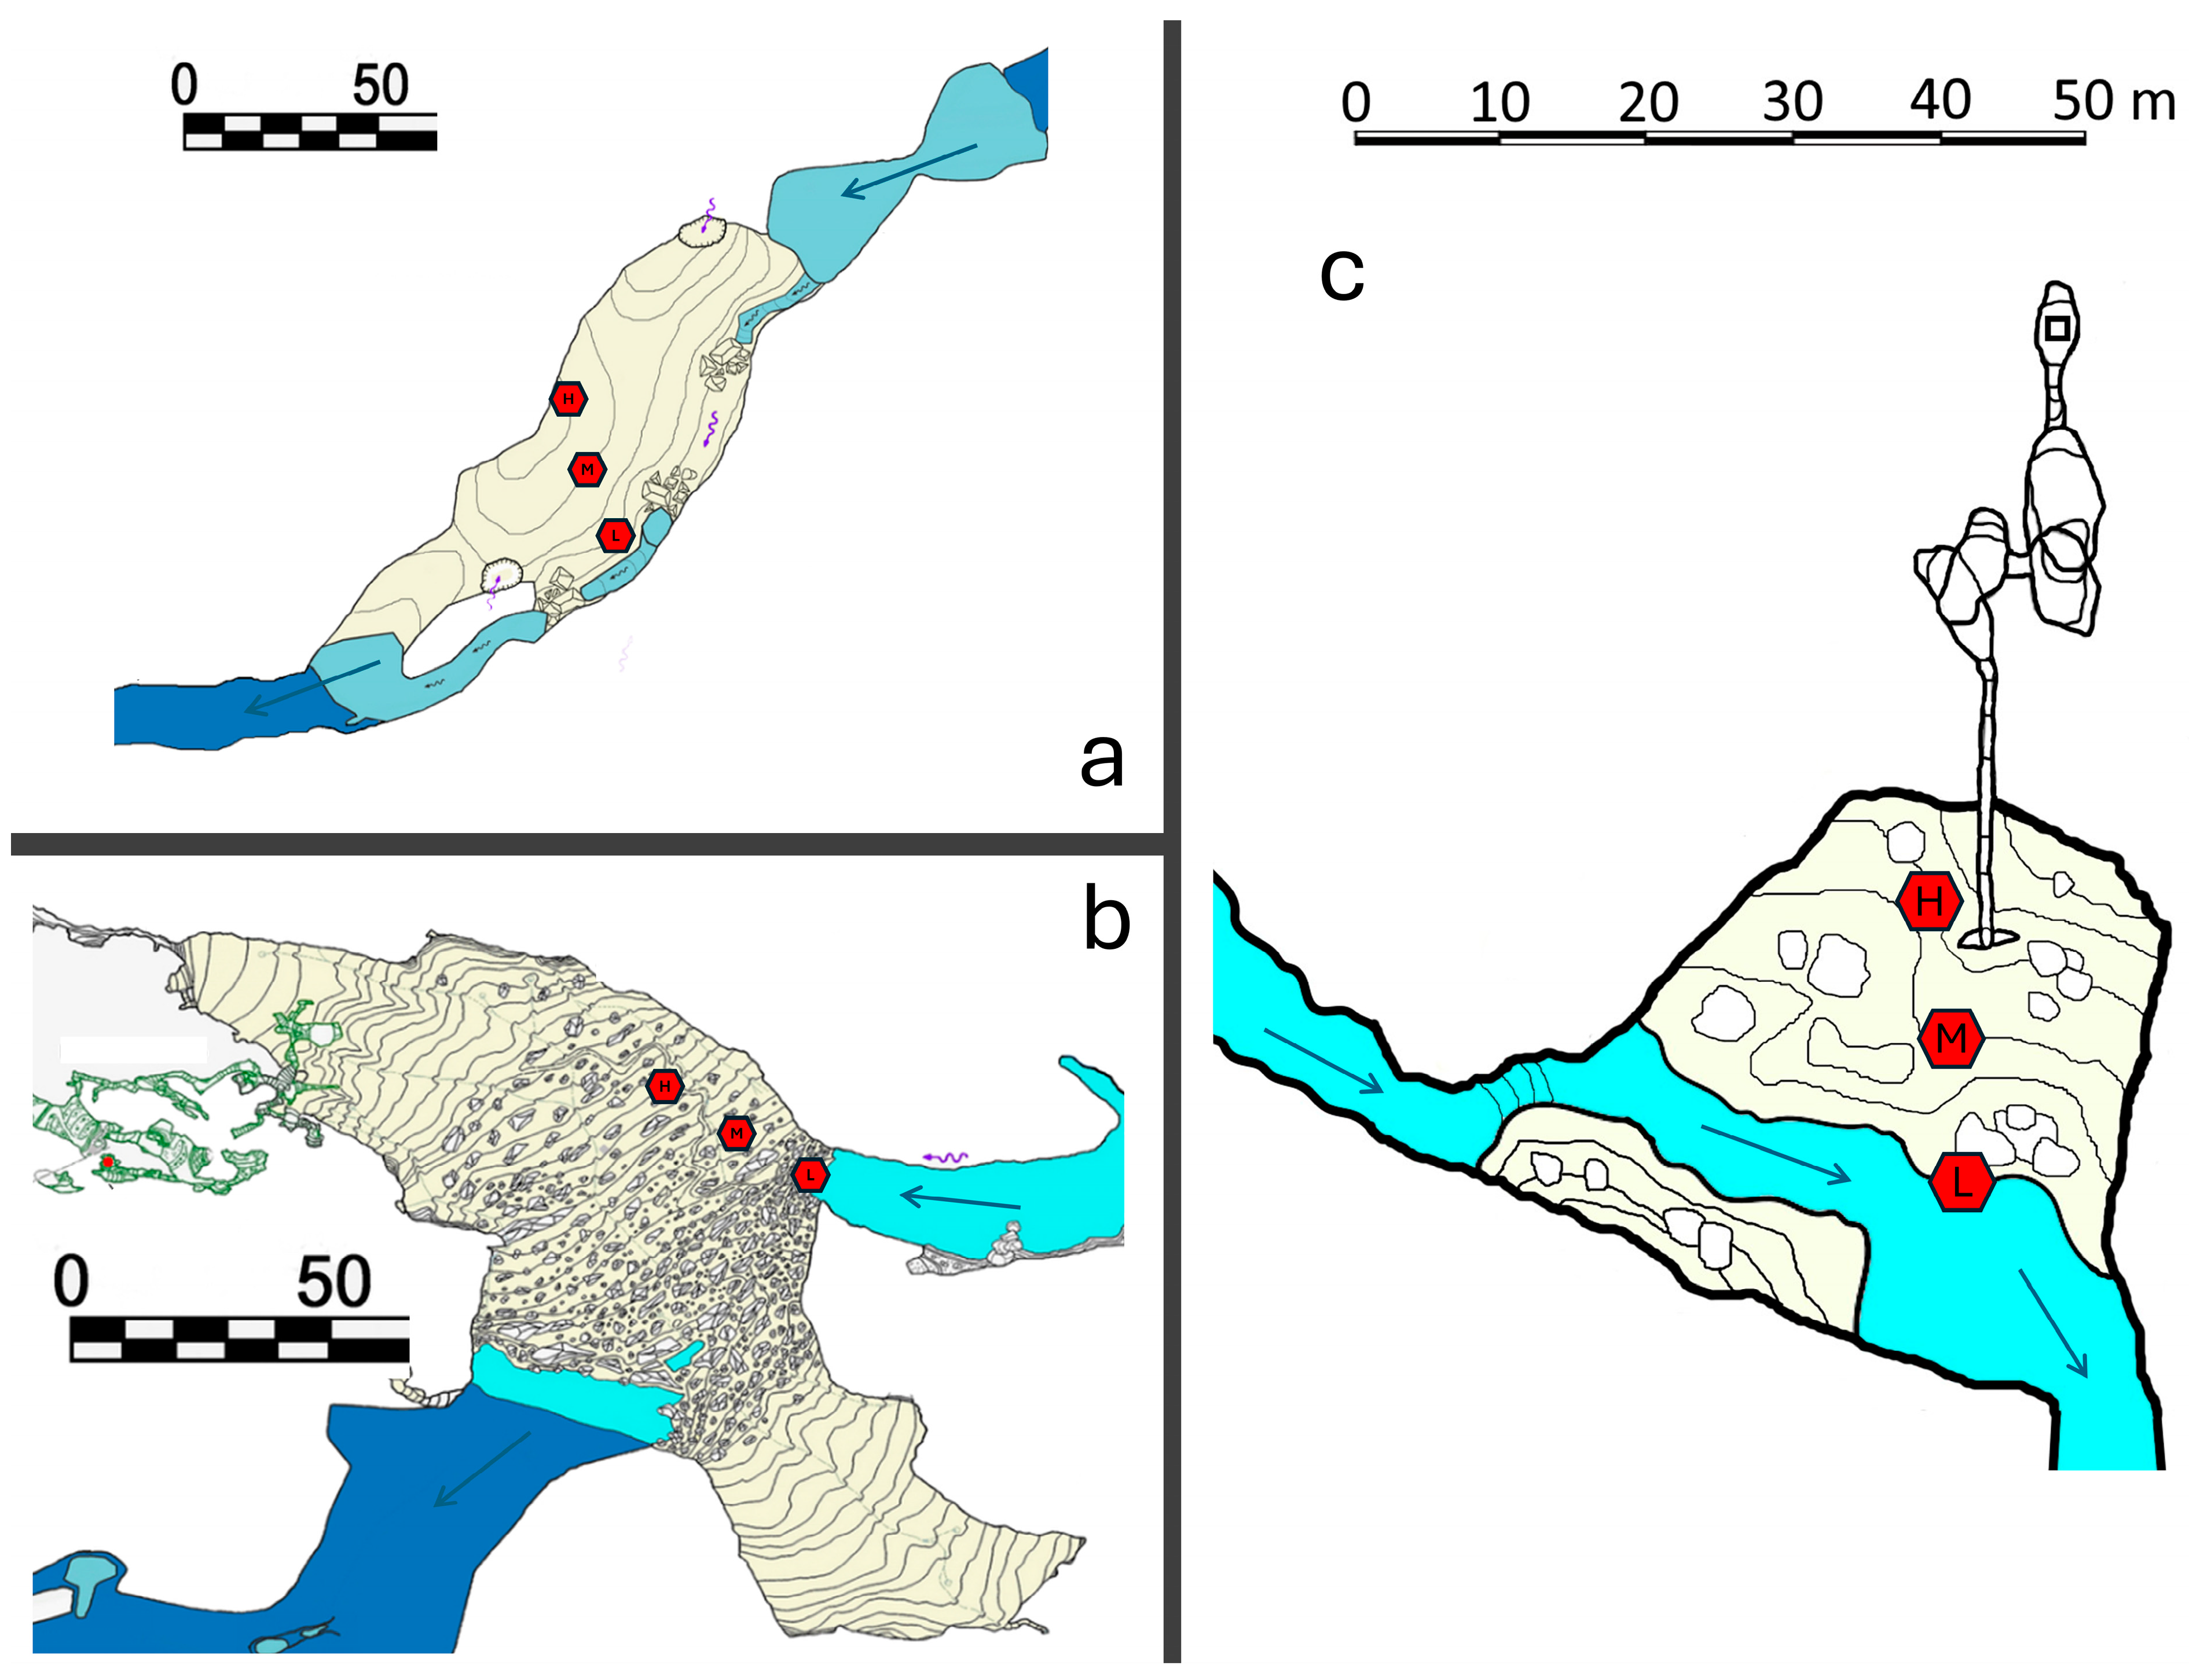
The sampling strategy followed a river-to-slope transect, designed to assess potential variations in MP accumulation with increasing distance from the Timavo River. In all caves, the chambers contain sandy slopes that rise away from the riverbed, providing a natural gradient influenced by the river flow. Three sampling stations were therefore identified along a linear transect on these slopes: a proximal station, directly and consistently influenced by the river flow, hereafter referred to as the “low” station; an intermediate station, located halfway along the slope and reflecting occasional submersion conditions, hereafter referred to as the “medium” station; and a distal station, located at the far end of the slope and only affected by the river flow during extreme flooding events, hereafter referred to as the “high” station.
In PC1, the transect extended for about 50 m from the river margin across the central portion of the visible chamber (Figure 2a). A comparable transect (~50 m) was traced in the NPC, starting from the siphon where the river enters the chamber (Figure 2b). In PC2, due to the smaller size of the chamber the transect covered about 30 m (Figure 2c). Sampling stations, however, were consistently arranged along the depositional gradient rising from the river, ensuring comparability across caves.

2.3. Sampling

Given the extremely limited accessibility of the pristine caves (characterized by tight passages, vertical drops and, in PC1, a ~40 m sump dive), glassware, bulk sediment collection, and extensive sampling were unsafe and infeasible. We therefore used pre-cleaned 50 mL polypropylene conical centrifuge tubes (Falcon®, Merck group, Darmstadt, Germany) and constrained per-station volumes. At each station, duplicate 50 mL tubes were filled with surface sediments, yielding six sediment samples plus three field blanks per cave (nine tubes in total). For PC1, all tubes were pre-filled with ultrapure water to withstand the ~40 m dive. Once in the cave chamber, tubes used for sample collection were emptied and refilled with sediments. Samples were brought to the surface, checked for integrity, and stored at 4 °C until processing.

2.4. Microplastic Extraction and Identification

Sediments were processed with a saturated NaCl solution and separated in a funnel through three consecutive extraction cycles [50]. Extracts underwent mild oxidation with 30% hydrogen peroxide (w/v) (Merck group, Darmstadt, Germany) to remove organic matter. The digested supernatants were then filtered onto Anodisc® aluminum oxide membranes (0.2 μm pore size; Whatman, lot A21184266, Merck group, Darmstadt, Germany) and dried at 40 °C. Filtered residues were first examined under a stereomicroscope (10–80×, Nikon SMZ-800N, Nikon, Tokyo, Japan). Particles displaying clear cellular or organic structures were excluded, and all remaining particles > 10 μm were individually analyzed by μFT-IR (Nicolet™ iN™ 10 MX, Thermo Fisher Scientific, Waltham, MA, USA) following established procedures [51,52]. Spectra were collected using a liquid nitrogen-cooled MCT-A detector (7800–650 cm−1) (Thermo Fisher Scientific, Waltham, MA, USA) and processed through the OMNIC™ Picta™ software v. 1.9interface. Polymer identification was based on spectral library matching, with a minimum acceptance threshold of >80%. Confirmed MPs were subsequently classified by polymer type, shape, size, and color according to standard criteria [53,54].

2.5. Quality Control

To enhance the validity, reproducibility, and comparability of this study, we adhered to the checklist developed by [55]. Details on how each point of the checklist was addressed are provided in the Supplementary Materials (Table S1). All analyses, excluding the chemical characterization, were performed under a microplastic-free glove box. The hood is equipped with a nanomaterial trap for incoming air entering the work area, a double air filtration system in the working chamber using two H14 absolute filters, and a manometer protected by an absolute filter to ensure correct operating pressure. The hood also features a control panel for managing process parameters. Field controls included a 50 mL Falcon tube filled with ultrapure microfiltered water, which was left open for the same duration as sediment sampling to assess airborne contamination (3 field blanks per cave, 9 in total). Laboratory controls were implemented by replacing plastic materials with glass and metal equipment wherever possible. During the chemical analyses, experimental blanks (negative controls) were analyzed using pre-filtered deionized water (0.45 μm; n = 5; 100 mL) to monitor potential contamination from indoor sources. Researchers wore nitrile gloves and cotton coats, and all open containers were covered with aluminum foil. Work surfaces and materials were cleaned with ethanol and MilliQ water to minimize contamination. Blank controls were conducted on MilliQ water, 30% H2O2 (Merck group, Darmstadt, Germany), absolute ethanol (VWR Chemicals, Milan, Italy), and NaCl solution (NaCl + MilliQ water, Carlo Erba, Milan, Italy) to assess procedural contamination.

2.6. Sediment Characterization

Sediment samples for water content, grain size, and SEM–EDS analyses were collected at the same stations used for microplastic sampling by retrieving three 50 mL Falcon® tubes per site (high, medium, low) on 19 November 2025 in the Trebiciano Abyss (NPC). Water content was determined by weighing subsamples of homogenized sediment (20 g), drying them at 41 °C for 24 h, cooling them in a desiccator, and reweighing: water content (%) was calculated using the equation ( W wet W dry ) / W wet × 100 . For grain size distributions, sediments were pre-treated with a 2:8 (v/v) H2O2 solution for 48 h at room temperature to promote disaggregation and partial removal of organic matter, then wet-sieved at 63 µm. The <63 µm fraction was characterized using a laser diffraction granulometer (Mastersizer Hydro 2000 G, Malvern Panalytical, Malvern, UK) to estimate pelitic size classes (1–4 µm and 4–63 µm). The >63 µm fraction was oven-dried at 105 °C and dry-sieved through a certified mesh stack (1400–62 µm, Giuliani Tecnologie, Turin, Italy), and then the mass of each size class was recorded to derive relative percentages [56]. The mineralogical information of the sediment was assessed using Scanning Electron Microscopy coupled with Energy-Dispersive Spectroscopy (SEM–EDS; Scientific Phenom ProX, Thermo Fisher Waltham, MA, USA) [57]. For each sampling point the sediment was homogenized and quartered inside large Petri dishes (Ø ≈ 140 mm). For each location, 25–30 sediment grains were randomly selected and analyzed through EDS point analyses. Based on their semi-quantitative elemental compositions, the analyzed grains were evaluated to distinguish siliciclastic materials from possible carbonate components [58].

2.7. Data Analysis

After normalization to a sediment mass per replicate of 0.0472 kg dry weight (40 mL of sediment, with average density across samples of 1.18 g mL−1), MP abundances were expressed as items per kilogram (items kg−1). For each sampling station, the two field replicates were treated independently, and values are reported as mean ± sample standard deviation (SD). Field blanks were processed alongside samples and treated identically. Given the limited number of field blanks, sediment samples, and the heterogeneity of blank composition, we avoided generic field blank subtraction. Instead, we applied a targeted, one-to-one correction restricted to exact matches between blanks and sediment samples—defined as the same cave × station, polymer, color, and shape [59]. For each matched field blank particle, one particle with the same attributes was removed from the corresponding sample data. All other particles recorded in field blanks were not subtracted. Blank results are reported separately as absolute counts per blank and composition (polymer, shape, color) to ensure transparent QA/QC reporting.
A two-way analysis of variance (ANOVA) was carried out to test for differences in MP abundance between caves and among stations along the river-to-slope gradient. The design for the analysis consisted of two factors, cave (3 levels, PC1, PC2, and NPC, fixed) and station (3 levels, high, medium, and low, fixed and crossed to factor cave), with n = 2 for each combination of factors. Prior to analysis, the assumptions of normality and homogeneity of variances were tested with the Shapiro–Wilk test and the Cochran’s C-test, respectively.
All data analysis, handling, calculations, and figure production were performed with the software R version 4.4.2 [60] and RStudio v. 2024.12 [61], using the packages ‘tidyverse’, ‘ggplot2′, and ‘GAD’ [62,63,64].

3. Results

3.1. Overall MP Abundance in Cave Sediments

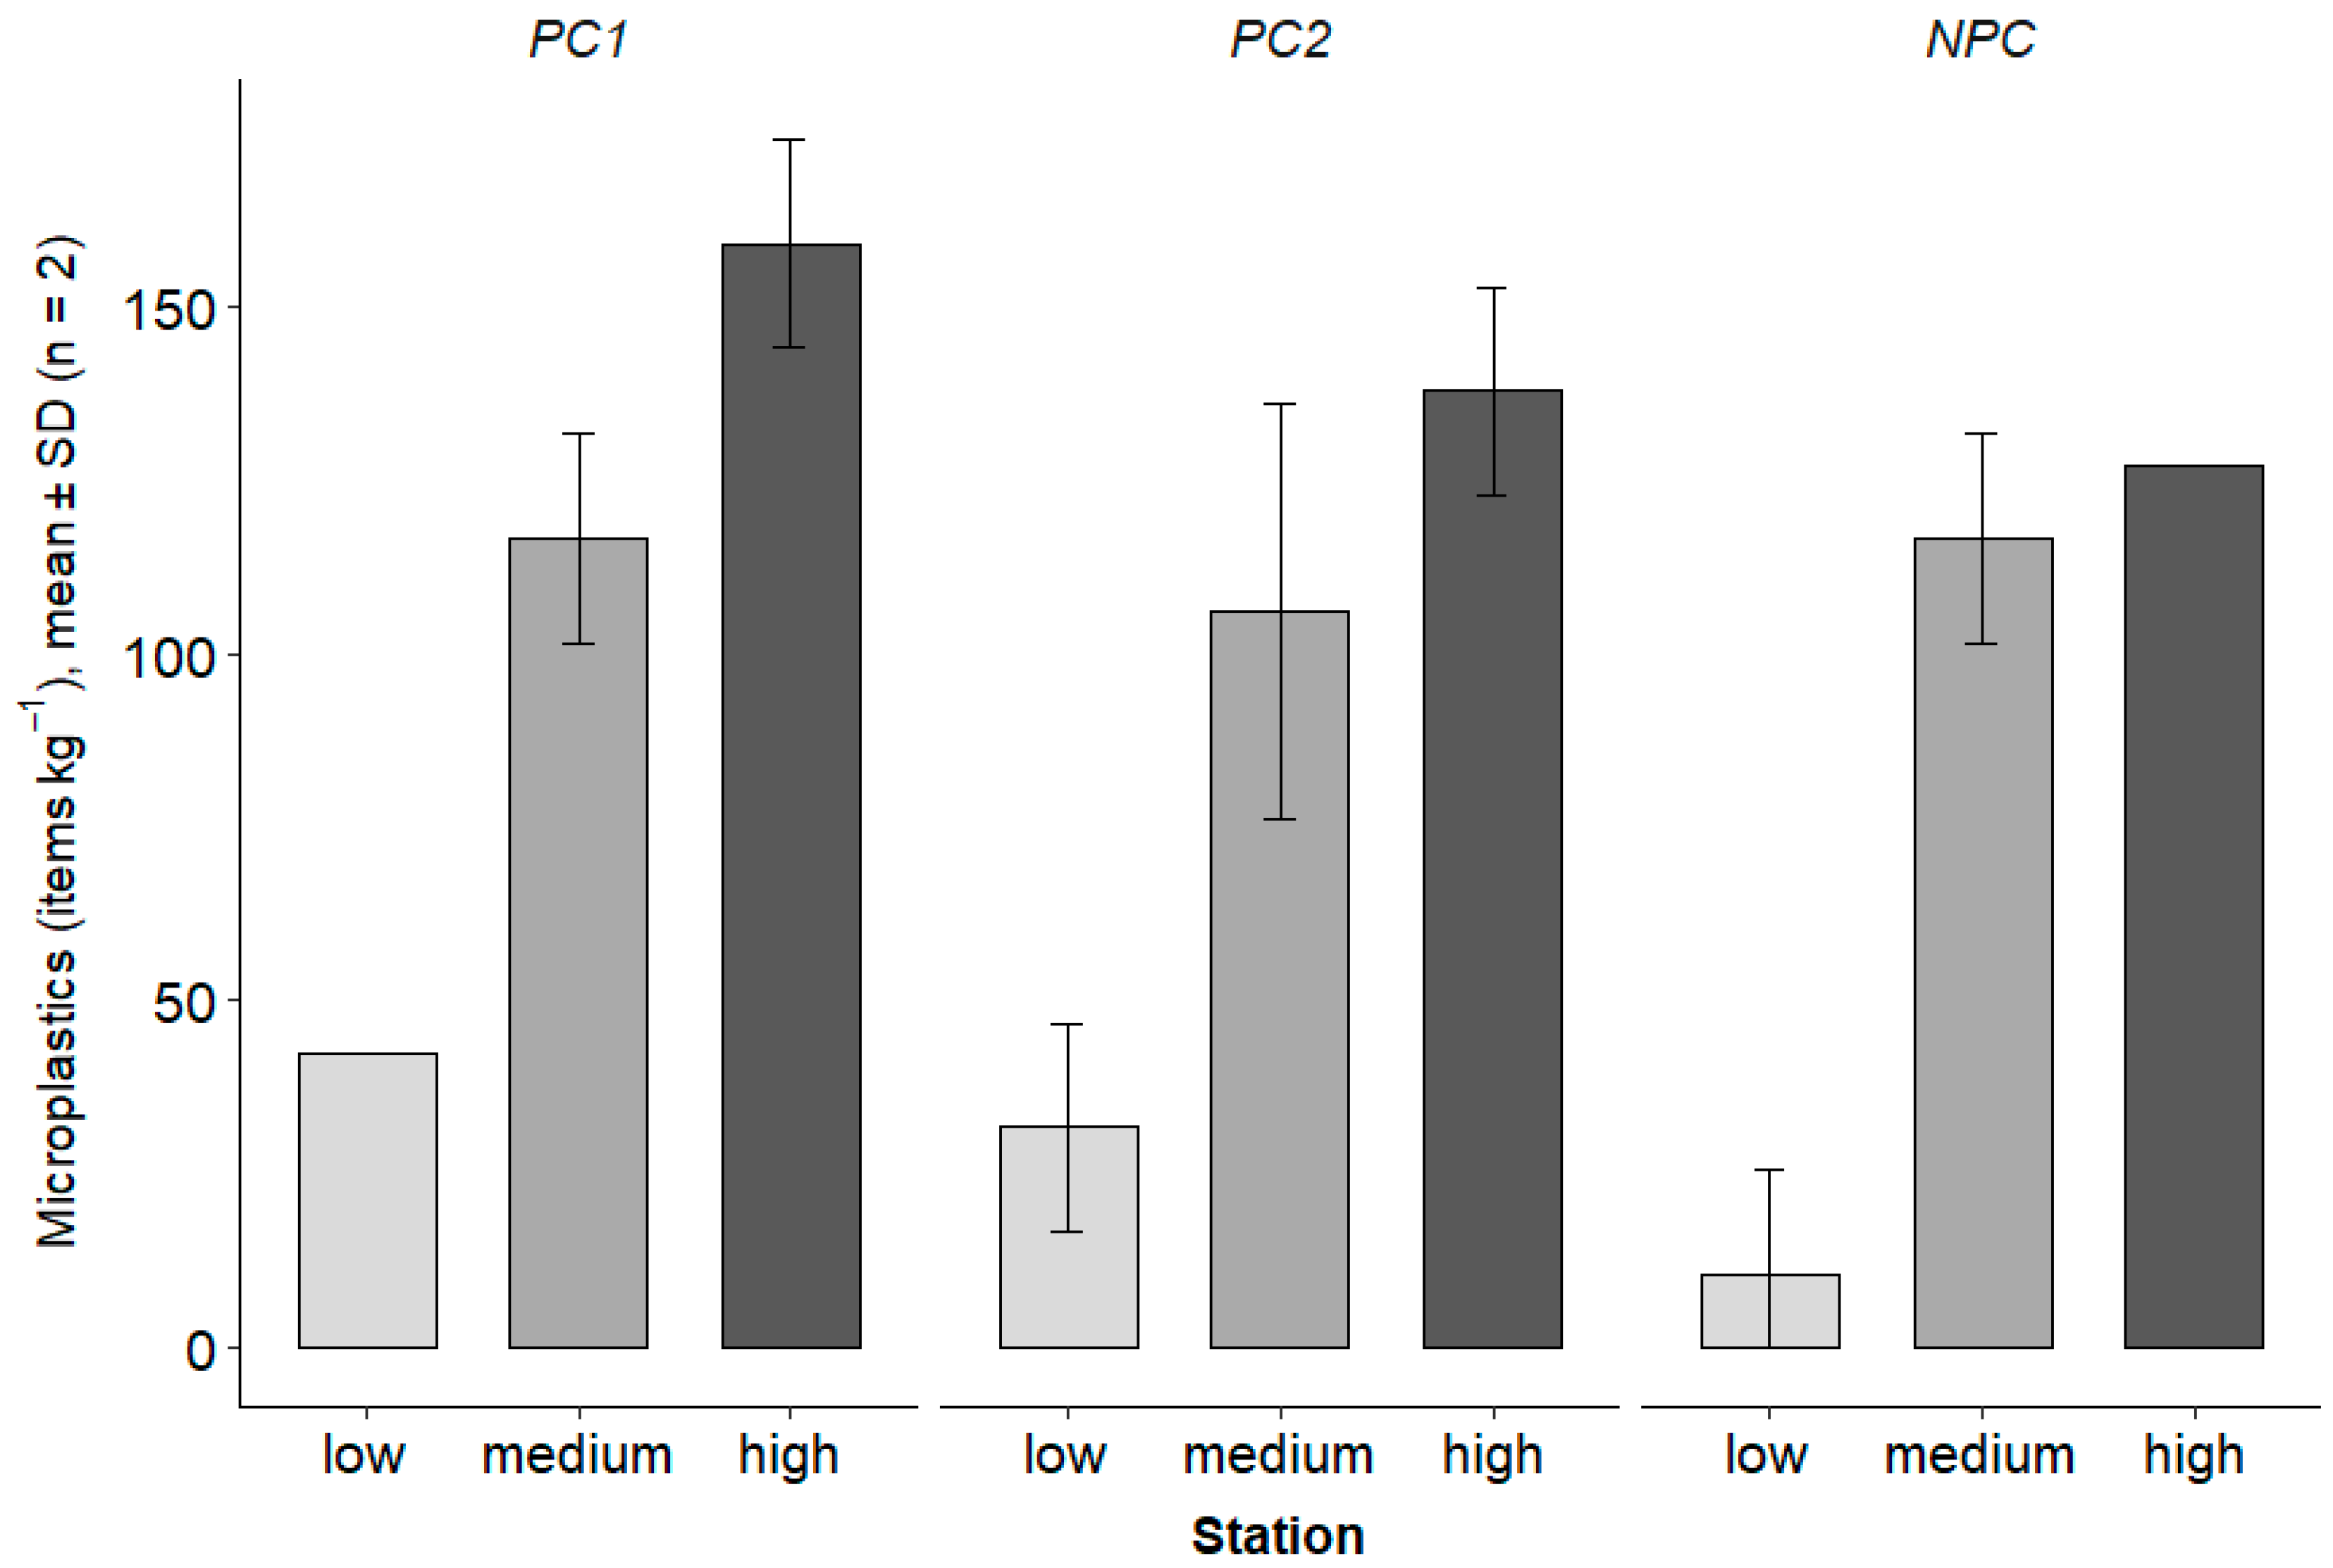
A total of 430 particles were identified as suspected MPs. After chemical characterization, 80–85% of targeted particles resulted as non-plastic items (e.g., natural inorganic debris, cellulose). A total of 84 items across the three investigated caves were identified as true MPs. Mean (±SD) estimated abundances of MPs were 84.7 ± 58.4 items kg−1 (dry weight) in NPC, 105.9 ± 53.6 in PC1, and 91.8 ± 51.3 in PC2 (Table 1). The polymer composition showed slight variation among the caves, with PET being the most abundant polymer in NPC (45.8%) and PP the dominant polymer in PC1 and PC2 (40.0% and 42.3%, respectively) (Table 1). The relative abundance of fibers and fragments was similar in all caves, as well as the distributions of particles among colors (Table 1). Particle size ranged from ~25 to 300 µm, with mean values substantially homogeneous among caves (Table 1). ANOVA did not detect significant differences in the abundance of MPs among caves, irrespective of the river gradient, indicating comparable average contamination levels in cave sediments (Table 2, Figure 3).

3.2. Within-Cave Gradient of MP Distribution

ANOVA consistently detected a significant increase in the abundance of MPs among stations along the river-to-slope gradient (Table 2) in all caves. In PC1 and PC2, mean concentrations of MPs at high stations resulted ~4× greater than those recorded at low stations, whereas this increase was ~12× in NPC (Figure 3).
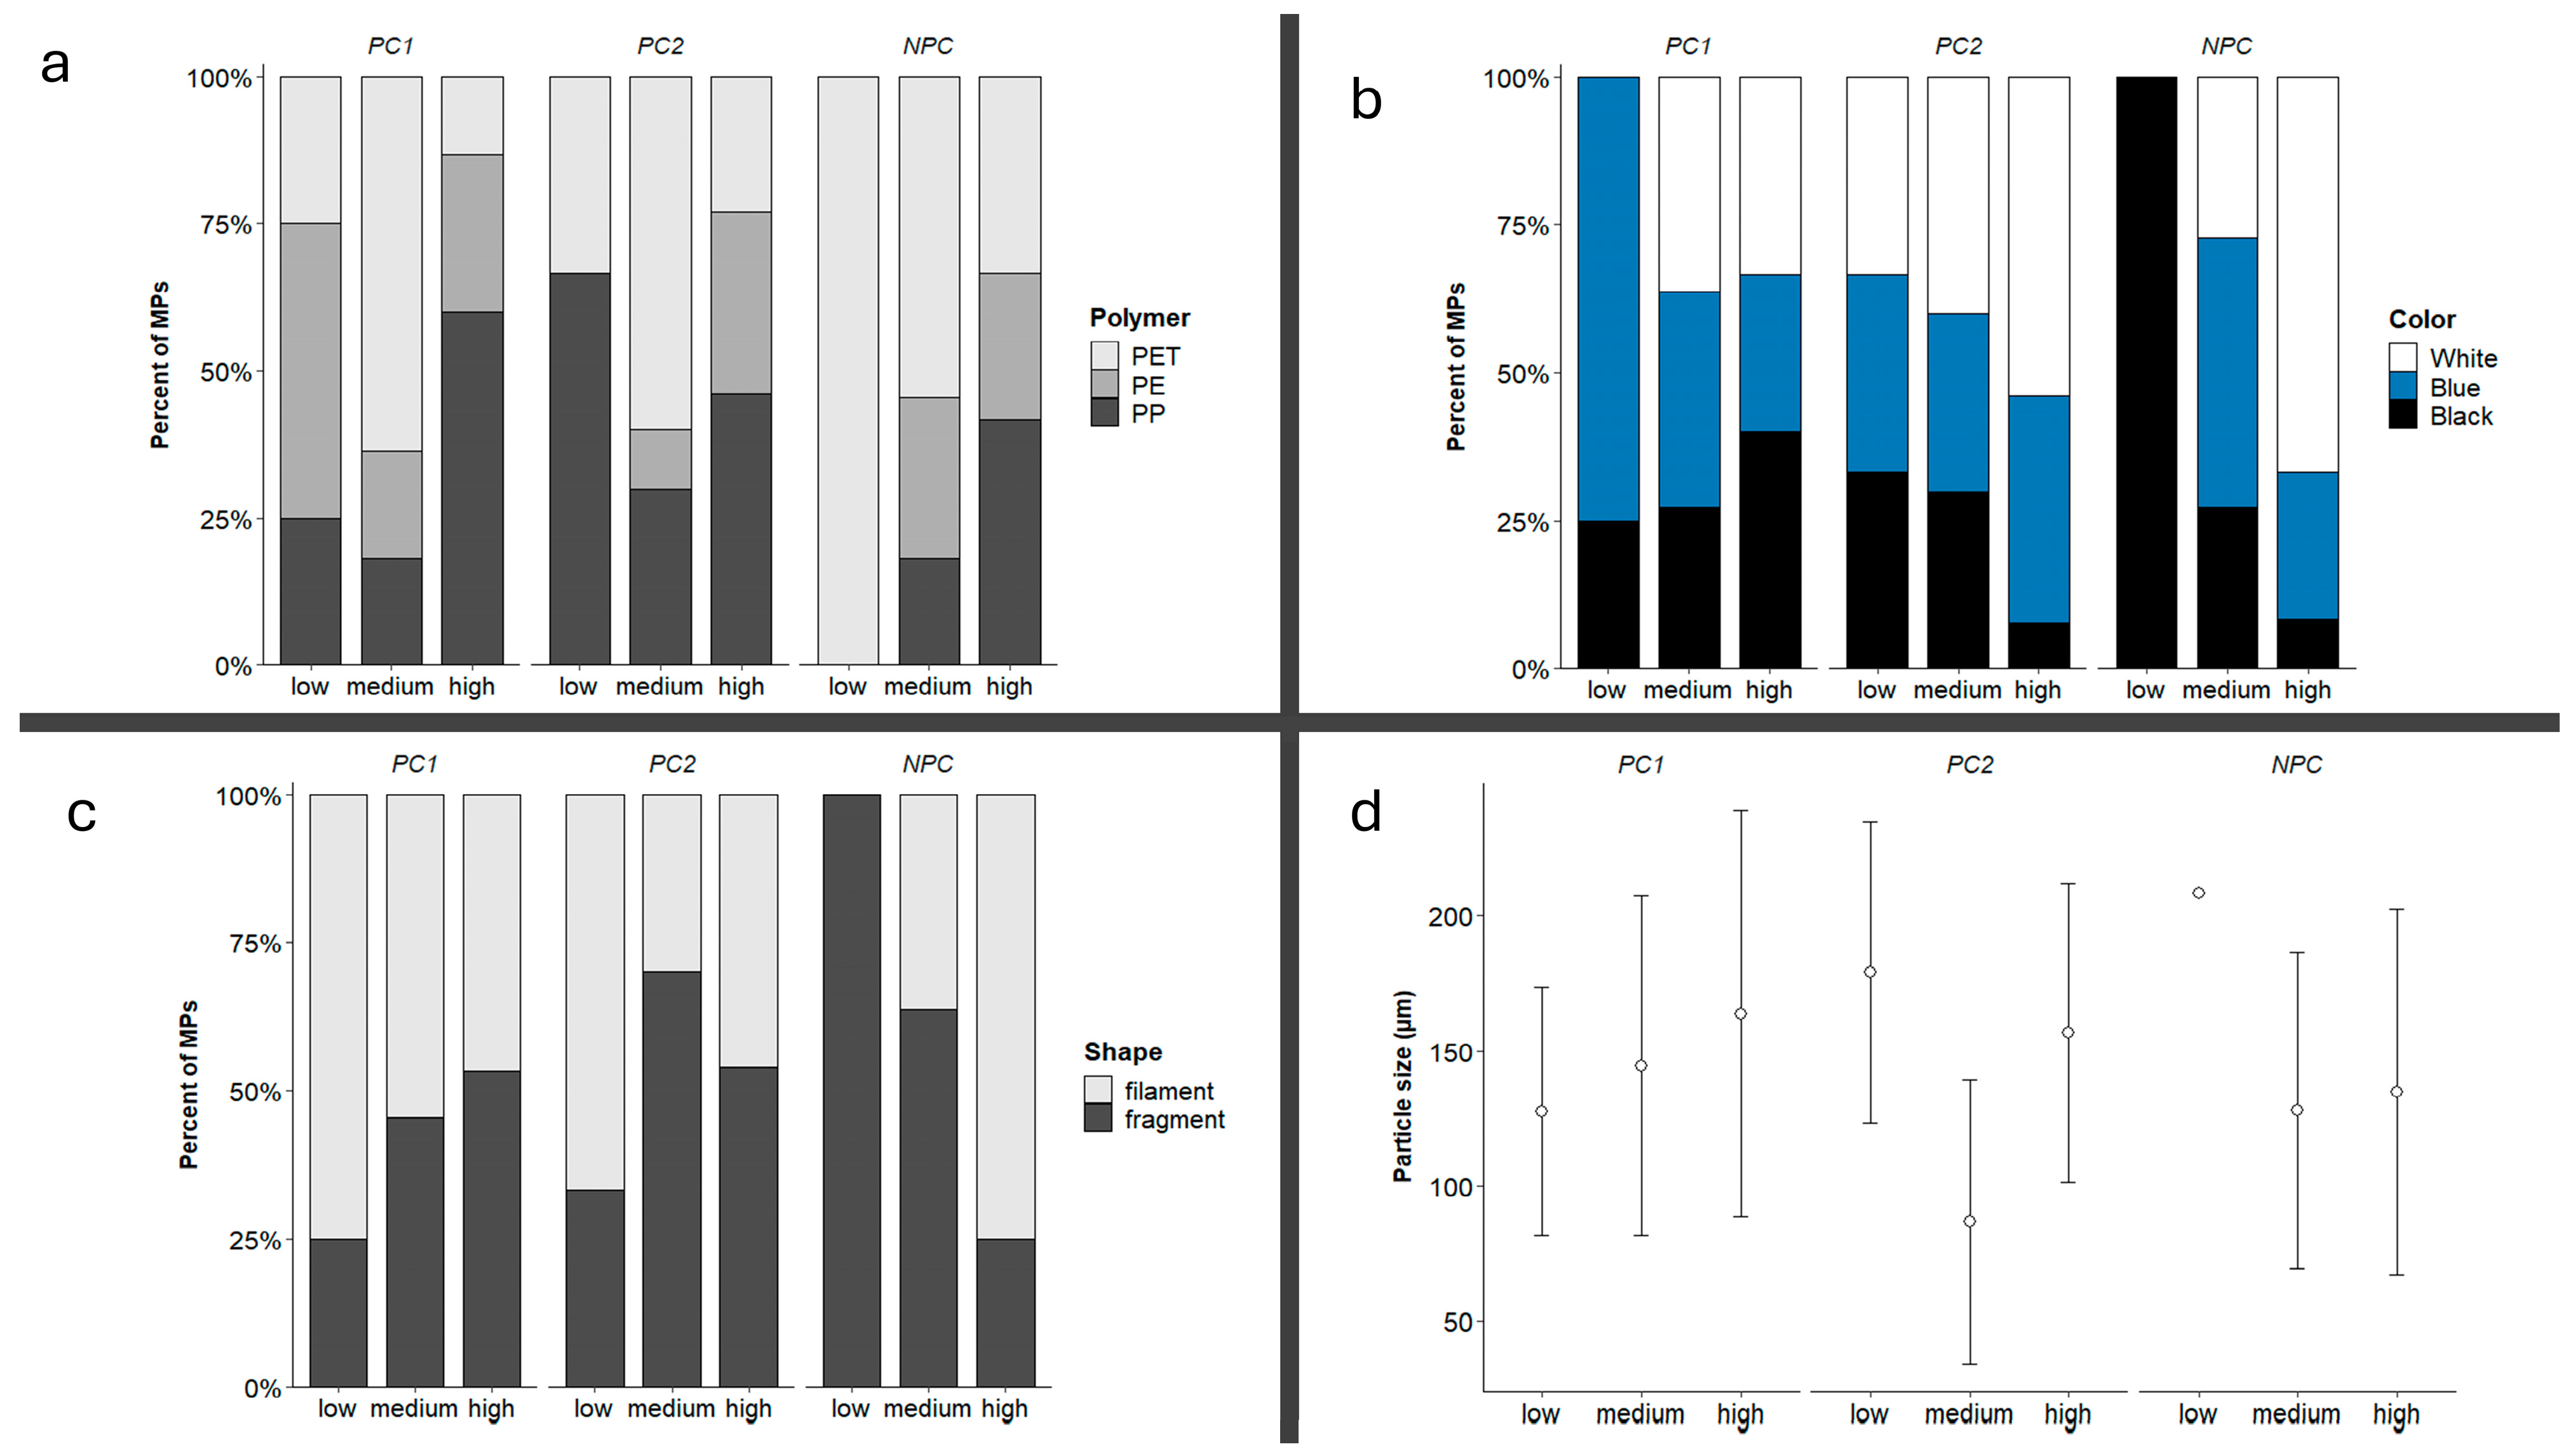
Polymer profiles showed idiosyncratic patterns in relation to the river-to-slope gradient, although inspection of the graphs in Figure 4a seems to suggest a general decrease in PET, coupled with a decrease in PP-PE particles, from low–medium to high stations in all caves. Color patterns were broadly consistent across caves, with colored particles dominating at all stations in all caves, except for the high stations of PC2 and NPC where white particles were more abundant (Figure 4b). The relative abundance of fragments and fibers (the only two types of particles recorded in the cave sediments) at different stations were consistent between PC1 and PC2, showing an increase in fragments from low to medium–high stations, while the opposite occurred in NPC (Figure 4c). Finally, mean particle size and ranges of variability largely overlap across caves and along the river-to-slope gradient, except for the medium station of PC2 where lower-size particles were recorded (Figure 4d). Data on MPs at each station within caves are summarized in the Supplementary Materials (Table S2).

3.3. MPs in Blank Samples

Across all field blanks (n = 9), nine particles were detected (Table 3). For PC1, no particles were detected in field blanks, while for NPC and PC2 only one and two particles per station were recorded, respectively. A total of four exact particle matches (same station, polymer, color, and shape) were identified between field blanks and sediment samples: one particle in all stations of PC2 and one particle in the high station of NPC. Therefore, estimates of MPs per sample in these stations were corrected by subtracting an equivalent value of items kg−1 from the corresponding MP category.

3.4. Sediment Characterization

The overall analysis of the sediment along the NPC transect indicates that deposits are composed exclusively of sand (0.0625–2 mm), with the fine fraction representing only a negligible component of the total mass (0.35–0.08 wt% in the <62 µm class). The pelitic matrix analyzed by laser granulometry shows a silt-dominated composition, with fine silt (4–63 µm) representing both the major component and smaller proportions of 1–4 µm particles (Supplementary Materials Tables S2 and S3). Bulk SEM–EDS averages from the three sampling levels (high, medium, low) showed a nearly identical elemental composition, dominated by Si (≈30%) and O (≈46%), with minor Al (≈4%) and trace K, Na, Mg, and Fe. Calcium concentrations were consistently below 1%, confirming the absence of carbonate particles (Supplementary Materials Table S4). This composition indicates a homogeneous siliciclastic sand with no substantial cave-derived carbonate contribution. At the low station, water content was 7.9%. The pelitic fraction (<63 µm) was dominated by fine silt, with 77.4 ± 0.1% in the 4–63 µm class and 18.1 ± 0.2% in the 1–4 µm class. The >63 µm fraction consisted predominantly of medium–coarse sand, with the 710–355 µm classes accounting for 58.8% of the total (13.4% at 710 µm; 24.0% at 500 µm; 21.4% at 355 µm), while the <62 µm fraction from sieving represented only 0.17% of total mass. At the medium station, water content was lower (4.5%). Within the pelite the finest particles decreased, with 9.8 ± 0.1% in the 1–4 µm class and 70.6 ± 1.8% in the 4–63 µm class. The sandy fraction was dominated by fine–medium sand, with the 250–180 µm classes representing 59.1% of the sample (33.2% at 250 µm; 25.9% at 180 µm). Finer size classes (90–62 µm) were minor (2.1% and 0.38%, respectively), and the <62 µm sieved fraction accounted for 0.076%. At the high station, water content was 7.0%. The pelitic fraction showed a further reduction in the finest component, with 6.4 ± 0.4% in the 1–4 µm class and 51.0 ± 2.6% in the 4–63 µm class. The >63 µm fraction consisted mainly of fine sand, dominated by the 125–180 µm classes, which together constituted 52.9% of the sediment (29.6% at 125 µm; 23.3% at 180 µm). Very fine sand (90–62 µm) contributed an additional 26.4% (16.4% at 90 µm; 10.0% at 62 µm), while the <62 µm sieved fraction represented 0.35%.

4. Discussion

MP contamination in superficial sediments was consistent across the three investigated caves at ~94 items kg−1 on average, which sits well below the mean contamination level reported for cave sediments worldwide (~1394 items kg−1, [40]). On a regional scale, recent assessments in the karst system of NW Italy estimated ~1.6–8.7 × 10³ items kg−1 in surface sediments along touristic paths within several show caves [41,65], whereas in the Italian Classic Karst (NE Italy), where the present study was carried out, cave sediments in persistent contact with groundwater flow were found to contain approximately 1000–2000 MPs kg−1 [66], with synthetic microfiber amounts up to ~1150 items kg−1 [67]. Contamination levels comparable to those found in the present study were recorded in the Slovenian Classic Karst, where 0–10 items kg−1 were estimated in sediments from caves generally exposed to rapid throughflow and weak sediment trapping [27,43].
Several factors could affect anthropogenic microparticle accumulation and estimation in cave sediments, leading to the observed discrepancies across studies. First, the timing of sampling and the type of sampled sediment deposits could strongly influence estimates of MPs contamination. For example, cave sediments collected during a flooding event in Cliff Cave (Missouri, USA) contained 8423 ± 166 items kg−1 [68], underscoring the effect of hydrodynamism on contamination. Moreover, due to the intrinsic difficulties of fieldwork in cave environments, most of studies rely on a limited sample size and poor sampling designs, which may often prevent an adequate quantification of spatial heterogeneity in MP distribution and lead to spurious high contamination levels [69]. Other methodological aspects, such as differences in extraction protocols or chemical analysis, could contribute to varying contamination estimates among studies [40]. Several surveys, for instance, quantified MPs in sediments including air-borne items (e.g., natural/regenerated microfibers) using UV fluorescence with targeted spectroscopic confirmation. This approach may lead to higher total particle counts compared to studies strictly based on polymer-verified MPs [43].
A major problem with data on MPs in cave sediments, which probably underlies the apparently high contamination levels and limits an adequate quantification of the phenomenon, is that they are biased towards highly visited or show caves, with very few assessments in more pristine cave environments [42,43,69]. At the time of sampling, PC1 and PC2 were essentially uncharted, both visited only twice in their history, including the sampling campaigns for the present study. Only two studies have previously assessed MPs in “pristine” (e.g., minimally visited, remote) natural caves. The first, carried out in central Italy, sampled sediments in small/very small unexplored shallow caves directly connected to the surface in which microparticles were dominated by natural/regenerated microfibers with low or absent MPs, consistent with limited subsurface hydrologic delivery and predominant aerial inputs [43]. The other truly comparable case study concerned the isolated Ghar-e-Tangi cave (Pakistan) [42], where MP contamination in sediments declined systematically with distance from the entrance and thus supported indirect inputs via surface runoff and atmospheric deposition, reporting similar contents of MPs (37–99 items kg−1) as those found in this study for the two pristine caves PC1 and PC2 (92–106 items kg−1).
The assessment of MPs in sediments from the frequently visited NPC provided an internal control within the examined karst system for exploring the role of direct human frequentation on MP contamination. If human frequentation was the main source of contamination, higher amounts of MPs and/or distinct compositional fingerprints would be expected in the NPC with respect to PC1 and PC2, especially on low benches where human visits concentrate, as documented for several show caves where sediments along tourist routes exhibited greater MP amounts than less visited cave sectors [41,65]. Instead, MP contamination in sediments from the three investigated caves was broadly comparable in terms of abundance of items, compositional fingerprints in polymer type (PP, PET, PE), and shape of particles (fibers, fragments), irrespective of pristine and non-pristine environmental conditions, reinforcing the hypothesis that higher visitation does not necessarily translate into greater MP inputs [68]. Across the three caves, MP abundance increased with increasing distance from the Timavo river along the river-to-slope gradient, up to 12 times higher at high (far from the river) than at low (close to the river level) sampling stations. The gradient seemed to reflect flood frequency and sediment residence times rather than local human activity, suggesting that the primary cause of contamination in the investigated karst system could be ascribed to the Timavo river, which connects the whole cave system. This interpretation is consistent with the basic sediment patterns observed along the river-to-slope transect, where deposits consisted almost entirely of siliciclastic sand with a minimal fine fraction (0.35–0.08 wt% <62 µm) and showed a simple coarsening–fining trend from lower to higher positions. The Reka–Timavo catchment drains a large sector of the Classical Karst characterized by mixed land uses, including urban areas, dispersed settlements without full sewerage, agriculture, viticulture, and major transport corridors. Previous assessments in the Slovenian and Italian sectors of the region have identified wastewater effluents, road-derived contaminants, industrial discharges, landfills and agricultural runoff as recurrent sources of groundwater pollution [70,71]. Because karst terrains allow rapid infiltration and limited natural filtration, contaminants entering the catchment are quickly transferred into subsurface conduits and transported over long distances [68,69]. This supports the interpretation that the MPs found in all three caves mainly derive from river-borne inputs delivered by the sinking Reka, rather than from local cave-specific sources. This also explains why the two pristine caves (PC1, PC2), despite lacking direct human access, showed MP abundances and polymer spectra comparable to the frequently visited NPC. In this context, visitor-derived inputs are negligible relative to upstream catchment contamination, and the relatively low MP loads observed likely reflect both basin characteristics and hydrodynamic attenuations along the Reka–Timavo pathway. Similar upstream-driven patterns have been documented in other karst systems, where riverine transport dominates over local anthropogenic contributions, even in highly visited caves.
Although the flood hydrodynamics of the Timavo river are still widely debated [39], the river-to-slope gradient in MPs can be explained by flood-pulse sorting. All three caves exhibited a sand-dune sediment body with substantial relief. These dunes are the result of sediment deposition by the river during floods, and the accumulation of MPs along the river-to-slope gradient was consistent with observations from surface rivers where MP deposition follows particulate deposition [72]. In the caves, recurrent inundation and shear flush in proximity of the river (low stations) could continuously remove particles, whereas at higher elevation along the river-to-slope gradient hydraulic shadows may act as traps, accumulating particles delivered by floods and retaining them between events [73,74]. During the rising limb, MPs can be advected into the chambers with suspended sediment; at the flood crest, the chambers enter a quasi-stationary (slackwater) state in which ponding reduces near-surface velocities and shear over emergent benches, enhancing decantation and retention on higher benches [74,75]. During the falling limb, hydraulic gradients and shear intensify along the thalweg and lower benches, promoting re-entrainment and export and thereby suppressing net deposition at low elevation. This mechanism is consistent with observations at karst springs where, after flooding events, anthropogenic microparticles increased and polymer types diversified [76]. Particle transport correlates more strongly with turbidity/suspended sediment concentration than with discharge alone, while sedimentary archives likewise show MP peaks during extreme flood periods and periodicities that mirror fluvial hydrology in sediment deposits [73,76]. For the Timavo river, the absence of homogenization along the sand dune did not suggest that flooding events could be intense enough to rework the entire sediment package but, rather, the occurrence of localized flushing at low elevations and accumulation at higher elevations within hydraulic shadows [74].
The dominance of PP, PE, and PET—three of the most widespread anthropogenic polymers across environmental matrices [6,77]—together with their altimetric partitioning supported a density-coupled, flood-driven transport. In our transects, PP and PE (low-density, positively buoyant) dominate at high-bench stations, whereas PET (denser, non-buoyant) is comparatively depleted aloft and relatively more represented on lower, river-proximal benches [53,78,79]. This appeared to mirror the Timavo flood hydrodynamics, with ponding/slackwater at crest stages stranding buoyant particles on emergent benches and recession flows enhancing re-entrainment and export from low benches. Combined with the fiber/fragment mix, this pattern was consistent with a wastewater-rich surface reservoir feeding the karst network and with flood-pulse sorting that deposited MPs—like sediments—preferentially on the upper parts of the dunes [40,68]. The prevalence of fine microplastics (139.6 µm on average) was consistent with a shift toward smaller particles following flood events and their subsequent accumulation in sediment [74,80].

5. Conclusions

This study provides the first quantification of microplastic (MP) contamination in sediments from pristine, inaccessible, and non-frequented caves of the Classic Italian Karst. It establishes a robust baseline for assessing background MP levels in subterranean environments and for evaluating the relative contribution of direct human inputs in comparison to river-borne sources. Contamination levels were aligned with those found in the other, very rare, studies carried out in truly pristine caves, suggesting that a background contamination of around ~102 items kg−1 could be expected in natural caves irrespective of human presence. Concentration, polymer, and shape spectra of MPs found in sediments from the two inaccessible, pristine natural caves (PC1, PC2) were comparable to those present in the frequently visited cave (NPC). Consistently in all caves, which are connected by the Timavo river, MPs showed a significant increase along a river-to-slope gradient from low sediment benches close to the river flow to upper benches, indicating the river as the major conveyor of MPs in the examined cave systems. Such findings highlighted negligible direct inputs of MPs from human frequentation when compared with underground water flow dynamics in cave systems, with important implications for future research in cave environments and effective mitigation strategies. Sampling campaigns should target the rising/peak/falling stages of water flow to resolve deposition–export asymmetries that may affect contamination assessments. Also, as flow dynamic and sediment deposition interact with the complex morphology and topography that often characterize cave environments, hierarchical sampling designs at multiple spatial scales are recommended to avoid biased point estimates of MP contamination. Finally, in karst regions where complex hydrogeology combines with high levels of anthropization, monitoring strategies should prioritize riverine sources of MPs and flood dynamics (timing, magnitude, and duration of ponding) over human access controls in cave environments. In this view, specific monitoring programs and mitigation actions, such as managing surface riverine pollution and assessing land-based plastic leakage in recharge areas, could help control potential contamination of subterranean environments through surface waters. Caves and karst aquifers are of high cultural, scientific, and societal relevance, sustaining underground biodiversity and representing a basic hydric resource for human populations. Above all, this study demonstrated that subsurface ecosystems can be more tightly connected to the surface, and therefore more sensitive to aboveground contamination, than previously recognized, requiring more comprehensive management strategies which combine the reduction in soil and riverine MP pollution to achieve an effective mitigation of the phenomenon in these fragile and valuable environments.

Supplementary Materials

The following supporting information can be downloaded at: https://www.mdpi.com/article/10.3390/microplastics5010024/s1, Table S1: Station-level microplastic metrics; Table S2: Grain size distribution of sediments; Table S3: Laser granulometry; Table S4: Sediment composition; Table S5: Cowger checklist; Table S6: Dataset.

Author Contributions

Conceptualization, M.P. and S.B.; methodology, M.P. and R.B.; investigation, R.B. and P.C.; formal analysis, R.B., S.B., M.R., S.A. and T.B.; resources, M.R.; writing—original draft preparation, R.B. and S.B.; writing—review and editing, M.P., S.B., M.R. and L.G.; visualization, R.B.; supervision, S.B., M.R. and L.G.; funding acquisition, L.G. and M.R. P.C. passed away prior to the publication of this manuscript. All authors have read and agreed to the published version of this manuscript.

Funding

This research was funded by NextGenerationEU—National Recovery and Resilience Plan (PNRR), Mission 4, Component 1, Investments 3.4 and 4.1, within the framework of the PhD Program of National Interest in Design for Made in Italy, and by the Research Grant RG_25_2025. The experimental activities performed by BsRC were supported by dedicated internal fundings (reference n. RG_45_2025).

Institutional Review Board Statement

Not applicable.

Informed Consent Statement

Not applicable.

Data Availability Statement

The dataset analyzed in the study is available in the Supplementary Materials (Table S3).

Acknowledgments

The authors thank the Società Adriatica di Speleologia for their essential logistical assistance and field support during sampling in the Trebiciano Abyss and Luftloch Cave, carried out under the municipal concession Prot. n. 12/2–10/23 granted by the Municipality of Trieste and the Civic Museum of Natural History of Trieste. Thanks to Silvio Masè for the Trebiciano sand samplings. We are also indebted to the Timavo System Exploration Team (National Cave Diving Committee, Fédération Française d’Études et de Sports Sous-Marins—FFESSM) for enabling the sampling of the Maucci Cavern. In particular, we express our sincere gratitude to Patrice Cabanel, whose commitment and technical expertise were fundamental to the successful collection of the Maucci samples. Authors are grateful to the Bioscience Research Center for the chemical analysis of microparticles (internal grant for research activities n. RG_45_2025).

Conflicts of Interest

The authors declare no conflicts of interest. The funders had no role in the design of the study; in the collection, analyses, or interpretation of data; in the writing of the manuscript; or in the decision to publish the results.

Abbreviations

The following abbreviations are used in this manuscript:
MPMicroplastic
μFTIRMicro-Fourier Transform Infrared Spectroscopy
SDStandard Deviation
PC1Pristine Cave 1 (Maucci Cavern)
PC2Pristine Cave 2 (Luftloch)
NPCNon-Pristine Cave (Trebiciano Abyss)

References

  1. PlasticsEurope Market Research Group (PEMRG). Plastics—The Facts 2024; PlasticsEurope, the Association of Plastics Manufacturers: Brussels, Belgium, 2023; Available online: https://www.plasticseurope.org (accessed on 21 August 2025).
  2. Lebreton, L.; Egger, M.; Slat, B. A global mass budget for positively buoyant macroplastic debris in the ocean. Sci. Rep. 2019, 9, 12922. [Google Scholar] [CrossRef]
  3. Hartmann, N.B.; Hüffer, T.; Thompson, R.C.; Hassellöv, M.; Verschoor, A.; Daugaard, A.E.; Rist, S.; Karlsson, T.; Brennholt, N.; Cole, M.; et al. Are We Speaking the Same Language? Recommendations for a Definition and Categorization Framework for Plastic Debris. Environ. Sci. Technol. 2019, 53, 1039–1047. [Google Scholar] [CrossRef]
  4. Frias, J.P.G.L.; Nash, R. Microplastics: Finding a consensus on the definition. Mar. Pollut. Bull. 2019, 138, 145–147. [Google Scholar] [CrossRef] [PubMed]
  5. Winiarska, E.; Jutel, M.; Zemelka-Wiacek, M. The potential impact of nano- and microplastics on human health: Understanding human health risks. Environ. Res. 2024, 251, 118535. [Google Scholar] [CrossRef]
  6. An, L.; Liu, Q.; Deng, Y.; Wu, W.; Gao, Y.; Ling, W. Sources of Microplastic in the Environment. In Microplastics in Terrestrial Environments: Emerging Contaminants and Major Challenges; He, D., Luo, Y., Eds.; Springer International Publishing: Cham, Switzerland, 2020; pp. 143–159. [Google Scholar] [CrossRef]
  7. Rafa, N.; Ahmed, B.; Zohora, F.; Bakya, J.; Ahmed, S.; Ahmed, S.F.; Mofijur, M.; Chowdhury, A.A.; Almomani, F. Microplastics as carriers of toxic pollutants: Source, transport, and toxicological effects. Environ. Pollut. 2024, 343, 123190. [Google Scholar] [CrossRef]
  8. Godoy, V.; Blázquez, G.; Calero, M.; Quesada, L.; Martín-Lara, M.A. The potential of microplastics as carriers of metals. Environ. Pollut. 2019, 255, 113363. [Google Scholar] [CrossRef]
  9. Blackburn, K.; Green, D. The potential effects of microplastics on human health: What is known and what is unknown. Ambio 2022, 51, 518–530. [Google Scholar] [CrossRef]
  10. Sarkar, S.; Diab, H.; Thompson, J. Microplastic Pollution: Chemical Characterization and Impact on Wildlife. Int. J. Environ. Res. Public Health 2023, 20, 1745. [Google Scholar] [CrossRef]
  11. Carbery, M.; O’Connor, W.; Palanisami, T. Trophic transfer of microplastics and mixed contaminants in the marine food web and implications for human health. Environ. Int. 2018, 115, 400–409. [Google Scholar] [CrossRef] [PubMed]
  12. Bora, S.S.; Gogoi, R.; Sharma, M.R.; Anshu; Borah, M.P.; Deka, P.; Bora, J.; Naorem, R.S.; Das, J.; Teli, A.B. Microplastics and human health: Unveiling the gut microbiome disruption and chronic disease risks. Front. Cell. Infect. Microbiol. 2024, 14, 1492759. [Google Scholar] [CrossRef] [PubMed]
  13. Niu, H.; Liu, S.; Jiang, Y.; Hu, Y.; Li, Y.; He, L.; Xing, M.; Li, X.; Wu, L.; Chen, Z.; et al. Are Microplastics Toxic? A Review from Eco-Toxicity to Effects on the Gut Microbiota. Metabolites 2023, 13, 739. [Google Scholar] [CrossRef]
  14. Gateuille, D.; Naffrechoux, E. Transport of persistent organic pollutants: Another effect of microplastic pollution? WIREs Water 2022, 9, e1600. [Google Scholar] [CrossRef]
  15. Kinigopoulou, V.; Pashalidis, I.; Kalderis, D.; Anastopoulos, I. Microplastics as carriers of inorganic and organic contaminants in the environment: A review of recent progress. J. Mol. Liq. 2022, 350, 118580. [Google Scholar] [CrossRef]
  16. Bao, X.; Gu, Y.; Chen, L.; Wang, Z.; Pan, H.; Huang, S.; Meng, Z.; Chen, X. Microplastics derived from plastic mulch films and their carrier function effect on the environmental risk of pesticides. Sci. Total Environ. 2024, 924, 171472. [Google Scholar] [CrossRef]
  17. Shahul Hamid, F.; Bhatti, M.S.; Anuar, N.; Anuar, N.; Mohan, P.; Periathamby, A. Worldwide distribution and abundance of microplastic: How dire is the situation? Waste Manag. Res. 2018, 36, 873–897. [Google Scholar] [CrossRef] [PubMed]
  18. Meng, Y.; Kelly, F.J.; Wright, S.L. Advances and challenges of microplastic pollution in freshwater ecosystems: A UK perspective. Environ. Pollut. 2020, 256, 113445. [Google Scholar] [CrossRef] [PubMed]
  19. Dusaucy, J.; Gateuille, D.; Perrette, Y.; Naffrechoux, E. Microplastic pollution of worldwide lakes. Environ. Pollut. 2021, 284, 117075. [Google Scholar] [CrossRef]
  20. Ramilo-Henry, M.; Umbelina, B.; Matilde, E.; Duncan, E.M. Plastic pollution on remote islands: A baseline study of Príncipe, Gulf of Guinea. Mar. Environ. Res. 2023, 191, 106181. [Google Scholar] [CrossRef]
  21. Hamman, M.; Van Schyff, V.; Choong Kwet Yive, R.N.S.; Iordachescu, L.; Simon-Sánchez, L.; Bouwman, H. Microplastics in coral from three Mascarene Islands, Western Indian Ocean. Mar. Pollut. Bull. 2024, 208, 116951. [Google Scholar] [CrossRef]
  22. Ambrosini, R.; Azzoni, R.S.; Pittino, F.; Diolaiuti, G.; Franzetti, A.; Parolini, M. First evidence of microplastic contamination in the supraglacial debris of an alpine glacier. Environ. Pollut. 2019, 253, 297–301. [Google Scholar] [CrossRef]
  23. Stefánsson, H.; Peternell, M.; Konrad-Schmolke, M.; Hannesdóttir, H.; Ásbjörnsson, E.J.; Sturkell, E. Microplastics in Glaciers: First Results from the Vatnajökull Ice Cap. Sustainability 2021, 13, 4183. [Google Scholar] [CrossRef]
  24. Strokal, M.; Vriend, P.; Bak, M.P.; Kroeze, C.; van Wijnen, J.; van Emmerik, T. River export of macro- and microplastics to seas by sources worldwide. Nat. Commun. 2023, 14, 4842. [Google Scholar] [CrossRef]
  25. Gao, S.; Orlowski, N.; Bopf, F.K.; Breuer, L. A review on microplastics in major European rivers. WIREs Water 2024, 11, e1713. [Google Scholar] [CrossRef]
  26. Veress, M. Karst Types and Their Karstification. J. Earth Sci. 2020, 31, 621–634. [Google Scholar] [CrossRef]
  27. Valentić, L.; Kozel, P.; Pipan, T. Microplastic pollution in vulnerable karst environments: Case study from the Slovenian classical karst region. Acta Carsolog. 2022, 51, 79–92. [Google Scholar] [CrossRef]
  28. Goldscheider, N.; Drew, D. (Eds.) Methods in Karst Hydrogeology: IAH: International Contributions to Hydrogeology; CRC Press: London, UK, 2014; Volume 26, 280p. [Google Scholar]
  29. Silva, A.L.P.; Prata, J.C.; Duarte, A.C.; Soares, A.M.V.M.; Barceló, D.; Rocha-Santos, T. Microplastics in landfill leachates: The need for reconnaissance studies and remediation technologies. Case Stud. Chem. Environ. Eng. 2021, 3, 100072. [Google Scholar] [CrossRef]
  30. Suprayogi, D.; Utama, T.T.; Hadi, M.I.; Agung, T.S.; Rizqiyah, Z. Distribution and Abundance of Microplastics in Underground Rivers in the South Malang Karst Area: First Evidence in Indonesia. JKL 2024, 16, 101–109. [Google Scholar] [CrossRef]
  31. Yasinskii, S.V.; Venitsianov, E.V.; Kashutina, E.A.; Sidorova, M.V.; Ershova, A.A.; Makeeva, I.N. Contribution of microparticles to the transport of pollution by rivers and groundwaters in a large city. IOP Conf. Ser. Earth Environ. Sci. 2021, 834, 012047. [Google Scholar] [CrossRef]
  32. An, X.; Li, W.; Lan, J.; Adnan, M. Preliminary Study on the Distribution, Source, and Ecological Risk of Typical Microplastics in Karst Groundwater in Guizhou Province, China. Int. J. Environ. Res. Public Health 2022, 19, 14751. [Google Scholar] [CrossRef]
  33. Howarth, F.G.; Moldovan, O.T. The Ecological Classification of Cave Animals and Their Adaptations. In Cave Ecology; Moldovan, O.T., Kováč, Ľ., Halse, S., Eds.; Springer International Publishing: Cham, Switzerland, 2018; pp. 41–67. [Google Scholar] [CrossRef]
  34. Delić, T.; Fišer, C. Chapter 113—Species interactions. In Encyclopedia of Caves, 3rd ed.; White, W.B., Culver, D.C., Pipan, T., Eds.; Academic Press: Cambridge, MA, USA, 2019; pp. 967–973. Available online: https://www.sciencedirect.com/science/article/pii/B9780128141243001138 (accessed on 20 September 2025).
  35. Deharveng, L.; Bedos, A.; Pipan, T.; Culver, D.C. Global Subterranean Biodiversity: A Unique Pattern. Diversity 2024, 16, 157. [Google Scholar] [CrossRef]
  36. Mammola, S. Finding answers in the dark: Caves as models in ecology fifty years after Poulson and White. Ecography 2019, 42, 1331–1351. [Google Scholar] [CrossRef]
  37. Zini, L.; Visintin, L.; Peric, B.; Cucchi, F.; Gabrovsek, F. Transboundary Aquifers: Challenges and New Directions: Characterisation of a transboundary karst aquifer: The Classical Karst. In Proceedings of the International Conference “Transboundary Aquifers: Challenges and New Directions”, Paris, France, 6–8 December 2010; Available online: https://www.researchgate.net/publication/228404830 (accessed on 22 September 2025).
  38. Vižintin, G.; Ravbar, N.; Janež, J.; Koren, E.; Janež, N.; Zini, L.; Treu, F.; Petrič, M. Integration of models of various types of aquifers for water quality management in the transboundary area of the Soča/Isonzo river basin (Slovenia/Italy). Sci. Total Environ. 2018, 619–620, 1214–1225. [Google Scholar] [CrossRef] [PubMed]
  39. Bensi, S.; Novak, M.; Otoničar, B.; Calligaris, C.; Cucchi, F.; Zini, L.; Bonini, L.; Barone, V.; Škrjanec, S.; Piano, C. The Classical Karst Geopark; Geological Survey—Central Directorate for Environmental Protection, Energy and Sustainable Development of the Autonomous Region of Friuli Venezia Giulia: Trieste, Italy, 2022. [Google Scholar]
  40. Piccardo, M.; Bevilacqua, S. Lost in the Dark: Current Evidence and Knowledge Gaps About Microplastic Pollution in Natural Caves. Environments 2024, 11, 238. [Google Scholar] [CrossRef]
  41. Balestra, V.; Bellopede, R. Microplastic pollution in show cave sediments: First evidence and detection technique. Environ. Pollut. 2022, 292, 118261. [Google Scholar] [CrossRef]
  42. Luqman, M.; Awan, U.; Arooj, F.; Khalid, M.; Afzaal, M.; Shahid, T.; Niazi, A.; Yang, H.-H.; Khan, S. Exploring microplastic pollution in the pristine Ghar-e-Tangi cave: First evidence from Pakistan’s subterranean ecosystem. Arch. Biol. Sci. 2025, 77, 15–25. [Google Scholar] [CrossRef]
  43. Balestra, V.; Bellopede, R. Explorations in the dark continent: Did microplastics and microfibres get here before us? Sci. Total Environ. 2025, 977, 179328. [Google Scholar] [CrossRef] [PubMed]
  44. Zini, L.; Calligaris, C.; Cucchi, F. Along the hidden Timavo. 90° Congresso della Società Geologica Italiana—Trieste, 14–16 settembre 2021. Geosci. Field Trips 2022, 14, 1–69. [Google Scholar]
  45. Cucchi, F.; Zini, L. Underground Timavo River Monitoring (Classical Karst). Acta Carsolog. 2002, 31, 75–84. [Google Scholar] [CrossRef]
  46. Zini, L.; Calligaris, C.; Zavagno, E. Classical Karst hydrodynamics: A shared aquifer within Italy and Slovenia. Proc. IAHS 2014, 364, 499–504. [Google Scholar] [CrossRef]
  47. Jurkovšek, B.; Biolchi, S.; Furlani, S.; Kolar-Jurkovšek, T.; Zini, L.; Jež, J.; Tunis, G.; Bavec, M.; Cucchi, F. Geology of the Classical Karst Region (SW Slovenia–NE Italy). J. Maps 2016, 12, 352–362. [Google Scholar] [CrossRef]
  48. Braitenberg, C.; Pivetta, T.; Rossi, G.; Ventura, P.; Betic, A. Karst caves and hydrology between geodesy and archeology: Field trip notes. Geod. Geodyn. 2018, 9, 262–269. [Google Scholar] [CrossRef]
  49. Gabrovšek, F.; Peric, B.; Kaufmann, G. Hydraulics of epiphreatic flow of a karst aquifer. J. Hydrol. 2018, 560, 56–74. [Google Scholar] [CrossRef]
  50. Renzi, M.; Blašković, A.; Broccoli, A.; Bernardi, G.; Grazioli, E.; Russo, G. Chemical composition of microplastic in sediments and protected detritivores from different marine habitats (Salina Island). Mar. Pollut. Bull. 2020, 152, 110918. [Google Scholar] [CrossRef]
  51. Bertoli, M.; Pastorino, P.; Anselmi, S.; Bentivoglio, T.; Esposito, G.; Goriup, G.; Elia, A.C.; Prearo, M.; Renzi, M.; Pizzul, E. Microplastic contamination across trophic levels in a lowland spring watercourse of Northwestern Italy: New insights and biomonitoring implications. J. Contam. Hydrol. 2026, 276, 104726. [Google Scholar] [CrossRef]
  52. Fastelli, P.; Blašković, A.; Bernardi, G.; Romeo, T.; Čižmek, H.; Andaloro, F.; Russo, G.F.; Guerranti, C.; Renzi, M. Plastic litter in sediments from a marine area likely to become protected (Aeolian Archipelago’s islands, Tyrrhenian sea). Mar. Pollut. Bull. 2016, 113, 526–529. [Google Scholar] [CrossRef]
  53. Hidalgo-Ruz, V.; Gutow, L.; Thompson, R.C.; Thiel, M. Microplastics in the Marine Environment: A Review of the Methods Used for Identification and Quantification. Environ. Sci. Technol. 2012, 46, 3060–3075. [Google Scholar] [CrossRef] [PubMed]
  54. European Commission; MSFD Technical Subgroup on Marine Litter (Eds.) Guidance on Monitoring of Marine Litter in European Seas; Publications Office: Luxembourg, 2013. [Google Scholar]
  55. Cowger, W.; Booth, A.M.; Hamilton, B.M.; Thaysen, C.; Primpke, S.; Munno, K.; Lusher, A.L.; Dehaut, A.; Vaz, V.P.; Liboiron, M.; et al. Reporting Guidelines to Increase the Reproducibility and Comparability of Research on Microplastics. Appl. Spectrosc. 2020, 74, 1066–1077. [Google Scholar] [CrossRef] [PubMed]
  56. ICRAM. Metodologie Analitiche di Riferimento; Ministero dell’Ambiente e della Tutela del Territorio: Roma, Italy, 2003; p. 122. [Google Scholar]
  57. Entrena, A.; Fornós, J.J.; Auqué, L.F.; Gràcia, F.; Laita, E. Mineralogical and Sedimentological Characterization of the Clay-Rich Sediments from Ases Cave (Cova Dets Ases, Mallorca, Spain): Origin and Classification. Minerals 2022, 12, 1473. [Google Scholar] [CrossRef]
  58. Deer, W.A.; Howie, R.A.; Zussman, J. An Introduction to the Rock-Forming Minerals, 3rd ed.; The Minerological Society: London, UK, 2013; 498p. [Google Scholar]
  59. Shruti, V.C.; Kutralam-Muniasamy, G. Blanks and bias in microplastic research: Implications for future quality assurance. Trends Environ. Anal. Chem. 2023, 38, e00203. [Google Scholar] [CrossRef]
  60. R Core Team. R: A Language and Environment for Statistical Computing 2024; R Foundation for Statistical Computing: Vienna, Austria, 2024; Available online: https://www.R-project.org/ (accessed on 21 August 2025).
  61. Posit. RStudio: Integrated Development Environment for R; Posit Software, PBC: Boston, MA, USA, 2024; Available online: https://www.posit.co (accessed on 21 August 2025).
  62. Wickham, H.; Averick, M.; Bryan, J.; Chang, W.; McGowan, L.D.; François, R.; Grolemund, G.; Hayes, A.; Henry, L.; Hester, J.; et al. Tidyverse: Easily Install and Load the Tidyverse, R package version 2.0.0; R Foundation for Statistical Computing: Vienna, Austria, 2024. Available online: https://www.CRAN.R-project.org/package=tidyverse (accessed on 21 August 2025).
  63. Wickham, H. ggplot2: Elegant Graphics for Data Analysis; Springer: New York, NY, USA, 2016; ISBN 978-3-319-24277-4. [Google Scholar]
  64. Sandrini-Neto, L.; Camargo, M.G. GAD: Analysis of Variance from General Principles, R package version 2.0.1; R Foundation for Statistical Computing: Vienna, Austria, 2023. Available online: https://www.CRAN.R-project.org/package=GAD (accessed on 21 August 2025).
  65. Balestra, V.; Bellopede, R. Microplastics in caves: A new threat in the most famous geo-heritage in the world. Analysis and comparison of Italian show caves deposits. J. Environ. Manag. 2023, 342, 118189. [Google Scholar] [CrossRef]
  66. Balestra, V.; Galbiati, M.; Lapadula, S.; Zampieri, V.; Cassarino, F.; Gajdošová, M.; Barzaghi, B.; Manenti, R.; Ficetola, G.F.; Bellopede, R. Microplastic pollution calls for urgent investigations in stygobiont habitats: A case study from Classical karst. J. Environ. Manag. 2024, 356, 120672. [Google Scholar] [CrossRef]
  67. Balestra, V.; Galbiati, M.; Lapadula, S.; Barzaghi, B.; Manenti, R.; Ficetola, G.F.; Bellopede, R. The problem of anthropogenic microfibres in karst systems: Assessment of water and submerged sediments. Chemosphere 2024, 363, 142811. [Google Scholar] [CrossRef]
  68. Hasenmueller, E.A.; Baraza, T.; Hernandez, N.F.; Finegan, C.R. Cave sediment sequesters anthropogenic microparticles (including microplastics and modified cellulose) in subsurface environments. Sci. Total Environ. 2023, 893, 164690. [Google Scholar] [CrossRef]
  69. Piccardo, M.; Bruschi, R.; Bentivoglio, T.; Anselmi, S.; Renzi, M.; Gardossi, L.; Bevilacqua, S. Quantifying anthropogenic microparticle contamination in cave sediments: Spatial heterogeneity matters. Environ. Pollut. 2025, 386, 127208. [Google Scholar] [CrossRef]
  70. Kovačič, G.; Ravbar, N. A review of the potential and actual sources of pollution to groundwater in selected karst areas in Slovenia. Nat. Hazards Earth Syst. Sci. 2005, 5, 225–233. [Google Scholar] [CrossRef]
  71. Prelovšek, M.; Zupan, H.N. (Eds.) Pressures and Protection of the Underground Karst: Cases from Slovenia and Croatia (Pritiski in Varovanje Podzemnega Krasa: Primeri iz Slovenije in Hrvaške; Pritisci i Zaštita Podzemnog Krša: Primjeri iz Slovenije i Hrvatske); Inštitut za Raziskovanje Krasa ZRC SAZU: Postojna, Slovenia, 2011. [Google Scholar]
  72. Russell, C.E.; Fernández, R.; Parsons, D.R.; Gabbott, S.E. Plastic pollution in riverbeds fundamentally affects natural sand transport processes. Commun. Earth Environ. 2023, 4, 255. [Google Scholar] [CrossRef] [PubMed]
  73. Baraza, T.; Hasenmueller, E.A. Floods enhance the abundance and diversity of anthropogenic microparticles (including microplastics and treated cellulose) transported through karst systems. Water Res. 2023, 242, 120204. [Google Scholar] [CrossRef]
  74. Lahon, J.; Handique, S. Impact of flooding on microplastic abundance and distribution in freshwater environment: A review. Environ. Sci. Pollut. Res. Int. 2023, 30, 118175–118191. [Google Scholar] [CrossRef]
  75. Beaumont, H.; Ockelford, A.; Morris-Simpson, P. Sand bed river dynamics controlling microplastic flux. Sci. Rep. 2024, 14, 29420. [Google Scholar] [CrossRef] [PubMed]
  76. Chen, H.; Cheng, Y.; Wang, Y.; Ding, Y.; Wang, C.; Feng, X.; Fan, Q.; Yuan, F.; Fu, G.; Gao, B.; et al. Microplastics: A potential proxy for tracing extreme flood events in estuarine environments. Sci. Total Environ. 2024, 918, 170554. [Google Scholar] [CrossRef] [PubMed]
  77. Miranda-Peña, L.; Buitrago-Duque, L.; Rangel-Buitrago, N.; Gracia, C.A.; Arana, V.A.; Trilleras, J. Geographical heterogeneity and dominant polymer types in microplastic contamination of lentic ecosystems: Implications for methodological standardization and future research. RSC Adv. 2023, 13, 27190–27202. [Google Scholar] [CrossRef] [PubMed]
  78. Andrady, A.L. Persistence of Plastic Litter in the Oceans. In Marine Anthropogenic Litter; Springer: Berlin/Heidelberg, Germany, 2015; pp. 57–72. [Google Scholar]
  79. Dhaka, V.; Singh, S.; Anil, A.G.; Sunil Kumar Naik, T.S.; Garg, S.; Samuel, J.; Kumar, M.; Ramamurthy, P.C.; Singh, J. Occurrence, toxicity and remediation of polyethylene terephthalate plastics. A review. Environ. Chem. Lett. 2022, 20, 1777–1800. [Google Scholar] [CrossRef] [PubMed]
  80. Patterson, J.; Jeyasanta, K.I.; Sathish, M.N.; Booth, A.M.; Laju, R.L.; Emeralda, V.G.; Sudhakar, B.J. Impact of flooding events on microplastic distribution from rivers to coastal areas: A case study from Tuticorin, Southeast India. Mar. Pollut. Bull. 2025, 221, 118471. [Google Scholar] [CrossRef] [PubMed]
Figure 1. Study area (downside inserts) and planimetric survey of the known Timavo underground system in the Classic Trieste Karst, northeastern Italy (45.6852° N, 13.8336° E, WGS84). Red areas indicate the mapped course of the Timavo River and its caves. The purple line marks the Italy–Slovenia state border. Black circles highlight the speleological sites under study: Trebiciano Abyss (non-pristine cave, NPC), Maucci Cavern (pristine cave 1, PC1), and Luftloch Cave (pristine cave 2, PC2). Blue arrows indicate the main flow direction of the underground Timavo River within the cave system.
Microplastics 05 00024 g001
Figure 2. Cross-sectional cave profiles showing elevation-based sampling points in (a) Maucci Cavern (PC1), (b) Trebiciano Abyss (NPC), and (c) Luftloch Cave (PC2). Red dots indicate sediment sampling stations classified as low (L), medium (M), and high (H), based on river water level. Blue arrows indicate the main flow direction of the underground Timavo River within the cave system. Cave surveys by P. Guglia, modified from original maps available through the Speleological Cadastre of Friuli Venezia Giulia (https://catastogrotte.regione.fvg.it/).
Microplastics 05 00024 g002
Figure 3. Mean microplastic abundances (items kg−1, ±SD, n = 2) in sediment samples collected at three river-to-slope stations (low, medium, high) in pristine (PC1 and PC2) and non-pristine (NPC) caves.
Microplastics 05 00024 g003
Figure 4. Microplastic characteristics in cave sediments across elevation stations (low–medium–high, indicated on the x-axis) for the three investigated systems (PC1, PC2, NPC). (a) Polymer composition (PP, PE, PET) expressed as the percentage of particles per station. (b) Color distribution (black, blue, white). (c) Shape distribution (fragments, fibers). (d) Mean particle size (µm, log scale) with error bars showing ±SD.
Microplastics 05 00024 g004
Table 1. Mean (±SD) concentrations (items kg−1, dry weight), polymer composition (polypropylene, PP; polyethylene terephthalate, PET; polyethylene, PE), particle shapes (filament, fragment), color distribution (white, blue, black), and mean particle size (µm) for NPC (Trebiciano Abyss), PC1 (Maucci), and PC2 (Luftloch). Values are averaged across samples within each cave; percentages indicate relative abundances within each cave.
NPCPC1PC2
MPs (items kg−1)84.7 ± 58.4105.9 ± 53.691.8 ± 51.3
PP29.2%40%42.3%
PE25%26.7%19.2%
PET45.8%33.3%38.5%
Fibers54.2%53.3%42.3%
Fragments45.8%46.7%57.7%
White45.8%30%46.2%
Blue33.3%36.7%34.6%
Black20.8%33.3%19.2%
size (mean ± SD, µm)134.6 ± 62.8151.8 ± 66.9132.3 ± 64.1
Table 2. Results of ANOVA on MP abundance testing for differences among caves and stations. For SNK tests, all pairwise comparisons were significant at p < 0.01.
Source of Variationd.f.SSMSFp
Cave = Ca21047.0523.53.500.075
Station = St243,540.021,770.0145.230.000
Ca × St4748.0187.01.250.357
Residuals91347.0149.7
SNK tests for factor stationlow < medium < high
Table 3. Characteristics of microplastic particles detected in field blanks and comparisons with cave sediment samples. Reported are particle shape, polymer type, color, and size (µm) for each blank sample collected during fieldwork in Luftloch (PC2) and Trebiciano (NPC) caves. The “Match” column indicates whether identical particles (same cave, station, polymer, color, and shape) were also identified in corresponding sediment samples and subsequently subtracted from the dataset (−10.6 items kg−1 per matched particle).
CaveStationShapePolymerColorSize (µm)Match
LuftlochHighFiberPEBlack83.2Yes
LuftlochHighFiberPETBlue45.4No
LuftlochLowFiberPEBlack204No
LuftlochLowFiberPEWhite223.7Yes
LuftlochMediumFiberPEWhite125.1Yes
LuftlochMediumFiberPPBlack71.3No
TrebicianoHighFragmentPETWhite103.9Yes
TrebicianoLowFiberPETBlue101.2No
TrebicianoMediumFiberPPBlue261No
Disclaimer/Publisher’s Note: The statements, opinions and data contained in all publications are solely those of the individual author(s) and contributor(s) and not of MDPI and/or the editor(s). MDPI and/or the editor(s) disclaim responsibility for any injury to people or property resulting from any ideas, methods, instructions or products referred to in the content.