Article

Pollution Sources, Distribution, and Health Risks of Microplastic in Road Dust of Industrial, Peri-Urban Areas and Capital City of Bangladesh


1
Graduate School of Science and Engineering, Saitama University, 255 Shimo-Okubo, Sakura-ku, Saitama 338-8570, Japan
2
Bangladesh Institute of Nuclear Agriculture (BINA), BAU Campus, Mymensingh 2202, Bangladesh
*
Authors to whom correspondence should be addressed.
Microplastics 2025, 4(4), 73; https://doi.org/10.3390/microplastics4040073
Submission received: 25 June 2025 / Revised: 28 July 2025 / Accepted: 5 September 2025 / Published: 9 October 2025

Abstract

Microplastic (MP) pollution in urban areas is a growing global concern due to its health risks and environmental effects. This study investigates the sources, spatial distribution, and health risks of MPs in road dust across industrial, capital city, and peri-urban areas of Bangladesh. Street dust samples were collected from 15 heavily congested traffic sites across Dhaka and its surrounding areas. The samples were analyzed using fluorescence microscopy and Fourier Transform Infrared (FTIR) spectroscopy to identify MP types and their morphological characteristics. We have identified six types of polymers, including Polyvinyl alcohol (PVA), Polyethylene (PE), Polypropylene (PP), Polystyrene (PS), Low-Density Polyethylene (LDPE) and High-Density Polyethylene (HDPE), with industrial areas exhibiting the highest levels of MPs followed by capital city and peri-urban zones. PP was the most prevalent MP polymer, with the highest level in industrial areas (14.1 ± 1.7 MPs/g), followed by capital city (9.6 ± 1.92 MPs/g) and peri-urban areas (7.2 ± 1.56 MPs/g). Principal Component Analysis (PCA) identified traffic emissions, industrial activities, and mismanaged plastic waste as the primary sources of MPs. Health risk evaluations indicated that children are more susceptible to MP exposure through ingestion and inhalation, with industrial areas posing the highest carcinogenic risk. The findings underscore the pressing demand for better waste management systems and stricter regulatory measures to mitigate MP pollution and safeguard public health in urban environments. Addressing these challenges is essential to reduce the growing threat of MPs and their long-term effects on ecosystems and human well-being.

1. Introduction

Bangladesh continues to grapple with severe air pollution, with its capital city, Dhaka, consistently ranking among the most polluted urban areas globally [1]. In 2023, Dhaka’s air quality reached alarming levels, with the Air Quality Index (AQI) soaring to 248 on December 23, classifying it as ‘very unhealthy’ and posing significant health risks to residents [2]. The primary contributors to this pollution include vehicular movement, particularly from diesel-powered vehicles, industrial activities, brick kilns, road dust and construction sites [3]. In recent years, street dust has emerged as a critical source of air pollution, raising serious concerns for atmospheric composition. It contains hazardous components such as heavy metals, polycyclic aromatic hydrocarbons (PAHs), MPs, and other toxic substances, originating from numerous sources, including vehicle driven pollutants, urban debris and industrial discharges [4,5,6]. The risk of airborne dust particles to human health is closely related to their size, with smaller particles posing the highest risk [7].
MP contamination has become a mounting worldwide environmental issue, with recent studies underscoring possible effects on human health [8]. MPs, which are plastic fragments smaller than 5 mm, have been identified as a pervasive pollutant, affecting terrestrial, aquatic, and atmospheric systems [9]. Street dust acts as a reservoir for MP accumulation, primarily due to atmospheric deposition, vehicle-driven pollutants, tire and road wear particles, and plastic litter [10]. The rapid urbanization and industrialization in developing countries, including Bangladesh, have intensified environmental pollution, with MPs emerging as a critical pollutant [11]. Dhaka, as the capital city, serves as the epicenter of industrial and vehicular activities, contributing significantly to MP generation and deposition [12]. Industrial zones are sometimes characterized by heavy manufacturing practices, which can cause a release of substantial quantities of MPs into the environment [13]. In contrast, peri-urban areas, with increasing urban sprawl and limited infrastructure, also contribute to and suffer from the spread of microplastic pollution through improper disposal of plastic waste [14]. Recent studies have revealed a distinct spatial variation in MP concentrations across different urban settings, with industrial zones exhibiting higher levels compared to residential and peri-urban areas [15]. MPs in road dust not only degrade the local environment but also pose serious health risks, as these particles can enter the human body through inhalation and ingestion [16]. It is estimated that humans ingest approximately 39,000 to 52,000 MP particles annually, with higher ingestion rates in children [17] due to their hand-to-mouth behavior. MP exposure via ingestion and inhalation raises concerns regarding potential toxicity and long-term health effects. Studies have shown that inhaled MPs can penetrate deep into the respiratory system, leading to inflammation and oxidative stress [18]. Inhalation is the main route of exposure [19] and ingested MPs may accumulate in the gastrointestinal tract [20].
Given the increasing recognition of MP pollution and its implications, this study aims to investigate the sources, spatial distribution, and health effects of MPs in road dust from industrial zones, Dhaka city, and surrounding peri-urban areas of Bangladesh. By employing advanced analytical techniques followed by Rabin et al. [12] and spatial mapping, this research seeks to fill critical knowledge gaps, offering a comprehensive understanding of MP pollution in these diverse settings. The findings are expected to inform policymakers and stakeholders to develop targeted mitigation strategies, ensuring a sustainable urban environment and safeguarding public health.

2. Materials and Methods

2.1. Sample Collection Site

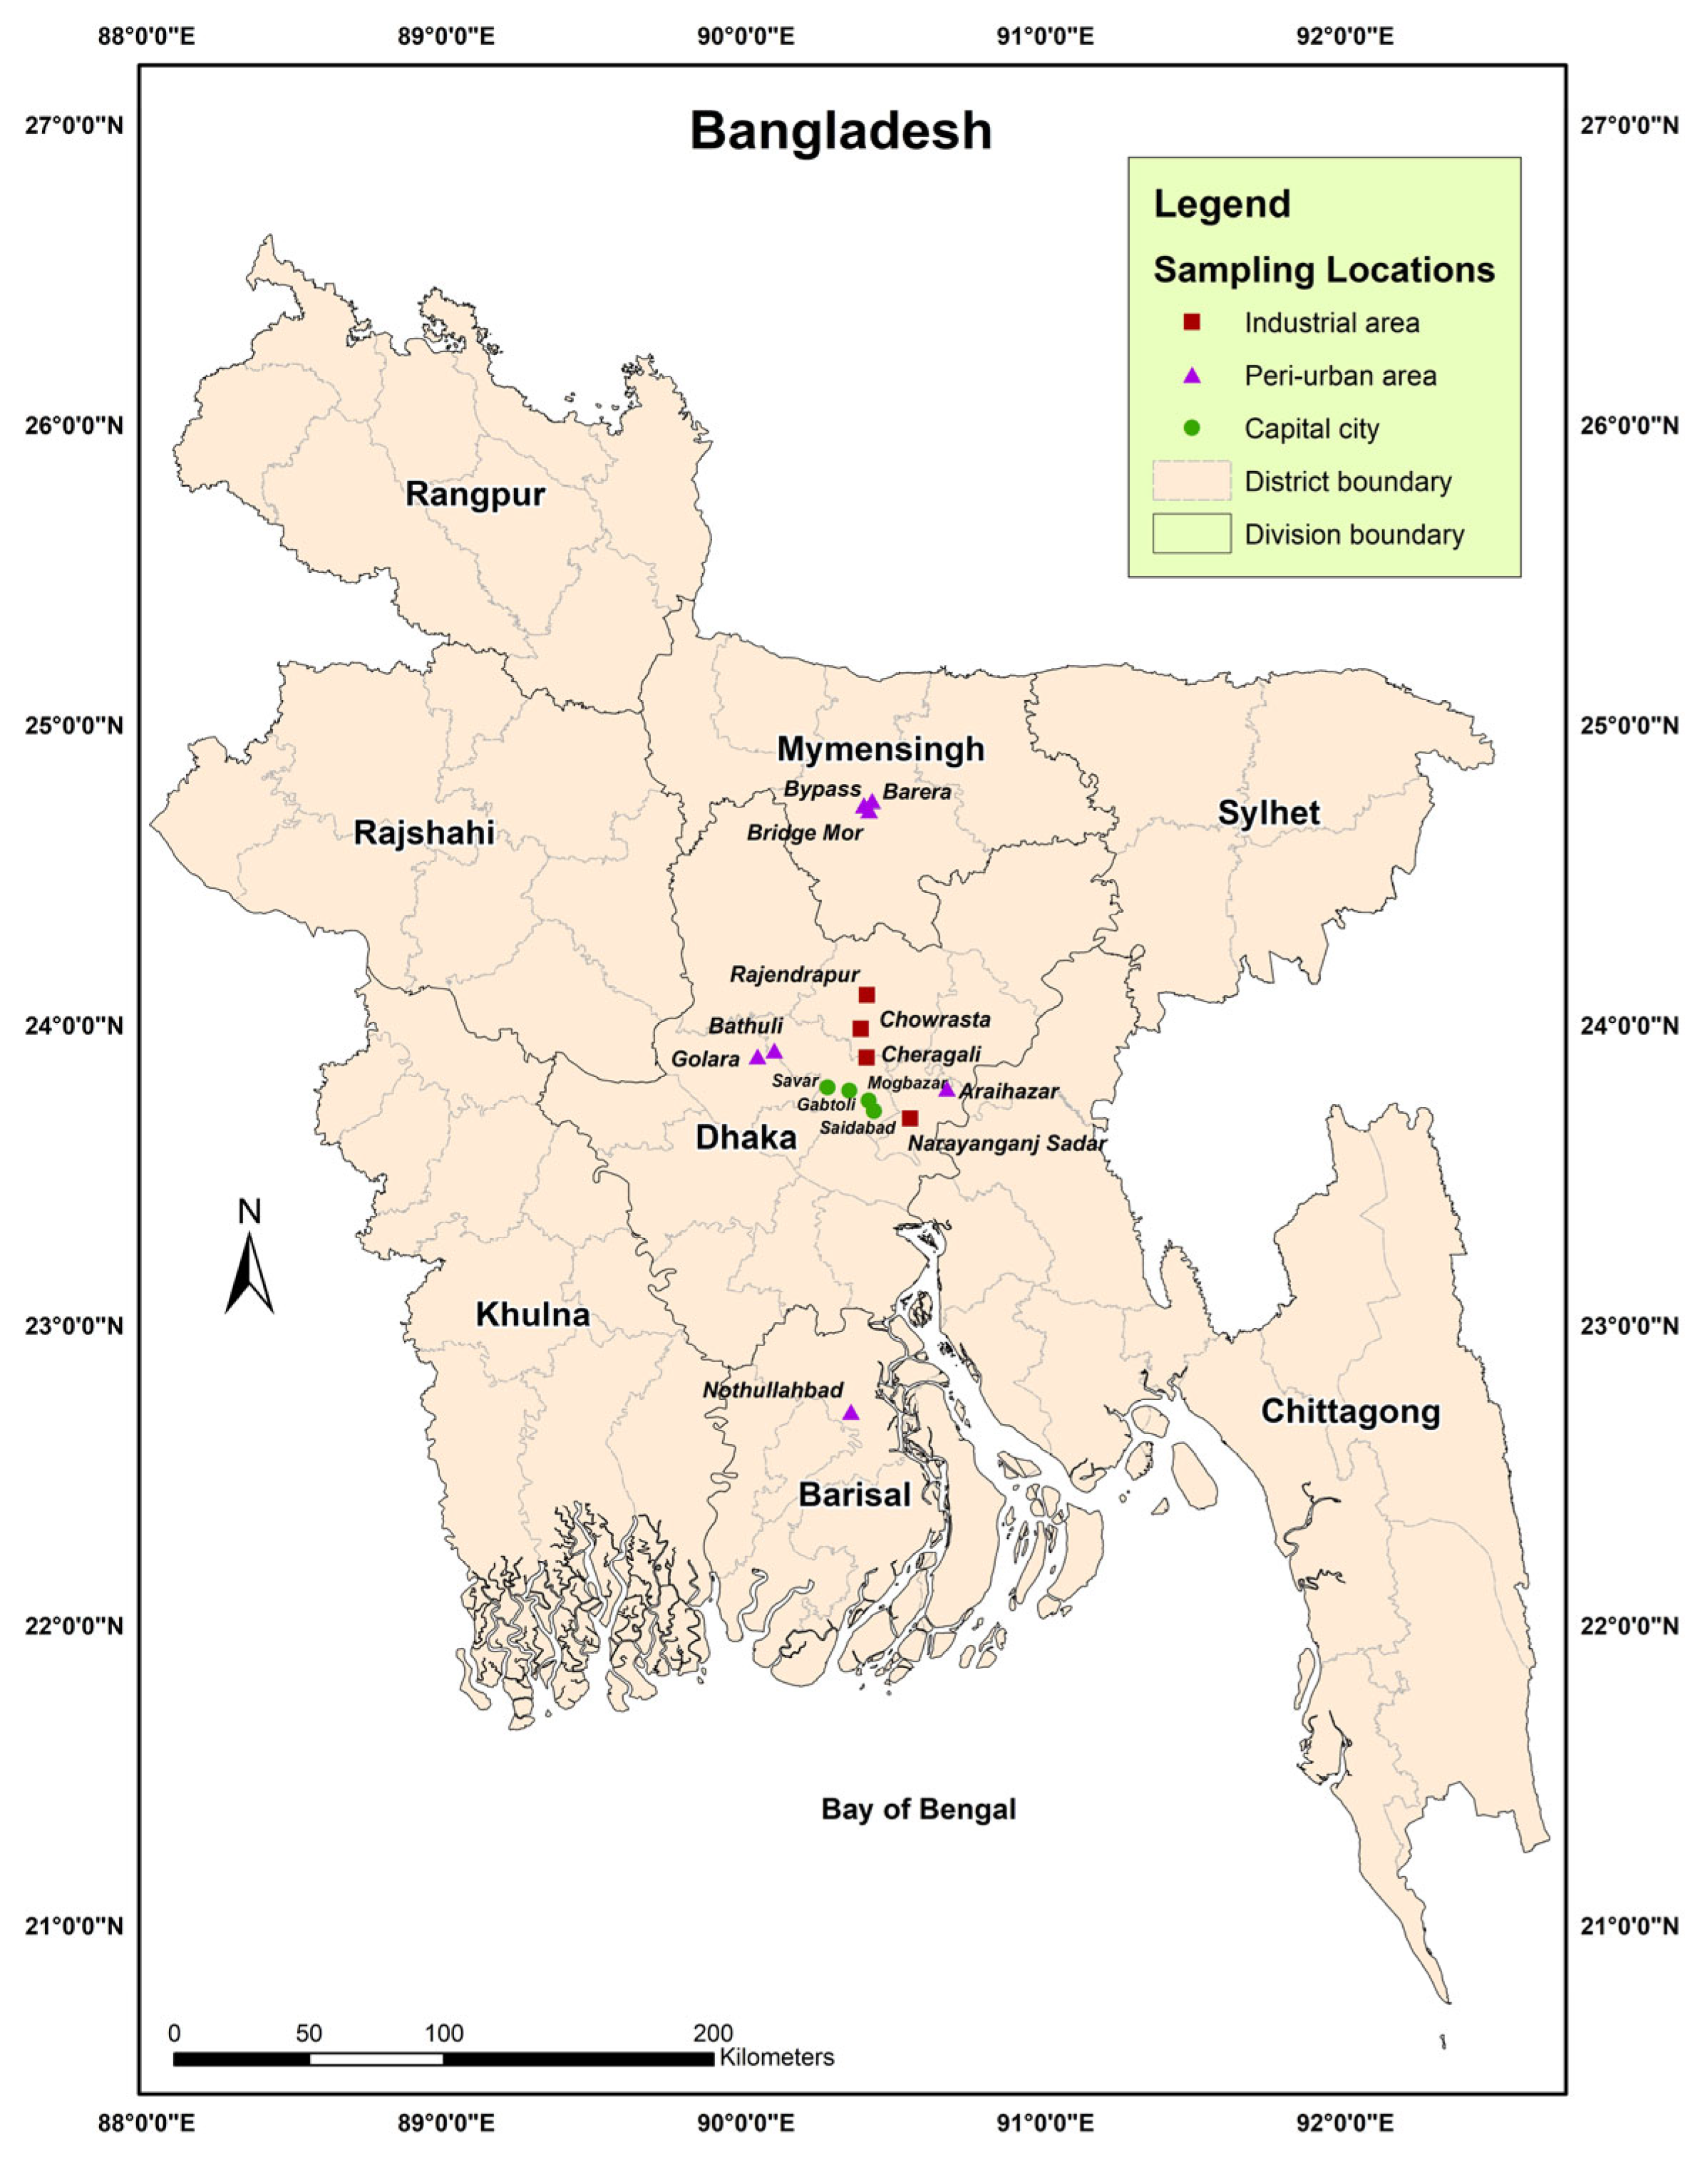
The study was conducted in and around Dhaka, the capital of Bangladesh (Figure 1), focusing on three distinct zones: capital city, industrial, and peri-urban areas. Industrial zones included key locations such as Narayanganj, Cheragali Tongi, Rajendrapur Gazipur, and Gazipur Chowrasta. Urban areas encompassed major transit hubs in Gabtoli bus stand, Saidabad, Savar and Mogbazar. Peri-urban regions include Manikganj, Mymensingh Bypass, Bathuli Manikgonj, Mymensingh Bridge, Sadar, Manikganj, Barera, Araihazar in Narayanganj, and Nothullahban Barishal. The topography of the region is predominantly flat, with elevations ranging from 0.5 to 12 m above sea level [21]. Situated in a tropical monsoon climate, Bangladesh experiences high temperatures, significant humidity, and pronounced seasonal rainfall variations [22], although spatial climatic differences across the country are minimal. The climate is divided into four seasons: a dry and cool winter (December to February), a hot pre-monsoon summer (March to May), a humid and rainy monsoon (June to September), and a transitional post-monsoon autumn (October to November) [23]. During the pre-monsoon summer (March–May), temperatures in Bangladesh peak, often exceeding 35 °C, while the monsoon season (June–September) brings heavy rainfall. According to 2022, the populations of the studied areas were approximately 10.22 million in Dhaka, 2.67 million in Gazipur, 0.58 million in Mymensingh, 0.97 million in Narayanganj, and 0.42 million in Barishal [24]. Dhaka, the most urbanized area in the country, has approximately 1.81 million vehicles [25]. Notably, according to Bangladesh road and Transport Authority (BRTA), 40% of the buses are not fit for operation [26]. The region faces challenges such as unplanned urbanization, unregulated construction debris, and extensive roadwork activities, which are particularly problematic during the monsoon season [27].

2.2. Sampling and Processing of Road Dust

In 2023, during the humid and rainy monsoon period from June to September [22], road dust samples were collected from 15 heavily congested locations across various regions of Bangladesh. This period corresponds to the monsoon season, which is marked by intense rainfall, high humidity, and increased surface runoff. Such environmental conditions significantly influence the transport and deposition of pollutants, including heavy metals and microplastics. Therefore, sampling during this season allows for a representative assessment of road dust contamination under peak wet-weather conditions, when atmospheric deposition and surface loading are typically highest. Representative samples of deposited road dust were collected once from each location. The sampling sites were divided into 3 functional zones: capital city, industrial and peri-urban areas. At every location, dust was gathered using a wooden brush and a metal dustpan by sweeping along both sides of the street, covering roads, sidewalks, and gutters [28]. Approximately 500 g of dust was collected from a randomly selected 1 m2 area at each location (Figure 2). At each site, five sub-samples were collected, combined into a composite sample to ensure representativeness, and stored in labeled aluminum foil. The samples were sealed and transported to BINA substation in Barishal, Bangladesh where they were air-dried for one week. After drying, the samples were sieved through a 2 mm mesh to remove debris and small stones. Further processing was conducted at the Pollution Control Laboratory of Saitama University in Japan. A Retsch AS 200-digit vibrating sieve shaker was used to fractionate particles ≤500 µm, with the amplitude set to 60 Hz and the shaker operated for 20 min. The fine particles of road dust obtained were then analyzed for MP detection.

2.3. Road Dust Sample Pretreatment

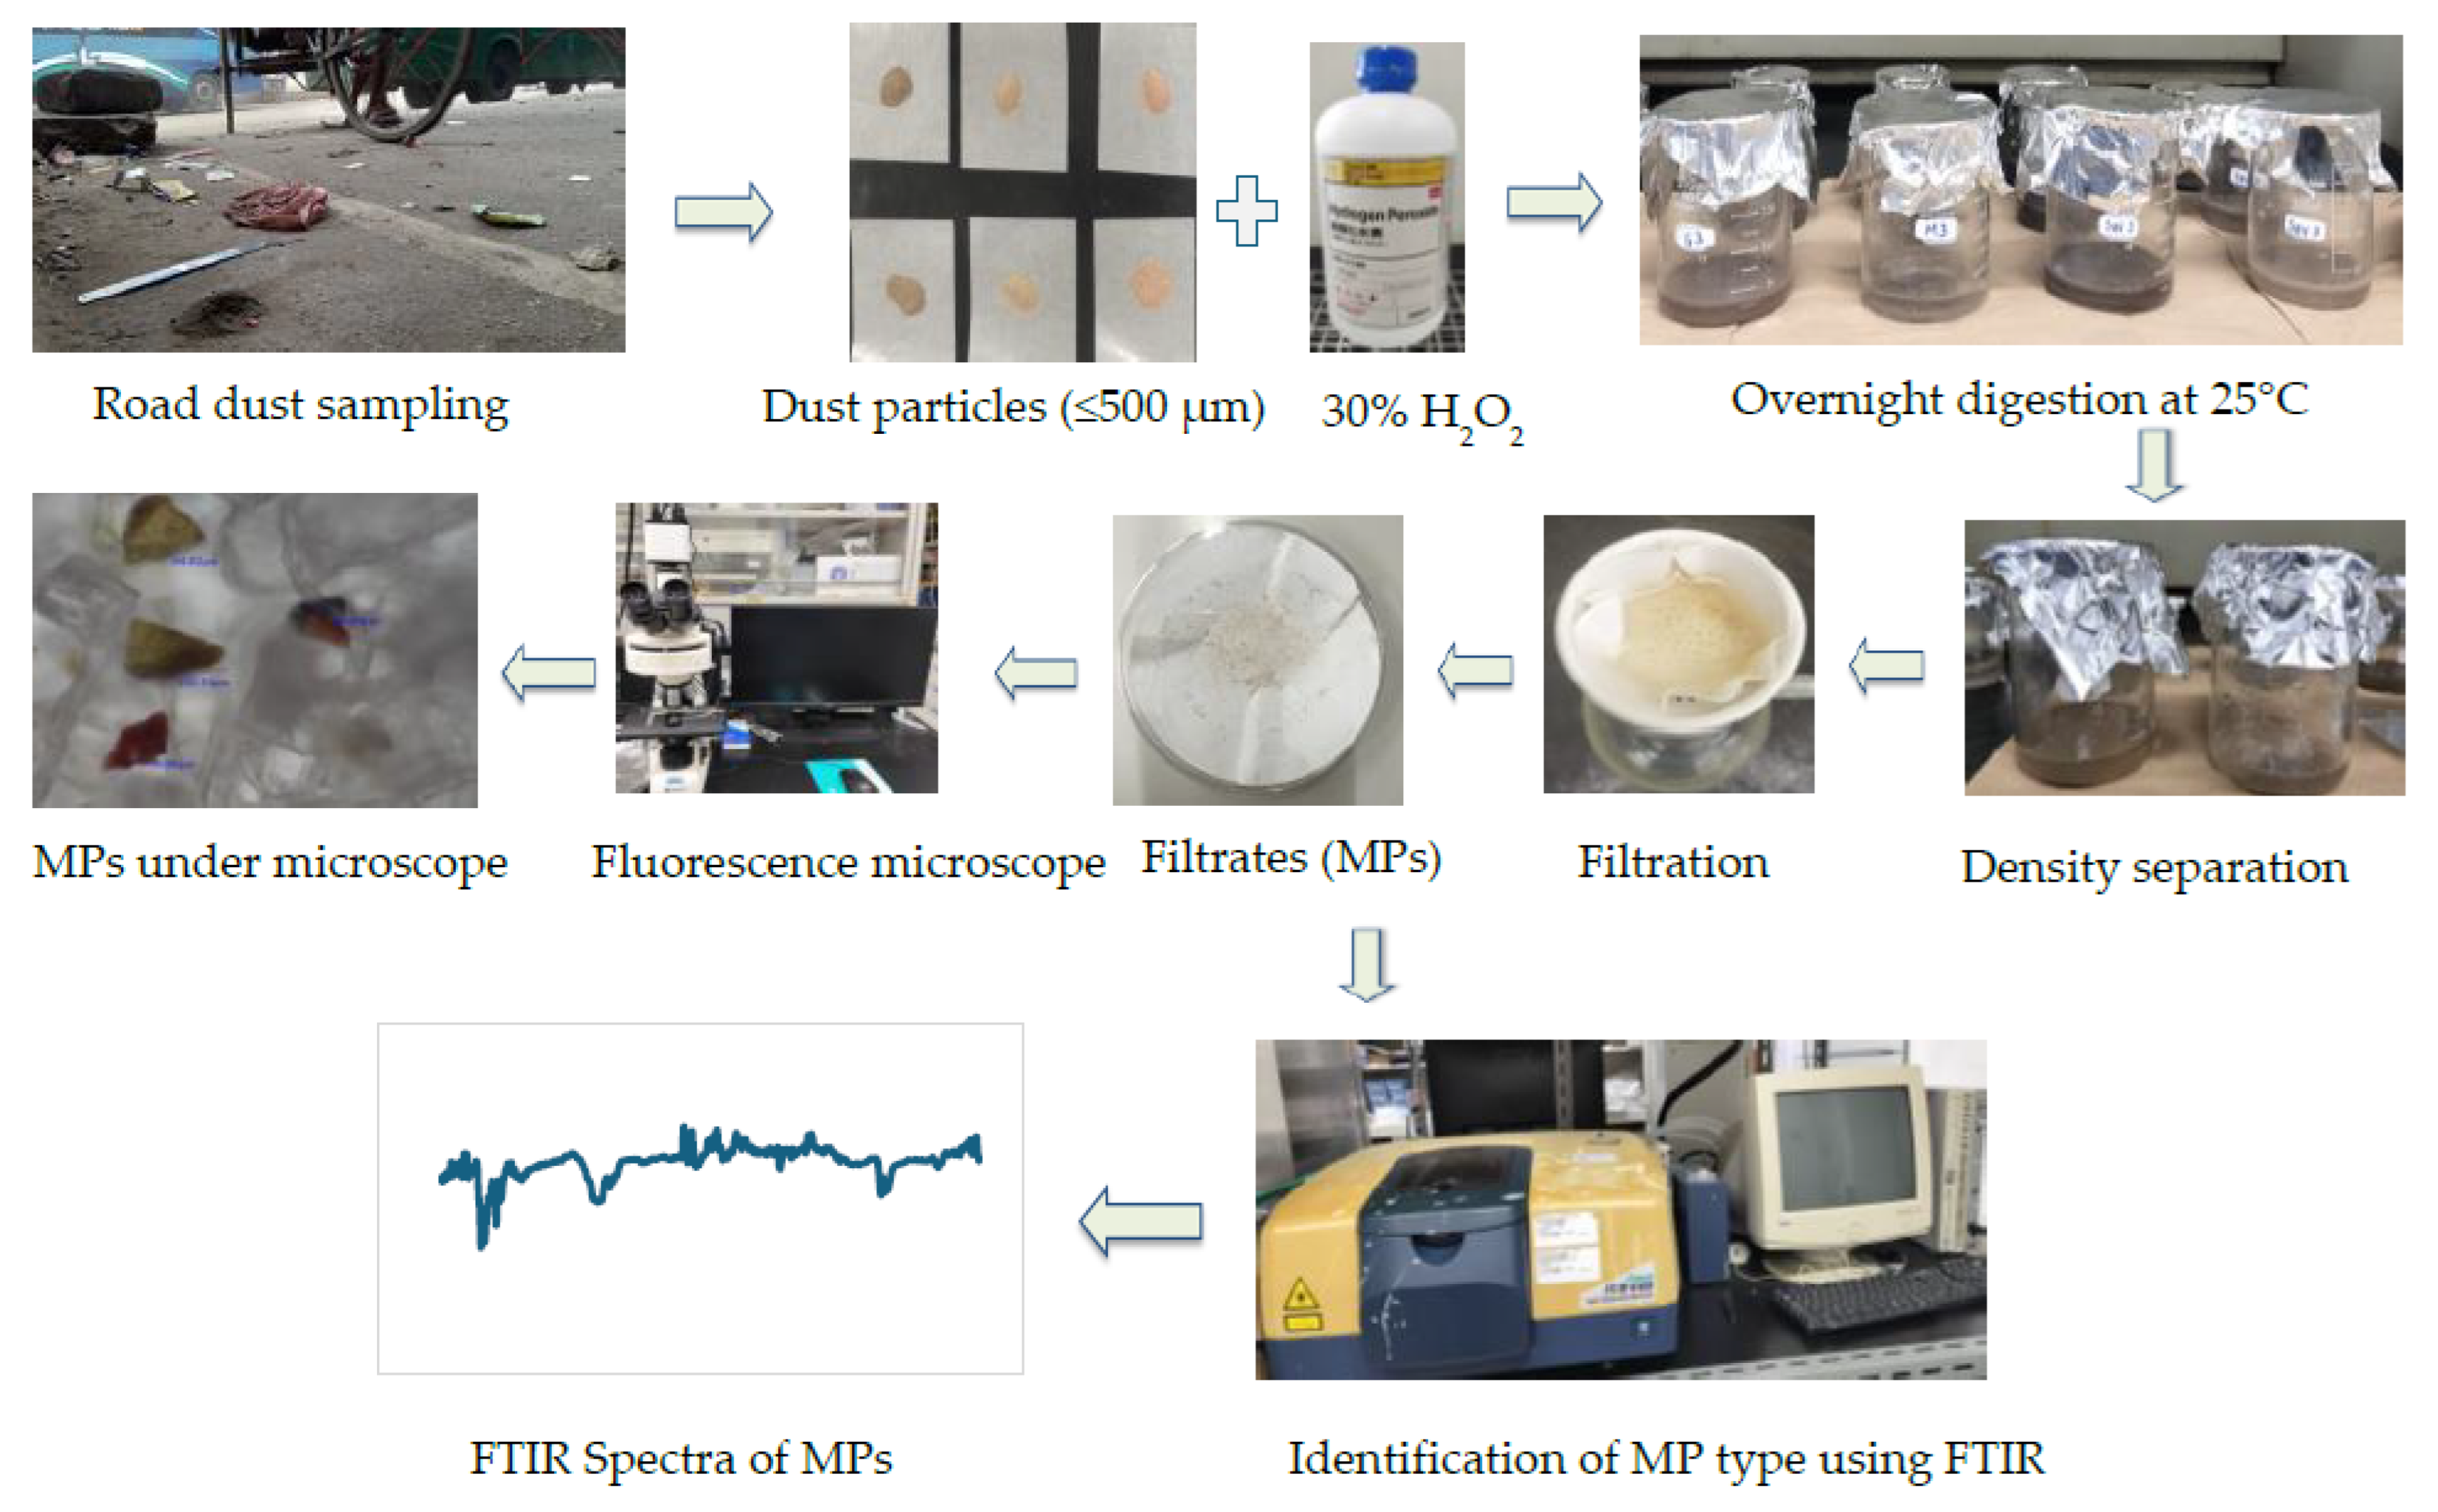
The pretreatment process commenced with the oxidation of organic materials in the samples with a 30% hydrogen peroxide (H2O2) solution. Initially, 20 mL of H2O2 was added to 1 g of dry road dust sample and allowed to react for 12 h at 25 °C in a 40 mL beaker to break down the organic content (Figure 3). Following the oxidation process, the samples were filtered to eliminate any residual H2O2. The oxidized samples were filtered using a 100 µm mesh sieve to eliminate larger particles after oxidation. For density separation, 20 mL of a sodium chloride (NaCl) solution with a density of 1.2 g/cm3 was added to the sieved samples. The mixture was left undisturbed for 2 h to aid in the separation of low-density microplastic particles. The supernatant containing these floated particles was carefully decanted into a clean beaker. This density separation process was repeated three times to ensure complete extraction. The isolated particles were then filtered using a track-etched polycarbonate filter paper with a diameter of 47 mm and a pore size of 5 µm. Finally, the filtered particles were dried in a desiccator for 24 h before further analysis [29].

2.4. Characterization and Quantification

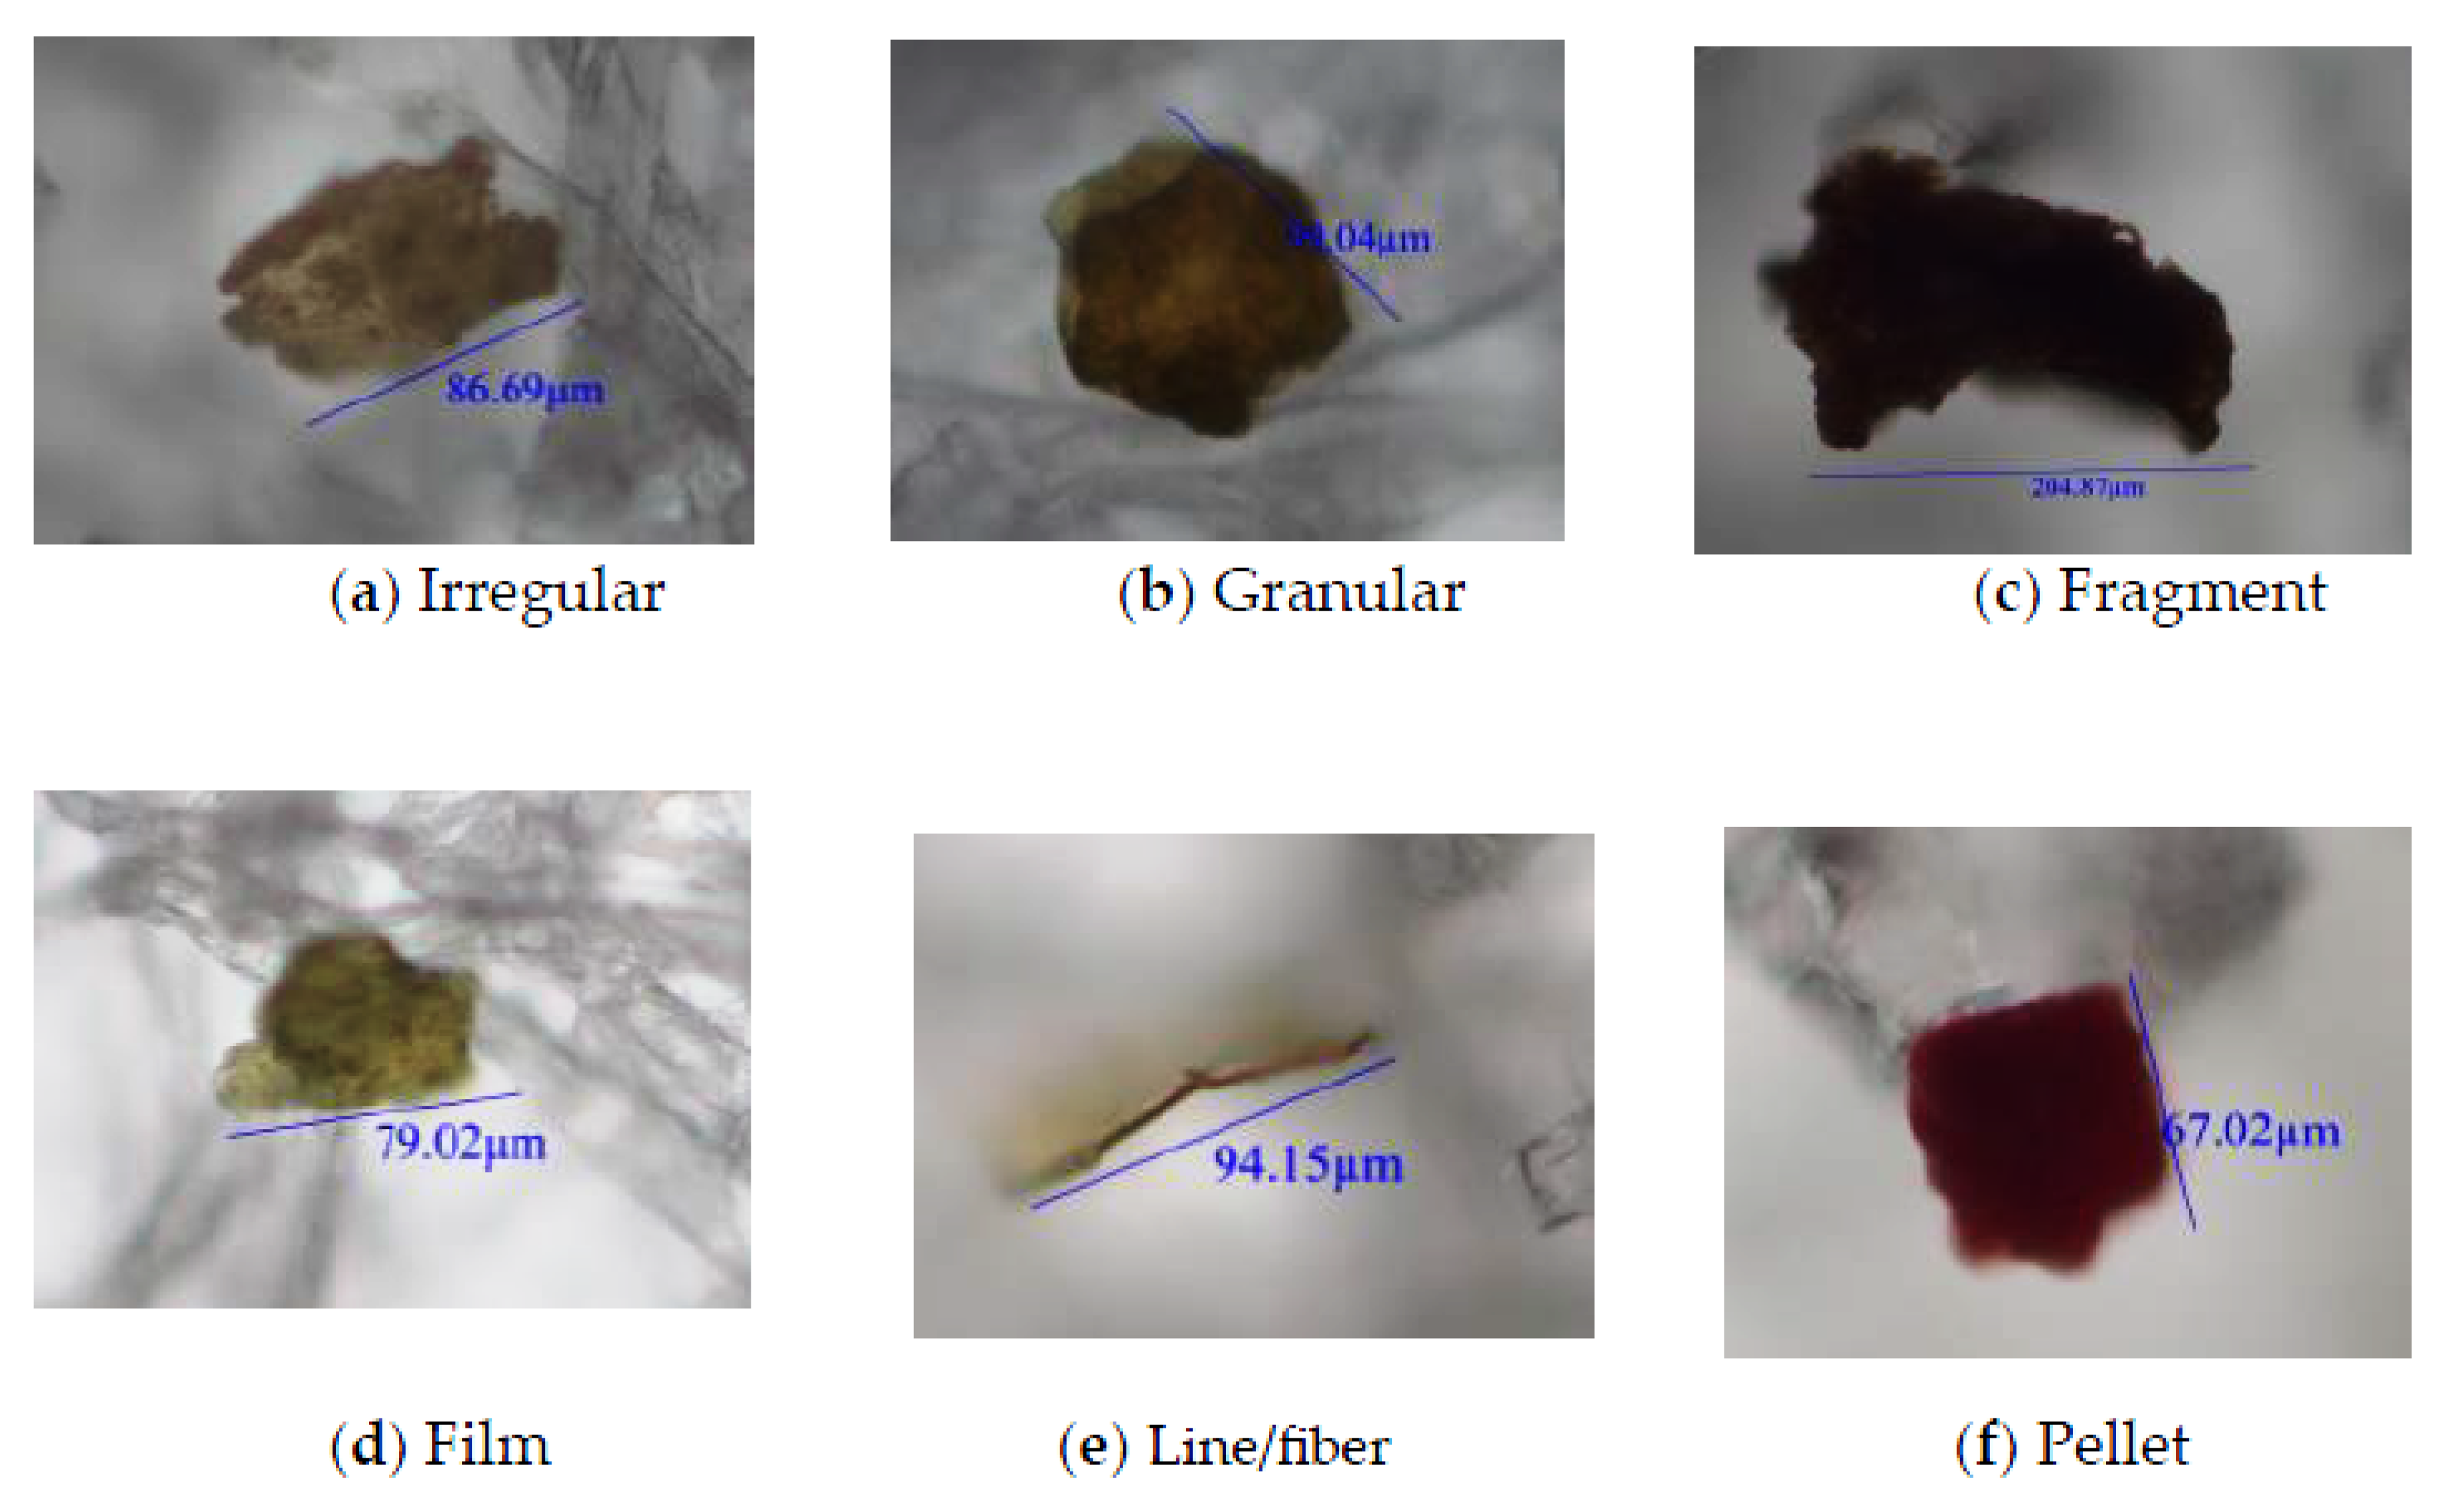
MP particles were counted under a fluorescence microscope at 10× magnification, and the number of particles was normalized to the initial weight of sieved road dust (<500 µm) used for extraction, not to the weight of the post-extraction sediment. All visible particles on each filter were examined in quadrants and counted manually. MPs smaller than 5 µm may have escaped filtration and are not included in the analysis. This method ensures consistency and comparability of MP concentrations across all sampling sites. Fiber-type MPs were identified based on elongated shape and high aspect ratio; film-type MPs were flat and thin with irregular edges. Thickness was estimated visually using the calibrated microscope scale. Detailed images were obtained through morphological analysis using a fluorescence microscope (Moticam4000, Meiji Techno, Tokyo, Japan). To identify the types of MPs, Fourier Transform Infrared (FTIR) spectroscopy (IR-6100, JASCO Co., Ltd., Hachioji, Tokyo, Japan) was employed to measure the functional groups. Microplastic particles were identified and manually counted under a fluorescence microscope at 10× magnification based on visual characteristics such as shape and color. The MPs were categorized into 6 different types—irregular, granular, fiber/line, fragment, film, and pellet—based on their shape.

2.5. Health Risk Assessment of MPs

2.5.1. Microplastic Risk Indices

Risk indices of MPs in road dust samples were calculated following the method proposed by Enyoh et al. [30], using polymer-specific hazard scores (Sj) derived from Lithner et al. [31]. The polymers identified in this study and their associated hazard scores are shown below (Table 1).
Polymers such as polychloroprene, PDMS, cellulose, and unidentified fibers were excluded from the calculations due to lack of toxicity data. The polymer-specific risk index (pRi) for each sample and the geometric mean area risk index (pRarea) were computed using the following equations:
pRi = ∑ (Pi/Pt × Sj)
pRarea = (pR1 × pR2 × pR3 × × pRn)1/n
where:
Pi = quantity of each polymer type;
Pt = total polymer count in the sample;
Sj = hazard score for polymer j;
pRi = risk index for a sample;
pRarea= area-based cumulative risk index.

2.5.2. Estimated Average Daily Intake (EDI) of MPs

Exposure to MPs occurs primarily through ingestion and inhalation. The average daily dose (ADD) for each pathway was calculated using the following equations based on the U.S. EPA health risk model and adapted from Christian et al. [32]:
A D D i n g = MPs × I n g R × E F × E D B W × A T × 10 6
A D D i n h = M P s × I n h R × E F × E D P E F × B W × A T
where:
MPs = number of microplastic particles per gram of dust;
IngR, InhR = ingestion and inhalation rates;
EF = exposure frequency;
ED = exposure duration;
BW = body weight;
AT = averaging time;
PEF = particle emission factor.
All parameter values were taken from standard references and are detailed in Table 2 of this study.

2.5.3. Cancer Risk Assessment of MPs

Cancer risk was estimated based on the lifetime average daily dose (LADD) and the cancer slope factor (CSF) of each polymer. The LADD was calculated separately for ingestion and inhalation using the following equations [33,34]:
L A D D i n g = M P s × E F A T × I n g R c h i l d × E D c h i l d B W c h i l d + I n g R a d u l t × E D a d u l t B W a d u l t × 10 6
L A D D i n h = M P s × E F A T × P E F × I n h R c h i l d × E D c h i l d B W c h i l d + I n h R a d u l t × E D a d u l t B W a d u l t
The carcinogenic risk (CR) for each pathway and the cumulative carcinogenic risk (CCR) were calculated as:
CRingestion = LADDing × CSFing
CRinhalation = LADDinh × CSFinh
CCR = ∑ CR = CRingestion + CRinhalation
These values represent the lifetime probability of developing cancer due to a unit daily intake or inhalation of each substance. CSF values for PE, HDPE, PP, LDPE were 1.02, 1.02, 0.24, 1.02, respectively [31]. The CCR values were used to estimate total cancer risk due to MP exposure in industrial, capital city, and peri-urban areas.
Table 2. Factors for MPs’ daily intake and health risk assessment from street dust.
ParameterDescription and Measurement UnitUnitsValues for ChildValues for AdultReferences
InhRInhalation ratem3/day7.6312.8[35]
PEFParticle emission factorm3/g1.36 × 1061.36 × 106[36]
IngRIngestion rateg/day0.20.1[36]
EFFrequency of exposuresdays/year180180[37]
EDDuration of exposuresyears624[34]
ATnon-cancerAverage period for non-carcinogensdaysED × 365ED × 365[38]
ATcancerAverage period for carcinogensdays70 × 36570 × 365[38]
BWBody weight averageg16,20061,800[39]
MPsNumber of MP polymersparticles/gThis study -

2.6. Quality Control

To prevent contamination of MPs, a metal brush and pan were used for sample collection. The samples were handled in a plastic-free environment during cleaning, drying, and crushing, and were preserved in aluminum foil. All equipment used in the analysis was free of plastic, thoroughly cleaned, rinsed, sonicated, dried in an oven, and wrapped in aluminum foil to prevent contamination. Type 1 (Ultrapure) was used for creating the NaCl solution and washing the equipment. Rigorous measures were implemented during transportation, sieving, digestion, filtration, density separation, identification and characterization to prevent contamination. Gloves and cotton aprons were worn to provide additional protection. Each sample was analyzed three times to ensure the precision of the data. A trip blank sample treated and examined using identical procedures as the actual samples, such as sieving, digestion, density separation, and spectroscopy, was included to detect any possible contamination. To ensure the completeness and reliability of our particle counts, we analyzed 5 g aliquots of sieved dust (<500 μm) per sample through density separation, with the final extracts filtered onto 47 mm diameter membranes (5 μm pore size) that were systematically examined in their entirety at 10× magnification. Each filter was divided into 8 sectors for complete coverage and we counted a minimum of 14 particles per sample. Fourier Transform Infrared (FTIR) spectroscopy was calibrated using a blank prior to the measurement of microplastic spectra.

2.7. Statistical Analysis

Basic statistical analyses were carried out using Microsoft Excel 2017, and data analysis was conducted using SPSS version 24. The consistency and uniformity of data variations were evaluated using frequency tests and Q-Q plots. As the data met the assumptions for ANOVA, parametric tests were employed. A one-way ANOVA was conducted to detect significant differences within the data, with a significance threshold of p < 0.05. Principal Component Analysis was carried out to explore potential pollution sources, utilizing varimax rotation and retaining principal components with eigenvalues > 1, according to Kaiser criterion. PCA was conducted on MP concentration data (MPs/g per polymer) using varimax rotation.

3. Result and Discussion

3.1. Morphology of Microplastics in Road Dust

The morphology of microplastic particles is closely linked to their chemical composition and original usage. Fibers are typically derived from textile-related polymers such as PVA and PET, while fragments commonly originate from harder plastics like PP and PE, used in containers and packaging. Film-shaped particles are generally associated with low-density LDPE, which is used in plastic bags and wraps. This relationship reflects the degradation patterns and mechanical properties of different polymer types. MPs in road dust exhibit diverse morphological forms—fibers, fragments, films, pellets, granules, and irregular particles—that are indicative of their sources, degradation processes, and potential health impacts (Figure 4). These shapes are not just descriptive; they influence environmental behavior, transport, and human exposure risks. Irregular and granular MPs, mainly from tire wear, brake dust, and road paint, have high surface areas that enhance their role as vectors for heavy metals and persistent organic pollutants [40]. Fragmented MPs, derived from items like containers and packaging, have irregular, sharp edges that can cause tissue abrasion and inflammation upon ingestion or inhalation [41]. Film-like MPs, typically from plastic bags and wrappers, are lightweight and easily dispersed, often carrying adsorbed pollutants such as heavy metals and pesticides, making them potentially higher risk than larger MPs [42]. Fiber-type MPs, originating from synthetic textiles, vehicle upholstery, and industrial fabrics, are particularly concerning due to their high potential for inhalation and respiratory deposition, similar to asbestos, with studies detecting such fibers in human lung tissue [43]. Pellet-type MPs, from industrial raw plastic materials and microbeads, are less likely to become airborne but persist in sediments, posing long-term ecological risks [44].

3.2. Identification of Microplastic Types Using FTIR-ATR

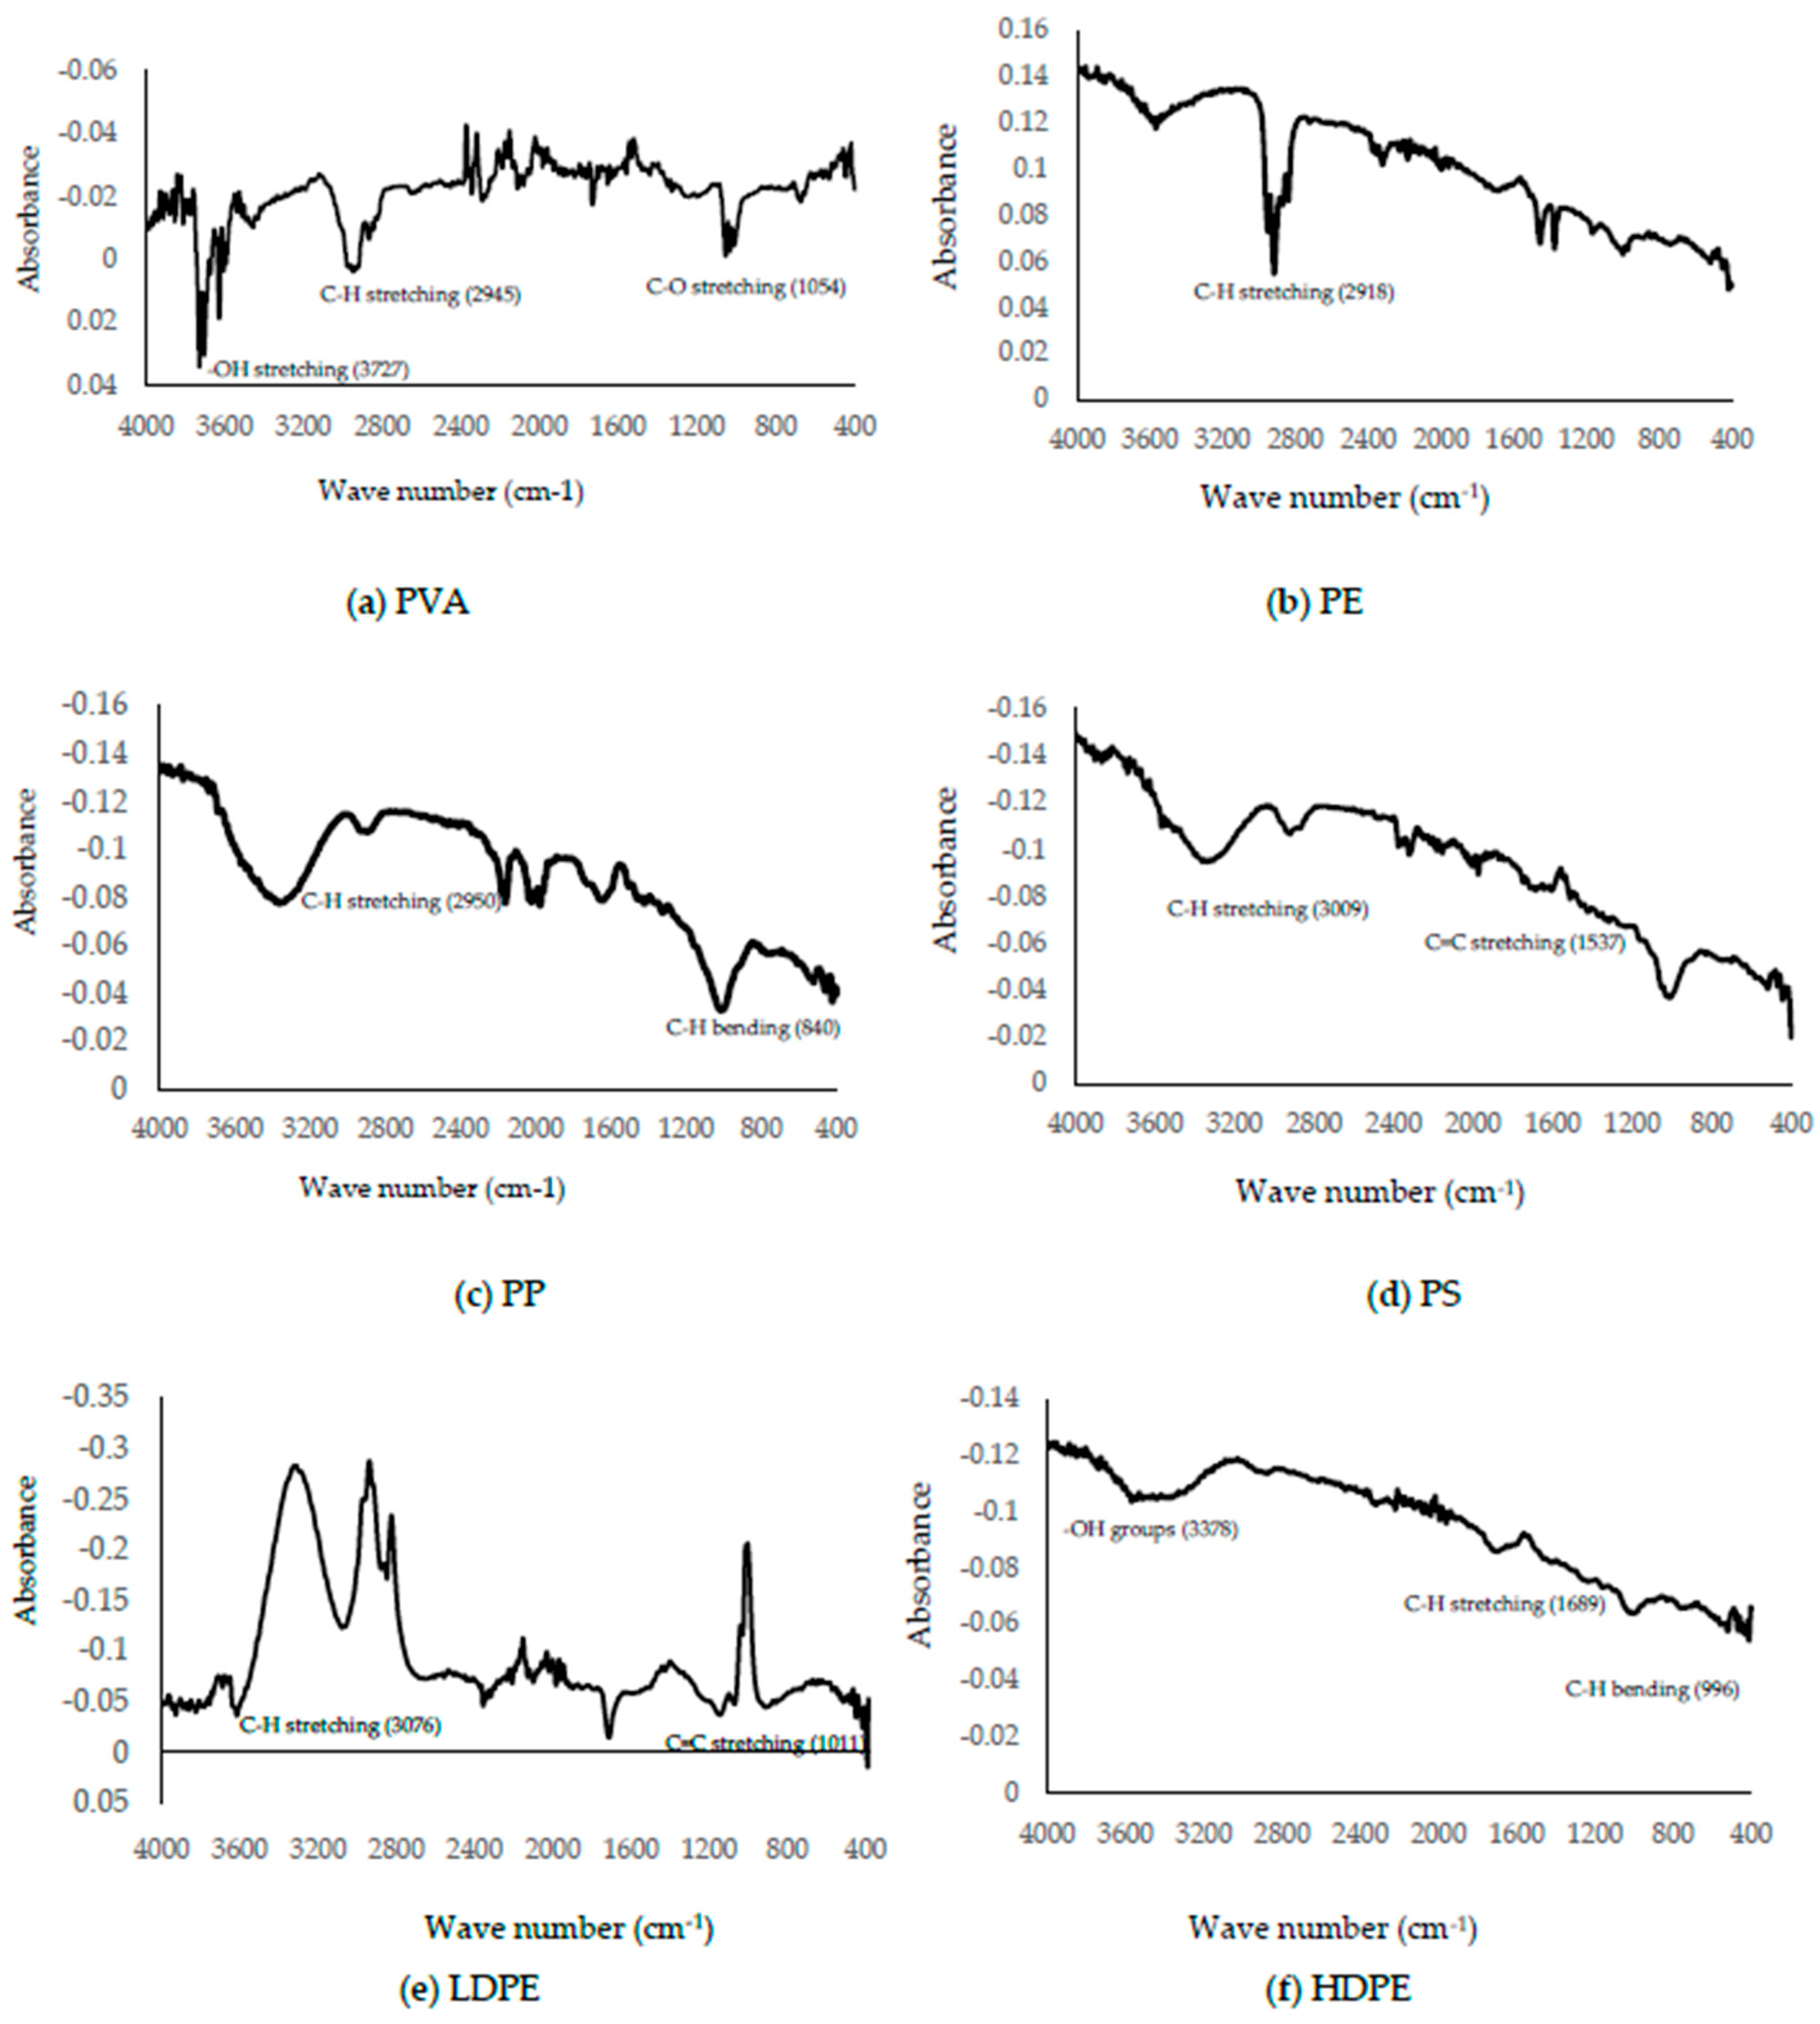
Fourier Transform Infrared Spectroscopy in Attenuated Total Reflectance mode (FTIR-ATR) was used to identify MP polymers based on their unique vibrational molecular signatures [45]. The FTIR spectra confirmed the presence of several polymer types, including PVA, PE, PP, PS, LDPE, and HDPE in road dust samples collected from Dhaka and its surrounding peri-urban areas (Figure 5). A summary of the polymers, functional groups, spectral characteristics, and potential sources is provided in Table 3. Some spectra showed interference from hydroxyl (–OH) groups, likely introduced during the H2O2 digestion process, which may have contributed to overrepresented oxygen-containing functional groups. Although background correction and spectral smoothing were applied to minimize artifacts, residual effects may remain. The identification of PVA was based on the presence of characteristic –OH stretching bands. However, due to potential spectral overlap with oxygen-rich compounds such as cellulose and oxidized polymers, this identification cannot be confirmed with full certainty. Additionally, the hydrolysis of polyvinyl chloride (PVC) during digestion may result in misidentification as PVA. While urban sources of PVA may include adhesives, textile coatings, and packaging materials, its prevalence in the environment is typically lower than that of other dominant polymers. Only dominant single-polymer matches are reported; co-polymer presence cannot be excluded. The characteristic FTIR peaks observed correspond to the functional groups of these polymers, indicating their environmental occurrence and degradation state. Further confirmation using reference standards and additional analytical methods is recommended.

3.3. Distribution and Abundance of MPs in Dust Samples

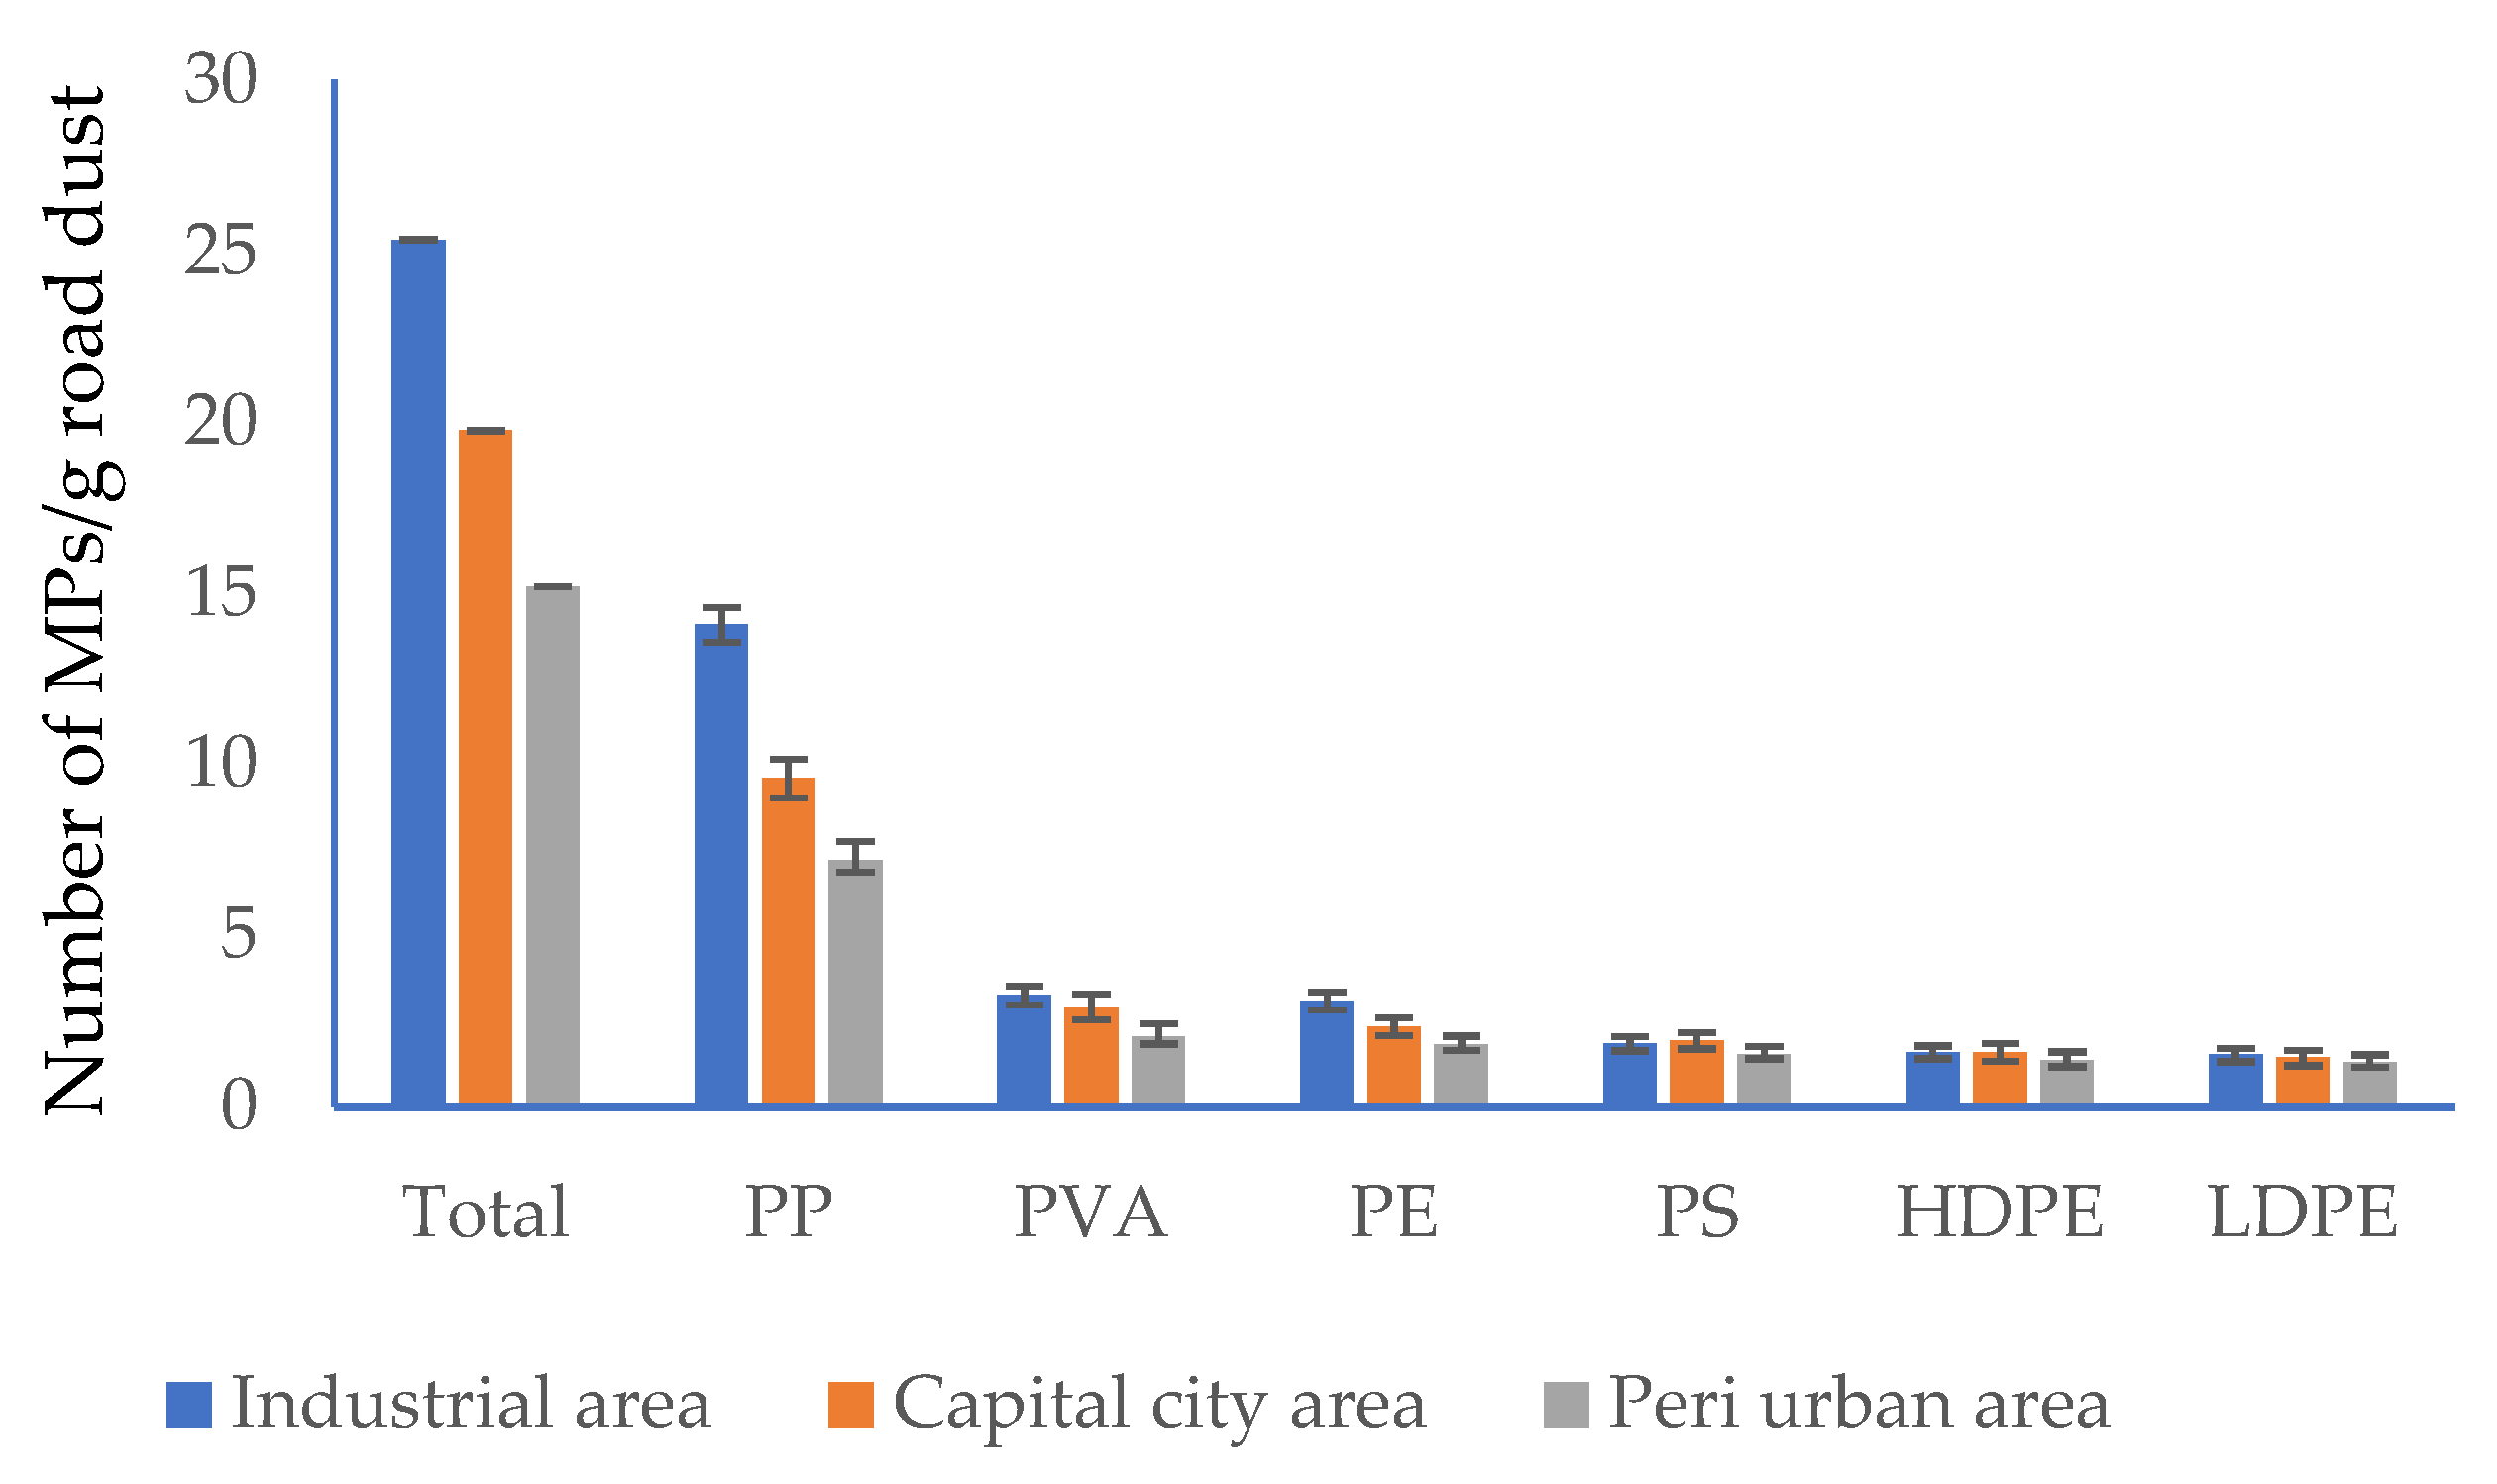
The abundance and distribution of MPs in road dust provide crucial insights into their sources, environmental behavior, and potential risks. The descriptive statistics of MPs in this study, categorized by polymer type across capital city, industrial and peri-urban areas, reveal significant spatial variability, with industrial areas exhibiting the highest MP concentrations (Figure 6).
Polypropylene was the most dominant MP polymer in street dust, with its highest mean concentration in industrial areas (14.1 ± 1.7 MPs/g), followed by capital city areas (9.6 ± 1.92 MPs/g) and peri-urban areas (7.2 ± 1.56 MPs/g), highlighting its widespread presence. Polyvinyl alcohol concentrations were highest in industrial areas (3.3 ± 0.96 MPs/g), followed by capital city areas (2.9 ± 1.31 MPs/g), while peri-urban areas had the lowest concentration (2.0 ± 0.97 MPs/g). Polyethylene was also a predominant MP type, with higher concentrations in industrial areas (3.1 ± 0.90 MPs/g), followed by capital city areas (2.3 ± 0.88 MPs/g) and peri-urban areas (1.8 ± 0.74 MPs/g). In contrast, polystyrene concentrations were relatively lower than PP and PE, with values of 1.8 ± 0.71 MPs/g in industrial areas, 1.9 ± 0.79 MPs/g in capital city areas, and 1.5 ± 0.60 MPs/g in peri-urban areas. PS concentrations were more elevated in the capital city and peri-urban areas than industrial zones likely due to fragmented packaging waste (e.g., food containers, disposable cups) from high-density residential and commercial activities. Industrial PS emissions may be offset by dominant PP or PE outputs from manufacturing [51]. Approximately 80% of MPs were 10–100 µm; the inhalable fraction (<50 µm) dominated in industrial zones.
HDPE and LDPE exhibited similar trends, with industrial areas having a slightly higher number than capital city and peri-urban areas. The overall trend shows that industrial areas had the highest number of MPs, followed by peri-urban areas and the capital city, Dhaka. Rabin M.H. et al. [12] also reported the highest count of MP particles per gram in road dust samples collected from industrial areas in Dhaka city.
This spatial variation suggests that industrial emissions, vehicular wear, and urban waste mismanagement are key contributors to MP contamination. Industrial areas recorded the highest number of MPs of loads, likely due to factory emissions, plastic production waste, and heavy traffic. In capital city areas, moderate MP levels were observed, influenced by high traffic density, urban waste, and synthetic textile use. Peri-urban areas showed lower MP numbers, but the levels were still significant, suggesting atmospheric deposition and runoff transport. These findings align with previous studies, which have reported higher numbers of MP particles in industrial and urban centers due to increased plastic usage, vehicular abrasion, and waste disposal activities [52,53].

3.4. Proportion of Various MPs Across Different Land-Use Categories

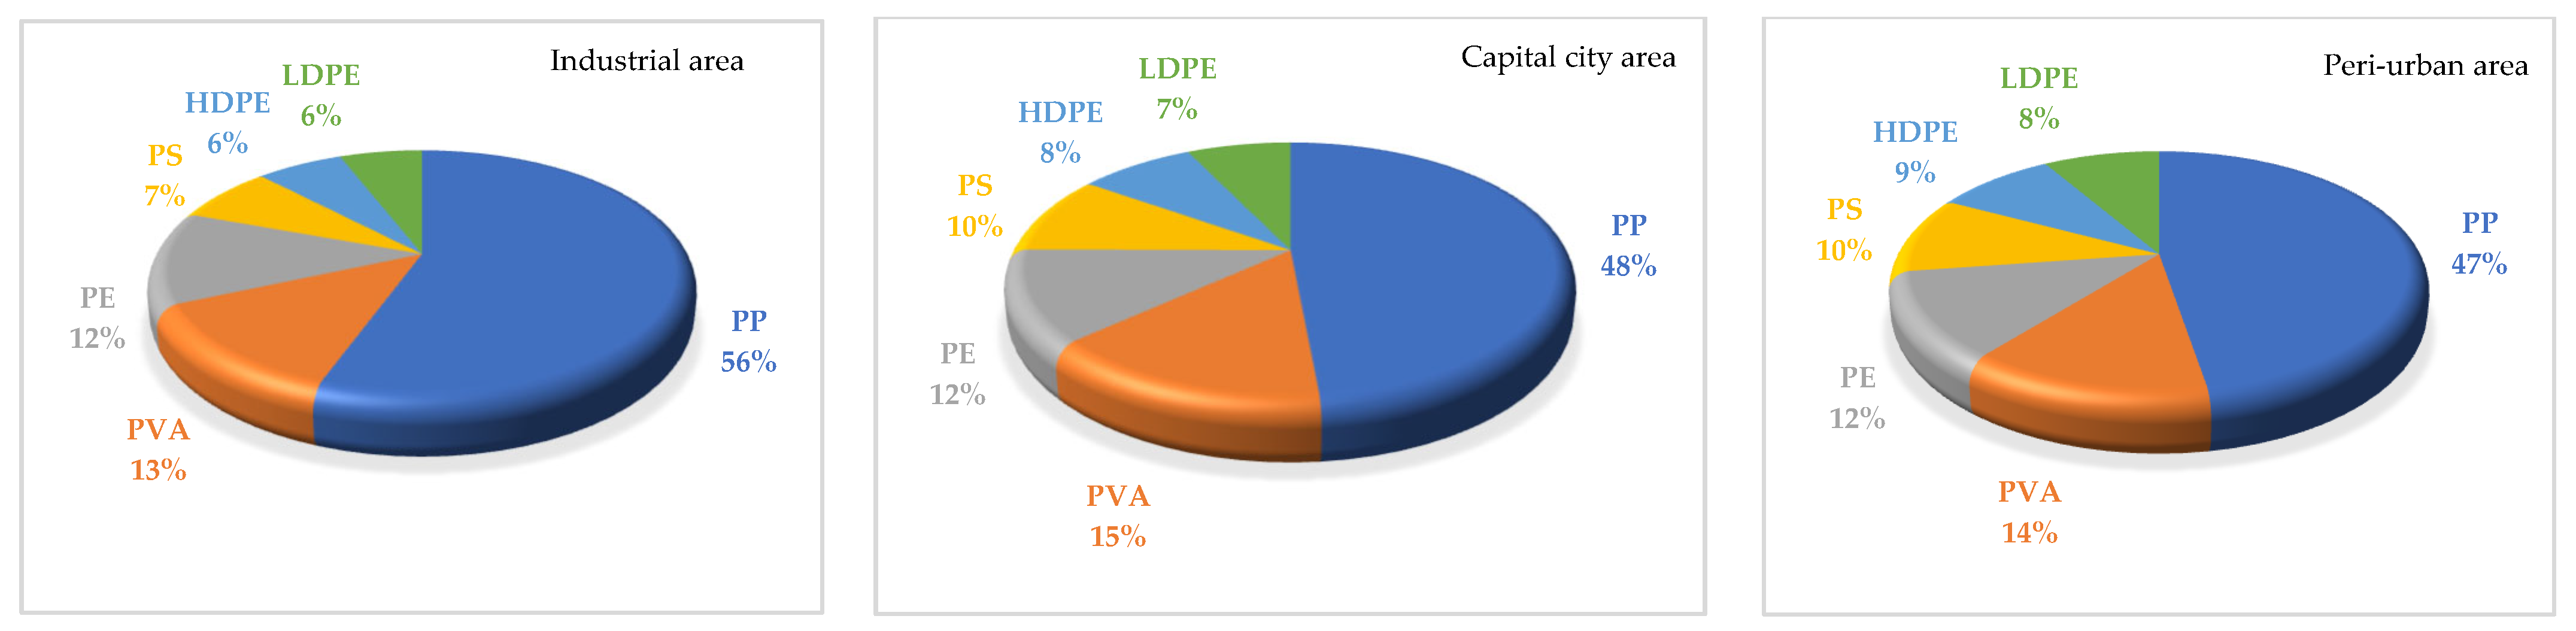
The analysis of MP distribution in road dust samples from Dhaka and its peripheral cities revealed significant variations in MP composition across different land-use categories, including industrial areas, capital city areas, and peri-urban regions (Figure 7). The results highlight the dominance of specific polymer types and their relative proportions in each area.
In industrial zones, PP was the most prevalent MP, accounting for 56% of the total MPs. This high proportion of PP is likely attributed to industrial activities, such as plastic manufacturing and packaging waste. Polyvinyl alcohol constituted 13%, reflecting its use in industrial applications like adhesives and coatings. LDPE was present at 6–7%, likely originating from plastic films and packaging materials used in industrial processes.
In the capital city area, PP remained the dominant polymer, representing 48% of MPs. This is consistent with the widespread use of PP in urban settings for food containers, automotive parts, and household plastics. PVA accounted for 15%, indicating its prevalence in urban waste streams, possibly from textiles and packaging. LDPE was slightly higher than in industrial areas, at 7–8%, likely due to the extensive use of plastic bags and packaging in urban environments. In peri-urban regions, PP was also the most prevalent polymer, making up 47% of MPs. This suggests that PP is a ubiquitous pollutant across all land-use categories. PVA constituted 14%, while LDPE was present at 8–9%, indicating that peri-urban areas, though less industrialized, still experience significant MP pollution, possibly due to atmospheric deposition and transport from urban and industrial zones.

3.5. Source Apportionment of MPs in Street Dust Using Principal Component Analysis (PCA)

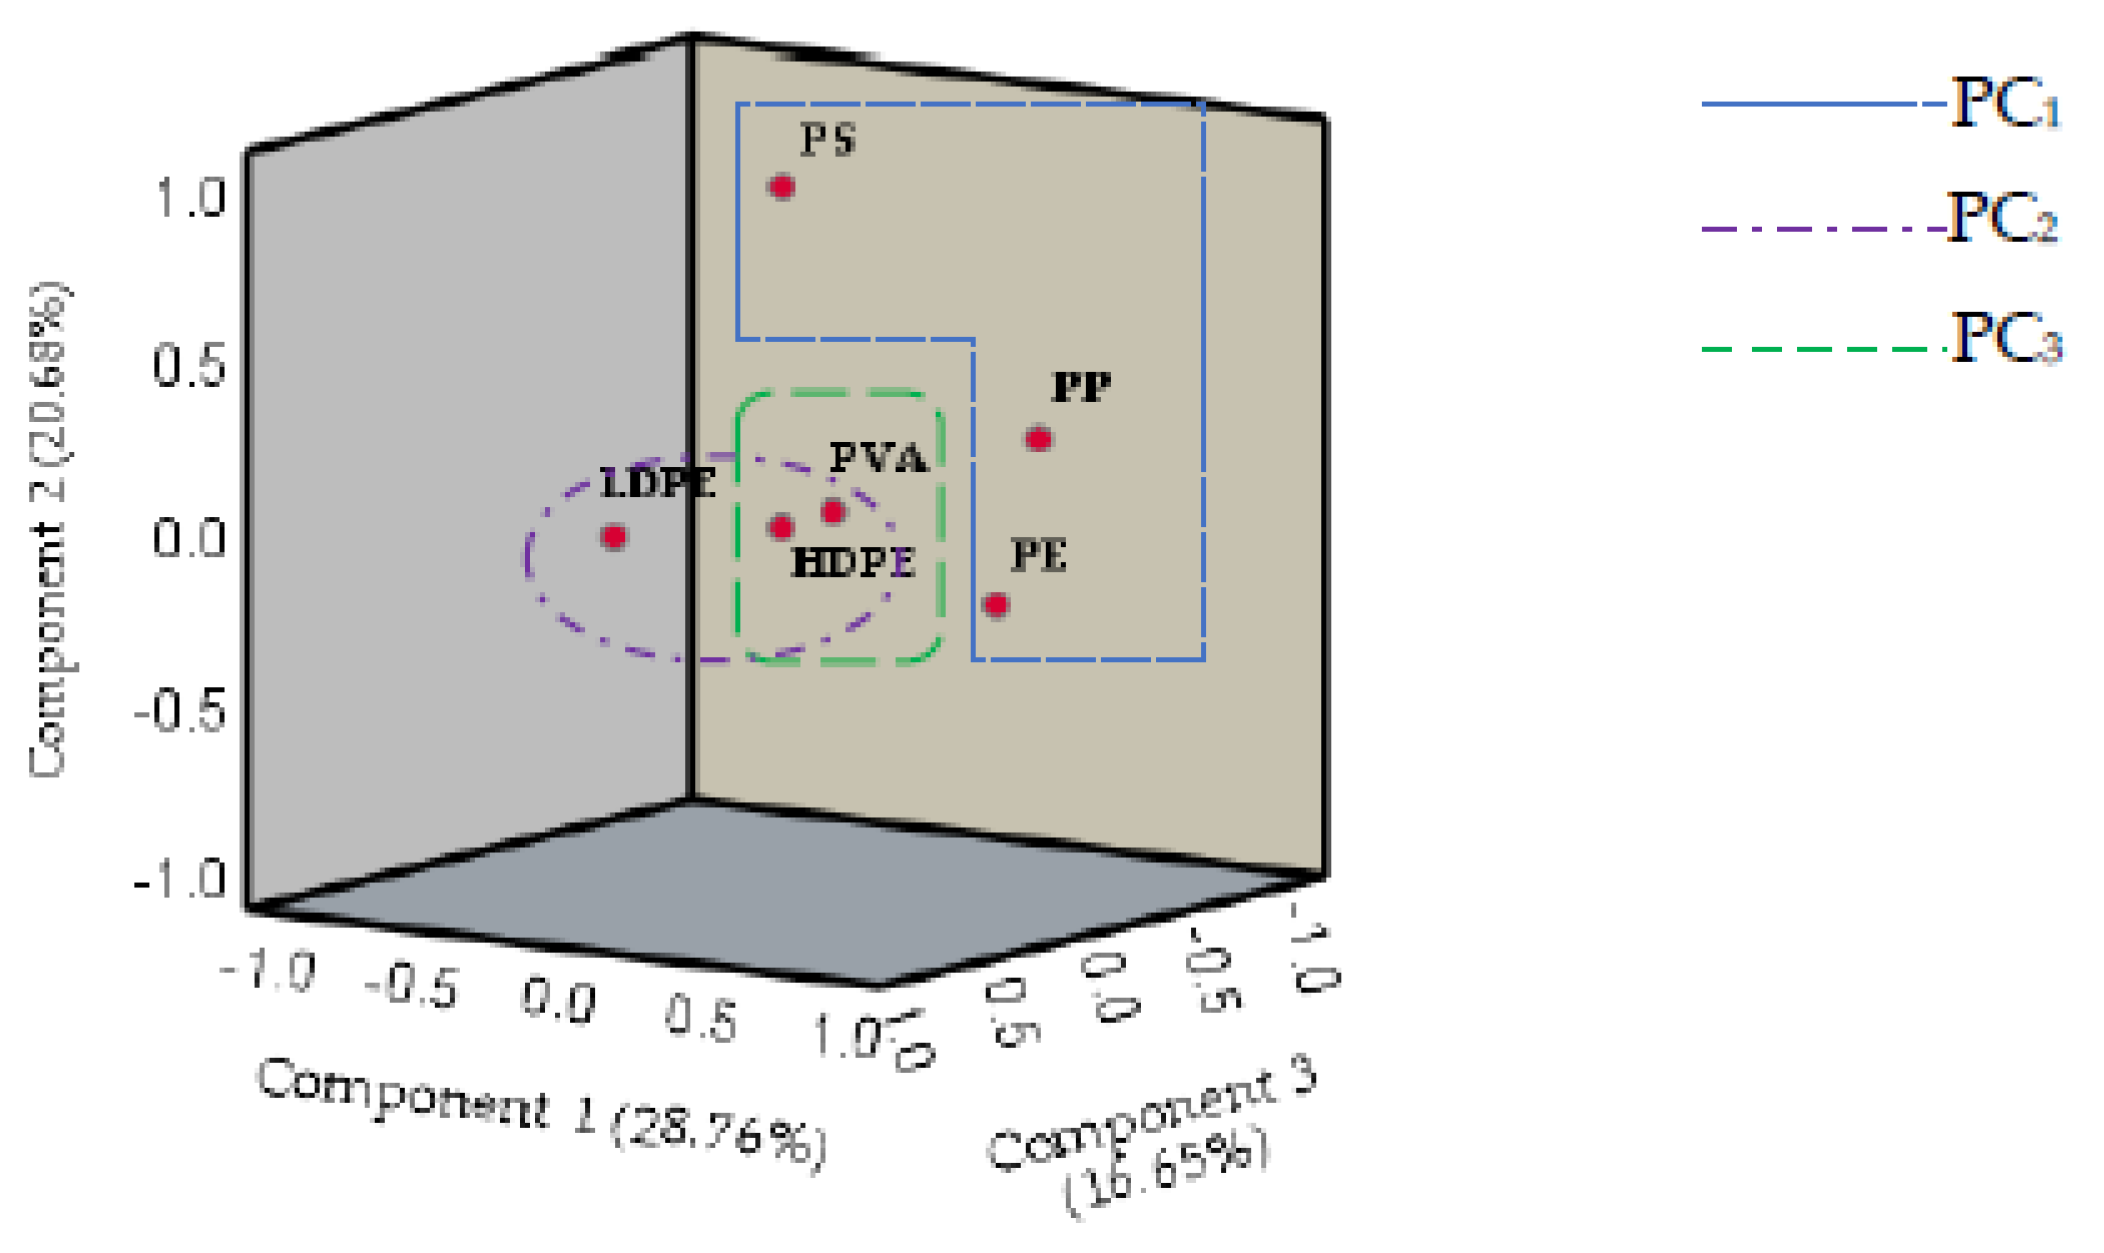
Principal Component Analysis was performed to assess the distribution patterns and potential sources of microplastics in road dust samples collected across Dhaka and its peripheral cities. The first three principal components (PCs) account for a substantial proportion of the total variance: PC1 (28.76%), PC2 (20.66%), and PC3 (16.65%), cumulatively explaining 66.07% of the total variance in the dataset. The 3D PCA plot (Figure 8) illustrates the grouping of different MP types, suggesting distinct compositional and source-related influences.
PC1 is the dominant component and primarily distinguishes microplastics based on their polymer composition. Polyethylene, polypropylene, and polystyrene exhibit strong positive loadings along this axis, indicating their widespread presence in urban road dust. The strong contribution of PC1 aligns with previous studies reporting traffic as a dominant source of microplastics in urban environments [54]. The presence of PS, in particular, suggests contributions from plastic-based packaging, insulation materials, and thermal degradation from road surfaces. PC2 separates low-density polyethylene and high-density polyethylene from other MPs, indicating a different source pathway. LDPE and HDPE are commonly associated with plastic bags, food packaging, and agricultural plastics, mechanical weathering and photooxidation, which lead to fragmentation and accumulation in urban dust [55]. These findings are consistent with studies identifying plastic bags and packaging materials as major contributors to urban microplastic contamination [56]. PC3 primarily captures variations in polyvinyl alcohol and HDPE, which may be linked to textile fibers and synthetic coatings used in industrial manufacturing. Additives and plastic coatings originate from electronic waste or industrial byproducts [57]. Pesticide and fertilizer residues could also be implicated, as HDPE is frequently used in agrochemical containers [58]. The clustering of PVA along PC3 suggests a potential correlation with synthetic textile fibers, a known source of microplastic pollution in urban environments. The presence of HDPE in this component also suggests industrial contributions, possibly from nearby factories or plastic processing units in Dhaka. The co-occurrence of MPs in dust samples suggests potential interactions between plastic surfaces and toxic elements, where MPs may serve as vectors for metal adsorption and transport in the urban environment [59].

3.6. Health Risk Assessment of MPs in Street Dust

3.6.1. Estimated Daily Intake (EDI)

Microplastic pollution in urban road dust has emerged as a significant environmental concern due to its potential risks to human health. In this study, the estimated daily intake of MPs via ingestion and inhalation was assessed in adults and children across capital city, industrial, and peri-urban areas of Bangladesh (Table 4). The findings indicate that both exposure levels and pathways vary depending on the type of MP polymer and demographic group.
Ingestion Exposure for EDI
Ingestion is one of the primary pathways of MP exposure, particularly in children due to their hand-to-mouth behavior. The estimated daily ingestion of MPs ranged from 8.57 × 10⁻¹¹ to 9.62 × 10⁻¹² MP particles/g/day in children and 1.12 × 10⁻¹¹ to 1.26 × 10⁻¹² MP particles/g/day in adults across different polymers and locations. Among the polymers, polypropylene exhibited the highest ingestion rates, followed by polyvinyl alcohol and polyethylene. This variation can be attributed to differences in polymer density, atmospheric deposition, and the resuspension of MP in road dust. Daily MP ingestion rates ranged from 0.1 to 5 g/day, with polypropylene and polyethylene as the dominant polymers [60], which supports this finding of PP being the most ingested polymer, followed by polyvinyl alcohol and PE. Environmental factors such as atmospheric deposition and road dust resuspension influence MP ingestion rates, which correlates with the variation in ingestion rates across different locations [61].
Inhalation Exposure for EDI
The inhalation of MPs poses a significant health risk, especially for children, who have higher respiratory rates than adults. The highest EDI values were observed for PP, with values reaching 2.4 × 10⁻⁹ MP particles/g/day in children from industrial areas, while adults had an exposure of 1.1 × 10⁻⁹ MP particles/g/day. Children are more susceptible to MP inhalation due to their higher respiratory rates and closer proximity to ground-level dust, with PP and PE detected as the most inhaled polymers [62]. Other plastic types, including PE, PS, and high-density polyethylene, showed lower but still considerable inhalation exposure levels. It is demonstrated that indoor environments have higher concentrations of airborne MPs, with polypropelene and polyethylene being the most prevalent, and children experiencing higher exposure due to their increased time spent indoors [63]. The relatively higher inhalation exposure in children compared to adults suggests an increased vulnerability to respiratory issues linked to microplastic pollution.
Industrial areas exhibited the highest MP exposure across all pathways, followed by peri-urban areas and the capital city. The capital city area showed elevated MP exposure, particularly for ingestion and inhalation, due to high population density, extensive urban infrastructure, and traffic-related MP generation [64]. Peri-urban areas had comparatively lower MP exposure, but the presence of MPs still indicates widespread contamination and potential long-term health risks. MP exposure through road dust can pose serious health risks, including respiratory issues, gastrointestinal disturbances, and skin irritation [65]. The higher EDI values in children compared to adults suggest that younger populations may face greater health risks due to prolonged exposure over their lifetime. The dominance of PP, PVA, and PE in road dust highlights the urgent need for effective waste management policies and mitigation strategies to reduce MP pollution in urban environments.

3.6.2. Lifetime Average Daily Dose (LADD) of Microplastics from Road Dust in Dhaka City

The presence of MPs in urban environments, particularly in road dust, has gained significant attention due to its potential health risks. This study estimates the Lifetime Average Daily Dose (LADD) of MPs in different exposure pathways such as inhalation and ingestion across the capital city, industrial and peri-urban areas of Bangladesh (Table 5). The results suggest variations in MP exposure based on location, polymer type, and pathway, emphasizing the influence of anthropogenic activities on MP contamination levels.
Ingestion Exposure for LADD
Ingestion serves as a primary route for MP intake, particularly through hand-to-mouth contact and dust-contaminated food. The estimated LADD values for ingestion across different areas and polymer types range from 3.9 × 10⁻¹² to 3.6 × 10⁻¹¹ MP particles/g/day. Highest ingestion exposure was observed for PE in industrial areas, at 3.6 × 10⁻¹¹ MP particles/g/day, followed by peri-urban areas and the capital city. Other polymers, such as PVA, PE, and PS, exhibited lower ingestion values, but their presence still indicates potential risks. The differences in ingestion exposure among the areas may be attributed to variations in traffic density, industrial emissions, and waste management practices [66,67].
Inhalation Exposure for LADD
MPs can be resuspended in ambient air due to vehicular activities and wind turbulence, making inhalation a significant exposure pathway. The estimated inhalation LADD values ranged from 2.4 × 10⁻¹⁰ to 1.1 × 10⁻⁸ MP particles/g/day, with notable differences among polymers and locations. PP had the highest inhalation LADD in industrial areas (1.1 × 10⁻⁸ MP particles/g/day), which may be linked to high vehicle-driven pollutants, plastic-related industries, and unpaved roads. Capital city areas also showed relatively high inhalation exposure (1.8 × 10⁻⁹ MP particles/g/day for PP), likely due to higher traffic congestion and population density [68]. Lower inhalation values in peri-urban areas suggest a reduced MP burden in less trafficked and less industrialized regions.

3.6.3. Cumulative Carcinogenic Risk (CCR)

The cumulative carcinogenic risk of microplastics in road dust from Bangladesh was assessed across the capital city Dhaka, industrial and peri-urban regions, revealing significant spatial variations (Table 6). The industrial area exhibited the highest CCR 8.9 × 10⁻⁹, followed by the capital city, at 1.8 × 10⁻⁹, and peri-urban areas, at 1.4 × 10⁻⁹.
Among the different polymers, polypropylene and polyethylene demonstrated the highest CCR values, with industrial zones posing the greatest risk due to increased emissions from plastic industries, vehicular activities, and improper waste disposal. The elevated risk in the capital city is likely associated with high traffic density, urbanization, and atmospheric deposition of MPs, whereas peri-urban areas showed relatively lower risks due to reduced industrial activities and lower population density [69]. These findings align with global studies, which indicate that urban centers and industrial zones exhibit higher MP pollution and associated health risks [70,71]. While the estimated CCR values in this study remain below the critical threshold of 10−6 [72], chronic exposure to MPs via ingestion and inhalation may contribute to long-term health risks, including oxidative stress, inflammation, and the potential for carcinogenesis [73]. MPs are known to act as carriers for toxic organic pollutants and heavy metals, further increasing their hazardous potential [74,75]. Given these risks, regulatory interventions such as improved plastic waste management, stricter air quality regulations, and public awareness campaigns are crucial to mitigating MP exposure in urban environments [76]. The Carcinogenic Slope Factor (CSF) values for Polyvinyl Alcohol and Polystyrene microplastics are not well-documented in existing toxicological databases, as microplastics are still being extensively studied for their long-term health effects.

3.6.4. Risk Assessment Indices for Microplastics in Road Dust

Table 7 outlines the findings for Microplastic Polymer Risk Indices (pRi) and the overall Pollution Risk Indices. The risk indices for microplastics in road dust were assessed across capital city, industrial and peri-urban regions, providing insight into potential environmental and human health risks. Risk indices followed Enyoh et al. [27], with hazard scores (Sj) assigned per polymer toxicity [28].
The pollution risk area (pRarea) values ranged from 1.94 in peri-urban areas to 2.67 in industrial areas, indicating that the industrial region experiences the highest MP-related pollution risk. The capital city area also demonstrated a significant pollution risk (pRarea = 2.41), reflecting the impact of urbanization, high traffic density, and extensive plastic usage. Similarly, the pollution risk index (pRi) value for all MPs found in the studied area was 138.17. Based on the classification framework proposed by [77], which divides pRi values into five categories—low (<150), medium (150–300), considerable (300–600), high (600–1200), and very high (>1200)—the data reveal that all microplastic types evaluated in the study exhibit a low level of risk. These results align with earlier studies, which have shown that densely populated urban centers and industrial zones have higher MP contamination due to emissions from vehicular activities, atmospheric deposition, and improper plastic waste disposal [78]. The peri-urban area exhibited the lowest MP risk, likely due to reduced industrial activities and lower population density.

4. Conclusions

The study highlights the pervasive presence of microplastics in road dust across the capital city, Dhaka, industrial and peri-urban areas of Bangladesh, with industrial zones exhibiting the highest concentrations. The distribution of microplastics in road dust was found in the following order: PP > PVA > PE > PS > HDPE > LDPE. Polypropylene emerged as the dominant polymer, followed by polyethylene and polyvinyl alcohol, reflecting the significant contributions of vehicular activities, industrial activities, and mismanaged plastic waste. Spatial distribution analysis revealed that industrial areas are the most polluted, while peri-urban regions, though less contaminated, still face considerable MP pollution due to atmospheric deposition and transport. Health risk assessments indicated that children are particularly vulnerable to MP exposure through ingestion and inhalation, with industrial areas posing the highest carcinogenic risks. The findings underscore the urgent need for targeted mitigation strategies, including improved waste management, stricter regulations on plastic use and disposal, and enhanced public awareness campaigns. Addressing MP pollution is crucial not only for environmental sustainability but also for safeguarding public health, particularly in rapidly urbanizing and industrializing regions like Bangladesh. Promotion of biodegradable alternatives like jute-based packaging can reduce plastic waste generation, because jute fiber is available in Bangladesh. Health programs in school like promoting handwashing and mask wearing in high-MP urban areas could be integrated. While focused on Bangladesh, our methods are transferable to rapidly urbanizing regions with similar pollution drivers. This study examines microplastic pollution in peri-urban, industrial, and capital city road dust, establishing a foundation for future research and policy interventions to mitigate contamination and associated health risks.

Author Contributions

M.S.R.: Conceptualization, methodology, writing—original draft preparation; Q.W.: supervision, investigation, funding acquisition, review and editing; M.S.: supervision, investigation; W.W.: supervision, methodology, review and editing; C.E.E.: review and editing; T.O.M.: data analysis, review and editing, M.R.I.: data analysis and editing; All authors have read and agreed to the published version of the manuscript.

Funding

This work was partially supported by the Basic Research (B) (Number. 22H03747, FY2022-FY2024) of Grant-in-Aid for Scientific Research of the Japanese Ministry of Education, Culture, Sports, Science and Technology (MEXT), Japan. We also thank the Comprehensive Analysis Center for Science, Saitama University, for allowing us to conduct some analyses and providing insight and expertise that greatly assisted the research.

Institutional Review Board Statement

Not applicable.

Informed Consent Statement

Not applicable.

Data Availability Statement

The original contributions presented in the study are included in the article; further inquiries can be directed to the corresponding author/s.

Acknowledgments

The initial processing of suspended street dust was conducted in the Bangladesh Institute of Nuclear Agriculture (BINA) substation, Barishal. Some of the toxic metal analyses were conducted in the laboratory of the Center for Environmental Science in Saitama, Japan.

Conflicts of Interest

The authors declare no conflicts of interest.

References

  1. Rahman, M.M.; Mahamud, S.; Thurston, G.D. Recent Spatial Gradients and Time Trends in Dhaka, Bangladesh, Air Pollution and Their Human Health Implications. J. Air Waste Manag. Assoc. 2019, 69, 478–501. [Google Scholar] [CrossRef]
  2. The Green Page Bangldesh. Dhaka Air Quality Index Hits New High, Raises Concerns. Available online: https://thegreenpagebd.com/december-2023-dhaka-air-quality-index-hits-new-high-raises-concerns (accessed on 23 January 2025).
  3. Ahmed, F.; Bayazid, A.Z.M.; Islam, M.M.; Rahaman, M.Z.; Al Muntasi, M.F. The Terrible Air Pollution in Dhaka City Is Getting Worse. GSC Adv. Res. Rev. 2024, 19, 042–052. [Google Scholar] [CrossRef]
  4. Akhbarizadeh, R.; Dobaradaran, S.; Torkmahalleh, M.A.; Saeedi, R.; Aibaghi, R.; Ghasemi, F.F. Suspended fine particulate matter (PM2.5), microplastics (MPs), and polycyclic aromatic hydrocarbons (PAHs) in air: Their possible relationships and health implications. Environ. Res. 2021, 192, 110339. [Google Scholar] [CrossRef]
  5. Uddin, M.M.; Xu, F. Sources, Occurrences, and Risks of Polycyclic Aromatic Hydro-Carbons (PAHs) in Bangladesh: A Review of Current Status. Atmosphere 2024, 15, 233. [Google Scholar] [CrossRef]
  6. Kabir, M.H.; Rashid, M.H.; Wang, Q.; Wang, W.; Lu, S.; Yonemochi, S. Determination of Heavy Metal Contamination and Pollution Indices of Roadside Dust in Dhaka City, Bangladesh. Processes 2021, 9, 1732. [Google Scholar] [CrossRef]
  7. Schraufnagel, D.E. The Health Effects of Ultrafine Particles. Exp. Mol. Med. 2020, 52, 311–317. [Google Scholar] [CrossRef]
  8. Ghosh, S.; Sinha, J.K.; Ghosh, S.; Vashisth, K.; Han, S.; Bhaskar, R. Microplastics as an Emerging Threat to the Global Environment and Human Health. Sustainability 2023, 15, 10821. [Google Scholar] [CrossRef]
  9. Su, L.; Xiong, X.; Zhang, Y.; Wu, C.; Xu, X.; Sun, C.; Shi, H. Global Transportation of Plastics and Microplastics: A Critical Review of Pathways and Influences. Sci. Total Environ. 2022, 831, 154884. [Google Scholar] [CrossRef]
  10. Premarathna, K.S.D.; Rajapaksha, A.U.; Vithanage, M. Microplastics in Road Dust and Surrounding Environment: Sources, Fate and Analytical Approaches. Trends Environ. Anal. Chem. 2024, 45, e00256. [Google Scholar] [CrossRef]
  11. Akter, M.S.; Chakraborty, T.K.; Ghosh, G.C.; Nice, M.S.; Zaman, S.; Khan, A.S. Microplastics and Heavy Metals in Freshwater Fish Species in the Southwestern Region of Bangladesh: An Emerging Concern for Public Health. Emerg. Contam. 2024, 10, 100325. [Google Scholar] [CrossRef]
  12. Rabin, M.H.; Wang, Q.; Enyoh, C.E.; Kai, X.; Sheuty, T.F. Distribution, Potential Sources, and Health Risk of Microplastics (MPs) in Street Dust during and after COVID-19 Lockdown in Bangladesh. Environments 2023, 10, 130. [Google Scholar] [CrossRef]
  13. Ihenetu, S.C.; Enyoh, C.E.; Wang, C.; Li, G. Sustainable Urbanization and Microplastic Management: Implications for Human Health and the Environment. Urban Sci. 2024, 8, 252. [Google Scholar] [CrossRef]
  14. Mihai, F.-C.; Gündoğdu, S.; Markley, L.A.; Olivelli, A.; Khan, F.R.; Gwinnett, C.; Gutberlet, J.; Reyna-Bensusan, N.; Llanquileo-Melgarejo, P.; Meidiana, C.; et al. Plastic Pollution, Waste Management Issues, and Circular Economy Opportunities in Rural Communities. Sustainability 2022, 14, 20. [Google Scholar] [CrossRef]
  15. Jahandari, A. Microplastics in the Urban Atmosphere: Sources, Occurrences, Distribution, and Potential Health Implications. J. Hazard. Mater. Adv. 2023, 12, 100346. [Google Scholar] [CrossRef]
  16. Kannan, K.; Vimalkumar, K. A Review of Human Exposure to Microplastics and Insights into Microplastics as Obesogens. Front. Endocrinol. 2021, 12, 724989. [Google Scholar] [CrossRef]
  17. Cox, K.D.; Covernton, G.A.; Davies, H.L.; Dower, J.F.; Juanes, F.; Dudas, S.E. Human Consumption of Microplastics. Environ. Sci. Technol. 2019, 53, 7068–7074. [Google Scholar] [CrossRef]
  18. Prata, J.C. Airborne Microplastics: Consequences to Human Health? Environ. Pollut. 2018, 234, 115–126. [Google Scholar] [CrossRef]
  19. Ahmad, M.; Chen, J.; Khan, M.T.; Yu, Q.; Phairuang, W.; Furuuchi, M.; Panyametheekul, S. Sources, Analysis, and Health Implications of Atmospheric Microplastics. Emerg. Contam. 2023, 9, 100233. [Google Scholar] [CrossRef]
  20. Wright, S.L.; Kelly, F.J. Plastic and Human Health: A Micro Issue? Environ. Sci. Technol. 2017, 51, 6634–6647. [Google Scholar] [CrossRef] [PubMed]
  21. Hoque, M.A.; Hoque, M.M.; Ahmed, K.M. Declining groundwater level and aquifer dewatering in Dhaka metropolitan area, Bangladesh: Causes and quantification. Hydrogeol. J. 2007, 15, 1523–1534. [Google Scholar] [CrossRef]
  22. Rana, M.S.; Wang, Q.; Wang, W.; Enyoh, C.E.; Islam, M.R.; Isobe, Y.; Kabir, M.H. Sources, Distribution, and Health Implications of Heavy Metals in Street Dust across Industrial, Capital City, and Peri-Urban Areas of Bangladesh. Atmosphere 2024, 15, 1088. [Google Scholar] [CrossRef]
  23. Shahid, S. Recent trends in the climate of Bangladesh. Clim. Res. 2010, 42, 185–193. [Google Scholar] [CrossRef]
  24. Bangladesh Bureau of Statistics (BBS). Available online: https://sid.portal.gov.bd/sites/default/files/files/sid.portal.gov.bd/publications/01ad1ffe_cfef_4811_af97_594b6c64d7c3/PHC_Preliminary_Report_(English)_August_2022.pdf (accessed on 25 January 2025).
  25. Bangladesh Road and Transport Authority (BRTA). Available online: https://brta.portal.gov.bd/sites/default/files/files/brta.portal.gov.bd/page/5818c2d3_c813_4cdf_8c89_971036fe83b3/2021-03-01-14-10-7c8dfa8d01f9c919b5412c11bd3877c3.pdf (accessed on 24 January 2025).
  26. Bangladesh Road and Transport Authority (BRTA) 2017. Available online: https://www.bv-f.org/assets/article/bv/18/7.pdf (accessed on 19 May 2025).
  27. World Bank. Bangladesh: Enhancing Urban Resilience in Dhaka. 2022. Available online: https://documents1.worldbank.org/curated/en/427501631748494661/pdf/Disclosable-Restructuring-Paper-Bangladesh-Urban-Resilience-Project-P149493.pdf (accessed on 24 March 2015).
  28. Wang, J.; Li, S.; Cui, X.; Li, H.; Qian, X.; Wang, C.; Sun, Y. Bioaccessibility, sources and health risk assessment of trace metals in urban park dust in Nanjing, Southeast China. Ecotoxicol. Environ. Saf. 2016, 128, 161–170. [Google Scholar] [CrossRef]
  29. Wang, Q.; Enyoh, C.E.; Chowdhury, T.; Chowdhury, A.H. Analytical techniques, occurrence and health effects of micro and nano plastics deposited in street dust. Int. J. Environ. Anal. Chem. 2022, 102, 6435–6453. [Google Scholar] [CrossRef]
  30. Enyoh, C.E.; Verla, A.W.; Rakib, R.J. Application of Index Models for Assessing Freshwater Microplastics Pollution. World News Nat. Sci. 2021, 38, 37–48. [Google Scholar]
  31. Lithner, D.; Larsson, A.; Dave, G. Environmental and Health Hazard Ranking and Assessment of Plastic Polymers Based on Chemical Composition. Sci. Total Environ. 2011, 409, 3309–3324. [Google Scholar] [CrossRef]
  32. Christian, E.E.; Wang, Q.; Andrew, W.V.; Tanzin, C. Index models for ecological and health risks assessment of environmental micro-and nano-sized plastics. AIMS Environ. Sci. 2022, 9, 51–65. [Google Scholar] [CrossRef]
  33. Ferreira-Baptista, L.; De Miguel, E. Geochemistry and risk assessment of street dust in Luanda, Angola: A tropical urban environment. Atmos. Environ. 2005, 39, 4501–4512. [Google Scholar] [CrossRef]
  34. USEPA. Supplemental Guidance for Developing Soil Screening Levels for Superfund Sites; US Environmental ProtectionAgency: Washington, DC, USA, 2002; pp. 1–187. [Google Scholar]
  35. Li, X.; Poon, C.S.; Liu, P.S. Heavy metal pollution of urban soils and street dusts in Hong Kong. Appl. Geochem. 2001, 16, 1361–1368. [Google Scholar] [CrossRef]
  36. EPA, U.S. Risk Assessment Guidance for Superfund (RAGS) Volume III-Part A: Process for Conducting Probabilistic Risk Assessment, Appendix B; Office of Emergency and Remedial Response US Environmental Protection Agency: Washington, DC, USA, 2001. [Google Scholar]
  37. Zheng, N.; Liu, J.; Wang, Q.; Liang, Z. Health risk assessment of heavy metal exposure to street dust in the zinc smelting district, northeast of China. Sci. Total Environ. 2010, 408, 726–733. [Google Scholar] [CrossRef]
  38. United States. Environmental Protection Agency; Office of Emergency, Remedial Response. Risk Assessment Guidance for Superfund. Office of Emergency and Remedial Response; US Environmental Protection Agency: Washington, DC, USA, 1989. [Google Scholar]
  39. China Statistics Bureau. China Statistical Yearbook; National Bureau of Statistics of China: Beijing, China, 2012; p. 62791819. [Google Scholar]
  40. Wang, F.; Wong, C.S.; Chen, D.; Lu, X.; Wang, F.; Zeng, E.Y. Interaction of toxic chemicals with microplastics: A critical review. Water Res. 2018, 174, 115644. [Google Scholar] [CrossRef]
  41. Barboza, L.G.A.; Vethaak, A.D.; Lavorante, B.R.B.O.; Lundebye, A.-K.; Guilhermino, L. Marine microplastic debris: An emerging issue for food security, food safety, and human health. Mar. Pollut. Bull. 2020, 133, 336–348. [Google Scholar] [CrossRef]
  42. Hüffer, T.; Hofmann, T. Sorption of non-polar organic compounds by micro-sized plastic particles in aqueous solution. Environ. Pollut. 2019, 214, 194–201. [Google Scholar] [CrossRef]
  43. Jenner, L.C.; Rotchell, J.M.; Bennett, R.T.; Cowen, M.; Tentzeris, V.; Sadofsky, L.R. Detection of microplastics in human lung tissue using μFTIR spectroscopy. Sci. Total Environ. 2022, 831, 154907. [Google Scholar] [CrossRef]
  44. Boucher, J.; Friot, D. Primary Microplastics in the Oceans: A Global Evaluation of Sources; IUCN: Gland, Switzerland, 2017. [Google Scholar] [CrossRef]
  45. Käppler, A.; Fischer, D.; Oberbeckmann, S.; Schernewski, G.; Labrenz, M.; Eichhorn, K.-J.; Voit, B. Analysis of Environmental Microplastics by Vibrational Microspectroscopy: FTIR, Raman or Both? Anal. Bioanal. Chem. 2016, 408, 8377–8391. [Google Scholar] [CrossRef] [PubMed]
  46. Thompson, A.K.; Hackett, C.; Grady, T.L.; Enyinnia, S.; Moore, Q.C.; Nave, F.M. Development and Characterization of Membranes with PVA Containing Silver Particles: A Study of the Addition and Stability. Polymers 2020, 12, 1937. [Google Scholar] [CrossRef]
  47. Shim, W.J.; Hong, S.H.; Eo, S.E. Identification Methods in Microplastic Analysis: A Review. Anal. Methods 2017, 9, 1384–1391. [Google Scholar] [CrossRef]
  48. Mazhar, M.; Abdouss, M.; Shariatinia, Z.; Zargaran, M. Graft Copolymerization of Methacrylic Acid Monomers onto Polypropylene Fibers. Chem. Ind. Chem. Eng. Q. 2014, 20, 87–96. [Google Scholar] [CrossRef]
  49. Courtene-Jones, W.; Quinn, B.; Gary, S.F.; Mogg, A.O.; Narayanaswamy, B.E. Microplastic Pollution Identified in Deep-Sea Water and Ingested by Benthic Invertebrates in the Rockall Trough, North Atlantic Ocean. Environ. Pollut. 2017, 231, 271–280. [Google Scholar] [CrossRef]
  50. Doğan, Ö.M.; Kayacan, İ. Pyrolysis of Low and High Density Polyethylene. Part II: Analysis of Liquid Products Using FTIR and NMR Spectroscopy . Energy Sources Part A Recovery Util. Environ. Eff. 2008, 30, 392–400. [Google Scholar] [CrossRef]
  51. Wang, W.; Gao, H.; Jin, S.; Li, R.; Na, G. The ecotoxicological effects of microplastics on aquatic food web, from primary producer to human: A review. Sci. Total Environ. 2020, 742, 136947. [Google Scholar] [CrossRef]
  52. Brahney, J.; Mahowald, N.; Prank, M.; Cornwell, G.; Klimont, Z.; Matsui, H.; Prather, K.A. Constraining the Atmospheric Limb of the Plastic Cycle. Proc. Natl. Acad. Sci. USA 2021, 118, e2020719118. [Google Scholar] [CrossRef]
  53. Sharmin, S.; Wang, Q.; Islam, M.R.; Wang, W.; Enyoh, C.E. Exploring Microplastic Distribution in Agricultural Soils and Health Risk Evaluation. Water Air Soil Pollut. 2024, 235, 511. [Google Scholar] [CrossRef]
  54. Abbasi, S.; Keshavarzi, B.; Moore, F.; Turner, A.; Kelly, F.J.; Dominguez, A.O.; Jaafarzadeh, N. Distribution and potential health impacts of microplastics in road dust from a major urban center. Environ. Pollut. 2019, 249, 113221. [Google Scholar] [CrossRef]
  55. Rochman, C.M.; Browne, M.A.; Halpern, B.S.; Hentschel, B.T.; Johnson, A.; Marko, P.B. Classifying plastic waste as hazardous. Science 2013, 344, 144–145. [Google Scholar] [CrossRef]
  56. Wright, S.L.; Ulke, J.; Font, A.; Chan, K.L.A.; Kelly, F.J. Atmospheric microplastic deposition in an urban environment and an evaluation of transport. Environ. Int. 2020, 136, 105411. [Google Scholar] [CrossRef] [PubMed]
  57. Yang, H.; Chen, G.; Wang, J. Microplastics in the Marine Environment: Sources, Fates, Impacts and Microbial Degradation. Toxics 2021, 9, 41. [Google Scholar] [CrossRef]
  58. Marnasidis, S.; Stamatelatou, K.; Verikouki, E.; Kazantzis, K. Assessment of the Generation of Empty Pesticide Containers in Agricultural Areas. J. Environ. Manag. 2018, 224, 37–48. [Google Scholar] [CrossRef] [PubMed]
  59. Brennecke, D.; Ferreira, E.C.; Costa, T.M. Microplastics as vectors for heavy metal transport in marine environments. Mar. Pollut. Bull. 2016, 109, 120–125. [Google Scholar] [CrossRef]
  60. Zhang, Q.; Xu, E.G.; Li, J.; Chen, Q.; Ma, L.; Zeng, E.Y.; Shi, H. A Review of Microplastics in Table Salt, Drinking Water, and Air: Direct Human Exposure. Environ. Sci. Technol. 2020, 54, 3740–3751. [Google Scholar] [CrossRef]
  61. Yee, M.S.; Hii, L.W.; Looi, C.K.; Lim, W.M.; Wong, S.F.; Kok, Y.Y.; Tan, B.K.; Wong, C.Y.; Leong, C.O. Impact of Microplastics and Nanoplastics on Human Health. Nanomaterials 2021, 11, 496. [Google Scholar] [CrossRef] [PubMed]
  62. Amato-Lourenço, L.F.; Carvalho-Oliveira, R.; Júnior, G.R.; Dos Santos Galvão, L.; Ando, R.A.; Mauad, T. Presence of Airborne Microplastics in Human Lung Tissue. J. Hazard. Mater. 2021, 416, 126124. [Google Scholar] [CrossRef]
  63. Vianello, A.; Jensen, R.L.; Liu, L.; Vollertsen, J. Simulating Human Exposure to Indoor Airborne Microplastics Using a Breathing Thermal Manikin. Sci. Rep. 2019, 9, 8670. [Google Scholar] [CrossRef]
  64. Akdogan, Z.; Guven, B. Microplastics in the Environment: A Critical Review of Current Understanding and Identification of Future Research Needs. Environ. Pollut. 2019, 254, 113011. [Google Scholar] [CrossRef]
  65. Prata, J.C.; Da Costa, J.P.; Lopes, I.; Duarte, A.C.; Rocha-Santos, T. Environmental Exposure to Microplastics: An Overview on Possible Human Health Effects. Sci. Total Environ. 2020, 702, 134455. [Google Scholar] [CrossRef]
  66. Zhang, Y.; Kang, S.; Allen, S.; Allen, D.; Gao, T.; Sillanpää, M. Atmospheric Microplastics: A Review on Current Status and Perspectives. Earth-Sci. Rev. 2020, 203, 103118. [Google Scholar] [CrossRef]
  67. Liu, K.; Wang, X.; Fang, T.; Xu, P.; Zhu, L.; Li, D. Source and Potential Risk Assessment of Suspended Atmospheric Microplastics in Shanghai. Sci. Total Environ. 2019, 675, 462–471. [Google Scholar] [CrossRef] [PubMed]
  68. Gasperi, J.; Wright, S.L.; Dris, R.; Collard, F.; Mandin, C.; Guerrouache, M.; Langlois, V.; Kelly, F.J.; Tassin, B. Microplastics in Air: Are We Breathing It In? Curr. Opin. Environ. Sci. Health 2018, 1, 1–5. [Google Scholar] [CrossRef]
  69. Sarkar, D.J.; Sarkar, S.D.; Das, B.K.; Sahoo, B.K.; Das, A.; Nag, S.K.; Samanta, S. Occurrence, Fate and Removal of Microplastics as Heavy Metal Vector in Natural Wastewater Treatment Wetland System. Water Res. 2021, 192, 116853. [Google Scholar] [CrossRef]
  70. Browne, M.A.; Crump, P.; Niven, S.J.; Teuten, E.L.; Tonkin, A.; Galloway, T.S.; Thompson, R.C. Accumulation of Microplastic on Shorelines Worldwide: Sources and Sinks. Environ. Sci. Technol. 2011, 45, 9175–9179. [Google Scholar] [CrossRef]
  71. Horton, A.A.; Walton, A.; Spurgeon, D.J.; Lahive, E.; Svendsen, C. Microplastics in Freshwater and Terrestrial Environments: Evaluating the Current Understanding to Identify the Knowledge Gaps and Future Research Priorities. Sci. Total Environ. 2017, 586, 127–141. [Google Scholar] [CrossRef] [PubMed]
  72. USEPA. Guidelines for Carcinogen Risk Assessment; US Environmental Protection Agency: Washington, DC, USA, 2005. [Google Scholar]
  73. Smith, M.; Love, D.C.; Rochman, C.M.; Neff, R.A. Microplastics in Seafood and the Implications for Human Health. Curr. Environ. Health Rep. 2018, 5, 375–386. [Google Scholar] [CrossRef]
  74. Rochman, C.M.; Brookson, C.; Bikker, J.; Djuric, N.; Earn, A.; Bucci, K.; Athey, S.N. Rethinking Microplastics as a Diverse Contaminant Suite. Environ. Toxicol. Chem. 2019, 38, 703–711. [Google Scholar] [CrossRef]
  75. Li, J.; Liu, H.; Chen, J.P. Microplastics in Peri-Urban Environments: A Review of Sources, Pathways, and Impacts. J. Hazard. Mater. 2023, 443, 130219. [Google Scholar] [CrossRef]
  76. Li, H.; Liu, H.; Lin, Q.; Chen, T.; Peng, R. The Hidden Threat of Microplastics in Desert Environments: Environmental Impact, Challenges, and Response Measures. Sustainability 2025, 17, 1897. [Google Scholar] [CrossRef]
  77. Kabir, A.E.; Sekine, M.; Imai, T.; Yamamoto, K.; Kanno, A.; Higuchi, T. Assessing Small-Scale Freshwater Microplastics Pollution, Land-Use, Source-to-Sink Conduits, and Pollution Risks: Perspectives from Japanese Rivers Polluted with Microplastics. Sci. Total Environ. 2021, 768, 144655. [Google Scholar] [CrossRef] [PubMed]
  78. Dehghani, S.; Moore, F.; Akhbarizadeh, R. Microplastic Pollution in Deposited Urban Dust, Tehran Metropolis, Iran. Environ. Sci. Pollut. Res. 2017, 24, 20360–20371. [Google Scholar] [CrossRef] [PubMed]
Figure 1. Map of Bangladesh showing road dust sampling sites.
Microplastics 04 00073 g001
Figure 2. Road dust sample collection and preparation stage.
Microplastics 04 00073 g002
Figure 3. Pretreatment procedure of road dust samples and identification of MPs. Road dust samples collected were separated into particles ≤ 500 um before oxidizing to destroy organic matter, separated based on particle density before analyzing by fluorescence microscope and FTIR (Fourier Transform Infrared Spectroscopy).
Microplastics 04 00073 g003
Figure 4. MPs under a fluorescence microscope (10× magnification) in various shapes: (a) irregular, (b) granular, (c) fragment, (d) film, (e) line/fiber, and (f) pellet.
Microplastics 04 00073 g004
Figure 5. Types of FTIR spectra found in road dust microplastics: (a). PVA, (b). PE, (c). PP, (d). PS, (e). LDPE, and (f). HDPE.
Microplastics 04 00073 g005
Figure 6. Average number of MPs per gram of sieved dust, classified by polymer type.
Microplastics 04 00073 g006
Figure 7. Presence of various MPs such as polypropelyne, Polyvinyl alcohol, Polyethylene, Polystyrene, Low-Density Polyethylene and High-Density Polyethylene on the basis of its proportion across different land-use categories.
Microplastics 04 00073 g007
Figure 8. Principal component analysis of the identified MPs.
Microplastics 04 00073 g008
Table 1. Identified polymers and hazard scores.
PolymersHazard Score (Sj)
Polypropylene (PP)1
Polystyrene (PS)30
High-Density Polyethylene (HDPE)11
Polyethylene (PE)11
Polyvinyl Alcohol (PVA)1
Low-Density Polyethylene (LDPE)211
Table 3. FTIR spectral characteristics, functional groups, and sources of microplastic polymers in road dust.
Polymer TypeCharacteristic Peaks (cm−1)Functional GroupsMajor SourcesReferences
PVA3727, 3300–3500, 2945, 1054–OH stretching, C–H, C–O stretchingTextile coatings, adhesives, packaging materials[46]
PE2918C–H stretching (aliphatic hydrocarbons)Plastic bags, bottles, packaging materials[47]
PP2950, 2918, 2869, 1455, 1375, 840C–H stretching & bending, CH3, CH2Food containers, automotive parts, household plastics[48]
PS3009, 1537Aromatic C–H, C=C (benzene ring)Disposable cutlery, foam packaging, insulation materials[48]
LDPE3076, 1011C–H stretching, C–C stretching, bendingPlastic films, food wraps, shopping bags[49]
HDPE3378, 1689, 996–OH, C–C stretching, C–H bendingPlastic pipes, detergent bottles, industrial containers[50]
Table 4. Estimated daily intake of road dust MPs via three exposure pathways (MP particles/g/day).
PolymersRoutesEDI of Child for IAEDI of Adult for IAEDI of Child for CCAEDI of Adult for CCAEDI of Child for PAEDI Adult for PA
PPIngestion8.6 × 10−111.1 × 10−115.9 × 10−117.6 × 10−124.4 × 10−115.8 × 10⁻¹²
Inhalation2.4 × 10−91.0 × 10−91.6 × 10−97.2 × 10−101.2 × 10−95.4 × 10−10
PVAIngestion1.9 × 10−112.6 × 10−121.8 × 10−112.3 × 10−121.2 × 10−111.6 × 10⁻¹²
Inhalation5.6 × 10−102.4 × 10−104.9 × 10−102.2 × 10−103.5 × 10−101.5 × 10⁻¹⁰
PEIngestion1.9 × 10−112.5 × 10−121.4 × 10−111.9 × 10−121.1 × 10−111.4 × 10⁻¹²
Inhalation5.3 × 10−102.3 × 10−103.9 × 10−101.8 × 10−103.1 × 10−101.4 × 10⁻¹⁰
PSIngestion1.1 × 10−111.5 × 10−121.2 × 10−111.5 × 10−129.3 × 10−121.2 × 10⁻¹²
Inhalation3.1 × 10−101.4 × 10−103.3 × 10−101.4 × 10−102.6 × 10−101.1 × 10⁻¹⁰
HDPEIngestion9.3 × 10−121.2 × 10−129.6 × 10−121.3 × 10−128.1 × 10−121.1 × 10⁻¹²
Inhalation2.6 × 10−101.1 × 10−102.7 × 10−101.2 × 10−102.3 × 10−109.9 × 10⁻¹¹
LDPEIngestion9.6 × 10−121.3 × 10−129.6 × 10−121.3 × 10−127.8 × 10−121.0 × 10⁻¹²
Inhalation2.7 × 10−101.2 × 10−102.7 × 10−101.2 × 10−102.2 × 10−109.6 × 10⁻¹¹
IA = industrial area, CCA = capital city area, PA = peri-urban area.
Table 5. Estimated LADD of MPs via ingestion and inhalation exposure routes (MP particles/g/day).
PolymersRoutesIndustrial AreasCapital City AreasPeri-Urban Areas
PPIngestion3.6 × 10−111.5 × 10−111.8 × 10⁻¹¹
Inhalation1.1 × 10−81.8 × 10−91.4 × 10−9
PVAIngestion8.2 × 10−124.4 × 10−125.1 × 10⁻¹²
Inhalation2.5 × 10−95.5 × 10−103.9 × 10⁻¹⁰
PEIngestion7.8 × 10−123.6 × 10−124.5 × 10⁻¹²
Inhalation2.3 × 10−94.4 × 10−103.4 × 10⁻¹⁰
PSIngestion4.6 × 10−122.9 × 10−123.8 × 10⁻¹²
Inhalation1.4 × 10−93.6 × 10−102.9 × 10⁻¹⁰
HDPEIngestion3.8 × 10−122.4 × 10−123.4 × 10⁻¹²
Inhalation1.2 × 10−92.9 × 10−102.5 × 10⁻¹⁰
LDPEIngestion3.9 × 10−122.4 × 10−123.2 × 10⁻¹²
Inhalation1.2 × 10−92.9 × 10−102.4 × 10⁻¹⁰
Table 6. Cumulative carcinogenic risk (CCR) for road dust MPs.
PolymersIndustrial AreasCapital City AreasPeri-Urban Areas
PP2.6× 10−94.4× 10−103.3× 10⁻¹⁰
PE2.5× 10−95.6× 10−103.9× 10⁻¹⁰
HDPE2.4× 10−94.5× 10−103.5× 10⁻¹⁰
LDPE1.4× 10−93.7× 10−102.9× 10⁻¹⁰
Total8.9× 10−91.8× 10−91.4× 10−9
Table 7. Risk assessment indices for microplastics in road dust.
LocationspRareapRi ValueRisk Category
Industrial areas2.67138.17
Capital city areas2.41Low
Peri urban areas1.94
Disclaimer/Publisher’s Note: The statements, opinions and data contained in all publications are solely those of the individual author(s) and contributor(s) and not of MDPI and/or the editor(s). MDPI and/or the editor(s) disclaim responsibility for any injury to people or property resulting from any ideas, methods, instructions or products referred to in the content.