Abstract
Density separation using a wet method is the standard technique for extracting microplastics (MPs) from coastal sediments. However, the 2021 Japanese submarine volcanic eruption introduced substantial pumice into these sediments, complicating the process. Pumice contamination in the floating matter from density separation significantly increases the workload of visual sorting. Pumice, distinguished by its spherical shape and hardness, exhibits distinct rolling and bouncing behaviors compared to plastic. In this study, we evaluated the sorting efficiency of a vibratory sorter in separating pumice from floating matter, comparing its performance with the existing methods. We analyzed the progressive behavior and the virtual sorting efficiency of single large- and medium-diameter particles using a vibrating plate and the actual sorting efficiency of mixed large-diameter particles. The maximum Newton’s efficiencies (ηmax) for the virtual sorting of single large-diameter pumice and plastic ranged from 0.74 to 1.00, and for medium-diameter particles, from 0.74 to 0.97. Sorting efficiency decreased with finer particles. The ηmax for the actual sorting of mixed large-diameter pumice and plastic was between 0.68 and 1.00, lower than the virtual sorting efficiency. While vibratory sorting, based on Newton’s efficiency, does not replace visual sorting, the time required for vibratory sorting is 21% of that required for visual sorting, making it valuable for estimating approximate MP quantities in coastal sediments. Additionally, this study provides a practical method for beach cleanups.
1. Introduction
Plastics are fundamental to the functioning of contemporary society. Plastic production has remarkably increased over the last seven decades, growing from 2 million tons per year in 1950 [1] to 460 million tons per year by 2019 [2]. This surge has resulted in a global plastic waste volume of 350 million tons in 2019 [2]. Plastic waste, originating as small particles or becoming miniaturized through external factors, such as UV radiation and heat [3], includes microplastics (MPs), which are plastic particles smaller than 5 mm in size. MPs have been identified as pollutants in marine ecosystems [4,5,6], with an estimated annual input of approximately 2.7 million tons in 2019 [7]. These MPs are found not only in oceans near populated areas but also in distant environments, like the Arctic and Antarctic Oceans [8] and deep-sea trenches [9].
Concerns are rising regarding the detrimental effects of MPs entering organisms through misfeeding and other routes of exposure. MPs have been detected in marine organisms [10,11,12] and, alarmingly, in human bodies [13,14]. The impact of MPs extends beyond direct physical damage [15,16] to include their role as carriers of chemical pollutants [17,18], which can enhance their accumulation in living tissues [19]. In response to these risks, global initiatives to promote plastic reduction and reuse have been launched, including in Europe [20], the United States [21], and Japan [22]. Ongoing monitoring of MP contamination is essential to effectively measure the success of these worldwide efforts to combat plastic pollution.
Global efforts to monitor MP contamination are being vigorously pursued. Focusing specifically on coastal environments, the Scopus database reveals that 64 countries have conducted active surveys between 2000 and 2023 [23]. MP surveys are not limited to regions with high plastic waste generation, such as China [24], India [25], Japan [26], and North America [27], but also encompass Europe [28,29], South America [30], Africa [31], and Australia [32], among other global locations. A common technique employed in these studies for extracting MPs from coastal sediments is wet density separation using heavy liquids [33,34].
In the density separation of coastal sediments, particularly beach sand, the floating fraction includes plant matter, such as wood fragments and seeds, as well as MPs. Asakura (2023) [35] indicated that wood’s flotation is due to its dry state, and because its true density exceeds 1 g/cm3, it can be induced to sink during density separation by using heat to improve its wetting property. However, some contaminants do not respond well to wetting enhancement. In August 2021, a submarine volcanic eruption off the Ogasawara Islands, Japan, caused pumice to drift to numerous locations in Japan. In an MP investigation on a beach in Nagasaki Prefecture by Asakura (2023) [35], substantial amounts of pumice (density after boiling: 0.89 g/cm3, n = 6) were observed around September 2022, which did not sink, even with heat application (Figure 1). The percentage of floating contaminants, comprising pumice and wood, following heat treatment, rose from an average of 20% by weight (n = 124) prior to the significant pumice drift to an average of 52% (n = 65) after the drift [35]. Therefore, the separation of pumice and MPs has become a critical requirement. According to the NOAA protocol [36] for MP analysis of beach sand, sieved sand undergoes density separation using a heavy liquid (1.6 g/cm3). The resulting floating matter is heated and treated with hydrogen peroxide, followed by another density separation process. Finally, MPs are isolated through visual sorting via microscopy. Wood, even if intact, absorbs moisture and sinks, allowing its removal during the hydrogen peroxide heating stage. However, pumice is not eliminated until the concluding visual sorting, remaining mixed with MPs throughout the earlier steps. This is acceptable for minimal pumice presence. Yet, when MPs are present in low concentrations within a large volume of pumice, an alternative pumice removal technique that can replace visual sorting is needed.
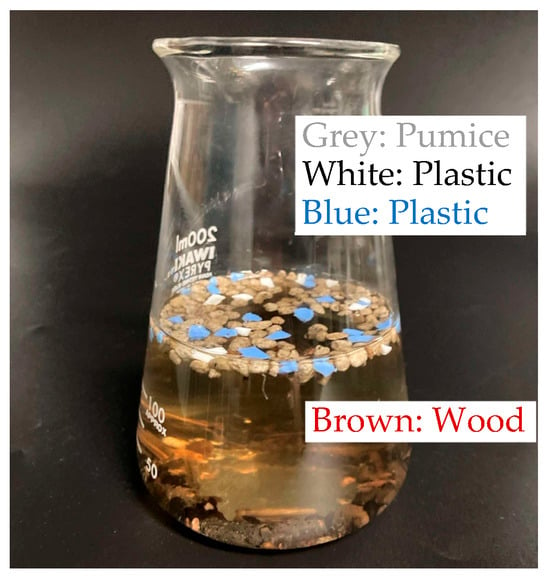
Figure 1.
Density separation of wood, pumice, and microplastic (MP) particles after heat treatment.
Alternative sorting techniques include flotation methods that utilize bubbles to selectively lift plastics [37] and oil-based methods that create a heavy liquid layer that induces the flotation of MPs [38]. However, these wet sorting methods rely on density differences between MPs and the fluid, rendering them ineffective for removing pumice, which has a similar density to MPs. A method specifically targeting pumice exists, which utilizes decompression to remove air from pumice pores, promoting wetting and settling [39]. While this method shows promise for selectively removing pumice, it necessitates specialized equipment. A dry sorting technique, electrostatic sorting [40], has the potential to remove pumice by attracting MPs through electrical forces; however, it also requires a specialized apparatus.
Once sieved and density-separated, the floating matter achieves a similar size and density, demanding further sorting based on other characteristics. In this mixture, pumice is distinguished by its spherical shape and hardness. In contrast, plastics typically have more varied shapes and are frequently flexible. This suggests that pumice may exhibit greater rolling and bouncing behaviors than plastic. Therefore, separation could be achieved by rolling them down a sloped surface, with vibration used to accelerate the particle flow. Vibratory sorting is commonly employed to separate particles, as demonstrated in applications such as solid-waste sorting [41,42], mineral processing [43,44], and grain separation [45].
The primary objective of this study was to evaluate the sorting efficiency of a vibratory sorter for pumice removal from density-separated floating matter and to benchmark its performance against current techniques. To mimic sorting by citizen scientists, commercially accessible and affordable equipment was chosen. Controlled materials were used for the initial experiments. For pumice to be separated from plastic, pumice must move more rapidly on a vibrating plate. If the speed of particle movement differs with particle size, the particle size will affect the sorting efficiency. To simplify the experiment, we began with single particles but progressed to a mixed sample of various particle types. As particle interactions can potentially alter their movement, this research used a vibrating plate to investigate the progressive behavior and virtual sorting efficiency of individual large- and medium-diameter particles, as well as the actual sorting efficiency of mixed large-diameter particles.
2. Materials and Methods
2.1. Sorting and Newton’s Efficiency
The efficiency of sorting a mixture of two particle types was evaluated using Newton’s efficiency [46], a metric that represents the ratio of successful target component separation. Newton’s efficiency has been applied to assess sorting efficiency in contexts such as grain separation [45] and the recovery of useful materials from municipal solid-waste incineration ash [47]. When a mixture of particles, A and B, is separated into two fractions, X and Y (e.g., X representing the outflowed fraction and Y the retained fraction), Newton’s efficiency, η (0 ≤ η ≤ 1), is determined using Eq. 1, based on the recovery rates rA of particle A and rB of particle B in fraction X. The same result is obtained by calculating the recovery rates of particles within fraction Y. Furthermore, the outcome remains unchanged regardless of whether the goal is to extract particle A or particle B.
η = |rA − rB|
Figure 2 depicts the sorting process and Newton’s efficiency calculation using a vibrating plate as an example. Let the blue particles represent A and the orange particles B. A mixture of A and B was fed onto the vibrating plate. If we assume the particles separate into two distributions on the basis of their progression speed, with A being faster and B being slower, the distribution is represented by two bell-shaped curves, blue and orange, as shown in Figure 2a. Over time, the particles are separated into fractions that have exited the outlet and those that remain. As time increases, the cumulative outflow of particles A grows, followed by the cumulative outflow of particles B. The cumulative relative frequency distribution of outflowed particles A and B with respect to time indicates their recovery rates in the outflowed fraction. Therefore, the discrepancy in cumulative relative frequencies (cumulative probability) between the two particle types at a specific time point corresponds to Newton’s efficiency (Figure 2b).
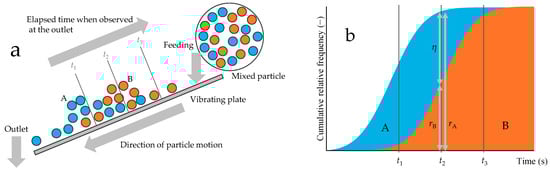
Figure 2.
Sorting of mixtures and Newton’s efficiency. (a) Mixed particles are separated into single particles by a sorter; (b) cumulative relative frequency distribution of the two components flowing out of the sorter.
As described earlier, the initial result of the sorting experiment yields a bell-shaped distribution (Figure 2a, horizontal axis: elapsed time, vertical axis: relative frequency of outflowed particles). In our sorting experiments, we began with reference conditions and then introduced changes. Consequently, we aimed to evaluate how these changes affected the bell-shaped distribution. While the test of difference of population means, a commonly used statistical tool, can identify the presence or absence of a difference, it does not quantify the extent of that difference. Furthermore, it focuses solely on the population mean, neglecting the overall distribution differences. As effect size indicates the degree of separation between distributions, it does not reflect the degree of overlap. Thus, we calculated the area of overlap between the two probability distributions, representing the degree of agreement in distribution (DAD) (Figure 3).
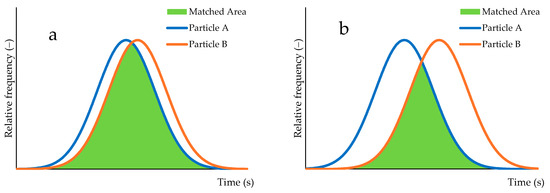
Figure 3.
Visualization of the degree of agreement in distribution (DAD): (a) 0.84; (b) 0.55.
2.2. Instruments
The vibratory sorter consists of a vibrating plate, a vibration unit, and a base, as shown in Figure 4. The primary materials used were an aluminum tray (350 mm × 254 mm × 19 mm, Oomori Co., Ltd., Koshigaya, Japan), a motor (FA-130RA-2270, Mabuchi Motor Co., Ltd., Matsudo, Japan), an eraser (PE-04A, Tombow Pencil Co., Ltd., Tokyo, Japan), instant adhesive (Aron Alpha General-purpose type, Toagosei Co., Ltd., Tokyo, Japan), a gear (Mini 4WD 1.4 mm Hollow Propeller Shaft, Tamiya Co., Ltd., Shizuoka, Japan), two dry cell batteries (TNH-3A 4P/1.2V, Toshiba Co., Ltd., Tokyo, Japan), a battery holder (R6/AA/UM3 battery box w/ Switch, Tamiya Co., Ltd.), and a support stand (pulley unit set, Tamiya Co., Ltd.). The vibrating plate was fabricated from the underside of the aluminum tray. A vibration unit was attached to one end of the aluminum tray. This unit consisted of a motor, an off-center weight (a gear embedded and glued at the 7 mm: 4 mm position on the horizontal centerline of an 11 mm cubed eraser), a power supply (dry cell batteries and a battery holder), and a support stand, which was secured to the vibrating plate with adhesive tape. The base was made of A4-sized copy paper. The sound generated by the vibratory sorter was recorded using a mobile phone to capture a waveform and calculate the frequency, averaging 37 Hz. The usable sorting length of the vibrating plate was 20 cm. Preliminary tests with the vibratory sorter established that an angle of 4.4 degrees allowed the majority of pumice particles (2.00 to 4.75 mm in diameter) to traverse 20 cm in approximately 10 s. A 3.3 cm-thick stack of copy paper was prepared as a base to maintain this angle.
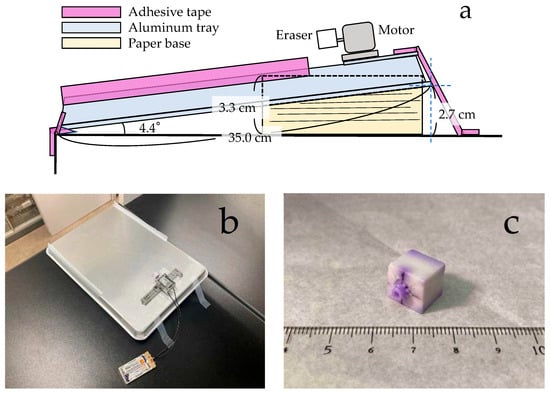
Figure 4.
Vibratory sorter. (a) Schematic diagram; (b) photograph taken from above; (c) weight made from an eraser.
2.3. Materials
The samples used were beach drift collected and artificially processed, commercially obtained materials. The drift was collected from a sandy beach in Nagasaki Prefecture, Japan (32.7713’ N, 129.8017’ E) in December 2022. Pumice, wood, and seeds from the drift were used as contamination samples. Although wood and seeds, which are plant-based, can be sedimented through density separation following heat treatment [35], they were included to assess their removal by vibratory sorting. Both drifted and purchased, artificially processed plastics were used as plastic samples. Drifted plastics comprised fertilizer capsule (PE), plastic bottle label (PS), fishing rope (PP), and expanded polystyrene foam (PS). Purchased plastics included clothespin (PP), polybottle (PE), corrugated sheet (PVC), shopping bags (PE), plastic bottle labels (PS), Lumirror® film (PET), construction rope (PE and PP), and expanded polystyrene foam (PS). Plastic materials (PE, PP, PVC, PET, and PS) were identified using a Fourier transform infrared spectrophotometer (FT/IR-4600, JASCO Co., Ltd., Tokyo, Japan). The drift samples were dried at 80 °C for 24 h using a drying oven. Most of the drift materials (pumice, wood, seeds, fertilizer capsules, and expanded polystyrene) were cut using scissors. Stainless-steel sieves (SAMPO Co., Ltd., Koshigaya, Japan) with mesh sizes of 0.85, 2.00, and 4.75 mm were used to standardize the particle size of the samples. Particles with diameters between 2.00 and 4.75 mm were designated as “large-diameter” and those between 0.85 and 2.00 mm as “medium-diameter” particles. The details of the particles used in the sorting experiments are listed in Table 1, and sample photographs are provided in Figure A1.

Table 1.
Detailed characteristics of the particles used in the sorting experiments.
Samples were classified and named using the following method. First, they were grouped into contaminant (CT) and plastic (PL). Shapes were then categorized into four types: mass (M), sheet (S), fiber (F), and expanded polystyrene foam (E). Materials were classified as pumice (MC), wood (WD), seed (SD), PE, PP, PVC (PV), PET (PT), and PS. The origin of each sample was identified as either field collection (f) or artificial processing (a). For instance, a plastic sample, shaped as a sheet, made of PS, and artificially processed, would be labeled PL-S-PS-a.
2.4. Overview of the Existing Sorting Experimental Procedures
To evaluate the difficulty of sorting using the existing methods, specifically visual sorting and decompression processing, experiments were performed.
2.4.1. Visual Sorting
A mixture of 90 particles—30 pumice, 30 wood, and 30 plastic—was created and placed on stainless-steel trays. Visual identification was performed, and 30 pumice particles were removed with tweezers and the time taken was measured (Figure 5). While the materials of large-diameter samples were generally easily identified visually, some samples were confirmed using FT/IR for added assurance. This sorting procedure was repeated five times. The plastic samples consisted of four categories of beach drift: PL-M-PE-f, PL-S-PS-f, PL-F-PP-f, and PL-E-PS-f. Although wood is eliminated through boiling and is therefore largely absent during visual sorting, it was added to replicate the mixture conditions used in the vibratory sorter experiments.
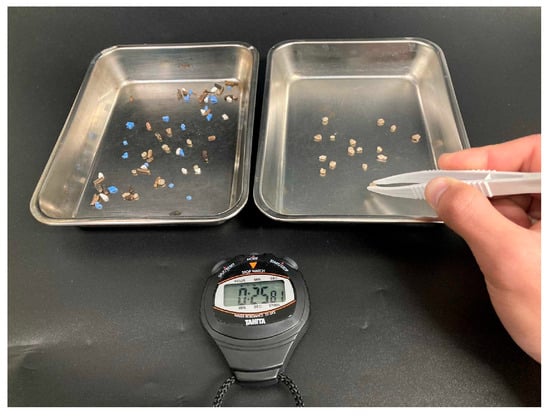
Figure 5.
Photograph of the visual sorting process, showing the manual separation of particles.
2.4.2. Pumice Settling Process via Decompression Treatment
Large-diameter pumice samples (30) and plastic samples (PL-M-PE-a, 30) were separately placed into gas washing bottles (PP, 500 mL, AZ ONE). Decompression was performed for 5 min using an affordable air pump (MAS-1, AZ ONE), after which 100 mL of water was added to enhance pumice wetting and settling (Figure 6). The floating and settled particles were collected, and pumice particles were visually counted. This sorting procedure was repeated twice. It is important to acknowledge that conventional methods utilize a robust pump to create a near-vacuum within a sealed vessel [39].
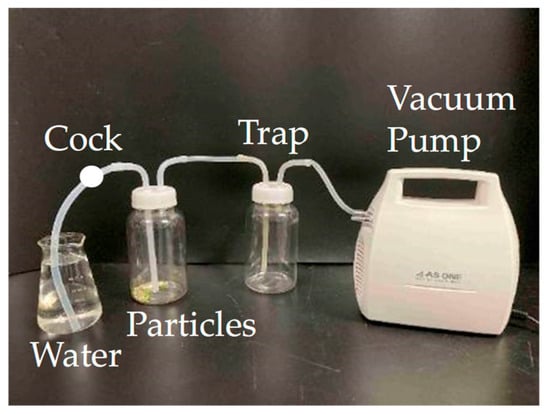
Figure 6.
Equipment used in the decompression treatment process. After decompression treatment for 5 min with the cock closed, the cock was opened to introduce water.
2.5. Procedure for Sorting Experiments Using a Vibratory Sorter
For the vibratory sorter experiments, three sample types were utilized: large-diameter single particles, medium-diameter single particles, and large-diameter mixed particles. Single-particle trials involved 100 particles, whereas mixed-particle trials used 30 particles each of large-diameter pumice, wood, and plastic, for a total of 90 particles. Samples were aligned in a straight line, 20 cm from the vibrating plate’s outlet (Figure 7a). Upon activation of the vibrator, a stopwatch was used to measure the elapsed time. Particles dispersed and moved toward the outlet as time passed (Figure 7b). A video camera captured footage of the outlet region and the stopwatch. The number of particles flowing out was tallied every 2 s from 0 to 60 s in the videos. Particles that did not exit within 60 s were assigned a dummy outflow time of 61 s. Each sorting experiment was repeated five times. Material identification was unnecessary for single-particle experiments. Mixed-particle experiments utilized large-diameter samples, which were generally identifiable visually, but some were confirmed with FT/IR for accuracy.
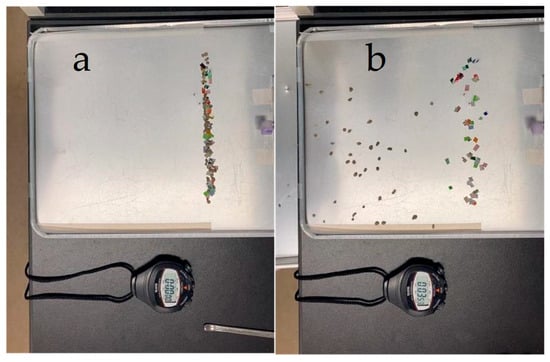
Figure 7.
Sequential images showing the movement of particles on the vibrating plate. (a) Before sorting; (b) after sorting begins, the pumice particles move quickly, while the sheet-like plastic particles move slowly.
All samples were used in the large-diameter single-particle experiments. However, in the medium-diameter single-particle and large-diameter mixed-particle experiments, only a selection of samples, specifically those marked with M and X on the right side of Table 1, were employed.
3. Results and Discussion
3.1. Sorting Experiments
3.1.1. Visual Sorting
The time and Newton’s efficiency for visual sorting are detailed in Table 2. The time taken ranged from 61 to 76 s. In the visual sorting task, Newton’s efficiency was roughly 1.00.
Table 2.
Newton’s efficiency (η) and time required for visual sorting of samples.
3.1.2. Pumice Settling Process via Decompression Treatment
Decompression processing resulted in no pumice settling. The processing time was 5 min (300 s), with a Newton’s efficiency of 0.00. The affordable decompression equipment employed in this study did not cause pumice to settle.
3.2. Large-Diameter Single-Particle Behavior and Virtual Sorting Efficiency in a Vibratory Sorter
As an example of the large-diameter single-particle sorting results, Figure 8 shows the probability distribution of outflow times for pumice (CT-M-MC-f) and PL-M-PE-f. This is a relative frequency distribution (probability distribution) obtained from the frequency distribution of 500 particles, which represents a total of five experiments, each using 100 particles. The peak outflow time was 7 s for pumice and 21 s for PL-M-PE-f. The pumice distribution was sharply peaked, while the PL-M-PE-f distribution was moderately spread. If particle outflow is separated at around 13 s, it is expected that most pumice (outflowed) and PL-M-PE-f (non-outflowed) can be sorted. Because of the limitations of presenting all figures, Table 3 provides the expected values and standard deviations of the particle outflow time probability distributions. For large-diameter single particles, pumice particles tend to exit quickly, whereas plastic particles tend to exit slowly, indicating a potential for separating pumice and plastic. However, some plastic samples have large standard deviations, potentially leading to overlap with the pumice distribution.
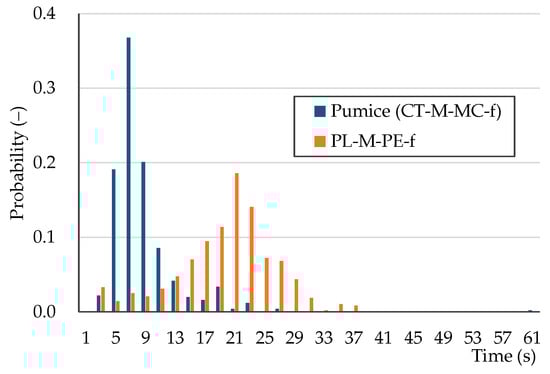
Figure 8.
Outflow time probability distribution for large-diameter single particles: pumice (CT-M-MC-f) and PL-M-PE-f.
Table 3.
Expected value (E) and standard deviation (S.D.) of outflow time (T) probability distributions for particles.
Understanding the sorting relationship between different particles solely from the expected value and the standard deviation of outflow time is challenging. By transforming the outflow time probability distribution into a cumulative probability distribution (Figure 9), a clearer picture emerges. Drawing perpendicular lines from the intersection points of the horizontal lines at 25%, 50%, and 75% cumulative probability with the sample’s cumulative probability curve yields the quartile range and the median outflow time (Figure 9). The quartile ranges of outflow times are illustrated in Figure 10. Remarkably, most plastic samples exhibit slower outflow times than pumice, with sheet plastics showing particularly slow outflow.
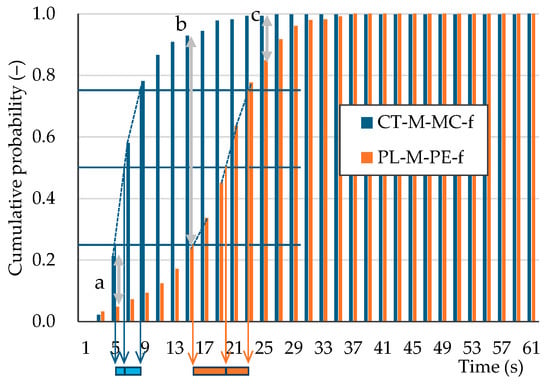
Figure 9.
Cumulative outflow-time probability distribution for large-diameter single particles: pumice (CT-M-MC-f) and PL-M-PE-f. The method for calculating the quartile range of the outflow time from the cumulative probabilities of 25%, 50%, and 75% is also shown. See Figure 11 for a, b, and c.
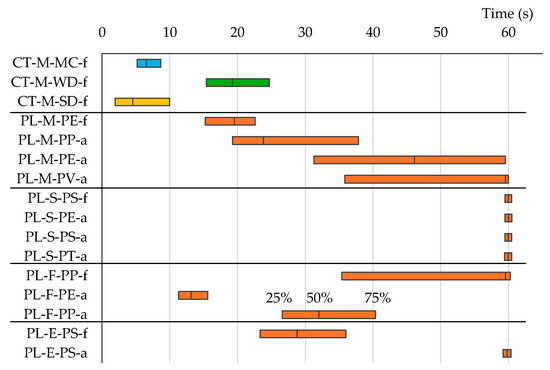
Figure 10.
Quartile ranges of outflow times for large-diameter single particles.
Newton’s efficiency is used to evaluate the true performance of the sorting process. It is calculated from the absolute difference in cumulative relative frequencies (cumulative probability) at the same time point, using the cumulative distribution of two particle types. Figure 11 shows an example of the time–Newton’s efficiency relationship for the virtual sorting of large-diameter single-particle CT-M-MC-f (pumice) and PL-M-PE-f. The cumulative probability differences a, b, and c in Figure 9 correspond to Newton’s efficiencies a, b, and c in Figure 11. Maximum sorting efficiency is attained if the outflowed and non-outflowed particle fractions are separated at the elapsed time, Tmax, which indicates the maximum Newton’s efficiency, ηmax. When the outflow time distributions of two particle types differ, as shown in Figure 2, Newton’s efficiency initially increases because the outflow of particle A, the faster particle, dominates. After that, Newton’s efficiency reaches a maximum at a specific time. When particle B, the slower particle, begins to flow out, Newton’s efficiency decreases because the outflowed particles are a mixture of A and B. Furthermore, if particle B starts to flow out before particle A has fully exited, ηmax will be less than 1 because the outflowed fraction will be a mixture of particles. Table 4 presents ηmax and the corresponding time. For the virtual sorting of large-diameter single-pumice and -plastic particles, ηmax ranged from 0.74 to 1.00. Specifically, for pumice against PL-M-PE-f and PL-F-PE-a, ηmax was below 0.8. These two plastic samples exhibited a relatively rapid outflow, possibly due to the spherical shape of PL-M-PE-f and the cylindrical shape of PL-F-PE-a, which is thicker and rolls more easily than PL-F-PP-a. The ηmax values for the remaining plastics exceeded 0.89. Remarkably, sheet (PL-S) plastics had ηmax values close to 1.00 owing to their extended outflow times.
Table 4.
Maximum Newton’s efficiency ηmax and time Tmax for virtual sorting of large-diameter single particles.
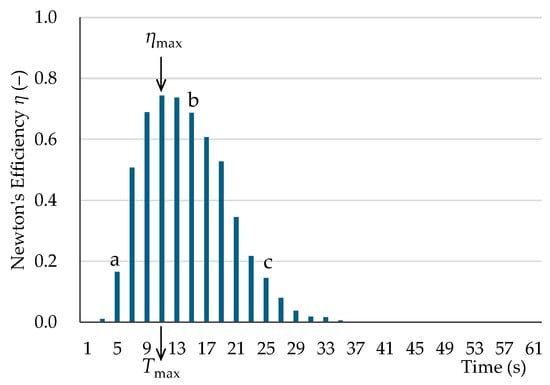
Figure 11.
Newton’s efficiency vs. time for virtual sorting of large-diameter single particles: pumice (CT-M-MC-f) and PL-M-PE-f. ηmax: maximum Newton’s efficiency. Tmax: elapsed time at ηmax. See Figure 9 for a, b, and c.
Newton’s efficiencies for virtual sorting between pumice and each plastic sample were calculated, and their minimum, average, and maximum values were determined (Figure 12). Plastic samples with high velocities showed a decrease in Newton’s efficiency after prolonged sorting, as they eventually became part of the outflowed fraction. Conversely, plastic samples with low velocities showed continuously increasing Newton’s efficiency owing to their delayed outflow. On average, Newton’s efficiency peaked at 0.85 after approximately 10 s.
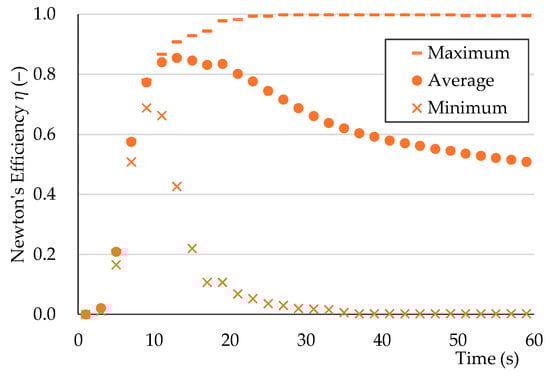
Figure 12.
Newton’s efficiency (minimum, average, and maximum) vs. time for virtual sorting of large-diameter single particles: pumice (CT-M-MC-f) and all plastic samples.
3.3. Medium-Diameter Single-Particle Behavior and Virtual Sorting Efficiency in a Vibratory Sorter
Table 3 presents the expected value and the standard deviation of the outflow time probability distributions for medium-diameter single particles. The expected values and the standard deviations were similar for both large- and medium-diameter particles. Figure 13 displays the quartile range of outflow times. The experiment with medium-diameter particles aimed to determine if particle sizes affect outflow time distribution. Figure 13 compares the quartile ranges for large and medium particle diameters simultaneously. The quartile ranges for large- and medium-diameter contaminants (pumice, plants, and seeds) exhibited similarities, while the quartile range for plastic samples showed variations. Table 5 displays the degree of agreement in the distributions (DADs) between large- and medium-diameter particles. The DAD for pumice is 0.61. Figure 13 further shows that the median outflow time was shorter for medium-diameter pumice than for large-diameter pumice. Therefore, as pumice particles decreased in size, the outflow time distribution shifted toward shorter times. This shift is advantageous for pumice and plastic sorting. However, the outflow time distribution of plastics also shifted toward shorter times in numerous instances. If plastics flowed out more rapidly, Newton’s efficiency might be decreased owing to overlap with pumice outflow times. The maximum Newton’s efficiencies, ηmax, are shown in Table 5. The ηmax values for virtual sorting of medium-diameter single pumice and plastic ranged from 0.74 to 0.97. Because Newton’s efficiency ratio (medium-diameter efficiency/large-diameter efficiency) was less than 1, the sorting efficiency tended to decrease as particles became smaller.
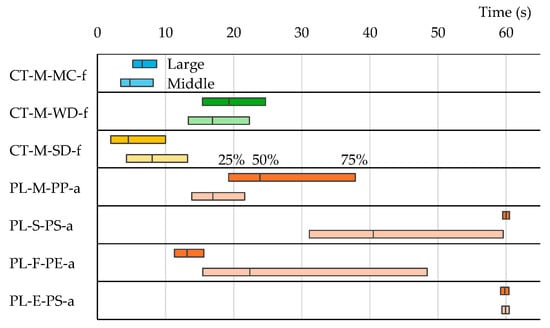
Figure 13.
Quartile ranges of cumulative outflow time probabilities for large- and medium-diameter single particles.
Table 5.
Virtual sorting results for medium-diameter single particles.
3.4. Actual Vibratory Sorting of Large-Diameter Mixed Particles
The sorting efficiencies presented for single particles (Table 4 and Table 5) are virtual and not based on real sorting experiments with mixed samples. Table 3 shows the expected value and the standard deviation of the outflow time probability distribution for actual large-diameter mixed particles. Mixed samples were created by combining pumice, wood, and plastic particles. Owing to the variety of plastic samples, multiple mixed samples were prepared. As a result, Table 3 shows a range of outflow time results for pumice and wood. Figure 14 displays the quartile range of outflow times. To determine any differences in outflow time between single and mixed particles, Figure 14 shows both sets of results simultaneously. The quartile range for pumice varied depending on the type of plastic mixed, showing no clear trend. Similarly, no clear trend was seen in the plastic quartile range between single and mixed particles. Table 6 presents the DAD values for single and mixed particles. Pumice DADs ranged from 0.47 to 0.87, with a mean of 0.61, while plastic DADs fluctuated from 0.59 to 0.83, displaying a mean of 0.74. Table 6 also shows the maximum Newton’s efficiency (ηmax) values. The ηmax values for the actual sorting of large-diameter pumice and plastic mixtures ranged from 0.68 to 1.00. While some samples, such as PL-S-PS-f (0.91), PL-S-PS-a (1.00), and PL-E-PS-a (0.96), showed high ηmax values, PL-M-PE-f, PL-F-PE-a, and PL-E-PS-f had ηmax values around 0.7. Given that Newton’s efficiency ratio (mixed-particle efficiency/single-particle efficiency) was less than 1, the actual sorting efficiency of mixed samples was lower than the virtual sorting efficiency of single particles.
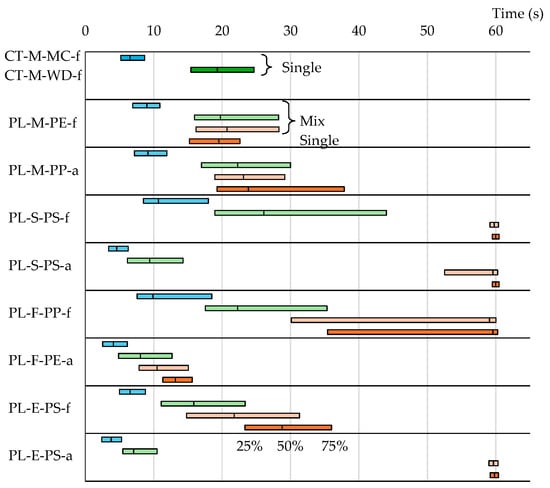
Figure 14.
Quartile ranges of cumulative outflow time probabilities for large-diameter mixed particles.
Table 6.
Actual sorting results for large-diameter mixed particles.
3.5. Evaluation of Pumice Removal Efficiency Using a Vibratory Sorter
For the eight varied mixtures used in the real-world sorting experiment with large-diameter particles, the average Newton’s efficiency for pumice removal using a vibratory sorter was roughly 0.7 after 13 s of sorting. Earlier studies utilizing vibratory sorters reported high Newton’s efficiencies, 0.9 or higher, in metal and plastic sorting [48] and plastic sorting [49], which relied on density differences. In grain sorting [45], which, similar to this study, emphasized sample shape rather than density differences, Newton’s efficiency was 0.7, consistent with the average Newton’s efficiency in this study. Therefore, the vibratory sorting efficiency in this study, which disregards density differences, is consistent with past results.
The best result in visual sorting, in terms of efficiency and time (Table 2), was a Newton’s efficiency value of 1.00 obtained in 61 s. When comparing the results based on Newton’s efficiencies, which indicate sorting precision, vibratory sorting is not a substitute for visual sorting. Nonetheless, vibratory sorting requires only 21% (13/61) of the time needed for visual sorting, so it is useful for shortening analysis time when estimating the approximate quantity of MPs in coastal sediments. Increasing the equipment’s size would further reduce the time required per unit weight of the sample.
Because plants, such as wood and seeds, can be removed by density separation after heat treatment [35], there is no need to use a vibratory sorter. Seeds can be separated from plastic because of their spherical shape, like pumice, and their rapid outflow time. However, wood cannot be separated because its outflow time occasionally aligns with that of plastic (Figure 10 and Table 4). Consequently, vibratory sorting cannot substitute for heat treatment and density separation.
3.6. Significance of This Study
This study focuses on developing a pretreatment technique to eliminate pumice, a contaminant in coastal sediment MP analysis. Consequently, the goal is near-complete pumice removal. However, with a maximum Newton’s efficiency of 0.70 for PL-M-PE-f, for instance, it is inadequate as a pretreatment method. Conversely, the findings are valuable for beach cleanups. After sieving sand, large-particle residues remain. If pumice is to be left as a natural element and other objects incinerated, this research provides a viable approach. As density separation and simple decompression cannot separate pumice and MPs, the results of this study evidencing a potential for pumice sorting are significant.
This study assumes that the floating matter from which sand has been removed by density separation will be fed into a vibratory sorter. If the outflow time of the sand differs from that of other materials, density separation will not be necessary. As a simple preliminary experiment, 30 g of sand (Nagasaki Prefecture, 32.7713’ N, 129.8017’ E) was placed in the vibratory sorter, and the flow weight was measured five times. As a result, the quartile range of the outflow time exceeded 60 s, and only 9% of the sand was flowed out in 30 s. Without applying density separation using a liquid, mixed samples (sand, pumice, wood, seeds, and MPs) collected from a sandy beach can be separated into fraction A (pumice, wood, seeds, and MPs) and fraction B (sand and MPs) by directly using a vibratory sorter (see Figure 10, Figure 13 and Figure 14). Separating all MPs from sand is difficult. However, fraction A is unnecessary for maintaining beach sand, and the direct use of the vibratory sorter offers the advantages of not requiring liquid preparation and not wetting the objects.
3.7. Limitations and Future Research Directions
Given that only a singular, smooth vibrating plate was employed, the influence of plate material on sorting efficiency requires further investigation. The vibration frequency may also affect the sorting efficiency. The applicability of this method to actual field samples with unknown compositions also remains uncertain, necessitating extensive experiments with such samples. In this case, moisture or organic coatings may affect particle behavior.
In the present study, the use of author-prepared samples allowed for clear material identification through visual inspection. The distinct colors and shapes of pumice and plastic facilitated immediate determination. Consequently, mixed-sample sorting could be stopped at the perceived optimal time for separating outflowed and non-outflowed fractions based on visual assessment. However, visually identifying materials in actual field samples with unknown compositions is challenging. To address this, the effectiveness of incorporating colored pumice or highly visible plastic for visual tracking needs to be explored. Furthermore, in order to improve processing speed, it is necessary to enlarge the vibration sorter to a practical size and to enable continuous processing.
4. Conclusions
We evaluated the sorting efficiency of a vibratory sorter for pumice removal from a floating fraction obtained by density separation, contrasting it with the current methods. A vibrating plate was used to analyze the progressive behavior and the virtual sorting efficiency of large- and medium-diameter single particles, along with the actual sorting efficiency of mixed, large particles. The principal findings are as follows:
- (1)
- The maximum Newton’s efficiency ηmax values for the virtual sorting of large-diameter single-pumice and -plastic particles ranged from 0.74 to 1.00.
- (2)
- For the virtual sorting of medium-diameter single-pumice and -plastic particles, ηmax values ranged from 0.74 to 0.97. Sorting efficiency tended to decline with smaller particles.
- (3)
- Actual sorting of large-diameter pumice and plastic mixtures produced ηmax values ranging from 0.68 to 1.00. The actual sorting efficiency of the mixed sample was lower than the virtual sorting efficiency of the single particles.
- (4)
- Based on Newton’s efficiencies, vibratory sorting cannot replace visual sorting. However, the time required for vibratory sorting is 21% of that required for visual sorting, making it advantageous for estimating coastal sediment MP levels. Moreover, the present study contributes to the development of efficient beach cleanup methods.
In conclusion, the possibility of pumice sorting demonstrated in the present study is significant because density sorting and simple decompression processing are unable to separate pumice and microplastics.
Supplementary Materials
The following supporting information can be downloaded at: https://www.mdpi.com/article/10.3390/microplastics4020030/s1, large–single: Outflow time probability distribution for large-diameter single particles, cumulative outflow time probability distribution, quartile ranges of outflow times, Newton’s efficiency vs. time for virtual sorting, and Newton’s efficiency (minimum, average, and maximum) vs. time for virtual sorting of large-diameter single particles; medium–single: quartile ranges of cumulative outflow time probabilities for large- and medium-diameter single particles; large–mixed: quartile ranges of cumulative outflow time probabilities for large-diameter mixed particles.
Author Contributions
Conceptualization, methodology, visualization, supervision, project administration, and funding acquisition, H.A.; investigation and writing—original draft preparation, Y.Y.; writing—review and editing, H.A., K.N., K.-i.S., M.Y. and A.U. All authors have read and agreed to the published version of the manuscript.
Funding
This research was funded by the Japan Society for the Promotion of Science (JSPS), a Grant-in-Aid for Scientific Research C (20K12208). The APC was funded by Nagasaki University.
Institutional Review Board Statement
Not applicable.
Informed Consent Statement
Not applicable.
Data Availability Statement
Data are available in the Supplementary Materials.
Acknowledgments
Special thanks are extended to Kohei Takamura.
Conflicts of Interest
The authors declare no conflicts of interest. The funders had no role in the design of the study; in the collection, analyses, or interpretation of data; in the writing of the manuscript; or in the decision to publish the results.
Appendix A
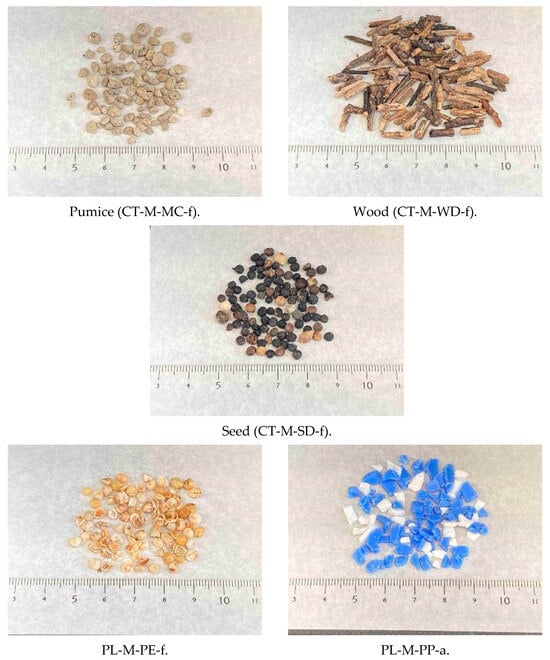
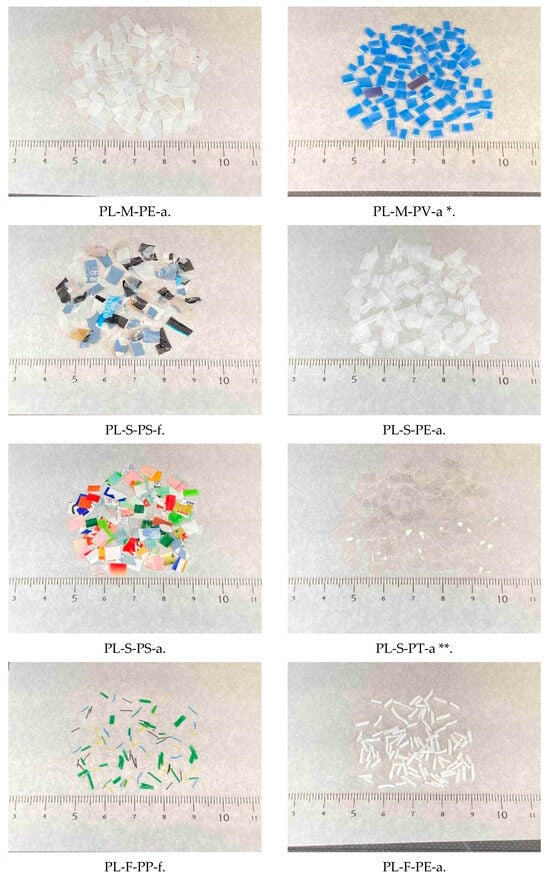
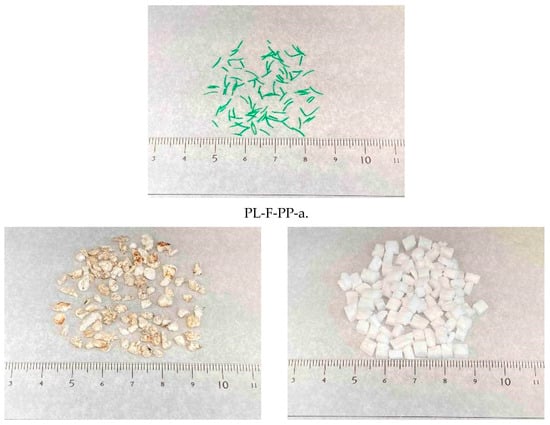
Figure A1.
Contaminant and plastic samples. * PVC; ** PET.
References
- Roland, G.; Jenna, R.J.; Kara, L.L. Production, use, and fate of all plastics ever made. Sci. Adv. 2017, 3, e1700782. [Google Scholar]
- OECD. Global Plastics Outlook: Economic Drivers, Environmental Impacts and Policy Options; OECD Publishing: Paris, France, 2022. [Google Scholar] [CrossRef]
- Andrady, A.L. Microplastics in the marine environment. Mar. Pollut. Bull. 2011, 62, 1596–1605. [Google Scholar] [CrossRef] [PubMed]
- Kuriyama, Y.; Konishi, K.; Kanehiro, H.; Otake, C.; Kaminuma, T.; Mato, Y.; Takada, H.; Kojima, A. Plastic pellets in the marine environment of Tokyo Bay and Sagami Bay. Nippon. Suisan Gakkaishi 2002, 68, 164–171. (In Japanese) [Google Scholar] [CrossRef]
- Isobe, A.; Uchida, K.; Tokai, T.; Iwasaki, S. East Asian seas: A hot spot of pelagic microplastics. Mar. Pollut. Bull. 2015, 101, 618–623. [Google Scholar] [CrossRef]
- Isobe, A. Percentage of microbeads in pelagic microplastics within Japanese coastal waters. Mar. Pollut. Bull. 2016, 110, 432–437. [Google Scholar] [CrossRef]
- OECD. Global Plastics Outlook: Policy Scenarios to 2060; OECD Publishing: Paris, France, 2022. [Google Scholar] [CrossRef]
- Barrows, A.P.W.; Cathey, S.E.; Petersen, C.W. Marine environment microfiber contamination: Global patterns and the diversity of microparticle origins. Environ. Pollut. 2018, 237, 275–284. [Google Scholar] [CrossRef]
- Jamieson, A.J.; Brooks, L.S.R.; Reid, W.D.K.; Piertney, S.B.; Narayanaswamy, B.E.; Linley, T.D. Microplastics and synthetic particles ingested by deep-sea amphipods in six of the deepest marine ecosystems on Earth. R. Soc. Open sci. 2019, 6, 180667. [Google Scholar] [CrossRef]
- Ciucă, A.M.; Manea, M.; Barbeş, L.; Stoica, E. Marine birds’ plastic ingestion: A first study at the Northwestern Black Sea coast. Estuar. Coast. Shelf Sci. 2025, 313, 109032. [Google Scholar] [CrossRef]
- Trani, A.; Mezzapesa, G.; Piscitelli, L.; Mondelli, D.; Nardelli, L.; Belmonte, G.; Toso, A.; Piraino, S.; Panti, C.; Baini, M.; et al. Microplastics in water surface and in the gastrointestinal tract of target marine organisms in Salento coastal seas (Italy, Southern Puglia). Environ. Pollut. 2023, 316, 120702. [Google Scholar] [CrossRef]
- Azad, S.M.O.; Towatana, P.; Pradit, S.; Patricia, B.G.; Hue, H.T.T.; Jualaong, S. First evidence of existence of microplastics in stomach of some commercial fishes in the lower Gulf of Thailand. Appl. Ecol. Environ. Res. 2018, 16, 7345–7360. [Google Scholar] [CrossRef]
- Leslie, H.A.; Van Velzen, M.J.M.; Brandsma, S.H.; Dick Vethaak, A.; Garcia-Vallejo, J.J.; Lamoree, M.H. Discovery and quantification of plastic particle pollution in human blood. Environ. Int. 2022, 163, 107199. [Google Scholar] [CrossRef] [PubMed]
- Nihart, A.J.; Garcia, M.A.; El Hayek, E.; Liu, R.; Olewine, M.; Kingston, J.D.; Castillo, E.F.; Gullapalli, R.R.; Howard, T.; Bleske, B.; et al. Bioaccumulation of microplastics in decedent human brains. Nat. Med. 2025, 31, 1114–1119. [Google Scholar] [CrossRef] [PubMed]
- Qiao, R.; Deng, Y.; Zhang, S.; Wolosker, M.B.; Zhu, Q.; Ren, H.; Zhang, Y. Accumulation of different shapes of microplastics initiates intestinal injury and gut microbiota dysbiosis in the gut of zebrafish. Chemosphere 2019, 236, 124334. [Google Scholar] [CrossRef] [PubMed]
- Jiang, W.; Fang, J.; Du, M.; Gao, Y.; Fang, J.; Jiang, Z. Microplastics influence physiological processes, growth and reproduction in the Manila clam, Ruditapes philippinarum. Environ. Pollut. 2022, 293, 18502. [Google Scholar] [CrossRef]
- Jiménez-Skrzypek, G.; Domínguez-Hernández, C.; González-Sálamo, J.; Hernández-Borges, J. Assessment of multiclass organic pollutants in microplastics from beaches of Tenerife (Canary Islands, Spain). Microchem. J. 2024, 207, 112172. [Google Scholar] [CrossRef]
- Campanale, C.; Dierkes, G.; Massarelli, C.; Bagnuolo, G.; Uricchio, V.F. A Relevant Screening of Organic Contaminants Present on Freshwater and Pre-Production Microplastics. Toxics 2020, 8, 100. [Google Scholar] [CrossRef]
- Wardrop, P.; Shimeta, J.; Nugegoda, D.; Morrison, P.D.; Miranda, A.; Tang, M.; Clarke, B.O. Chemical Pollutants Sorbed to Ingested Microbeads from Personal Care Products Accumulate in Fish. Environ. Sci. Technol. 2016, 50, 4037–4044. [Google Scholar] [CrossRef]
- European Union. Directive—2019/904—EN—SUP Directive—EUR-Lex. 2019. Available online: https://eur-lex.europa.eu/eli/dir/2019/904/oj (accessed on 28 February 2025).
- US Environmental Protection Agency. National Recycling Strategy Part One of a Series on Building a Circular Economy for All. Washington, U.S., 2021. Available online: https://www.epa.gov/system/files/documents/2021-11/final-national-recycling-strategy.pdf (accessed on 28 February 2025).
- Ministry of the Environment Government of Japan. Plastic Resource Recycling Strategy. Tokyo, Japan, 2019. Available online: https://www.env.go.jp/content/900513722.pdf (accessed on 28 February 2025). (In Japanese).
- Simantiris, N.; Vardaki, M.Z. A systematic review and scientometrics analysis on microplastic pollution on coastal beaches around the globe. Cont. Shelf Res. 2025, 286, 105424. [Google Scholar] [CrossRef]
- Luan, J.; Wang, Y. Abundance, morphology, spatial-temporal distribution and sources of microplastics in Shilaoren Beach, Qingdao, China. Reg. Stud. Mar. Sci. 2024, 71, 103422. [Google Scholar] [CrossRef]
- Borah, A.; Hande, O.M.; Jayakumar, S.; Devipriya, S.P. Microplastic pollution in beach sediments in the Dapoli coast, Maharashtra, the western peninsular region of India. Reg. Stud. Mar. Sci. 2024, 77, 103640. [Google Scholar] [CrossRef]
- Sagawa, N.; Kawaai, K.; Hinata, H. Abundance and size of microplastics in a coastal sea: Comparison among bottom sediment, beach sediment, and surface water. Mar. Pollut. Bull. 2018, 133, 532–542. [Google Scholar] [CrossRef] [PubMed]
- Dodson, G.Z.; Shotorban, A.K.; Hatcher, P.G.; Waggoner, D.C.; Ghosal, S.; Noffke, N. Microplastic fragment and fiber contamination of beach sediments from selected sites in Virginia and North Carolina, USA. Mar. Pollut. Bull. 2020, 151, 110869. [Google Scholar] [CrossRef] [PubMed]
- Esiukova, E. Plastic pollution on the Baltic beaches of Kaliningrad region, Russia. Mar. Pollut. Bull. 2017, 114, 1072–1080. [Google Scholar] [CrossRef] [PubMed]
- Expósito, N.; Rovira, J.; Sierra, J.; Folch, J.; Schuhmacher, M. Microplastics levels, size, morphology and composition in marine water, sediments and sand beaches. Case study of Tarragona coast (western Mediterranean). Sci. Total Environ. 2021, 786, 147453. [Google Scholar] [CrossRef]
- Rangel-Buitrago, N.; Arroyo-Olarte, H.; Trilleras, J.; Arana, V.A.; Mantilla-Barbosa, E.; Gracia, C.A.; Mendoza, A.V.; Neal, W.J.; Williams, A.T.; Micallef, A. Microplastics pollution on Colombian Central Caribbean beaches. Mar. Pollut. Bull. 2021, 170, 112685. [Google Scholar] [CrossRef]
- Mayoma, B.S.; Sørensen, C.; Shashoua, Y.; Khan, F.R. Microplastics in beach sediments and cockles (Anadara antiquata) along the Tanzanian coastline. Bull. Environ. Contam. Toxicol. 2020, 105, 513–521. [Google Scholar] [CrossRef]
- Hayes, H.; Kirkbride, K.P.; Leterme, S.C. Variation in polymer types and abundance of microplastics from two rivers and beaches in Adelaide, South Australia. Mar. Pollut. Bull. 2021, 172, 112842. [Google Scholar] [CrossRef]
- Tasnim, J.; Ahmed, M.K.; Hossain, K.B.; Islam, M.S. Spatiotemporal distribution of microplastic debris in the surface beach sediment of the southeastern coast of Bangladesh. Heliyon 2023, 9, e21864. [Google Scholar] [CrossRef]
- Claessens, M.; Van Cauwenberghe, L.; Vandegehuchte, M.B.; Janssen, C.R. New techniques for the detection of microplastics in sediments and field collected organisms. Mar. Pollut. Bull. 2013, 70, 227–233. [Google Scholar] [CrossRef]
- Asakura, H. Accuracy of a Simple Microplastics Investigation Method on Sandy Beaches. Microplastics 2023, 2, 304–321. [Google Scholar] [CrossRef]
- Masura, J.; Baker, J.; Foster, G.; Arthur, C. Laboratory Methods for the Analysis of Microplastics in the Marine Environment: Recommendations for Quantifying the Synthetic Particles in Water and Sediments; NOAA Marine Debris Division: Silver Spring, MA, USA, 2015. [Google Scholar]
- Imhof, H.K.; Schmid, J.; Niessner, R.; Ivleva, N.P.; Laforsch, C. A novel, highly efficient method for the separation and quantification of plastic particles in sediments of aquatic environments. Limnol. Oceanogr. Methods 2012, 10, 524–537. [Google Scholar] [CrossRef]
- Mani, T.; Frehland, S.; Kalberer, A.; Burkhardt-Holm, P. Using castor oil to separate microplastics from four different environmental matrices. Anal. Methods. 2019, 11, 1788–1794. [Google Scholar] [CrossRef]
- Kubo, T. Ocean Dumping of Pumice (Volcanic Products from Fukutoku-Oka-no-Ba or Hunga Tonga-Hunga Ha’apai Volcano). 2021. Available online: https://www.fit.ac.jp/~kubo/research_en.html (accessed on 28 February 2025).
- Felsing, S.; Kochleus, C.; Buchinger, S.; Brennholt, N.; Stock, F.; Reifferscheid, G. A new approach in separating microplastics from environmental samples based on their electrostatic behavior. Environ. Pollut. 2017, 234, 20–28. [Google Scholar] [CrossRef] [PubMed]
- Giani, H.; Borchers, B.; Kaufeld, S.; Feil, A.; Pretz, T. Fine grain separation for the production of biomass fuel from mixed municipal solid waste. Waste Manag. 2016, 47, 174–183. [Google Scholar] [CrossRef]
- Zhou, C.; Pan, Y.; Lu, M.; Yang, C. Liberation characteristics after cryogenic modification and air table separation of discarded printed circuit boards. J. Hazard. Mater. 2016, 311, 203–209. [Google Scholar] [CrossRef]
- Chalavadi, G.; Singh, R.K.; Das, A. Processing of coal fines using air fluidization in an air table. Int. J. Miner. Process. 2016, 149, 9–17. [Google Scholar] [CrossRef]
- Back, S.; Ueda, K.; Sakanakura, H. Determination of metal-abundant high-density particles in municipal solid waste incineration bottom ash by a series of processes: Sieving, magnetic separation, air table sorting, and milling. Waste Manag. 2020, 112, 11–19. [Google Scholar] [CrossRef]
- Komatsuzaki, M.; Endo, O.; Yoshizaki, S.; Osaki, K. Studies on the Relation between Persistence of Volunteer Cereals and Cropping System in Upland (VI) Separating characteristics of rough rice separaters to contaminated barley by mixing of volunteer wheat grain. Jpn. J. Farm Work Res. 1994, 29, 14–20. [Google Scholar] [CrossRef]
- The Society of Powder Technology, Japan. Terminology Dictionary of Powder Technology, 2nd ed.; Nikkan Kogyo Shinbunsha: Tokyo, Japan, 2000. (In Japanese) [Google Scholar]
- Ferdana, A.D.; Petrus, H.T.B.M.; Bendiyasa, I.M.; Prijambada, I.D.; Hamada, F.; Takahi, S. Optimization of gold ore Sumbawa separation using gravity method: Shaking table. AIP Conf. Proc. 2018, 1945, 020070. [Google Scholar] [CrossRef]
- Oi, E.; Arai, S.; Kikuchi, E.; Ito, S. Separation of metallic fragments from shredded electric devices using air table. Shigen Sozai 1997, 113, 577–581. (In Japanese) [Google Scholar] [CrossRef]
- Dodbiba, G.; Sadaki, J.; Okaya, K.; Shibayama, A.; Fujita, T. The use of air tabling and triboelectric separation for separating a mixture of three plastics. Miner. Eng. 2005, 18, 1350–1360. [Google Scholar] [CrossRef]
Disclaimer/Publisher’s Note: The statements, opinions and data contained in all publications are solely those of the individual author(s) and contributor(s) and not of MDPI and/or the editor(s). MDPI and/or the editor(s) disclaim responsibility for any injury to people or property resulting from any ideas, methods, instructions or products referred to in the content. |
© 2025 by the authors. Licensee MDPI, Basel, Switzerland. This article is an open access article distributed under the terms and conditions of the Creative Commons Attribution (CC BY) license (https://creativecommons.org/licenses/by/4.0/).