Article

Seasonal Comparative Monitoring of Plastic and Microplastic Pollution in Lake Garda (Italy) Using Seabin During Summer–Autumn 2024

1
Department of Industrial Engineering and INSTM Research Unit, University of Trento, Via Sommarive, 9, 38123 Trento, Italy
2
Fraglia della Vela Riva, Via G. Maroni 2, 38066 Riva del Garda, Italy
*
Authors to whom correspondence should be addressed.
Microplastics 2025, 4(3), 44; https://doi.org/10.3390/microplastics4030044
Submission received: 21 February 2025 / Revised: 22 May 2025 / Accepted: 18 July 2025 / Published: 28 July 2025
(This article belongs to the Collection Feature Paper in Microplastics)

Abstract

Plastic (P) and microplastic (MP) pollution in marine and freshwater environments is an increasingly urgent issue that needs to be addressed at many levels. The Seabin (an easily operated and cost-effective floating debris collection device) can help clean up buoyant plastic debris in calm waters while monitoring water pollution. A Seabin was used to conduct a comparative analysis of plastic and microplastic concentrations in northern Lake Garda (Italy) during peak and low tourist seasons. The composition of the litter was further investigated using Fourier-Transform Infrared (FTIR) spectroscopy. The analysis showed a decreased mean amount of plastic from summer (32.5 mg/m3) to autumn (17.6 mg/m3), with an average number of collected microplastics per day of 45 ± 15 and 15 ± 3, respectively. Packaging and foam accounted for 92.2% of the recognized plastic waste products. The material composition of the plastic mass (442 pieces, 103.0 g) was mainly identified as polypropylene (PP, 47.1%) and polyethylene (PE, 21.8%). Moreover, 313 microplastics (approximately 2.0 g) were counted with average weight in the range of 1–16 mg. A case study of selected plastic debris was also conducted. Spectroscopic, microscopic, and thermal analysis of specimens provided insights into how aging affects plastics in this specific environment. The purpose of this study was to establish a baseline for further research on the topic, to provide guidelines for similar analyses from a multidisciplinary perspective, to monitor plastic pollution in Lake Garda, and to inform policy makers, scientists, and the public.

1. Introduction

Plastic (P) and microplastic (MP) pollution in the environment is rapidly becoming an alarming ecological issue that is very well known and debated, both in the scientific community and in civil society. It is therefore of paramount importance to evaluate their diffusion and impact and to properly inform the public and the legislators. It was estimated [1] that in 2021, the total amount of plastics produced in the world was 390.7 million tons. The main applications for plastics are packaging (44%) and building and construction (18%). Even though the increasing rates of recycling of plastic products are encouraging [1], it was estimated that approximately 30% of plastic packaging waste is likely to leak into the environment [2]. According to a 2017 study by Geyer et al. [3], most of the plastic waste is constituted by polyethylene (PE, 32%), polypropylene (PP, 18%), polystyrene (PS, 6%), polyethylene terephthalate (PET, 11%), polyvinyl chloride (PVC, 5%), polyurethane (PU, 5%), and a group consisting of polyesters, polyamides, and acrylic fibers (PP&A, 14%).
Microplastics were first mentioned by Thompson et al. in 2004 [4]. Since then, many efforts have been made to reach a consensus, at least on the definitions. MPs are defined in ISO/TR 21960:2020 [5] as “any water-insoluble solid plastic particle with one of the dimensions between 1 μm and 1000 μm”. The standard also defines the same type of particles to be “large MPs” when their dimension is between 1 mm and 5 mm and “nanoplastics” when their dimension is lower than 1 μm. Plastic waste larger than 5 mm is defined by the standard as “macroplastics” (P). A further classification of mesoplastics is sometimes proposed for litter in the dimensional range of 5–25 mm [6,7]. Microplastics can be divided into primary and secondary MPs. Primary MPs are constituted by polymeric elements that are produced in small dimensions (<5 mm), such as pellets, fibers, and cosmetic constituents. Secondary MPs, on the other hand, are formed by the effects of the environment on plastic waste dispersed in seas, in rivers, in lakes, in the soil, or in other natural environments.
All the plastic waste leaking into the environment is being scrutinized by the scientific community because of the correlated risks, notably to marine fauna [8], human health [9], and ultimately to biological diversity [10]. Microplastic research has been focused mainly on the marine environment because of the prevalence of the issue in this context. Nonetheless, a growing urgency is rising for the study of P and MP pollution in other environments, such as in freshwater [11,12,13,14,15,16,17]. It is argued [11] that lakes and rivers could be the main source of land-based plastic pollution to the oceans but also a possible sink of MPs.
Plastic litter in water accumulates in different environments according to material specific gravity (SG, i.e., the ratio between material density and water density). Low-density plastics such as PE (SG = 0.91–0.95), PP (SG = 0.90–0.92), and expanded PS (EPS, SG = 0.02–0.64) [7] float on water and therefore affect mostly the water surface (i.e., pelagic zone) and the beaches. Higher density plastics that do not float sink to the bottom (i.e., the benthic zone). Some examples of this latter category are PS (SG = 1.04–1.09), polyamides (PAs, SG = 1.13–1.15), PET (SG = 1.34–1.39), and PVC (SG = 1.16–1.30) [7]. For this reason, the technique used for P and MP retrieval affects the type of plastic collected. Some examples of methods for sampling the water surface are discussed in detail by the Joint Group of Experts on the Scientific Aspects of Marine Environmental Protection (GESAMP) in [7]: some examples are different types of nets (such as manta trawls or mega nets), bulk water sampling, visual observations from ships, and photographic observations from airplanes.
A relatively uncommon technique for buoyant plastic retrieval in water is the Seabin [18]. The Seabin is a floating device consisting essentially of a basket with a 2 mm mesh net that is connected to a pump. Material is pumped from the water surface into the basket to trap debris larger than 2 mm. The nominal flow rate, as declared by the producer, is approximately 25,000 L of water per hour and the estimated electrical power consumption is approximately 500 W [19]. The producer also claims that the basket can contain up to 20 kg of debris and that it can remove up to 1.5 tons of litter per year. Seabins were used in some studies on plastic litter in marine environments [20,21,22] because of their cost effectiveness [23] and their suitability in calm water conditions. An example is presented in [20], where the authors studied P and MP pollution in Laucala Bay in the Fiji Islands. They observed 0.091 g of plastic per m3 of water filtered, corresponding to 0.07 P and MP items per m3. Seabins were also used in lakes [24,25]; however, data on usage of this type of device in freshwater is still scarce, and the scientific literature seems mainly focused on the Great Lakes of North America.
Italian subalpine lakes are particularly interesting sites to conduct studies on microplastics. They are located in highly populated areas that are also popular touristic attractions. This characteristic could be useful to understand the effect of tourism on P and MP pollution. In 2013, Imhof et al. [26] studied the plastic litter in sediment samples from two beaches of Lake Garda using a random grid sample technique. They considered a beach in the north of the lake and a beach in the south. The northern shore was found to be much more polluted (483 ± 236 macroplastic particles/m2, 1108 ± 983 microplastic particles/m2) than the southern shore (8.3 macroplastic particles/m2, 108 ± 55 microplastic particles/m2). In 2018, Sighicelli et al. used a manta trawl to monitor the incidence of MP in three Italian lakes, including Lake Garda. They computed approximately 0.0550 ± 0.0290 particles/m2 in the northernmost part of the lake, a much larger amount with respect to the other two sampling locations they selected (i.e., 0.0040 ± 0.0027 and 0.0160 ± 0.0130 particles/m2). The mean density of MP particles found in Lake Garda (0.025 particles/m2) was lower than those of Lake Iseo and Lake Maggiore (0.040 and 0.039 particles/m2, respectively). These data were collected during the summer of 2016.
Fambri et al. [27] performed a study on the collection of plastic waste in the shores of Lake Garda after a severe storm occurred in the region in Autumn 2018 (Vaia). The storm caused the accumulation of large amounts of plastic debris in the lake, which acted as a waste sink from rivers and from surrounding areas. They manually collected P and MPs from selected locations on the northern shores of the lake and counted them. During the first collection performed a few days after the storm, they observed a mean of 15.9 ± 8.6 plastic pieces per m2, corresponding to approximately 7.4 ± 9.9 g/m2. During a subsequent survey performed in March 2019, they found 25.3 ± 23.9 pieces per m2, corresponding to 6.2 ± 5.4 g/m2. They argued that the increased amount of litter found after four months could be related to the cumulative settling of plastic during the winter season. Finally, in July 2019, they retrieved a decreased amount of plastic, i.e., 5.1 ± 2.5 items/m2, corresponding to 0.7 ± 0.6 g/m2 (data adapted from the original). They also characterized some selected plastic samples collected during the retrieval campaign to assess their aging and weathering degree. It was shown that microplastic pollution can contribute to the loss of biodiversity also in lakes such as Lake Garda, entering the food chain by ingestion, as shown by Battistin et al. for Cryptorchestia garbinii in Lake Garda [28], but also in general as vectors for pathogens [29] and toxic chemicals [30].
The aim of this study is to retrieve P and MP litter by means of a Seabin positioned in the northern part of Lake Garda and to characterize the plastic material in terms of quantity, dimension, chemical composition, and typology of product. A Seabin was installed in this location in 2021 by Coop Italia and LifeGate PlasticLess project [31] with the aim of reducing plastic pollution in the lake; it was also used to monitor plastic and MP pollution in the present work. The waste collection campaigns were performed during tourist peak season and off season. This is the first published study of plastic and microplastic pollution in Lake Garda performed with a Seabin. A case study on the aging effect on some selected plastic waste particles is also described. This study provides a baseline for future similar analyses and serves as a study on the feasibility of plastic and microplastic monitoring via Seabin in Lake Garda.

2. Materials and Methods
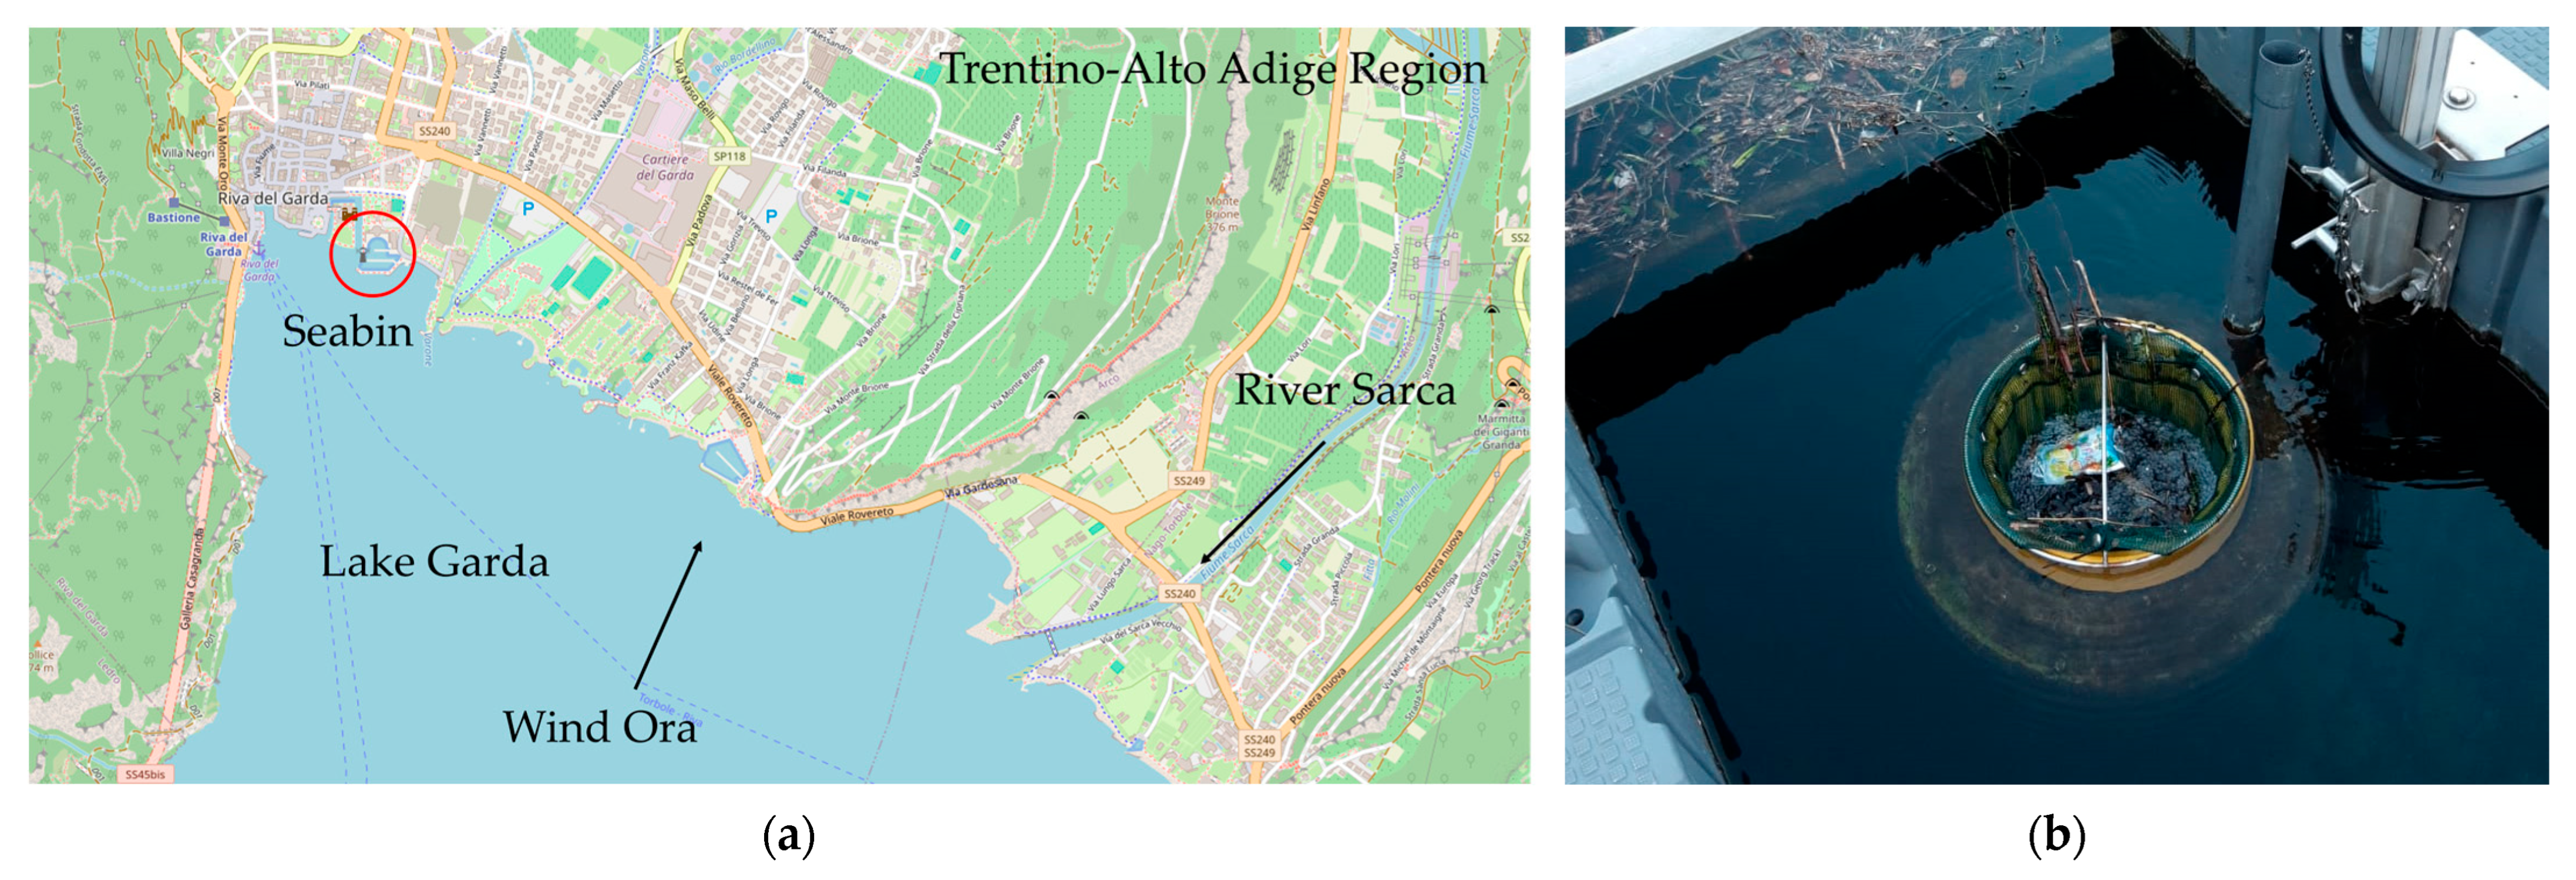
2.1. Study Area

The study area that was selected for the collection is in the northernmost part of Lake Garda, in Fraglia della Vela Riva in Riva del Garda (Trento, Italy) (GPS data: 45.883455, 10.843897). This place was selected because the river Sarca flows into the lake close to this area from the north, while a very regular wind (Ora del Garda) flows from the south [32]. This area is therefore ideal to capture floating lake debris, as also reported by Imhof et al. [26]. The area is densely populated (approximately 425 per km2 as of 2024 [33] for the municipality of Riva del Garda) and it is very intensely visited by tourists. More than 1 million visitors were estimated for 2024, with almost 4 million overnight stays [34], for the whole area of the Lake Garda in the region of Trentino-Alto Adige. The peak season for tourism in this area is from June to September [34].

2.2. Seabin

A Seabin V5 [18] was used to monitor plastic and MP pollution in the present work. A map of the area with the approximate position of the Seabin is displayed in Figure 1a. The Seabin was anchored to a floating platform attached to the wharf so to be easily accessible for material retrieval. Its exact position was selected because the lake currents naturally tend to collect floating material there. A picture of the Seabin during waste collection is presented in Figure 1b. A detailed analysis of the Seabin is reported in Appendix A.
The Seabin was emptied three times after filtering for 24–72 h in two separate seasons (late summer and late autumn) for a total of six batches. The summer survey was carried out between 28 August and 5 September 2024, while the autumn campaign was performed between 29 November and 17 December 2024. The collected material was then weighed after drying in environmental conditions. Dried material was then spread on a surface (approximately 300 g on a square meter) and manually separated with the aid of laboratory tweezers. Two types of tweezers with the following dimensions were employed: (i) plastic tweezers with tips 1.35 mm thick and 2.60 mm wide; (ii) metal tweezers with tips 0.73 mm thick and 0.90 mm wide. The first separation into (i) vegetal/animal residues; (ii) macroplastics (P); and (iii) microplastics (MP) was followed by weighing of the three constituents. Macroplastic and vegetation/animal residue were weighed with a KB 3600–2 N scale by Kern & Sohn GmbH (Balingen, Germany) (0.01 g sensitivity). Microplastics were weighed with an ABS 80–4 electronic balance from the same producer (0.1 mg sensitivity). Microplastics were separated from plants and meso- and macroplastics by visual inspection. The total volume of water filtered during each sampling was calculated with Equation (1). A further manual sorting was then performed, and recognizable macroplastics were separated and weighed according to their category (i.e., bottles, packaging, wires/ropes…). An analysis of the size distribution of the MP particles was also performed. Photographs of the microplastic samples were analyzed via the software ImageJ® (version 1.54d) with the “analyze particles” function. The measured area was approximated to that of a circle and the particle diameter was then calculated.
V o l u m e   o f   w a t e r   f i l t e r e d   ( L ) = t i m e   ( h ) × 25,000   ( L h ) .
Contamination of samples during plastic counting and weighing was prevented by keeping them indoors. However, a small amount of airborne contaminants and insects may have reached the samples, especially during drying and transportation. Contamination and dispersion of meso- and macroplastics can be considered negligible.

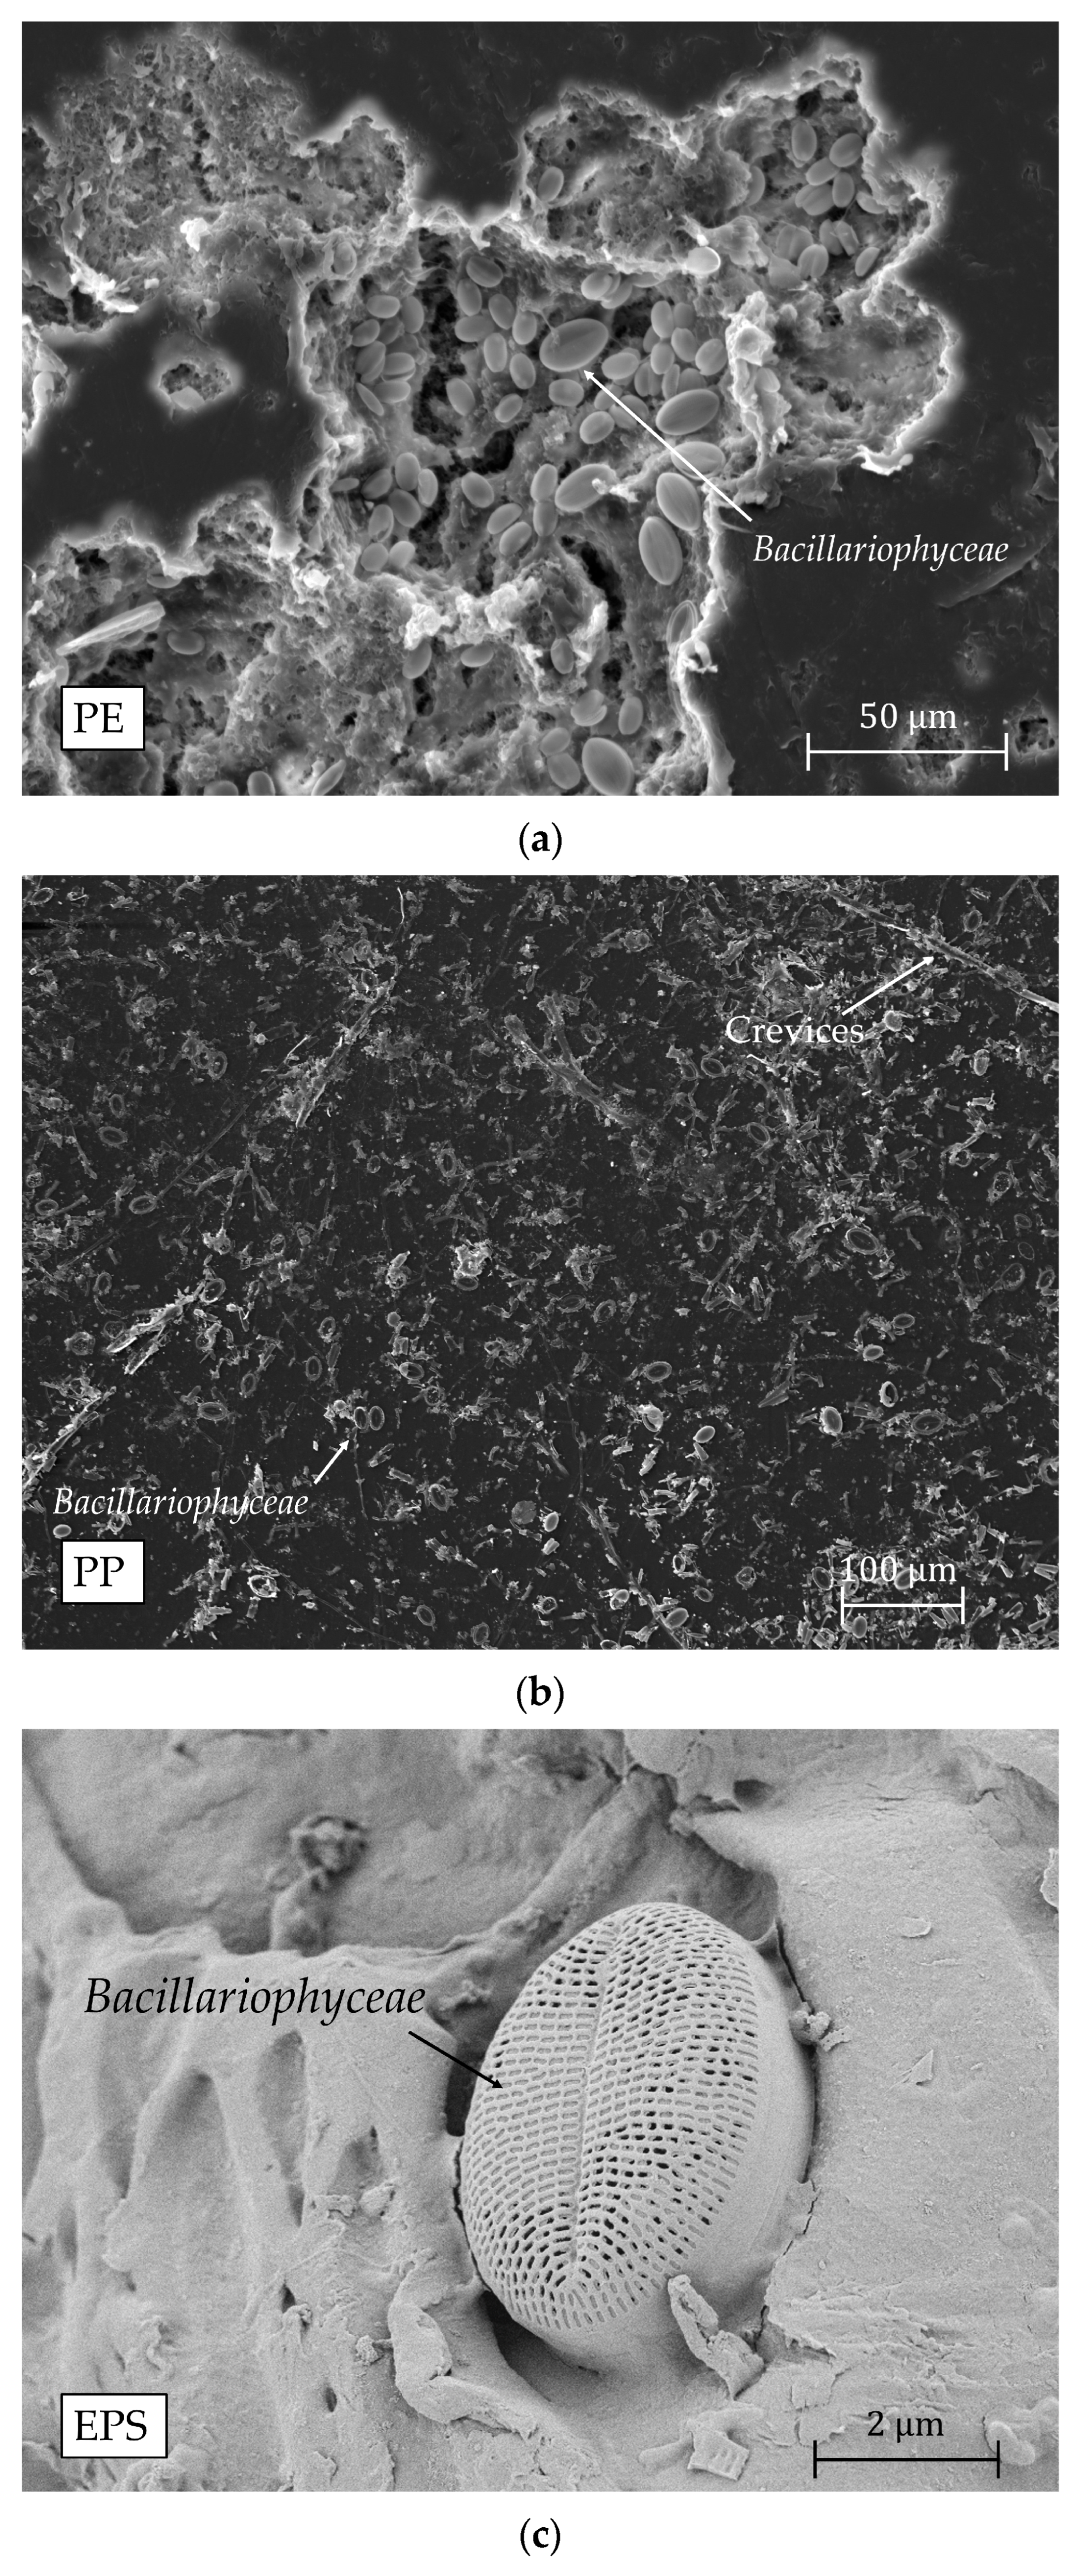
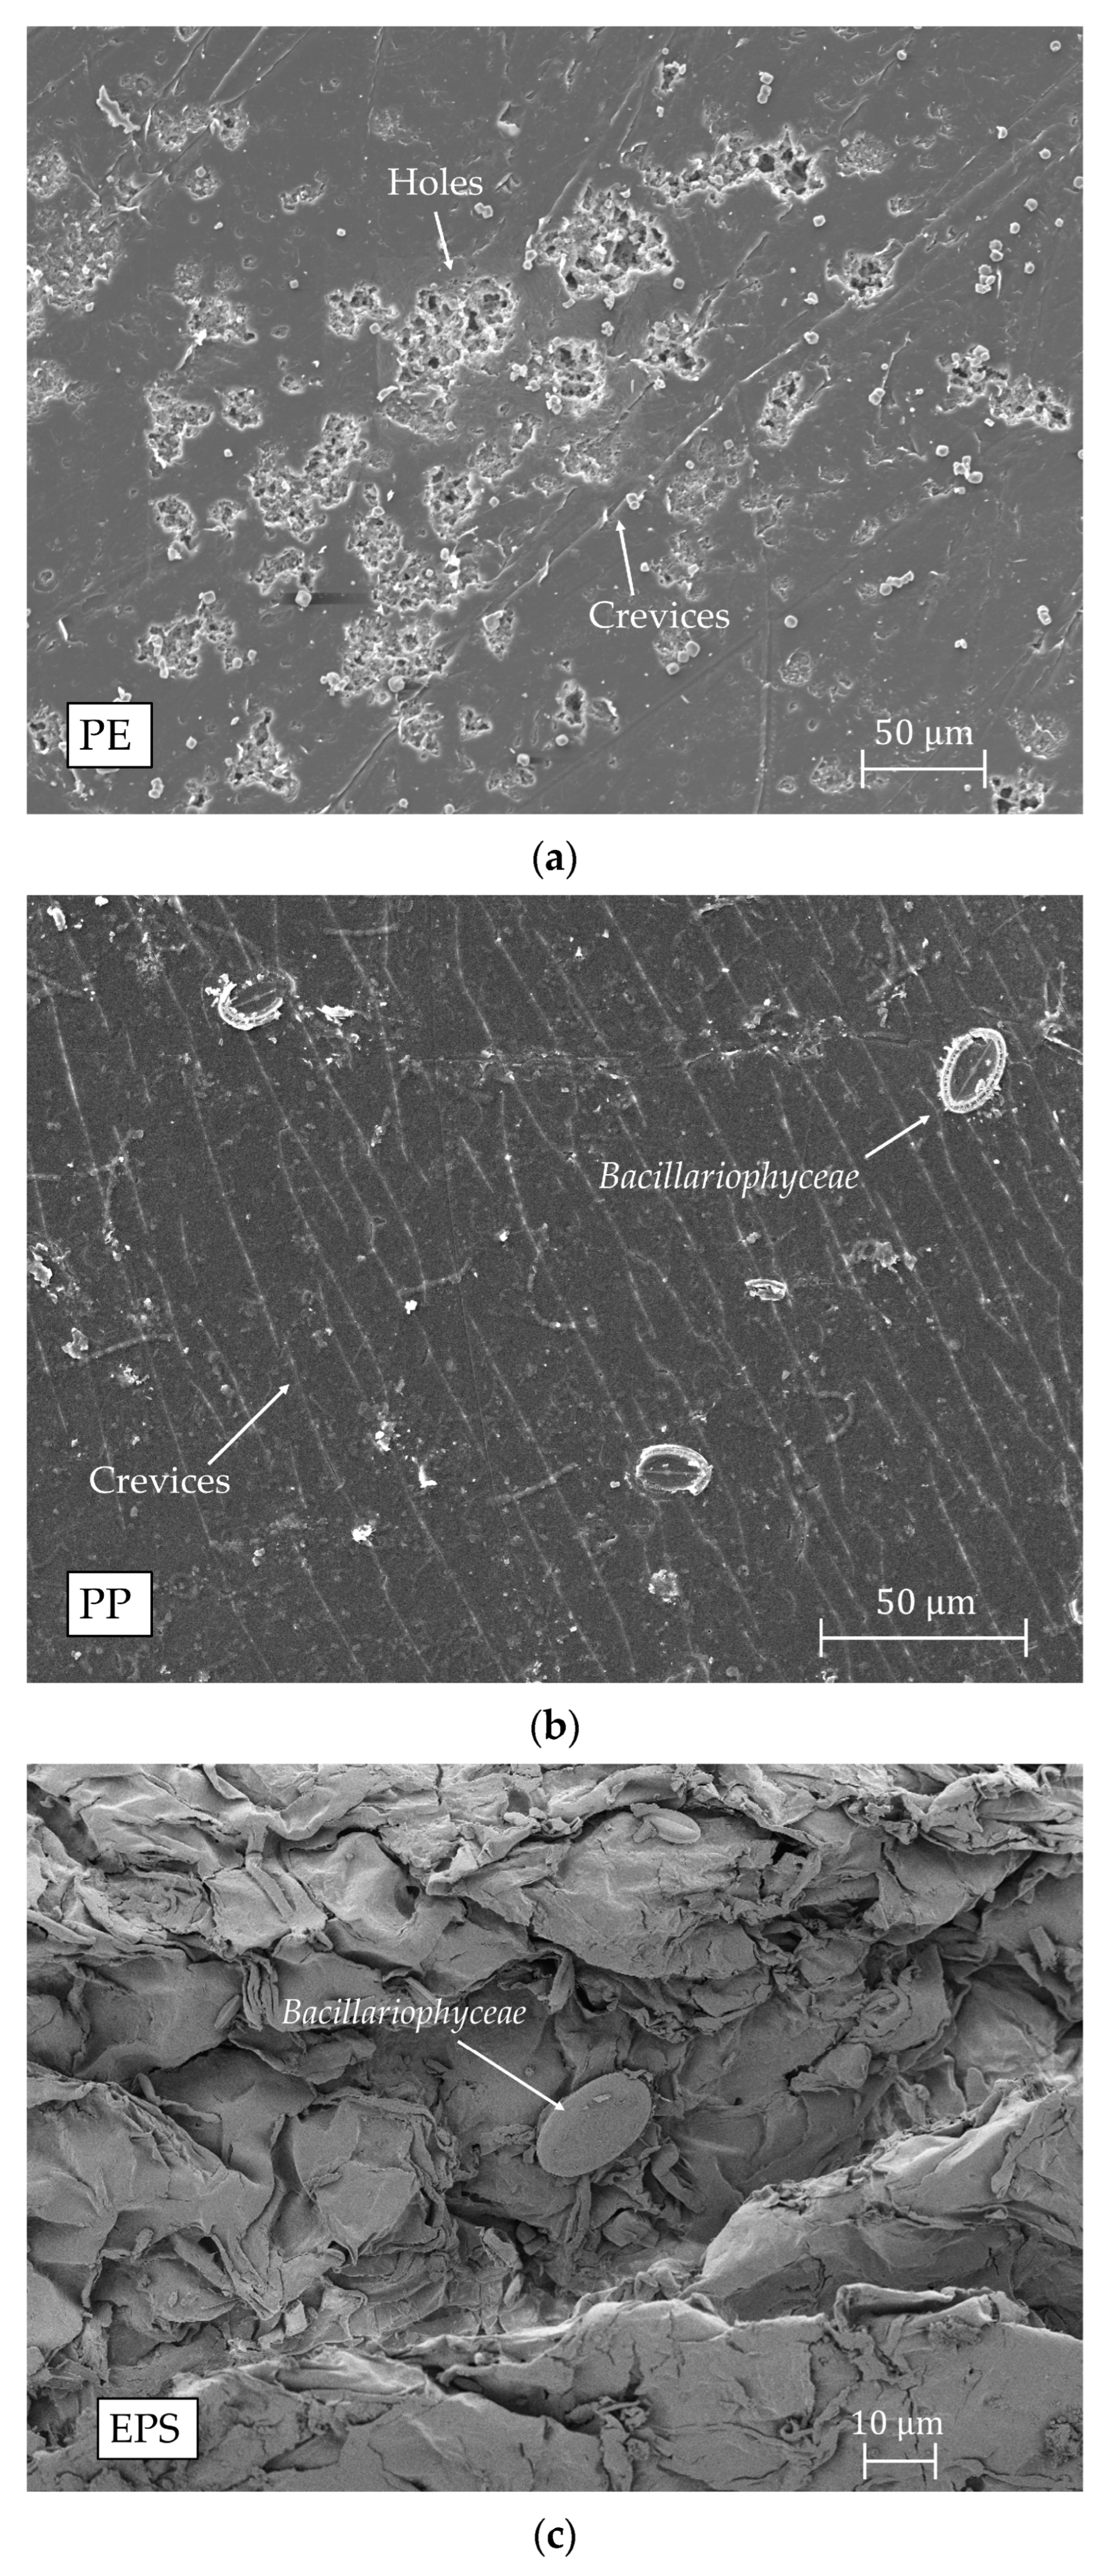
2.3. Scanning Electron Microscopy (SEM)

Micrographs of the surface of some selected specimens were obtained with a Scanning Electron Microscope (SEM). The surface was coated with platinum–palladium via sputtering with a Q150T ES coater by Quorum Technologies Plc (Laughton, UK). The SEM images of PE and PP specimens were taken with a JSM-IT300LV SEM by JEOL Ltd. (Tokyo, Japan). SEM micrographs of EPS specimens were taken with a Zeiss SUPRA 40 FE-SEM by Carl Zeiss SMT GmbH (Oberkochen, Germany). Micrograph magnifications ranged from 150× to 10,000×. Several replicates of micrograph were acquired for each sample for a total of 102; the most representative ones were selected.

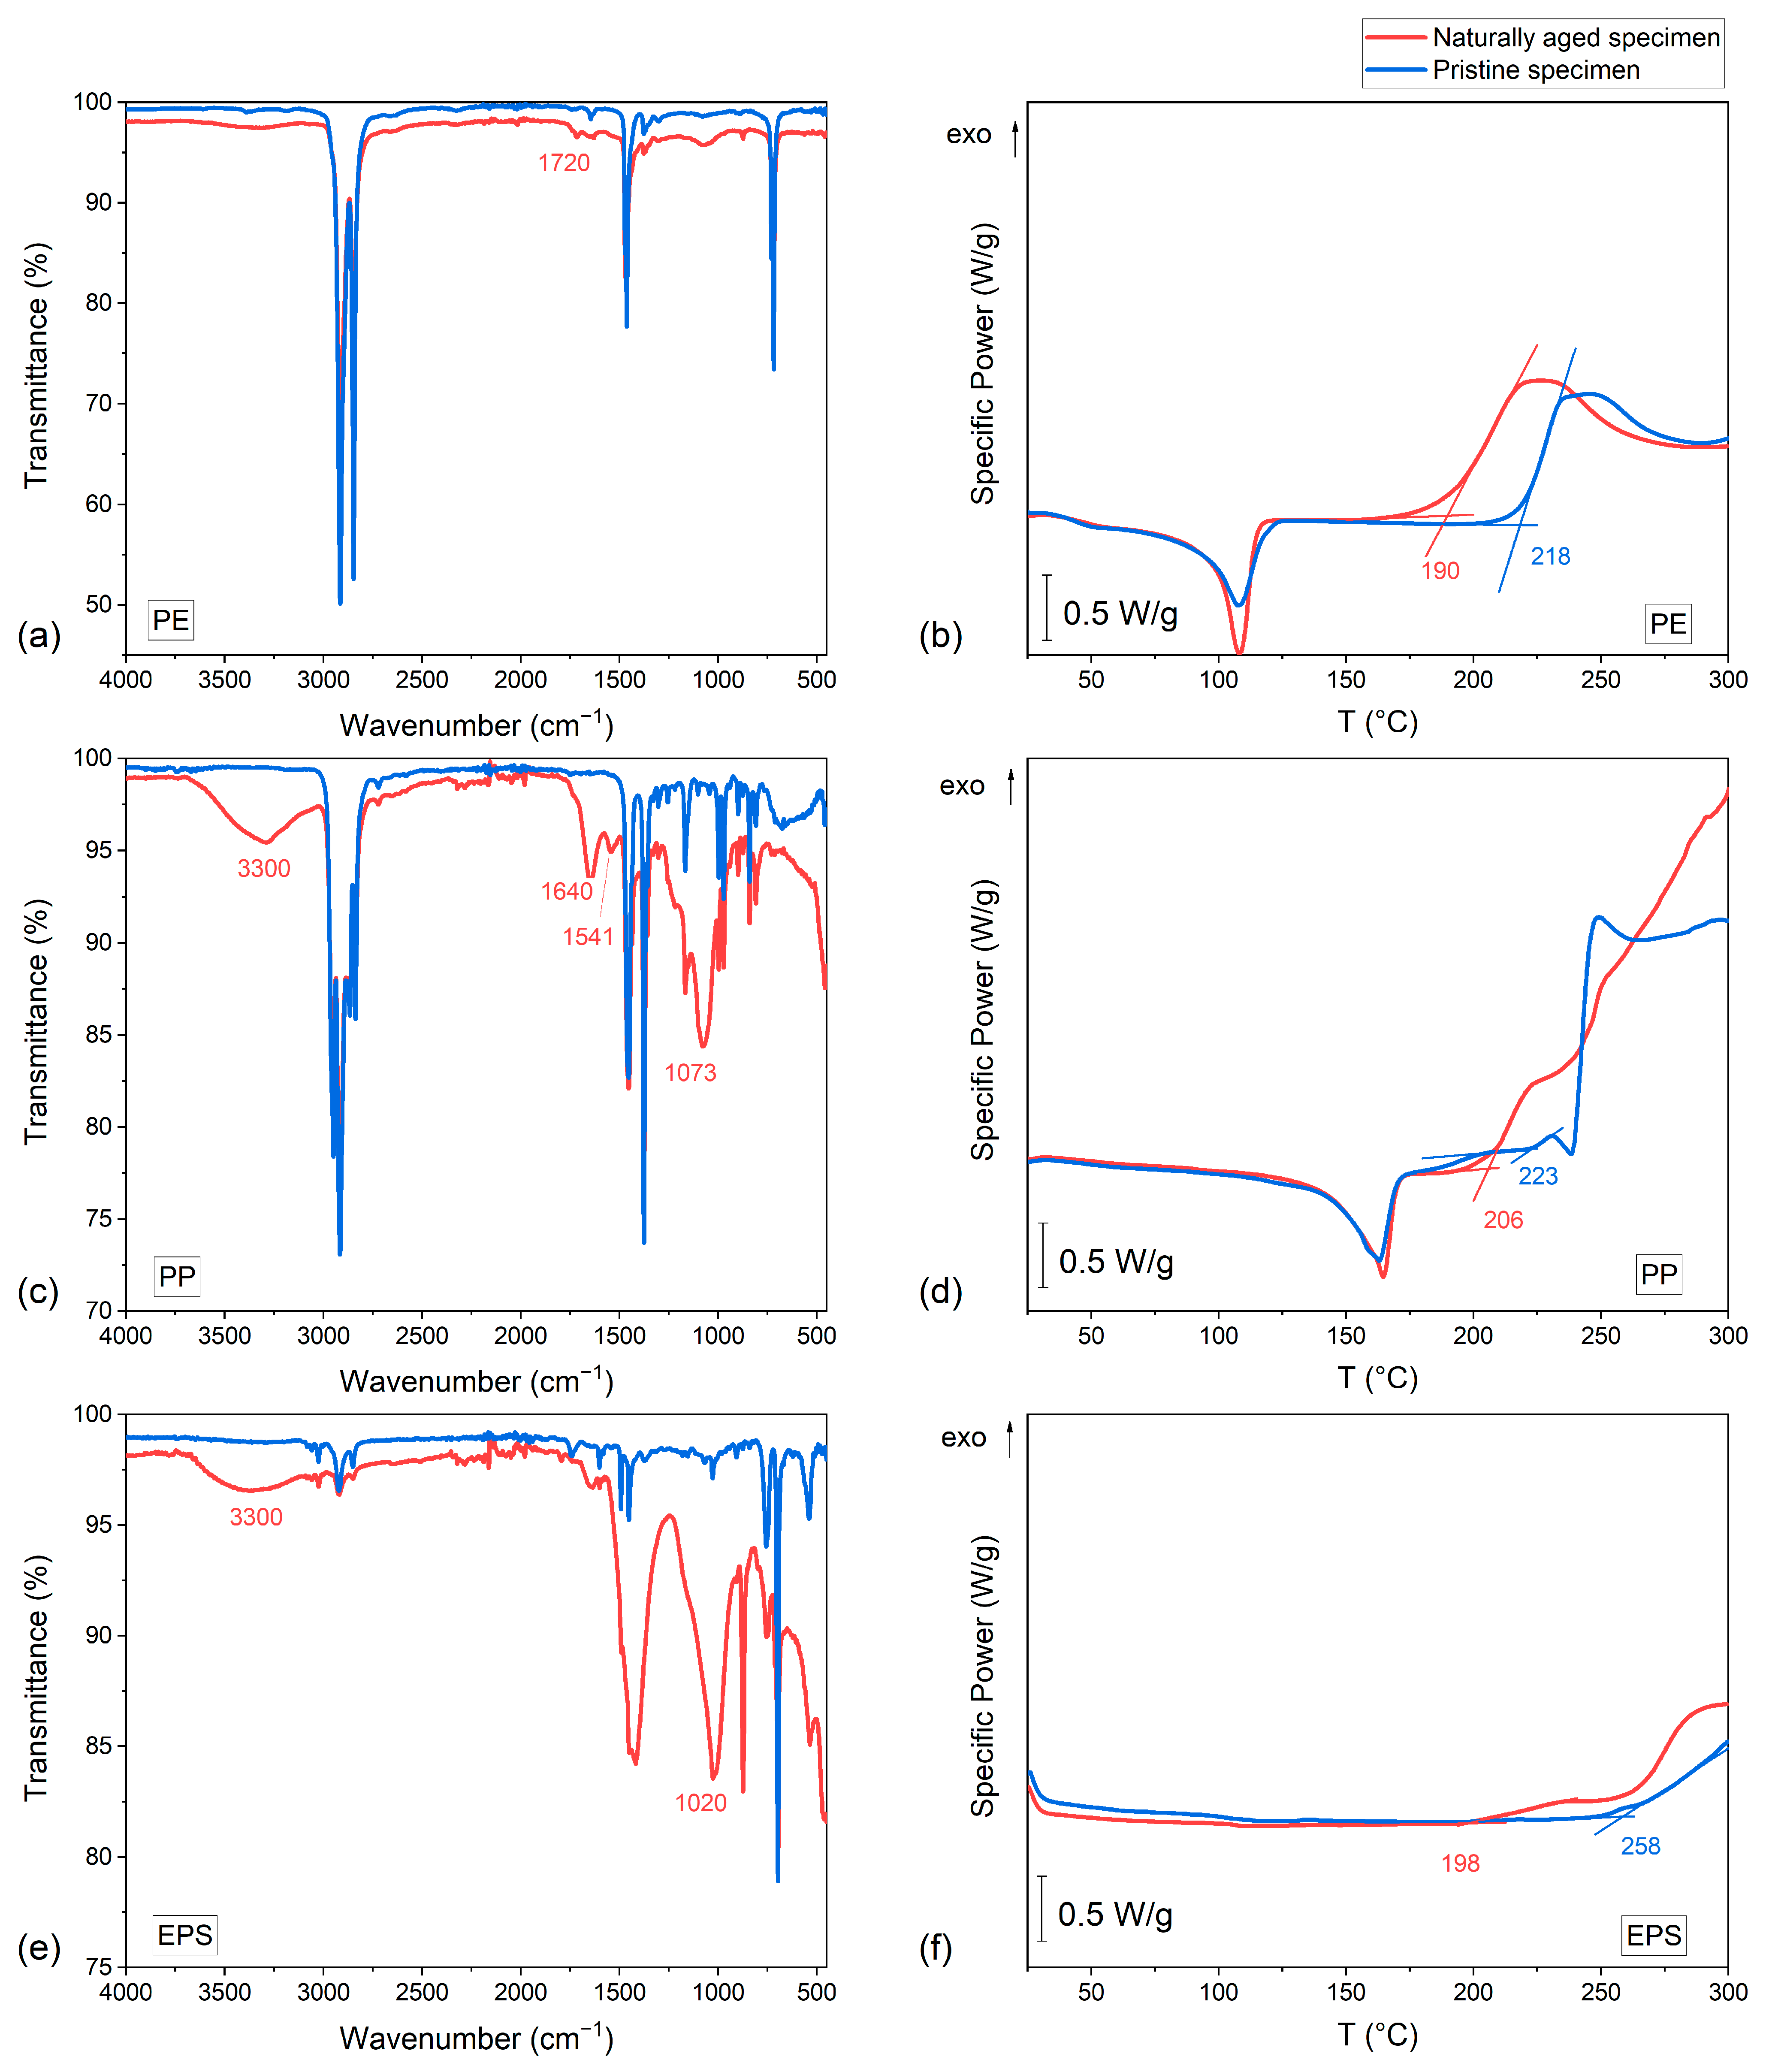
2.4. Fourier-Transform Infrared Spectroscopy (FTIR)

Fourier-Transform Infrared Spectroscopy (FTIR) measurements were carried out on selected unidentified plastic litter samples with a Spectrum Two portable FTIR spectrometer by PerkinElmer Inc. (Waltham, MA, USA) in Attenuated Total Reflectance (ATR) configuration. The spectrometer was equipped with a synthetic diamond crystal, and spectra were obtained from 4000 to 450 cm−1. Four spectra acquisitions were performed for each FTIR analysis. FTIR was used to identify the chemical nature of all the waste analyzed. Spectra of single items were compared to typical FTIR spectra of the most common polymers used for single-use plastic products, reported in Figure 2, in order to identify the chemical nature of the item and assign it to one category among PE, PP, PS, and other. Different material categories were then separated, counted, and weighed. FTIR measurements were also used in a case study in Section 3.2 to compare pristine polymeric materials and specimens collected to assess the effect of aging. Peaks of polymers were assigned according to the literature, as summarized in Table 1.

2.5. Differential Scanning Calorimetry (DSC)

Differential Scanning Calorimetry (DSC) measurements were carried out on selected plastic and microplastic residue samples with a Mettler DSC 30 by Mettler Toledo Inc. (Columbus, OH, USA). Measurements were recorded under air (100 mL/min) with a single heating scan from 25 °C to 300 °C at constant heating rate of 10 °C/min. This was used to measure the Oxidation Onset Temperature (OOT), i.e., the temperature at which the extended baseline of the DSC curve intersects the slope of the oxidation exotherm from the inflection point under the described conditions [40]. One measurement was performed for each sample.

2.6. Statistical Analysis of Data

Data were presented as arithmetic mean ± standard deviation. Statistical analyses were carried out with the Mann–Whitney U test, performed with the software OriginPro 2018. The significance level was selected as 0.05.

3. Results and Discussion

3.1. Seabin

During the survey, a total of 442 pieces of plastic were retrieved, 309 in late summer and 133 in late autumn. These corresponded to a total mass of 103.0 g, 69.0% of which was collected during the summer campaign (71.1 g). Most of the MP was of a secondary nature. 1459.0 g of vegetation and animal residues were also retrieved, 1153.4 g in summer and 305.6 g in autumn. The total amount of animal residues was negligible with respect to the vegetation. Table 2 reports the arithmetic mean values and standard deviations of P and MP mass and numerical count per cubic meter of water filtered during sampling. A comparison between the summer and the autumn campaigns is reported. The mass of the vegetation retrieved per m3 of water filtered and the ratio between the mass of the MPs collected and the total wet mass (i.e., wet vegetation and plastic debris, prior to sorting) are also reported. More data are reported in Appendix B. A picture of some microplastics from Sample 6 is reported in Figure 3a.
The great majority of the collected material is constituted by vegetation. Approximately 6.6% of the total mass is plastic. Only 1.9% of the plastic mass is constituted by MPs (2.0 g). However, microplastics account for more than 70% of the items collected (313 pieces). A difference in plastic pollution between the two seasons can be observed, all the mean values for plastic collection during summer are higher. The average number of collected microplastic per day are 44.8 ± 14.9 and 14.8 ± 2.8 for summer and autumn, respectively. Also the rate of collection of vegetation is higher in summer. There is, however, no statistically relevant difference between summer and autumn in any of the distributions (according to the Mann–Whitney U test). The only parameter that increases during autumn is the ratio between the mass of MPs and the total mass of the wet material collected. Additionally, the microplastic mass remains approximately 1–2% of the total plastic mass throughout the two seasons.
The image analysis on microplastics via ImageJ® shows a mean particle dimension of 5.08 ± 2.93 mm. Approximately 9% of the particles are smaller than 2 mm. This indicates that a non-negligible fraction of particles collected is actually smaller than the nominal mesh size of the Seabin. Boxplots depicting the distributions of MP dimensions are presented in Figure 3b. It should also be noted that part of the particles here considered to be MPs are actually mesoplastics (>5 mm).
Figure 4a represents the relative amount of each type of material collected. A detail of the composition of the plastic fraction is also presented in Figure 4b–e. The number of items collected, divided by the typology of the product (Figure 4d,e), shows a predominance of packaging and foamed products when considering the numerical count. The relative amount of products by mass is more evenly distributed. The mass of recognized products is constituted (see also Table A5) by the following:
  • Cups 15.0%;
  • Bottles 41.1%;
  • Ropes/wires/threads 18.3%;
  • Packaging 24.4%;
  • Cigarette filters 0.6%;
  • Foams 0.3%.
It should be noted, however, that the total mass of recognized plastic products is a fraction of the total plastic mass (66.3%).
The relative amount of the most common polymeric materials collected is reported in terms of mass and number of items in Figure 4b,c, respectively. A majority of PP in the total mass is observed (47.1%). PE represents the most items collected (38.0%), while it is the second most abundant recognized material in terms of mass (21.8%). The number of items retrieved is more evenly distributed than the mass. Approximately 20.1% of items collected are (mostly expanded) PS fragments. Their cumulative mass is, however, very limited. The category “other” only accounts for 30.5% of the mass, which is not negligible. It should be noted, however, that 28.24 g out of 31.42 g (89.9%) of that mass is constituted by a single large macroplastic, recognized as a PET bottle. Other types of plastics are retrieved as well; some examples are PET, polyamides, and PLA. However, their relative amount is neglected for simplicity in this work.
The observations that the ratio between MP and wet material increases in autumn and that MP mass remains constant with respect to the total plastic mass could be related to the physical attachment of MPs to the wet vegetation, as routinely observed in the collected samples. It is argued that plants could act as an additional “filter” that helps with the collection of MPs, even smaller than the nominal mesh size of the Seabin. The improper dimensional assignment described in Figure 3b is related to the sorting technique employed.
Data from Table 2 can be compared to those reported by Paris et al. [20]. They collected P and MP via a Seabin in Laucala Bay in the Fiji Islands for a period of 26 days in October 2020. They found 0.091 g/m3 of plastic litter, corresponding to 0.07 pieces of plastic per cubic meter. The mass values are comparable to those reported in the present work for the summer season (0.033 g/m3). Also, the number of particles retrieved is comparable to that obtained in the present work (0.110 particles/m3 in summer and 0.049 particles/m3 in autumn). Maes et al. [41] report 0.14 MP particles/m3 collected via manta trawl in seawater around the United Kingdom. This value is comparable to the ones presented in the present work for the summer campaign (0.078 particles/m3). This suggests that data obtained with this method are reliable and reproducible both in seawater and freshwater. However, care should be taken in these comparisons, especially when different techniques or different environments are taken into consideration. For example, the manta trawl that is often used for floating microplastic collection has usually a mesh size of approximately 330 μm [7,41], which is significantly smaller than the one used in the present work. This could lead to (i) an increased amount of microplastics collected with a manta trawl and (ii) an underrepresentation of small microplastics with the Seabin and so a different size distribution of the samples. This difference in the size distribution could also have an impact on the type of plastics retrieved. On the other hand, it is worth noting that the typical volume of water filtered with the manta trawl seems to be in the range of 3–300 m3, with some outliers [42,43], which is relatively smaller than that of the Seabin (approximately 600–1800 m3 in the present study). Hence, the latter could be more representative in counting larger-size microplastics.
The difference between the concentration of EPS in terms of the mass and number of items is related to the fact that most retrieved EPS is constituted by very small particles (often single beads) and to the very low apparent density of such expanded products. This also explains the great difference between Figure 4d and Figure 4e. On the other hand, the very limited amount of non-expanded PS retrieved could be explained by the density of PS, which is usually slightly higher than that of water and therefore tends to sink. The chemical composition of the waste collected is likely related to the technique used, which is most effective for the retrieval of buoyant plastic such as PE, PP, and PS. A complementary analysis of the benthic zone via different collecting techniques could provide data on the presence of such high-density plastic material in the lake.
The 41.2% of plastic packaging retrieved (Figure 4e) is in accordance with the global data of 44% reported in [1]. The majority of the plastic litter collected has probably a land-based origin. Packaging, beverage containers, and foamed products can come from any land source, while ropes and wires could be either coming from sailing activities or from textiles (also possibly land based). A possible origin of the large number of foamed items that were collected (more than 50%) could be construction sites. Single-use plastics account for 81.4% of the plastic waste mass that was recognized (i.e., packaging, cigarette filters, bottles, and cups), approximately 45% in terms of the number of items. However, also, the foamed particles could come from single-use plastic products, so the real figure could be even higher. Approximately 69.5% of the total weight is constituted by commodity polymers (PE, PP, and PS). Single-use plastic and these low-cost materials are by far the most abundant pollutants collected. Data reported in Figure 4d,e are not immediately comparable to data reported in [3]; however, it can be taken as a baseline for future analysis on Lake Garda or for other studies on freshwater.
The methodology shows its strengths in the ease of operation, in the simple acquisition of data on the pollution of calm waters, and in the cost-effectiveness of the instrumentation. The dual purpose of the Seabin, as both a litter removal tool and as an analysis tool, also shows potential in applications like the one presented in this work. The simplicity of the instrument makes it shine as a tool for scientific communication: it can be operated by the general public in the context of educational demonstrations and, overall, in divulgation. Another important benefit is that it can be used for long-term evaluations and cleaning.
The method has also some weaknesses; the manual sorting and the variable time for collection and drying that originates from the irregular captured volume could be linked to poor reproducibility of the experiment. This, however, does not seem to be the case since the data (material per cubic meter of filtered water) are comparable to those reported in the literature, as previously stated. The dependency of the results on the operator is also a possible critical issue. The real plastic content could be underestimated due to the limited precision of the manual sorting. This could also be related to the improper dimensional assignment described in Figure 3b. The FTIR identification and separation of the plastic litter is very effective and accurate, but its precision can decrease in large measurements because of the repetitiveness of the procedure.
Bergmann et al. [44] also argue that the Seabin captures a possibly too large amount of seaweed with respect to plastic and that its maintenance costs can be important. Being more rarely used, Seabins could also raise concerns for the difficult comparisons with data from more common collection techniques, such as the manta trawl. One last obvious drawback of the Seabin is that it only gives information on floating plastic. A complementary analysis of the lakebed could provide definitive statistics on plastic pollution in the lake.

3.2. Case Study

A case study of selected macroplastics retrieved from the lake during the survey is presented. SEM micrographs of the surface of the specimens are displayed in Figure 5. FTIR and OOT (via DSC) measurements on waste plastics are compared to those obtained on a similar item in pristine (as-purchased) conditions. They are presented in Figure 6. Three specimens are considered, a PE film, a PP film, and an EPS fragment, all in severely aged conditions. It is important to characterize naturally aged plastics retrieved in the environment because they appear to have different properties than artificially aged samples. These changes are detectable by FTIR [35], but information can be gathered also from other techniques, here presented. This case study can be used as a reference for future analysis on weathered plastic collected from both freshwater and seawater.
SEM micrographs of the three specimens show a noticeable surface degradation under the form of crevices and holes. The presence of crevices is observed in the PE and PP specimens. Holes are visible in the PE specimen. The presence of microalgae, likely identified as diatoms (Bacillariophyceae), can be observed on the surfaces of the PP and EPS specimens. Such algae are observed in all specimens and seem to accumulate inside holes that form on the surface of these weathered plastics (see Figure A4). Other unidentified residues are visible on the surface, particularly in Figure 5a. More SEM micrographs are displayed in Appendix B.
FTIR measurements on PE do not show remarkable differences; however, one weak peak is present in the aged specimen and not in the pristine one. This peak, at 1720 cm−1, is likely associated with carbonyl C=O stretching [35]. Both pristine and aged PE are identified as low-density polyethylene (LDPE) because of the presence of a peak at 1377 cm−1 [45,46]. Aged PP, conversely, shows very distinctive IR peaks with respect to pristine reference. The broad band around 3300 cm−1 is likely associated with O–H stretching, while the band with two main peaks around 1640 and 1541 is probably linked to C=O or C=C stretching. The broad band with its main peak around 1073 cm−1 is probably related to C–O stretching [35]. Aged EPS spectra show a strong peak centered around 1020, likely attributed to C–O stretching; the broad band centered around 3300 is again likely associated with O–H stretching [35].
Oxidation onset temperature (OOT) measurements indicate the temperature at which a hydrocarbon starts to oxidize. It is a relative measure of the stability of a polymer (in this case) to oxidation and, indirectly, of its aging. A lower onset temperature indicates that the plastic is in a more degraded state. From Figure 6b,d,f, it is possible to notice that all retrieved plastics have lower OOT with respect to the pristine ones. Measured OOT values are as follows:
  • 190 °C for aged PE;
  • 218 °C for pristine PE;
  • 206 °C for aged PP;
  • 223 °C for pristine PP;
  • 198 °C for aged EPS;
  • 258 °C for pristine EPS.
The differences in the IR spectra clearly show the effect of weathering on the specimens collected during the survey. The prolonged residence in the environment caused oxidation in all specimens and, possibly, water absorption. OOT measurements indicate that the weathering decreased the oxidative stability of all three plastic materials (PE, PP, and EPS). The OOT experimental results of PE are in agreement with [27], where the following OOT decreases from pristine to aged samples are reported: (i) PE pluriball (from 215 °C to 198 °C), (ii) PE sack bag (from 221 °C to 179 °C), and (iii) high-density polyethylene (HDPE) pallet-box (from 260 °C to 217 °C).
It is therefore possible to use these measurements to study the aging of plastic waste. It should be noted that OOT measurements can be used to assess only the relative aging of plastic waste, while FTIR could be used to quantitatively estimate the degree of aging, as reported by Campanale et al. [35]. Raman spectroscopy could be a further possible approach for MP aging evaluation [47]. An in-depth and cross-disciplinary study on the diatoms observed by microscopy could help in dating the microplastics [48]. The combination of these techniques is proposed as a possible approach to obtain a mapping of the plastic and microplastic litter in both space and time in aquatic environments. Information in Section 2.4 can be used for future reference for polymer identification in this context.
In conclusion, this study should be considered as a reference for future analysis of Lake Garda, and in general freshwater. It can be used to continue the survey of Lake Garda, but it can be used as a blueprint for other research as well. Possible future developments could broaden the study to the rest of the year to confirm the trends here indicated or to give new insights. In addition, a survey with more frequent litter collection could provide interesting information on plastic pollution in the lake in a very detailed way. The establishment of a more rigid methodology, especially for plastic separation and collection and drying times, could improve reproducibility. An automated technique for the separation of plastic from vegetation and among the different polymeric materials could prove useful for long-term research on this topic.

4. Conclusions

The results of a plastic and microplastic survey and collection in Lake Garda (Italy) were presented in this study. A Seabin (floating waste collection device) was used as a retrieval method. A comparative analysis of touristic peak and off-peak seasons showed a difference in terms of plastic pollution, with an increase of approximately 123% of total plastic collected in summer. It should be noted, however, that statistical analysis showed no statistically relevant difference between the distributions of data in the two seasons. A total mass of plastic per cubic meter of filtered water of 32.5 mg/m3, corresponding to 0.110 items/m3 on average in summer (with a total of 309 pieces collected in 5 days) and 17.6 mg/m3 and 0.049 items/m3 in autumn (with a total of 133 pieces collected in 6 days) were observed, and most of the microplastic was of a secondary nature. A sorting of plastic litter revealed that 41.2% of the recognized items (by numerical count) were packaging, and 51.0% were foam. The relative mass of recognized products was more evenly distributed, with a majority (41.4%) of PET bottles. A fine FTIR identification of all collected material showed that 47.1% of the total mass of plastic waste was constituted by PP and 21.8% by PE. PS (mainly expanded) accounted for 0.6% in terms of mass but 20.1% in terms of the number of particles because of its low density. Statistical analysis showed no statistically relevant differences in the quantity of collected plastic debris between the two seasons. Consequently, human activity in its entirety has probably more statistical influence than a single activity, such as tourism. The seasonal increase in the mean values of plastic collected, however, should be still taken into consideration. Weather could also have an impact on plastic collection rates.
The benefits of the use of the Seabin were shown. This device, although relatively rarely used in the scientific literature, produced encouraging results. Its multi-purpose nature of plastic waste removal, in pollution monitoring, and as a divulgation tool were described. Energy efficiency and ease of use make this device very promising for global action against plastic pollution in freshwater and seawater. Trapped vegetation was shown to help with the retrieval of relatively small microplastic particles. A case study on selected plastic residues and an analysis of their aging was described as a proof of concept. It can be used for future reference and guideline for similar analyses for a deeper understanding of plastic and microplastic pollution. A detailed methodology, especially in terms of FTIR identification of both pristine and aged plastics, was presented for this purpose.
Overall, this study provides a baseline for future assessment of plastic and microplastic pollution in Lake Garda as well as in other freshwater environments. As such, it should be considered as a first step towards a more comprehensive study, which should be conducted with a multidisciplinary approach. At the same time, this first publication is an attempt to inform policy makers, the scientific community, and the general public on this crucial issue. The presented results further confirm the well-known problem of single-use plastic and plastic packaging being a widespread water pollutant, which is suspected to have a great impact on aquatic life around the world. Coordinated action is necessary when tackling the problem of plastic pollution. Cleanup projects, such as the one reported here, can have a positive impact, but the results could be limited if they are not associated with adequate regulatory measures by the policy makers. Nevertheless, dissemination, especially among the younger generations, is of paramount importance when facing these issues. The presented ongoing work is coupled with extensive divulgation activity [49] to spread scientifically accurate information and, in cooperation with local organizations and institutions, to promote positive behaviors in the population, such as to avoid deliberate release of plastic litter in the environment and to reduce the use of plastics. This type of activity is an opportunity for both increasing awareness in the community and for pollution monitoring.

Author Contributions

Conceptualization, L.F., M.P.; methodology, L.F., P.M.; validation, L.F.; formal analysis, M.P.; investigation, C.G., L.F., M.P.; resources, L.F., P.M.; data curation, M.P., L.F., C.G.; writing—original draft preparation, M.P.; writing—review and editing, L.F., M.P.; visualization, M.P.; supervision, L.F., P.M.; project administration, L.F.; funding acquisition, L.F. All authors have read and agreed to the published version of the manuscript.

Funding

This study was partially founded by the European Union under NextGenerationEU. PRIN 2022: PLASTACTS-Assessment of nano/microplastics impacts, Missione 4 Componente 2 - Prot. n. 202293AX2L, CUP E53D23008370006.

Institutional Review Board Statement

Not applicable.

Informed Consent Statement

Not applicable.

Data Availability Statement

The original contributions presented in this study are included in the article. Further inquiries can be directed to the corresponding authors.

Acknowledgments

The authors acknowledge Coop Italia and the LifeGate PlasticLess project for the positioning of a Seabin in the Fraglia della Vela Riva del Garda (Italy) with opening date 17 June 2021. Riva del Garda Fierecongressi and ITAS Mutua are warmly acknowledged for providing the Perkin Elmer Spectrum Two™ spectrometer. The authors acknowledge Jeevan Kishore Reddy Pidapa for his technical support in plastics and microplastic separation and evaluation.

Conflicts of Interest

The authors declare no conflicts of interest.

Abbreviations

The following abbreviations are used in this manuscript:
ATRAttenuated Total Reflectance
DSCDifferential Scanning Calorimeter
EPSExpanded Polystyrene
FTIRFourier-Transform InfraRed
HDPEHigh-density polyethylene
LDPELow-density polyethylene
MPMicroplastic
OOTOxidation Onset Temperature
PAPolyamide
PEPolyethylene
PETPolyethylene Terephthalate
PLAPolylactic Acid
PPPolypropylene
PP&APolyesters, polyamides, and acrylic fibers
PSPolystyrene
PVCPolyvinyl Chloride
PUPolyurethane
PMacroplastic
SEMScanning electron microscope

Appendix A

Seabin Geometrical Aspects

A geometrical representation of the Seabin and a picture of the net are presented in Figure A1.
Figure A1. (a) An approximation of the geometry of the Seabin used to calculate the total volume. (b) A picture of the mesh size of the Seabin net.
Microplastics 04 00044 g0a1
The geometrical approximation presented in Figure A1a can be used to evaluate the total volume of the Seabin with Equation (A1),
V = 1 3 π h D 2 4 + D d 4 + d 2 4 + π d 2 4 H ,
where V is the total volume of the Seabin, D is the higher diameter of the truncated cone (36 cm), d is the lower diameter of the truncated cone (28 cm), h is the height of the truncated cone (5 cm), and H is the height of the cylinder (40 cm). The total volume V is approximately 28.66 L. This is compatible with the claim of the producer that the Seabin can contain up to 20 kg of waste material.
Considering a measured average cycle time of 3.5 s, the volume of theoretical water filtered per hour if the Seabin fills completely at each cycle can be calculated with Equation (A2).
V o l u m e   o f   t h e o r e t i c a l   w a t e r   f i l t e r e d   p e r   h o u r   L h = V o l u m e   o f   b a s k e t   L C y c l e   t i m e   h 29,500   L h .
This evaluation seems less conservative than the evaluation of the total volume of water filtered per hour provided by the producer (25,000 L/h), which was used in the present work. A “safety factor” of 29,500/25,000 = 1.18 seems a reasonable assumption for the purpose of the present evaluation. This might consider that the Seabin only partially fills at each cycle.
The area of the single mesh of the net of the Seabin can be approximated to that of a rectangle with height of 1.66 ± 0.44 mm and base of 2.14 ± 0.26 mm. These values were measured via image analysis with the software ImageJ® (version 1.54d). The approximate nominal mesh size of 2 mm seems confirmed by the observation. The net is made of HDPE (assessed via FTIR). Its filament is approximately 0.16–0.17 mm thick. A picture of the Seabin position is displayed in Figure A2.
Figure A2. A picture of the Seabin position.
Microplastics 04 00044 g0a2

Appendix B

Raw Data

In Table A1 and Table A2, the collected raw data of the mass and numerical count of items retrieved are reported for each sample. The working time of the Seabin for each batch is reported along with the date; it is used for the normalization of the results in Chapter 3. The mean mass of the microplastics (in mg) and the ratio between the mass of MPs and that of the total wet mass collected are also indicated. Table A3 and Table A4 report the raw data regarding material identification via FTIR divided by number of items and total mass of the microplastics of the most common plastic materials (Table A3 refers to the total number of P and MP, while Table A4 refers to MP only). Table A5 and Table A6 report the number and mass of items recognized for each selected product category, respectively. These data are relative to both microplastics and macroplastics. In Figure A3, the relative number of microplastic particles identified via FTIR are reported for each sample. The total number of MPs collected and the Seabin working time are also reported for each chart. The dimension (i.e., the radius) of the chart is proportional to the total number of items retrieved in that sample. Figure A4 shows more SEM micrographs from the specimens of the case study (Section 3.2). It is possible to notice that all the specimens show the presence of diatoms (Bacillariophyceae) on the surface. A higher magnification micrograph of a diatom is displayed in Figure A4c.
Table A1. Raw data on the macroplastics of the summer and autumn survey. The number designation of the sample, starting date of the Seabin, working time, total wet mass after retrieval (i.e., collective mass of wet vegetation and plastic prior to sorting), numerical count of macroplastic (P) items, and total mass of P are reported.
SampleDate (Start)Seabin Working Time (h)Total Wet Mass (g)P Item Count (n)P Mass (g)
128/08/244833853719.45
201/09/242424553045.32
303/09/24482865184.71
Mean summer 2902 ± 46628.3 ± 9.623 ± 21
429/11/24244403931.27
530/11/244827500
614/12/247235050.25
Mean autumn 355 ± 8314.7 ± 21.211 ± 18
Table A2. Raw data on thee microplastics of the summer and autumn survey. The numerical count of microplastic (MP) items, total mass of MP, mean mass of a single MP collected in that batch, and ratio between the mass of MPs and that of the total wet mass are reported.
SampleDate (Start)Seabin Working Time (h)MP Item Count (n)MP Mass (g)Mean MP Mass (mg)Ratio MP/
Total Wet Mass (ppm)
128/08/24481110.72336.5213.7
201/09/2424560.591210.6240.8
303/09/2448570.32145.6112.2
Mean summer 74.7 ± 31.50.55 ± 0.207.6 ± 2.6188.9 ± 67.8
429/11/2424200.267213.4607.3
530/11/2448250.01650.760.0
614/12/2472440.04110.9117.4
Mean autumn 29.7 ± 12.70.11 ± 0.145.0 ± 7.3261.6 ± 300.8
Table A3. Total number of collected plastic and microplastics (442) and their mass (g) after FTIR identification.
SampleSeabin Working Time (h)PE (n)PE (g)PP (n)PP (g)EPS and PS * (n)EPS
and PS * (g)
Other (n)Other (g)Total (n)
1488211.6262386.5270220.123961.8928148
224302.83942813.903570.02582129.148886
348182.5894451.912350.228870.300375
424285.29572426.009940.206530.025659
5480000250.01650025
672100.073320.1532260.0155110.049749
Total 16822.424013748.5059890.6174831.4172442
* Some pieces of PS (Samples 3 and 4) retrieved were not expanded, so they were counted in this table but not in Table A4 and Table A5. One piece of foam retrieved was macroscopic in size (Sample 1), so it was counted in this table but not in Table A4.
Table A4. The details of the number of collected microplastics (313) and their mass (mg) after FTIR recognition. The mean microplastic mass is reported for different materials.
SampleSeabin Working Time (h)PE (n)PE (mg)PP (n)PP (mg)EPS (n)EPS (mg)Other (n)Other (mg)Total (n)
14869609.52069.92140.013.9111
22420240.51131.6725.818293.356
3481570.036248.011.651.857
42413215.7124.231.7325.620
54800002516.50025
672914.610.62615.5810.444
Total 1261150.369374.383101.135334.2313
Mean MP mass (mg) 8.7 ± 5.9 7.6 ± 9.5 1.5 ± 1.2 6.1 ± 6.5
Table A5. Number of collected macroplastics and microplastics (165) after separation.
SampleSeabin Working Time (h)Cups
(PP)
Bottles
(PET)
Ropes/
Wires/
Threads
(mainly PE)
Packaging
(mainly PE)
Cigarette Filters
(Cellulose Acetate)
Foam
(EPS)
1481-115-22 *
2241111537
348--520-1
424---16-3
548-----25
672---2-26
Total 21768384
* One piece of foam retrieved was macroscopic in size so it was counted in this table but not in Table A4.
Table A6. Mass of collected macroplastics and microplastics after product typology recognition and separation.
SampleSeabin Working Time (h)Cups (g)
(PP)
Bottles (g)
(PET)
Ropes/
Wires/
Threads (g)
(Mainly PE)
Packaging (g)
(Mainly PE)
Cigarette Filters (g)
(Cellulose Acetate)
Foams (g)
(EPS)
1482.56-7.394.35-0.12
2247.6928.242.935.990.440.03
348--2.171.79-0.00
424---4.37-0.00
548-----0.02
672---0.16-0.02
Total 10.2528.2412.4916.660.440.19
Figure A3. Pie charts representing the relative number of microplastic particles recognized via FTIR divided among the different samples: (ac) summer campaign; (df) autumn campaign. The total number of MP items for each sample is reported, and the dimension of the pie chart schematically represents it (i.e., larger pies represent a higher number of recognized items). The working time of the Seabin is also reported for each sample.
Microplastics 04 00044 g0a3
Figure A4. SEM micrographs of specimens from the case study (Section 3.2). (a) PE, 500x magnification; (b) PP, 150× magnification; (c) EPS, 10,000× magnification.
Microplastics 04 00044 g0a4

References

  1. Plastics Europe. Plastics—The Facts. 2022. Available online: https://plasticseurope.org/knowledge-hub/plastics-the-facts-2022/ (accessed on 16 December 2024).
  2. Ellen MacArthur Foundation. The New Plastics Economy: Rethinking the Future of Plastics & Catalysing Action. ellenmacarthurfoundation.org. Available online: https://ellenmacarthurfoundation.org/the-new-plastics-economy-catalysing-action (accessed on 23 September 2023).
  3. Geyer, R.; Jambeck, J.R.; Law, K.L. Production, use, and fate of all plastics ever made. Sci. Adv. 2017, 3, e1700782. [Google Scholar] [CrossRef] [PubMed]
  4. Thompson, R.; Olsen, Y.; Mitchell, R.; Davis, A.; Rowland, S.; John, A.; McGonigle, D.F.; Russell, A. Lost at Sea: Where Is All the Plastic? Science 2004, 304, 838. [Google Scholar] [CrossRef] [PubMed]
  5. ISO/TR 21960:2020; Plastics—Environmental Aspects—State of Knowledge and Methodologies. International Organization for Standardization (ISO): Geneva, Switzerland, 2020.
  6. Joint Research Centre: Institute for Environment Sustainability. Guidance on Monitoring of Marine Litter in European Seas; Publications Office of the European Union: Luxembourg, 2013. [Google Scholar]
  7. GESAMP. Guidelines for the Monitoring and Assessment of Plastic Litter and Microplastics in the Ocean; Kershaw, P.J., Turra, A., Galgani, F., Eds.; GESAMP Reports and Studies, No. 99; GESAMP Joint Group of Experts on the Scientific Aspects of Marine Environmental Protection: London, UK, 2019; 130p. [Google Scholar]
  8. Wright, S.L.; Thompson, R.C.; Galloway, T.S. The physical impacts of microplastics on marine organisms: A review. Environ. Pollut. 2013, 178, 483–492. [Google Scholar] [CrossRef] [PubMed]
  9. Prata, J.C.; da Costa, J.P.; Lopes, I.; Duarte, A.C.; Rocha-Santos, T. Environmental exposure to microplastics: An overview on possible human health effects. Sci. Total Environ. 2020, 702, 134455. [Google Scholar] [CrossRef]
  10. Sutherland, W.J.; Clout, M.; Côté, I.M.; Daszak, P.; Depledge, M.H.; Fellman, L.; Fleishman, E.; Garthwaite, R.; Gibbons, D.W.; De Lurio, J.; et al. A horizon scan of global conservation issues for 2010. Trends. Ecol. Evol. 2010, 25, 1–7. [Google Scholar] [CrossRef]
  11. Eerkes-Medrano, D.; Thompson, R.C.; Aldridge, D.C. Microplastics in freshwater systems: A review of the emerging threats, identification of knowledge gaps and prioritisation of research needs. Water Res. 2015, 75, 63–82. [Google Scholar] [CrossRef]
  12. Free, C.M.; Jensen, O.P.; Mason, S.A.; Eriksen, M.; Williamson, N.J.; Boldgiv, B. High-levels of microplastic pollution in a large, remote, mountain lake. Mar. Pollut. Bull. 2014, 85, 156–163. [Google Scholar] [CrossRef]
  13. Sighicelli, M.; Pietrelli, L.; Lecce, F.; Iannilli, V.; Falconieri, M.; Coscia, L.; Di Vito, S.; Nuglio, S.; Zampetti, G. Microplastic pollution in the surface waters of Italian Subalpine Lakes. Environ. Pollut. 2018, 236, 645–651. [Google Scholar] [CrossRef]
  14. Binelli, A.; Pietrelli, L.; Di Vito, S.; Coscia, L.; Sighicelli, M.; Torre, C.D.; Parenti, C.C.; Magni, S. Hazard evaluation of plastic mixtures from four Italian subalpine great lakes on the basis of laboratory exposures of zebra mussels. Sci. Total Environ. 2020, 699, 134366. [Google Scholar] [CrossRef]
  15. Salikova, N.S.; Rodrigo-Ilarri, J.; Makeyeva, L.A.; Rodrigo-Clavero, M.-E.; Tleuova, Z.O.; Makhmutova, A.D. Monitoring of Microplastics in Water and Sediment Samples of Lakes and Rivers of the Akmola Region (Kazakhstan). Water 2024, 16, 1051. [Google Scholar] [CrossRef]
  16. Cozzarini, L.; Buoninsegni, J.; Corbau, C.; Lughi, V. Characterization of Large Microplastic Debris in Beach Sediments in the Po Delta Area. Microplastics 2023, 2, 147–157. [Google Scholar] [CrossRef]
  17. Mabry, L.; Urban-Rich, J. Seasonal and Distributional Changes in the Composition and Flux of Anthropogenic Microparticles in the Surface Waters of the Charles River, Massachusetts, United States. Microplastics 2024, 3, 539–558. [Google Scholar] [CrossRef]
  18. Seabin. Available online: https://seabin.io/home (accessed on 12 December 2024).
  19. Seabin V5. Available online: https://www.maris.com.tr/en/products/seabin-v5 (accessed on 22 May 2025).
  20. Paris, A.; Kwaoga, A.; Hewavitharane, C. An assessment of floating marine debris within the breakwaters of the University of the South Pacific, Marine Studies Campus at Laucala Bay. Mar. Pollut. Bull. 2022, 174, 113290. [Google Scholar] [CrossRef]
  21. Maglić, L.; Maglić, L.; Grbčić, A.; Gulić, M. Composition of Floating Marine Litter in Port Areas of the Island of Mallorca. J. Mar. Sci. Eng. 2022, 10, 1079. [Google Scholar] [CrossRef]
  22. Parker-Jurd, F.N.F.; Smith, N.S.; Gibson, L.; Nuojua, S.; Thompson, R.C. Evaluating the performance of the ‘Seabin’—A fixed point mechanical litter removal device for sheltered waters. Mar. Pollut. Bull. 2022, 184, 114199. [Google Scholar] [CrossRef]
  23. Nikiema, J.; Asiedu, Z. A review of the cost and effectiveness of solutions to address plastic pollution. Environ. Sci. Pollut. Res. 2022, 29, 24547–24573. [Google Scholar] [CrossRef]
  24. Sherlock, C.; Gutierrez, R.F.; David, M.; Rochman, C.M. A methodology for quantifying and characterizing litter from trash capture devices (TCDs) to measure impact and inform upstream solutions. Facets 2023, 8, 1–12. [Google Scholar] [CrossRef]
  25. DeYoung, M.; Fisher, M.; Hilkene, C. The Great Lakes Plastic Cleanup: An Effective Approach to Addressing Plastic Pollution in the Great Lakes. In Plastic Pollution: Nature Based Solutions and Effective Governance, 1st ed.; Krantzberg, G., Jetoo, S., Grover, V.I., Babel, S., Eds.; CRC Press: Boca Raton, FL, USA, 2023; pp. 1–16. [Google Scholar]
  26. Imhof, H.K.; Ivleva, N.P.; Schmid, J.; Niessner, R.; Laforsch, C. Contamination of beach sediments of a subalpine lake with microplastic particles. Curr. Biol. 2013, 23, R867–R868. [Google Scholar] [CrossRef] [PubMed]
  27. Fambri, L.; Bombardelli, G.; Gavazza, C.; Casagranda, A.; Battocchi, P.; Tomasi, R. Study of Plastics Debris Collected on the North Beaches of the Garda Lake After the Severe Storm Vaia in Autumn 2018. In Proceedings of the 2nd International Conference on Microplastic Pollution in the Mediterranean Sea, Naples, Italy, 15–18 September 2019; Cocca, M., Di Pace, E., Errico, M.E., Gentile, G., Montarsolo, A., Mossotti, R., Avella, M., Eds.; Springer International Publishing: Cham, Switzerland, 2020; pp. 212–225. [Google Scholar]
  28. Battistin, G.; Latella, L.; Iannilli, V. Microplastic pollution in the food web: Observation of ingestion by the talitrid amphipod Cryptorchestia garbinii on the shores of Lake Garda. Eur. Zool. J. 2023, 90, 73–82. [Google Scholar] [CrossRef]
  29. Zettler, E.R.; Mincer, T.J.; Amaral-Zettler, L.A. Life in the “Plastisphere”: Microbial Communities on Plastic Marine Debris. Environ. Sci. Technol. 2013, 47, 7137–7146. [Google Scholar] [CrossRef]
  30. Mato, Y.; Isobe, T.; Takada, H.; Kanehiro, H.; Ohtake, C.; Kaminuma, T. Plastic resin pellets as a transport medium for toxic chemicals in the marine environment. Environ. Sci. Technol. 2001, 35, 318–324. [Google Scholar] [CrossRef]
  31. LifeGate-PlasticLess Project. Available online: https://www.lifegate.it/nasce-lifegate-plasticless (accessed on 12 December 2024).
  32. Giovannini, L.; Laiti, L.; De Franceschi, M.; Zardi, D. Climatological characterisation of the Ora del Garda wind in the Alps. Int. J. Climatol. 2015, 2015, 4103–4115. [Google Scholar] [CrossRef]
  33. ISTAT. Available online: https://demo.istat.it/app/?a=2024&i=D7B (accessed on 12 December 2024).
  34. La Destinazione Garda Trentino. Available online: https://data.gardatrentino.it/it/data-garda-trentino.html (accessed on 12 December 2024).
  35. Campanale, C.; Savino, I.; Massarelli, C.; Uricchio, V.F. Fourier Transform Infrared Spectroscopy to Assess the Degree of Alteration of Artificially Aged and Environmentally Weathered Microplastics. Polymers 2023, 15, 911. [Google Scholar] [CrossRef]
  36. Gopanna, A.; Mandapati, R.N.; Thomas, S.P.; Rajan, K.; Chavali, M. Fourier transform infrared spectroscopy (FTIR), Raman spectroscopy and wide-angle X-ray scattering (WAXS) of polypropylene (PP)/cyclic olefin copolymer (COC) blends for qualitative and quantitative analysis. Polym. Bull. 2019, 76, 4259–4274. [Google Scholar] [CrossRef]
  37. Fang, J.; Xuan, Y.; Li, Q. Preparation of polystyrene spheres in different particle sizes and assembly of the PS colloidal crystals. Sci. China Technol. Sci. 2010, 53, 3088–3093. [Google Scholar] [CrossRef]
  38. Mecozzi, M.; Nisini, L. The differentiation of biodegradable and non-biodegradable polyethylene terephthalate (PET) samples by FTIR spectroscopy: A potential support for the structural differentiation of PET in environmental analysis. Infrared Phys. Technol. 2019, 101, 119–126. [Google Scholar] [CrossRef]
  39. Djebara, M.; Stoquert, J.P.; Abdesselam, M.; Muller, D.; Chami, A.C. FTIR analysis of polyethylene terephthalate irradiated by MeV He+. Nucl. Instrum. Methods Phys. Res. B 2012, 274, 70–77. [Google Scholar] [CrossRef]
  40. ASTM E2009-08; Standard Test Method for Oxidation Onset Temperature of Hydrocarbons by Differential Scanning Calorimetry. ASTM International: West Conshohocken, PA, USA, 2014.
  41. Maes, T.; Van der Meulen, M.D.; Devriese, L.I.; Leslie, H.A.; Huvet, A.; Frère, L.; Robbens, J.; Vethaak, A.D. Microplastics Baseline Surveys at the Water Surface and in Sediments of the North-East Atlantic. Front. Mar. Sci. 2017, 4, 135. (In English) [Google Scholar] [CrossRef]
  42. Pasquier, G.; Doyen, P.; Kazour, M.; Dehaut, A.; Diop, M.; Duflos, G.; Amara, R. Manta Net: The Golden Method for Sampling Surface Water Microplastics in Aquatic Environments. Front. Environ. Sci. 2022, 10, 811112. [Google Scholar] [CrossRef]
  43. Montoto-Martínez, T.; Meléndez-Díez, C.; Melián-Ramírez, A.; Hernández-Brito, J.J.; Gelado-Caballero, M.D. Comparison between the traditional Manta net and an innovative device for microplastic sampling in surface marine waters. Mar. Pollut. Bull. 2022, 185, 114237. [Google Scholar] [CrossRef]
  44. Bergmann, M.; Arp, H.P.H.; Carney Almroth, B.; Cowger, W.; Eriksen, M.; Dey, T.; Gündoğdu, S.; Helm, R.R.; Krieger, A.; Syberg, K.; et al. Moving from symptom management to upstream plastics prevention: The fallacy of plastic cleanup technology. One Earth 2023, 6, 1439–1442. [Google Scholar] [CrossRef]
  45. Gulmine, J.; Janissek, P.; Heise, H.; Akcelrud, L. Polyethylene characterization by FTIR. Polym. Test. 2002, 21, 557–563. [Google Scholar] [CrossRef]
  46. Karlsson, T.M.; Kärrman, A.; Rotander, A.; Hassellöv, M. Comparison between manta trawl and in situ pump filtration methods, and guidance for visual identification of microplastics in surface waters. Environ. Sci. Pollut. Res. 2020, 27, 5559–5571. [Google Scholar] [CrossRef] [PubMed]
  47. Rytelewska, S.; Dąbrowska, A. The Raman Spectroscopy Approach to Different Freshwater Microplastics and Quantitative Characterization of Polyethylene Aged in the Environment. Microplastics 2022, 1, 263–281. [Google Scholar] [CrossRef]
  48. Lim, Y.K.; Lee, K.-W.; Hong, S.H.; Park, J.G.; Baek, S.H. Differential impact of planktonic and periphytic diatoms on aggregation and sinking of microplastics in a simulated marine environment. Mar. Pollut. Bull. 2024, 199, 115961. [Google Scholar] [CrossRef]
  49. Microplastics a Macro Problem. Available online: https://diinews.unitn.it/en/microplastics-a-macro-problem/ (accessed on 16 April 2025).
Figure 1. (a) A map of the area selected for the collection of debris from the lake water. Adapted by the authors from OpenStreetMap under Open Database License (openstreetmap.org/copyright). The approximate position of the Seabin is marked with a red circle. Wind Ora and River Sarca flow direction are marked with black arrows; (b) a picture of the Seabin during plastic waste collection.
Microplastics 04 00044 g001
Figure 2. Typical FTIR spectra of the most common plastics typically retrieved in the environment; (a) PE; (b) PP; (c) PS; and (d) PET.
Microplastics 04 00044 g002
Figure 3. (a) A picture of some microplastics from Sample 6; (b) boxplots depicting the size distributions of MPs during the two seasonal surveys. IQR is the interquartile range, i.e., the difference between the 75th and the 25th percentiles of the data.
Microplastics 04 00044 g003
Figure 4. The cumulative composition of the litter collected via a Seabin in Lake Garda during summer and autumn seasons of 2024: (a) the total mass; (b) the material composition of plastic by mass; (c) the material composition of plastic by the number of items; (d) the typology of plastic products by mass; and (e) the typology of plastic products by number of items.
Microplastics 04 00044 g004
Figure 5. SEM micrographs of the surface of the specimens selected for this case study: (a) PE surface at 300× magnification; (b) PP surface at 500× magnification; (c) EPS surface at 1000× magnification.
Microplastics 04 00044 g005
Figure 6. FTIR (a,c,e) and OOT (via DSC) (b,d,f) measurements of pristine (as-purchased) and naturally aged (retrieved from Lake Garda); (a,b) PE; (c,d) PP; and (e,f) EPS. Red curves represent aged specimens, and blue curves represent pristine specimens.
Microplastics 04 00044 g006
Table 1. The FTIR peak assignation of typical plastics retrieved in the environment.
MaterialWavenumber (cm−1)Peak Intensity *Peak Assignment
PE [35]2915vs–CH2 stretching
2847vs–CH2 stretching
1462mCH=CH stretching
719m–CH2 rocking
PP [35,36]2952s–CH3 stretching
2917s–CH2 stretching
2839m–CH2 stretching
1455m–CH2 bending
1375s–CH3 bending
997w–CH3 rocking
972w–CH3 rocking
PS [35,37]3060wC–H aromatic stretch
3026wC–H aromatic stretch
1600wC=C aromatic stretch
1492mC=C aromatic stretch
1452mC=C aromatic stretch
756mC–H out-of-plane bending
698sC–H out-of-plane bending
PET [38,39]1715vsC=O stretching
1470w–CH2 bending
1370w–CH2 gauche wagging
1340m–CH2 trans wagging
1250vsC–C–O asymmetric stretching
1100vsC–O–C stretching
973mOxy-methylene bending
898wOxy-methylene bending
724vsAromatic ring C–H out-of plane and C–C bending
* vs: very strong; s: strong; m: medium; w: weak.
Table 2. Mean values of plastic (P) and microplastic (MP) mass and numerical count divided by the total amount of water filtered during sampling; the two seasonal surveys are compared. Mean relative mass of vegetation and ratio of MP mass with respect to the total wet mass are also reported.
SummerAutumn
Mass of P/water filtered (g/m3)0.0319 ± 0.03830.0174 ± 0.0300
Mass of MP/water filtered (g/m3)0.0006 ± 0.00040.0002 ± 0.0002
Mass of P+ MP/water filtered (g/m3)0.0325 ± 0.03860.0176 ± 0.0303
Number of P particles/water filtered (1/m3)0.0319 ± 0.01750.0226 ± 0.0368
Number of MP particles/water filtered (1/m3)0.0778 ± 0.02620.0262 ± 0.0064
Number of P+ MP particles/water filtered (1/m3)0.1097 ± 0.04210.0488 ± 0.0430
Mass of vegetation and animal residues/water filtered (g/m3)0.45 ± 0.300.15 ± 0.23
Ratio MP/total wet mass (ppm)189 ± 68262 ± 301
Disclaimer/Publisher’s Note: The statements, opinions and data contained in all publications are solely those of the individual author(s) and contributor(s) and not of MDPI and/or the editor(s). MDPI and/or the editor(s) disclaim responsibility for any injury to people or property resulting from any ideas, methods, instructions or products referred to in the content.

