Abstract
The concentration of microplastics [300–5000 µm] in the surface water of the Mayotte lagoon, Western Indian Ocean, was measured over two snapshot campaigns conducted during the dry and rainy seasons. The concentration in the surface water varied from 0.01 MP m−3 to 1.23 MP m−3 and was higher during the rainy season. All particles were analyzed via µFTIR, enabling systematic polymer and surface area determination. Polypropylene dominated over polyethylene and polystyrene, representing 70% of the microplastic particles observed. The microplastics, which were predominantly in the [0.3–1000 µm] fraction, presented a similar seasonal trend of distribution with respect to their occurrence, suggesting that turbulence and the subsequent settling of microplastics in the lagoon’s surface water were identical during the two campaigns. PCA was performed to deconvolute the effects of season and hydrodynamic features on the observed surface water concentrations and median size distribution. It evidenced a high degree of disparity in concentration and median area in surface water during the rainy season, while a lower concentration of smaller particles was observed during the end of the dry season. A microplastic risk assessment was performed for the surface water of the lagoon and evidenced a low pollution load index and low to high polymer risk assessment and potential ecological risk indexes.
1. Introduction
Microplastics (MPs), which are plastic particles in the size range [1 μm–5000 µm] [1], are ubiquitous in the environment. They are found in urbanized and remote aquatic and terrestrial environments such as icecaps [2], rivers and lakes (i.e., [3,4]), soils (e.g., [5]), and surface oceanic waters or deep sea waters [6,7]. They originate from pellets and microbeads (primary particles) or from the degradation of larger plastic particles or synthetic textiles and garment fibers (i.e., secondary particles) via thermo-oxidation, UV degradation, abrasion, biodegradation, biofouling, and hydrolysis processes. The transport of microplastics from their sources to terrestrial and aquatic environments occurs mainly via atmospheric fallout [8,9], urban runoff [10], surface runoff [11], and within waterways, where they are subjected to erosion, transport, settling, and deposition [12]. Microplastics are then ingested by, accumulate in, and/or adhere to organisms or crops [13,14,15], with adverse effects depending on the species targeted and the particles’ size, polymer type, additives, and dose [16,17]. Microplastics are also ingested by humans via food consumption and inhalation [18], and the characterization of their potential adverse effects on human health is a challenging and timely area of research [19].
Small island developing states (SIDS) are vulnerable to plastic pollution, which originates mostly from waste mismanagement and marine litter and impacts their biodiversity and tourism industries [20]. The plastic footprint approach evidences that SIDS may have the same level of plastic use and waste per capita as high-income countries but without the same infrastructure for waste treatment [21]. Therefore, efforts to alleviate plastic pollution on SIDS mainly rely on implementing efficient solid waste management systems [22] and costly clean-up operations [23]. Efforts to mitigate microplastic pollution in the marine environment exist and rely on local policies or those from global environmental group initiatives [24]. To improve the effectiveness of these policies, the authors of [24] pointed out a need to identify focal causes of microplastic pollution through further environmental research and governance approaches.
Mayotte, a French overseas department, is one of four islands located in the Comoros Archipelagos. It is facing rising plastic pollution, both inland and at sea, as demonstrated by a single published study [25]. Locals often place responsibility for this environmental leakage on Mayotte’s domestic solid waste management program, which is coordinated by SIDEVAM 976 (Syndicat Intercommunal d’Elimination et de Valorisation des Déchets de Mayotte). At the global scale, marine activities are highlighted an important source of oceanic plastic pollution (e.g., [23,26]). In Mayotte, the fishery fleet comprises only 91 active vessels (all <12 m long), which operate mostly in the coastal zones for handline and trolling line fishing [27], and aquaculture, which was established in 1999 for tropical umbrine farms, has declined and is now absent from the lagoon. In 2017, the Mayotte Marine Natural Park (French Biodiversity Office) created a marine waste observatory in order to better understand the dynamics of waste at sea and quantify its flow. This observatory conducts a range of macro- and micro-waste monitoring in seawater, on reefs, and in beach sediment, and a data bank is currently being established. Even if pressure due to aquaculture and fishing activity is low in the Mayotte lagoon, fishing gear, including nylon fishing lines, string, rope, and nets, has been observed in the fringing reefs and represents up to 70% of plastic litter measured in this location [25]. These studies make it possible to develop solutions aimed at reducing the impact of waste on the marine environment. Thus, to fully understand plastic and microplastic pollution in the surface water of the lagoon, as part of the PLASMA (Plastic in Mayotte) project, we investigated the Mayotte lagoon’s surface water to measure the concentration of microplastics, characterize their morphology, and systematically identify the polymers present. We focused our study on this compartment only. We hypothesized that due to the tropical climate of the island, the rainy season would enhance surface runoff and riverine discharges, and thus the input of microplastics, into the lagoon. We also hypothesized that, due to its hydrodynamic features, the lagoon acts as an accumulation zone for microplastics compared to the oceanic surface water outside the lagoon.
Therefore, this study focused on the surface waters only to (i) determine the baseline microplastic concentrations ([300–5000 µm]) in the Mayotte lagoon’s surface water, (ii) observe any variation in concentration, morphology, and polymer type between contrasting seasons, (iii) identify a geographical pattern in the concentration distribution, (iv) assess the potential ecological risk using multiple indexes. To do so, we set up two sampling trips during the end of the dry season and the rainy season at sampling sites selected inside and outside the lagoon.
2. Materials and Methods
2.1. Study Area
Mayotte, a French overseas department located in the Comoros Archipelago in the Western Indian Ocean, comprises 374 km2 of emerged lands (Grande-Terre and Petite-Terre, mainly) and 1100 km2 of lagoon (Figure 1). About 310,000 inhabitants live on Mayotte (i.e., a population density of 805 inhabitants km−2), and 77% live below the French poverty line [28]. The population is very concentrated on Petite-Terre and Mamoudzou, with considerable part living in the shanty town, while many forested areas are very sparsely inhabited because they are too far from water or electricity networks [28].
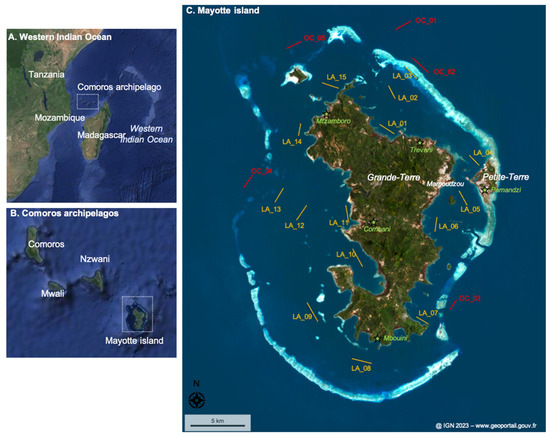
Figure 1.
The studied area. (A) The Western Indian Ocean area. (B) The Comoros Archipelago. (C) Mayotte island and its lagoon. Sampling sites in the lagoon (LA) are represented in yellow, and sampling sites outside the lagoon, i.e., in the ocean (OC), are presented in red. The line represents the trawling length and orientation realized. The island name and main city are labeled in white. The locations of the meteorological sites (and corresponding cities) are indicated by green stars. The dotted boxes represent the studied area at the scale of (A,B).
Mayotte is subjected to a hot, humid, and maritime tropical climate characterized by small variations in daily and annual temperatures and significant precipitation (more than 1500 mm per year on average on the island) (Figure 2A). The two main wind regimes affecting the island are the monsoon wind (warm and humid, moving north to northwest in austral summer) and the trade wind generated by the Mascarene anticyclone (cool and dry, blowing from the southeast in southern winter). In connection with these two wind regimes, two main seasons characterize the year: a hot and rainy season from December to April, and a cooler and drier season from June to September. The main seasons are separated by two shorter off seasons. The natural environment of the island is threatened by deforestation and subsequent counterintuitive aridification for a such tropical climate, land erosion, and poor waste and wastewater management [25,29,30]. The island comprises 25 small rivers, the lengths of which vary from less than 2 km to 22 km. These rivers have an intermittent hydrological regime, with monthly water discharges that are null or close to null during the dry season and range between 12 L s−1 and 500 L s−1 during the rainy season [31]. Despite anthropogenic pressure, Mayotte’s coral reefs (342 km2), seagrass beds (7.6 km2), and mangroves (8.5 km2) still provide important ecosystem services, the most important of which are coastal protection, fish biomass production, carbon sequestration, and water purification [32].
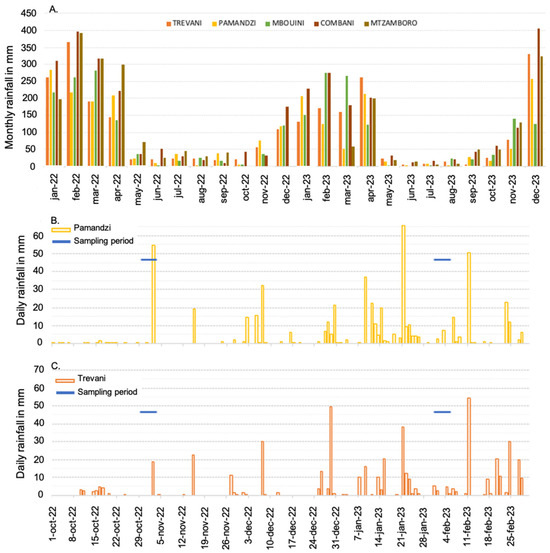
Figure 2.
(A) Monthly rainfall (in mm) in the Mayotte islands recorded at five sites on Grande-Terre and Petite-Terre during the years 2022 and 2023. (B) Daily rainfall recorded at Pamandzi on Petite-Terre from October 2022 to February 2023 and sampling days. (C) Daily rainfall recorded at Trevani on Grande-Terre from October 2022 to February 2023 and sampling days. Data are from meteo.data.gouv.fr.
Mayotte is located (i) in an extension of the South Equatorial Current which, when it reaches the African coast, splits into a northward current and a strong southward current in the Mozambique Channel and (ii) in the eddies often generated in the Mozambique Channel. Therefore, the circulation around Mayotte is generally directed from north to south [33]. Large-scale ocean currents do not play a major role in intra-lagoon circulation, and ocean–lagoon exchanges are limited due to the continental slope and coral reef [30]. Intra-lagoon circulation mainly occurs due to tides, winds, and waves breaking on the reef [34]. The tide is mainly semi-diurnal, with spring tide and neap tide variations (M2, S2, and K1 waves), typically ranging from 0.8 to 2.7 m, respectively. Unlike most channel lagoons, the tide is essentially propagative, with its maximum current reached at slack water (high and low tide). During ebb and low tide, the current flows essentially from west to east, while during flood and high tide, it flows from east to west. When tidally averaged, the current flows from north to south. It exits through the northeast and southwest barriers and enters through the northwest submerged barrier and the southeast reef barrier. Ocean swell and other waves from the Mozambique Channel can break on the outer edge of the reef, inducing a cross-reef flow.
2.2. Sampling and Handling
Sampling was performed in the surface water at 15 sites inside the Mayotte lagoon and 5 sites outside in front of the main outer passages (Figure 1; Table 1). These sites were selected to spatially represent the lagoon. The 20 sites, including their distance to the coastline, are fully described in Table S1. Sampling was conducted during two contrasting seasons, at the end of the dry season from 29 October 2022 to 3 November 2022 and during the rainy season from 31 January 2023 to 5 February 2023 (Figure 2; precipitation data from meteo.data.gouv.fr).

Table 1.
Sampling date, location in the lagoon, and volume of water sampled for each sampling site at the end of the dry season and during the rainy season. nd: not determined.
The sampling strategy was designed based on the technical resources available on Mayotte and the recommendation from the GESAMP expert panel [35]. MPs in the surface seawater were sampled using a 300 μm mesh size manta net (30 cm * 60 cm aperture) from aboard a diving boat. Sampling was carried out by sailing straight ahead at a constant speed for 30 min during the end of the dry season sampling period and for 20 min during the rainy season sampling period. We note that this change in duration was necessary to prevent the net from becoming clogged due to the greater presence of suspended material (wood, leaves, algae, and waste) in the surface water during the rainy season. GPS coordinates and time were recorded at the beginning and end of each towing session. The volume of water sampled was determined by multiplying the distance traveled in m (determined from the GPS position) with the surface of the net in m2 (using the net’s dimensions) (Table S1). After sampling, the net was rinsed onboard the boat from the outside to the inside, using a pressure backpack sprayer filled with seawater. The collector was then removed from the net and cleaned with filtered seawater (onboard filtration on a 60 μm mesh size sieve), also from the outside to the inside. The collected fraction was then poured into a 250 mL glass bottle. When mangrove leaves, plant debris, living organisms, and/or plastic debris larger than 5 mm were observed in the collected fraction in the collector, the items were selected using metal tweezers, rinsed with filtered seawater (onboard filtration on a 60 μm mesh size sieve) above the collector, and removed before the collected fraction was poured into the glass bottle. At the end of the sampling day, the samples were stored at room temperature after the addition of 25 mL of ethanol and carefully packed for traveling. Back in the laboratory, the samples were stored in a cool room until analysis.
2.3. Laboratory Analysis
2.3.1. Extraction and Density Separation Steps
The protocol developed by [36] for surface water was followed for extraction and NaCl density separation. First, each sample was sieved on a 1 mm mesh sieve to remove litter >1 mm (e.g., vegetal, wood, and shell debris), while plastic items >1 mm were kept separately in a 30 mL glass vial. The fraction < 1 mm was then sieved on 500 μm followed by 250 μm mesh sieves (inox, 10 cm diameter) under a magnifying glass. The plastic-like particles were isolated from the plankton on the 500 μm sieve and retained with the [250–500 μm] fraction in a separate 250 mL glass bottle. We note that this separation step was performed to facilitate the analysis and not to classify the plastic particles by size. Second, the samples in the 30 mL glass vial and 250 mL glass bottle were treated via the addition of three successive reagents: (i) 0.8 g of Sodium Dodecyl Sulfate (SDS) at 40 °C for 24 h; (ii) 0.8 mL of biozym SE (protease and amylase, Spinnrad®) and 0.8 mL of biozym F (lipase, Spinnrad®) at 40 °C for 48 h; (iii) 12 mL of hydrogen peroxide (H2O2 30%) at 40 ◦C for 48 h. During each step, the bottle was closed and maintained in a laboratory oven. Then, in a third step, the sample was transferred through a 250 μm mesh sieve in order to remove all the mineral and organic particles smaller than 250 μm and to obtain clearer filters for μFTIR analysis: the fraction < 250 μm was discarded, while the fraction > 250 μm was transferred into a clean 250 mL glass beaker using a filtered NaCl solution (density 1.18 g cm−3). In the fourth step, the beaker was gently filled with the NaCl solution to perform density separation via overflow. This step was repeated at least 5 times to ensure the retrieval of the plastic items. Finally, the overflowed solution was kept in a 30 mL glass vial until the μFTIR analysis.
2.3.2. FTIR Analysis
Polymer determination was carried out using the plastic platform of GERS-LEE Université Gustave Eiffel. The glass vial tube was sonicated for 60 s with manual shaking before its contents were filtered using a glass filtration unit with a 25 mm Anodisc filter. The filter was placed on a burned glass Petri dish and dried at room temperature for at least 12 h. The dried filter was analyzed using a µFTIR spectrometer (NICOLET iN 10 MX, Thermofisher scientific, Bouguenais, France) to determine the chemical composition of the remaining particles. The analysis was performed in the imaging mode using OMNICPICTA® software. In this mode, 16 IMAGIN detectors with a pixel resolution of 25 × 25 μm length area were used. The whole filtered area was mapped. The spectrum parameters were as follows: a transmission mode from 4000 to 1200 cm−1 for the wavelength, 1 scan, and a resolution of 8 cm−1. The analyzed maps were then examined using siMPle software (version 1.1.β), the library for which includes more than 30 types of plastic and natural matter (i.e., cellulose and protein). The chemical composition of the polymer plastics was determined based on the spectrum matching score between the sample and the siMPle software library, i.e., the following matching score thresholds: polyethylene PE > 0.75; polypropylene PP > 0.55; polyethylene terephthalate PET > 0.65; polyester > 0.65; polystyrene PS > 0.60; polyamide PA > 0.70; Polyvinyl chloride PVC > 0,60; polycarbonate PC > 0.65; Ethylene-vinyl acetate EVA > 0.65; and nylon > 0.70. After polymer determination, each particle area was measured directly using the siMPle software based on pixel analysis (25 × 25 μm length area) and the two dimensions, i.e., major and minor. When particle superposition occurred, each particle was double-checked, and its area was recalculated based on the OMNICPICTA® pictures and pixel analysis (25 × 25 μm length area). Due to the imaging pixel resolution (25 × 25 μm length area), fibers were not analyzed (because their width are most often less than 15 μm), and only fragments (including films and spheres) were analyzed and recorded.
According to the protocols used, from sampling to µFTIR spectrometer analysis, data reported in this publication as MPs thus represent only fragment particles made of PP, PE, PS, PVC, PA, or polyester (i.e., the only six polymers determined in the samples) in the size range [300–5000 μm]. Concentrations of MPs were then determined at each site by multiplying the volume of water sampled (Table 1 and Table S1) with the number of identified MP particles. In the literature, MP concentrations are often reported in items m−3, even when polymer determination is not performed on all the observed MP particles. As all the MP particles reported in the present study were analyzed via µFTIR and were made of PP, PE, PS, PVC, PA, or polyester, we decided to define MP concentrations in MP m−3 instead of item m−3.
2.4. Quality Control
Quality control and contamination prevention were assured in the laboratory based on the recommendations in [37]: all glassware was rinsed with filtered water, burnt prior to use, and kept covered with aluminum foil; operators always wore cotton lab clothes and gloves; and the water and NaCl solution were filtered on GF/A filters (porosity: 1.6 mm) before use and kept in glass bottles. The sieves were carefully rinsed with filtered water under a magnifying glass (×10) to avoid plastic particles adhering to the sieves’ surfaces, which could lead to an underestimation of the plastic particles. Sieving atmospheric control comprising a filter placed on the benchmark and exposed to airborne contamination during the digestion and sieving steps was performed along with blank (filtered water and filter background for μFTIR analysis) controls. All controls evidenced an absence of MP contamination.
All sites were sampled during both seasons, but some samples were labeled as “not determined” due to sampling or analytical issues encountered.
2.5. Statistics
The Mann–Whitney U test was performed at a probability level of p < 0.05 to test the difference in concentration and size distribution between the end of the dry season and the rainy season, using XLSTAT software version 2023.1.1.
To better analyze the variability of MP distribution between sampling dates and stations, principal component analyses (PCAs) were performed on the normalized values of the concentrations (in number per m3) of the total MPs and of the different identified polymers and their median area (area, in µm2), using PRIMER 7 software.
2.6. Microplastic Risk Assessment
A microplastic risk assessment for surface water was conducted for each site and season using different indexes described by [38]: the pollution load index (PLI), polymer risk assessment index (H), and potential ecological risk index (RI).
2.6.1. Pollution Load Index (PLI)
The pollution load index was determined to evaluate the degree of the impact of microplastics on the flora and fauna of the lagoon. It depends on the MP concentrations measured in the surface water in comparison with background values measured in this environment:
where CFi is the contamination factor of MPs, Ci the measured total MP concentration, and Co is the background total MP concentration, taken to be 0.02 MP m−3 based on the lowest concentrations measured in the lagoon in this study and the lowest MP concentrations measured in the nearshore Western Indian Ocean [39] for the size range studied, [300–5000 μm]. The PLI score is categorized into four classes to evaluate the degree of risk: PLI < 10: low; 10 < PLI < 20: medium; 20 < PLI < 30: high; and PLI > 30: extremely high.
2.6.2. Polymer Risk Assessment Index H
The polymer risk assessment index evaluates the MP risk based mainly on polymer types, each of which has a hazard score. The H index was calculated according to the following equation:
where Pn represents the proportion of each polymer type in each sample and Sn represents the polymer hazard score: PP = 1; PE = 11; PS = 30; polyamide = 50; polyester= 1117; and PVC = 10,001 [40]. The H index score is categorized into four classes to evaluate the degree of risk: H < 10: level I; 10 < H < 100: level II; 100 < H < 1000: level III; and H > 1000: level IV [40].
2.6.3. Potential Ecological Risk Index RI
The potential ecological risk index assesses the ecological and toxicological consequences of MPs in relation to the polymer risk assessment index H, according to the following equation:
where Ti represents the toxicity coefficient of the MP. The potential ecological risk index is categorized into five classes to evaluate the degree of risk: RI < 150: Level I; 150 < RI < 300: Level II; 300 < RI < 600: Level III; 600 < RI < 1200: Level IV; and RI > 1200: Level V.
3. Results and Discussion
3.1. Baseline Concentrations of Microplastics in Surface Water
3.1.1. Baseline Concentrations
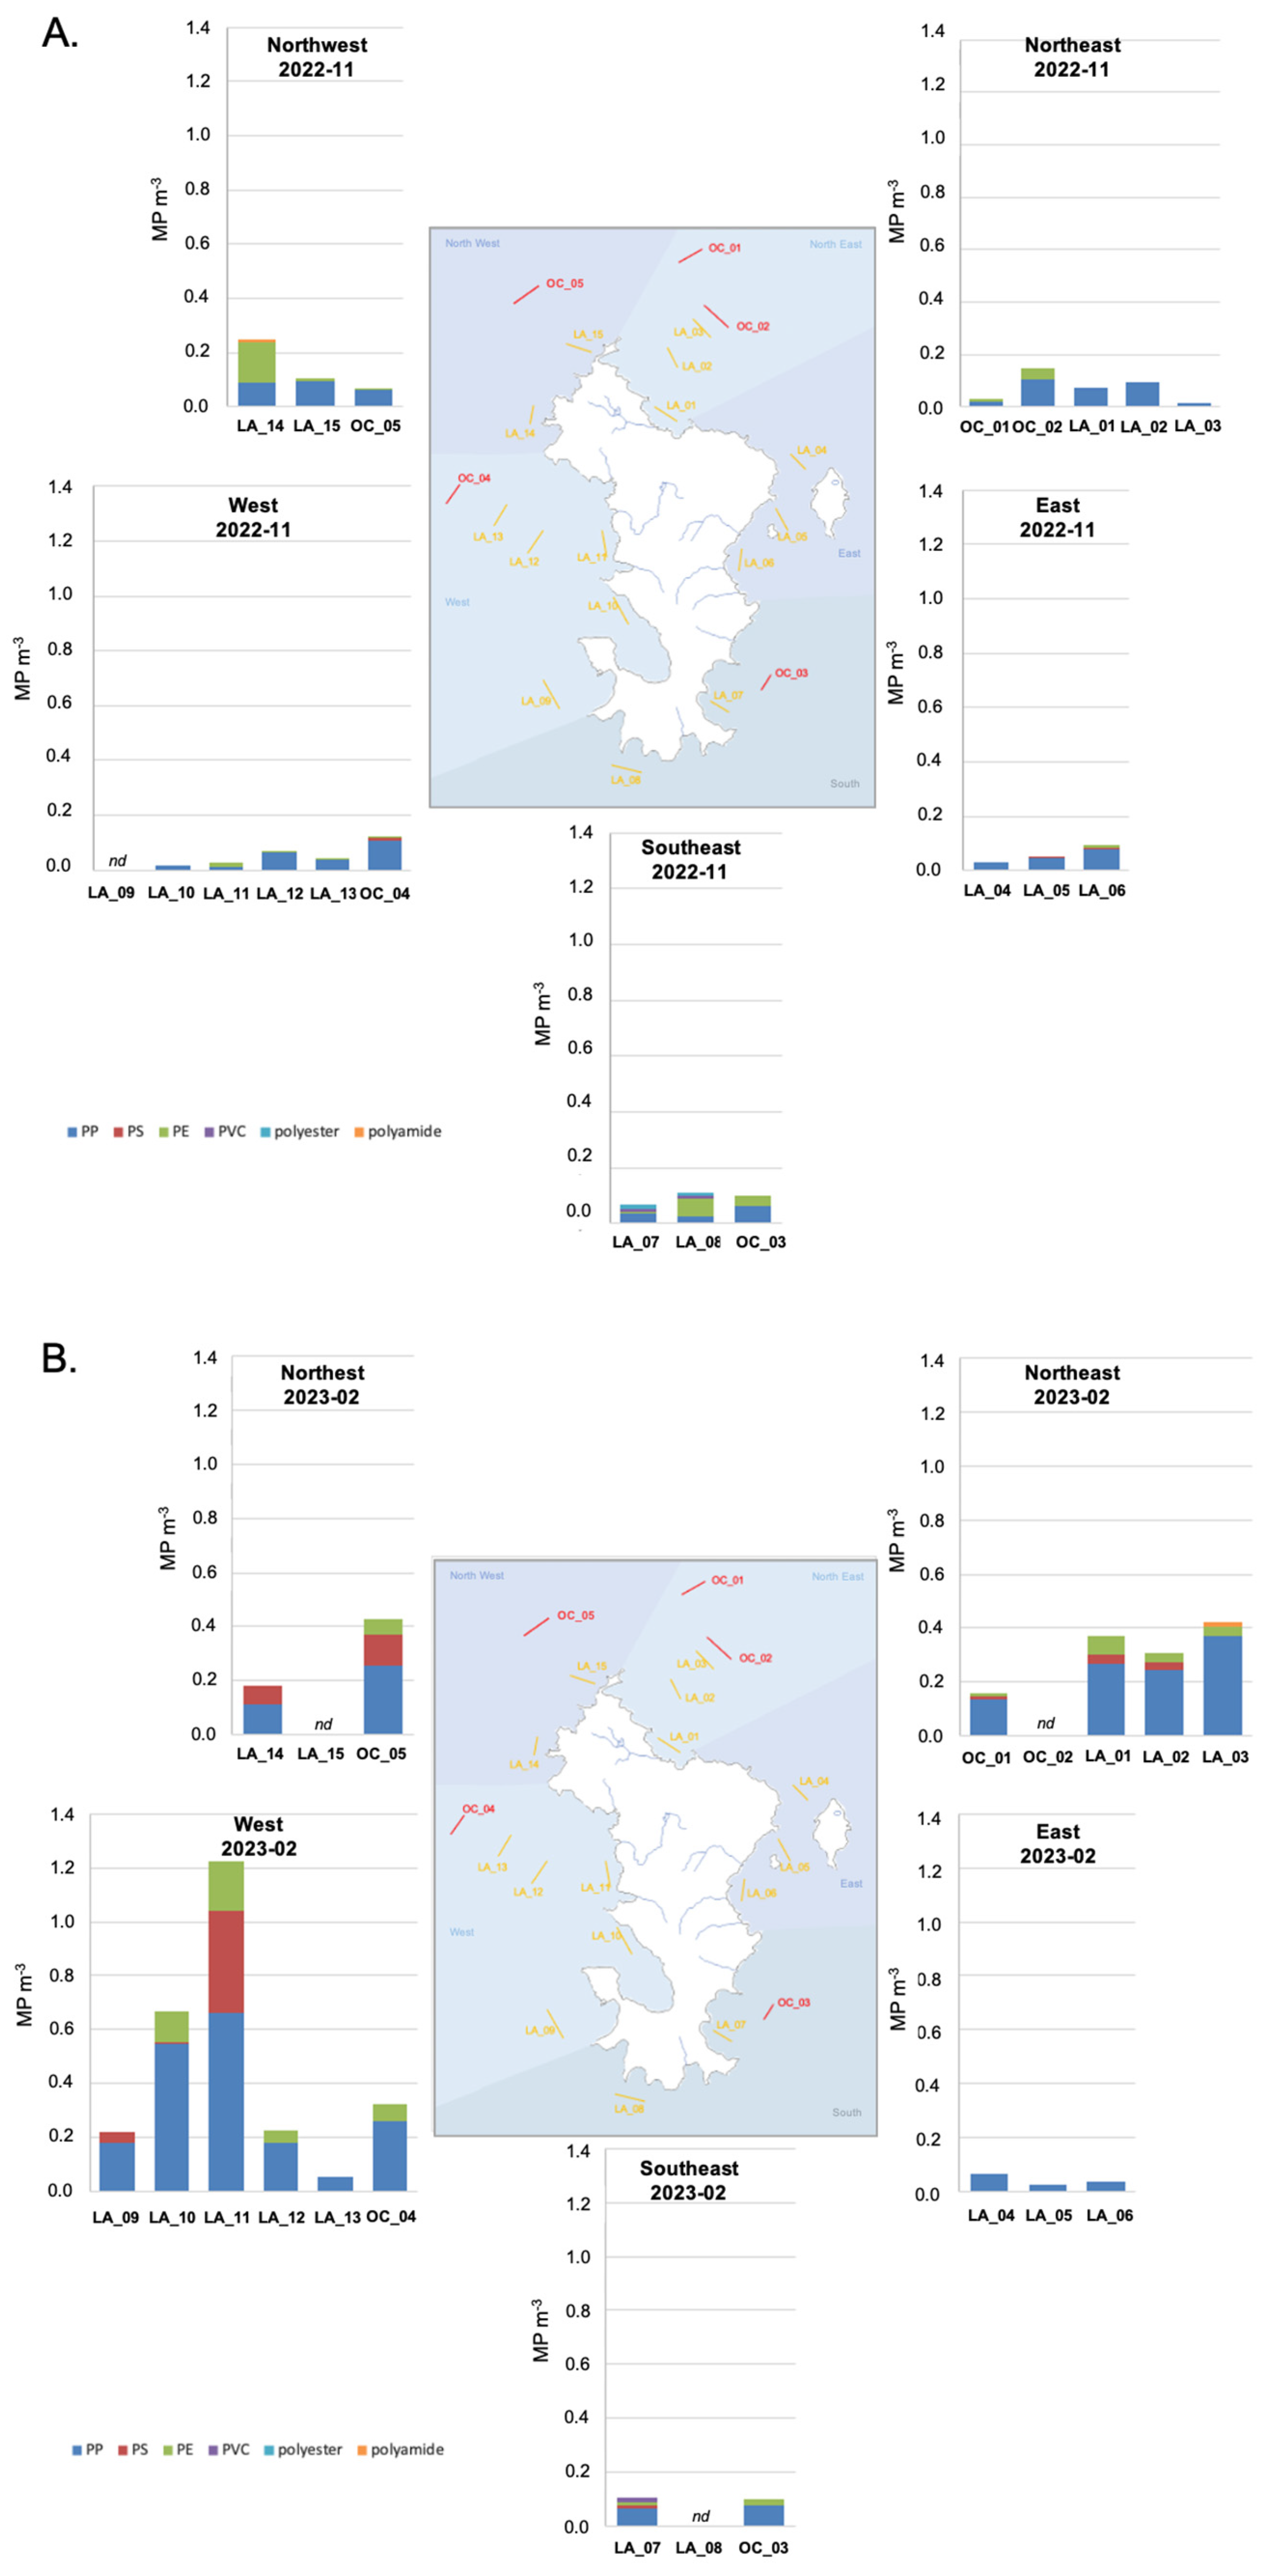
The microplastic concentration was measured in the surface water of the Mayotte lagoon in October 2022 (Figure 3A) and February 2023 (Figure 3B) and was found to vary from 0.01 MP m−3 (LA_03; 2022-11) to 1.23 MP m−3 (LA_11; 2023-02) (Table 2).
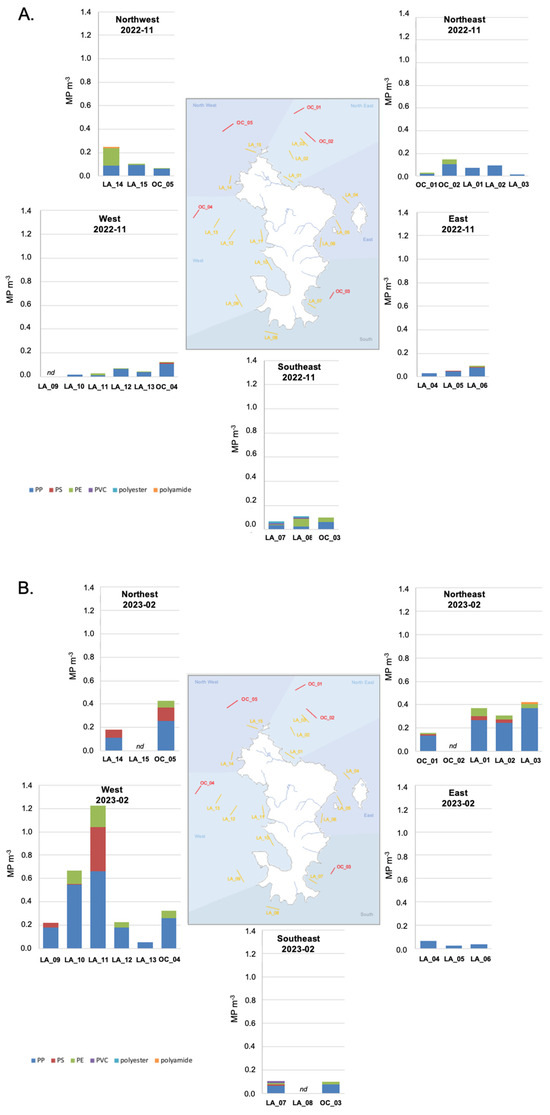
Figure 3.
(A) Microplastic concentrations measured in the surface water at the 20 sites during the end of the dry season. Concentrations are expressed in items of the identified polymers per volume—PP, PE, PS, PVC, polyester, and polyamide—and are represented by the geographical zone over the Mayotte lagoon. nd—samples were not analyzed. (B) Microplastic concentrations measured in the surface waters at the 20 sites during the rainy season. Concentrations are expressed in items of identified polymers per volume—PP, PE, PS, PVC, polyester, and polyamide—and are represented by geographical zone over the Mayotte lagoon. nd—samples were not analyzed.
Table 2.
Total microplastic concentrations (MP m−3) measured at the 20 sites during the end of the dry and the rainy seasons and identified polymer concentrations: PP m−3, PE m−3, PS m−3, PVC m−3, polyester m−3, and polyamide m−3. (nd: not determined).
Few data on microplastic concentrations in the surface water of the Western Indian Ocean have been published so far, and no data for the Comoros Archipelagos have been published. Nevertheless, we compared our study to data obtained with a similar sampling methodology and size range of observation. In Tanzania’s marine surface water, microplastic concentrations were dominated by fragments and fibers and had a concentration of 0.07 ± 0.06 items m−3 nearshore of Zanzibar; this value was higher nearshore of Dar es Salaam at 0.47 ± 0.22 items m−3. This demonstrates the impact of the anthropogenic pressure of the city of Dar es Salaam on its environment [41]. In Kenya’s marine nearshore surface water, microplastic [300–5000 μm] concentrations varied from 0.02 ± 0.00 items m−3 to 0.09 ± 0.07 items m−3 except in front of the Sabaki River (which crosses Nairobi city dumpsites, receiving effluents and runoff), where concentrations increased up to 3.22 ± 2.04 items m−3 due to flooding and runoff in the river basin during the sampling season [39]. In the Indian Ocean, subsurface water sampled along an east–west transect presented few microplastics in the size range [300–5000 μm], resulting in a fragment concentration of 0.1 ± 0.4 MP m−3 [42]. In the surface mixed layer of the western Indian Ocean, fragments of plastic in the size range [200–5000 μm] were observed at concentrations varying from not detected to 0.14 particles m−3 [43]. This range of concentrations was also observed in the Maldives Faafu atoll surface water [44], where microplastic ([200–5000 μm]) concentrations varied from 0.02 to 0.48 MP m−3, which is a similar range as in our study when excluding the two most concentrated sites (LA_10 and LA_11; 2023-02).
3.1.2. Seasonal Concentration Variations
During the end of the dry season (2022-11), microplastic concentrations were significantly lower than those measured during the rainy season (2023-02) (Mann–Whitney test, p = 0.003), all sites included. They varied from 0.01 MP m−3 (LA_03) to 0.25 MP m−3 (LA_14) with a mean of 0.08 MP m−3 during the end of the dry season and from 0.02 MP m−3 (LA_05) to 1.23 MP m−3 (LA_11) with a mean of 0.29 MP m−3 during the rainy season (Table 2). This tendency evidences enhanced microplastic input from land to the lagoon during the rainy season through riverine inputs and/or runoff. The tropical climate of Mayotte and its specific soil composition and slopes induce general subsurface runoff processes, which increase during the rainy season [45] and are inducing enhanced suspended material inputs to the surface water of the lagoon [46]. Surface runoff is considered an important pathway that transports plastic litter and microplastics from the terrestrial environment into the aquatic environment [11], but the process itself is still poorly understood [47]. In Mayotte, the domestic waste collected from residents door-to-door was 37,050 tons in 2020 [48], and the recyclable waste (including glass, paper, card box, metal, and plastic waste), collected based on voluntary contributions, was 453 tons in 2020, corresponding to 1.7 kg inhabitant−1 year−1 [48]. This collection system is not sufficient to prevent littering, especially of plastic, or dumpsites, which are regularly seen on the river banks and mangrove beaches but have not been quantified. The presence of microplastics in these terrestrial aquatic environments also remains to be quantified. In the scientific literature, after rainfall events, field observations have noted enhanced microplastic concentrations in the aquatic catchment receptacles of various environments [49], like the Sabaki river, Kenya [39], the Mersin Bay, NE Mediterranean Sea [50], the coastal environment of Kochi in Eastern Arabian Sea [51], or Lake Donghu, China [52]. We thus assume that such processes may occur on Mayotte. Nevertheless, in a study dedicated to intermittent river, MP concentrations were not correlated to precipitation and season [53] suggesting that the dynamic in the intermittent river and toward the coastal zone may be influenced by additional environmental variables. In future research, sampling before and after rain events along the intermittent river catchment of the Mayotte river should be conducted to investigate and describe the MP dynamic.
3.1.3. Microplastic Polymer Concentrations
In the Mayotte lagoon surface water, PP, a lighter polymer, dominated PE and PS and represented roughly 70% of the MP particles found during both seasons. This domination of PP fragment is currently observed in coastal and marine surface water [39,41,54,55,56], apart in the surface mixed layer of the western Indian Ocean where PVC dominated [43]. The proportion of PS increased during the rainy season from 1% to 13%, while the proportion of PE decreased from 23% to 14%. Polyester, PVC, and polyamide were observed but at very low proportions (less than 1%). This observation is accordance with the laboratory protocol of using NaCl for density separation which has low recovery rates for PVC and polyester [57] and to the imaging resolution of the µFTIR spectrometer which does not target fibers, which are often made of polyester and polyamide. The PP particles observed were diverse, but some, generally with an area > 1,000,000 μm2, were identified to result from fragmented woven PP bags used to store rice, cereals, or rubble. Considering all sites, the concentrations of PP and PS particles were significantly higher during the rainy season than at the end of the dry season (Mann–Whitney test, p = 0.001 for PP, p = 0.006 for PS). PP concentrations varied from 0.01 PP m−3 (LA_03) to 0.11 PP m−3 (OC_04) during the end of the dry season and from 0.02 PP m−3 (LA_05) to 0.66 PP m−3 (LA_11) during the rainy season (Table S2). PS concentrations were quantified at three sites only (OC_04; LA_05; LA_06) during the end of the dry season and at nine sites during the rainy season, with concentrations of up to 0.38 PS m−3 (LA_11) (Table S2). PE concentrations did not vary between seasons (Mann–Whitney test, p > 0.05) and ranged from an absence of PE particles until 0.15 PE m−3 (LA_14) and 0.19 PE m−3 (LA_11) during the end of the dry and rainy seasons, respectively (Table S2). Few particles of PVC, polyester, and polyamide were observed locally without significant variation during seasons (Mann–Whitney test, p > 0.05) (Table S2). The trends of these specific polymers during the rainy season indicate PP and PS microparticle inputs into the lagoon’s surface water. With consistently low fishing activity in Mayotte [27] and the lack of aquaculture, we exclude the possibility that the enhanced PP and PS microparticle inputs come from the fisheries’ activities themselves; rather, we suggest that they are due to the terrestrial activities on the island or the degradation of plastic litter deposited on beaches. Waste audits on recyclable waste or illegal dumping sites bordering the rivers are rare in Mayotte. The marine waste observatory, created by the Mayotte Marine Natural Park (French Biodiversity Office) in 2017, is in the process of consolidating data and establishing a data bank, which should provide interesting insights into local plastic litter hotspots and an understanding of the plastic dynamic from the land to the sea. Therefore, at this stage, is difficult to describe changes in microplastic polymer inputs to the lagoon during the rainy season.
3.2. Microplastic Size Distribution in the Lagoon Surface Water
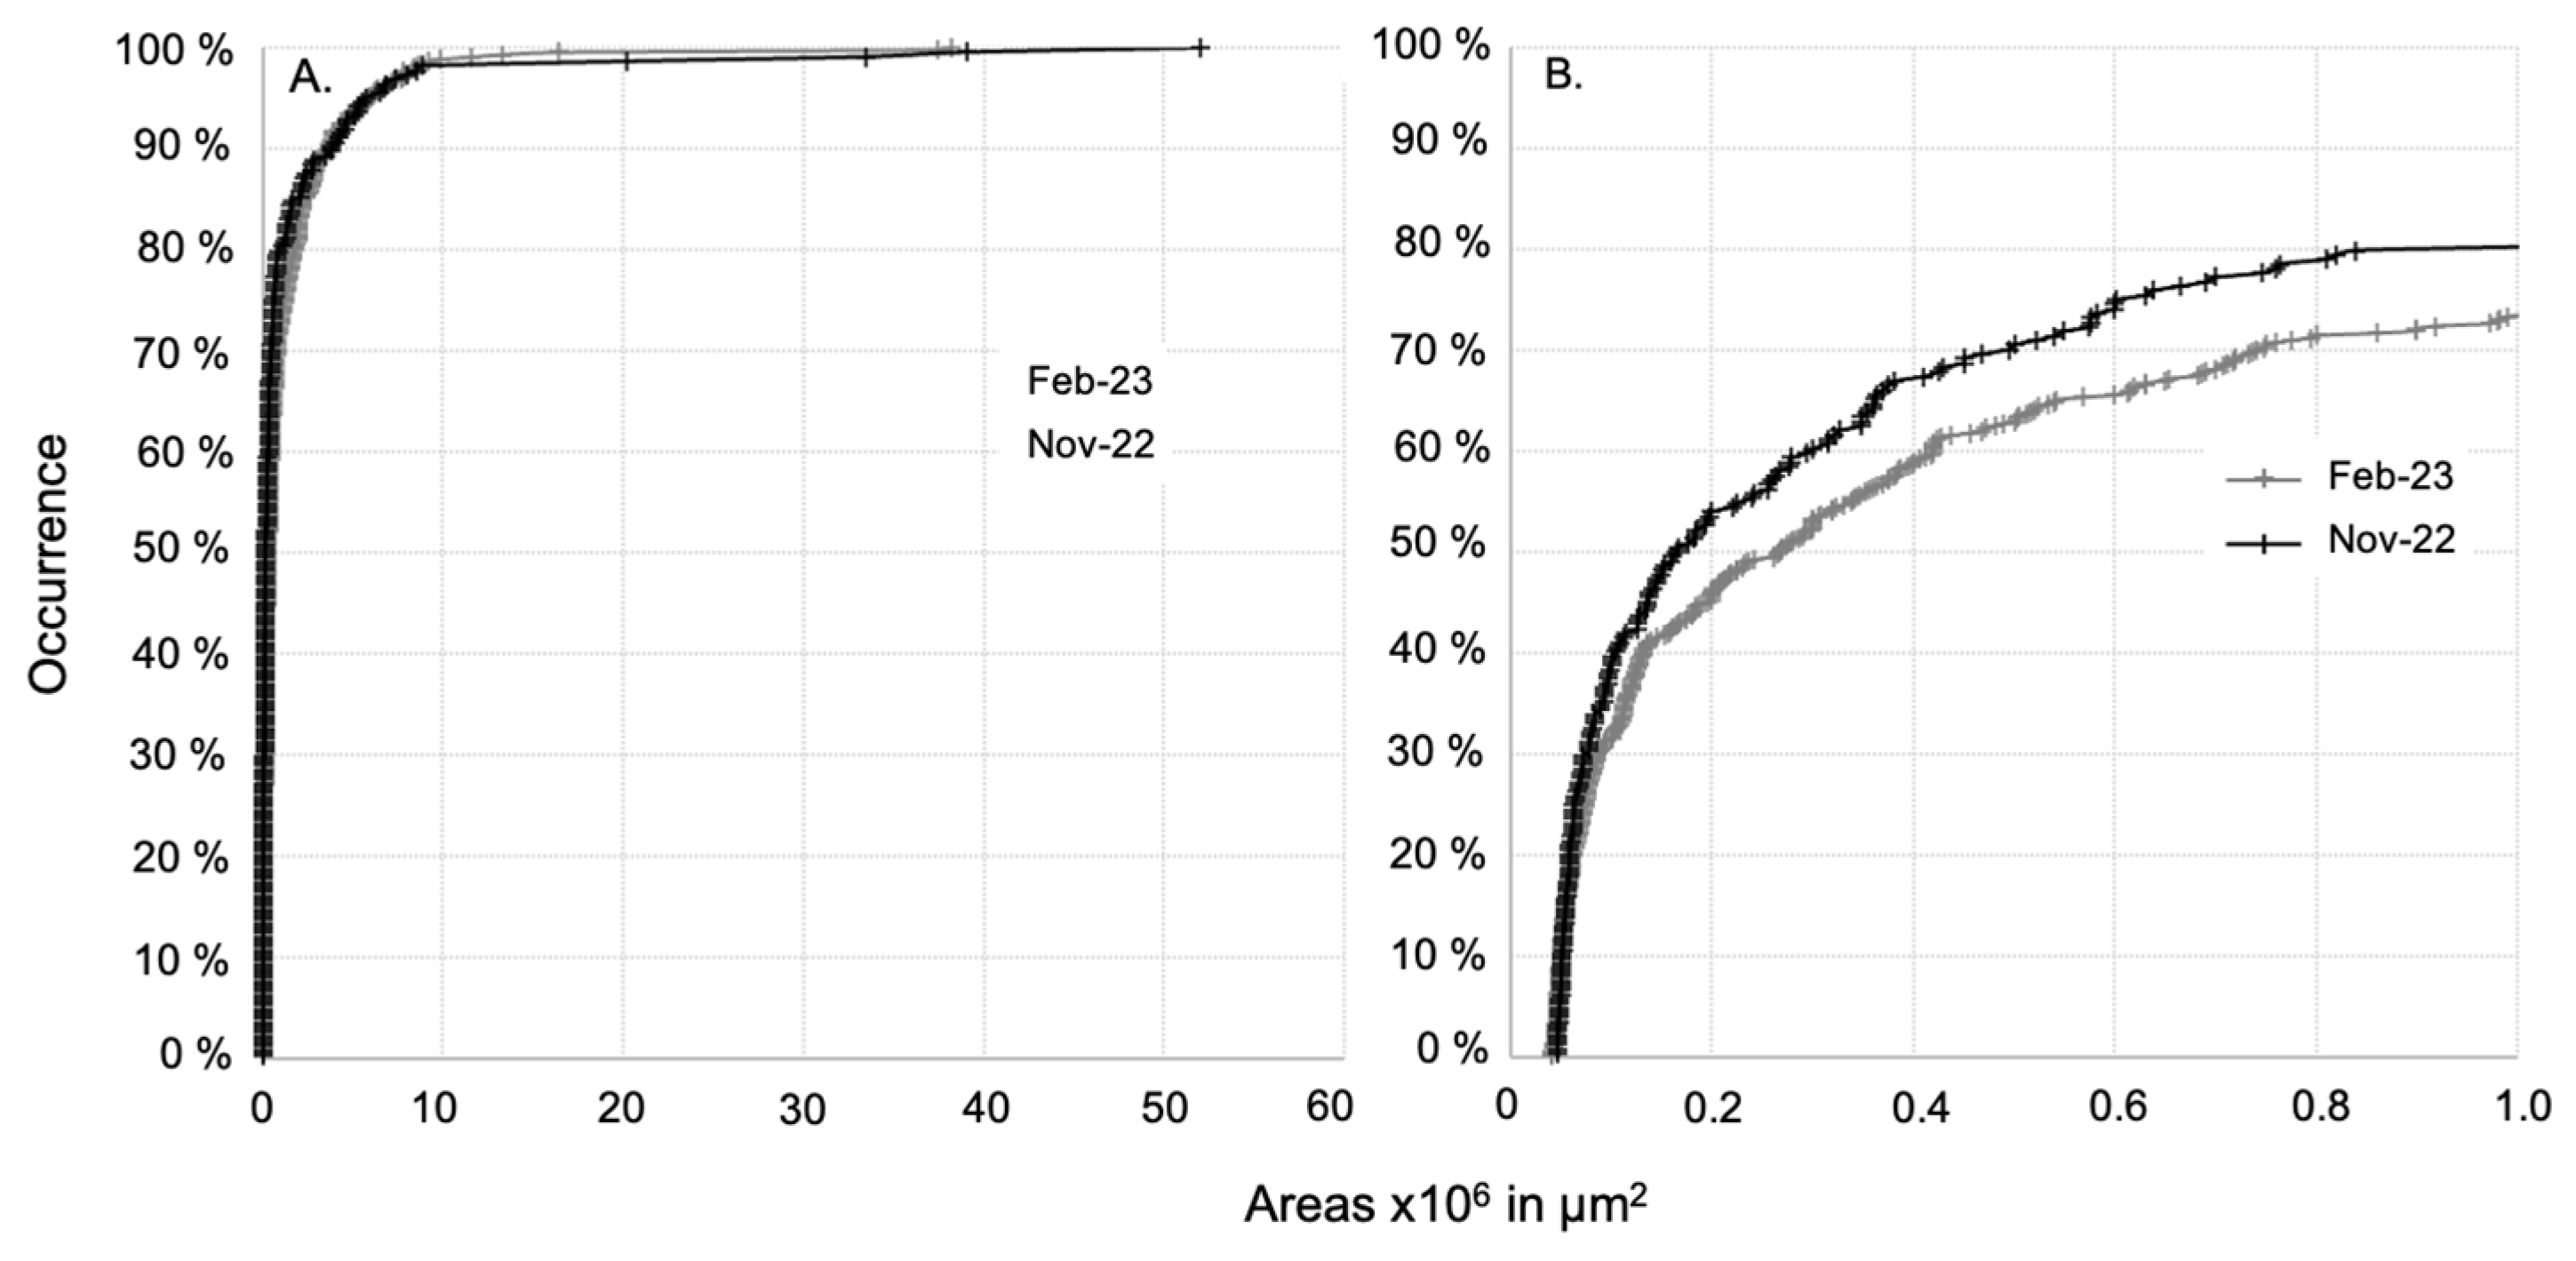
In comparison to the class size ranges usually seen in the literature, i.e., [300–1000 µm], [1000 µm–2000 µm], [2000–3000 µm], [3000–4000 µm], and [4000–5000 µm], 80% and 74% of the microplastics observed in the dry and rainy seasons, respectively, were in the [300–1000 µm] fraction, i.e., with sides of less than 1 mm * 1 mm (Figure 4). The microplastic particle area distribution was not significantly different between the end of the dry and the rainy periods (Mann–Whitney test, p > 0.5 on the whole dataset), as shown by their similar trends of seasonal area distribution with respect to occurrence (Figure 4). This observation suggests that similar area distributions were observed during both seasons and that the dynamic conditions in the surface water during both seasons are similar or do not affect the size distribution.

Figure 4.
(A) Size distribution of areas of microplastics with respect to their occurrence sampled at all Mayotte lagoon sites during the end of the dry and the rainy seasons. (B) Magnified view of the occurrence in the range of size distribution [45,000–1,000,000 µm2].
The median areas varied from 50,250 μm2 at OC_01 (2022-11) to 2,205,000 μm2 at LA_07 (2023-02) (Table 3). For each site, the microplastic particle size distributions in the two seasons were statistically compared, indicating an absence of seasonal variation (Mann–Whitney test, p > 0.5), except for at LA_02 (Mann–Whitney test, p = 0.02), where bigger particles were observed during the rainy season (without any specific hypothesis to support this exception). Despite enhanced microplastic concentrations in the surface water during the rainy season, the size distribution did not change. Looking more precisely at polymers, the size distributions of PP, PE, and PS particles were similar between the two seasons (Mann–Whitney test, p > 0.5 for PP, PE, and PS). During the rainy season, the enhanced PP and PS concentrations measured in the lagoon surface water have the same size distribution as the ones measured during the end of the dry season. Recent investigations using surface runoff plot experiments evidenced that small (<1 mm) and low-density plastic particles have greater mobility than larger and denser plastic particles in surface runoff [47,58] and that vegetation covers reduce their mobility [47]. Although those results depend on the type of soil, plastic size and density, and the parameters of the runoff simulation, it is interesting to note that the relationship between the size and type of polymers transported and rainfall and surface runoff does not appear to be random. A direct link cannot be made in our study as some sampling points were quite far from the coastline (Table S1), but the information is interesting to keep in mind when conceptualizing the transfer of microplastics from the island to the lagoon. The fact that we observed higher concentrations of PP and PS particles with similar size distributions than during the end of the dry season in the surface water of the lagoon highlight that although the process occurs during runoff and riverine inputs, particles of this size distribution floating in the lagoon surface water reached a state of equilibrium between floating and settling (which is linked to water turbulence) within a short period of time of at least less than 10 days (corresponding to the last important rainfall event before sampling in 2023-02).
Table 3.
The number of identified microplastics (Nb MPs) and the characteristics of their distribution in μm2: minimum, median, and maximum (nd: not determined).
3.3. Spatial Microplastic Distribution in Lagoon Surface Water: Effects of Season and Hydrodynamic Features
The concentrations of microplastics in the surface water of the Mayotte lagoon presented a variation of two orders of magnitude, ranging from 0.01 MP m−3 at LA_03 (Oct-22) to 1.23 MP m−3 at LA_11 (Feb-23) (Figure 2; Table 2). The sites with the highest concentrations differed between seasons (Figure 2; Table 2), and were not related to their proximity with urbanized and more populated areas in the island [59], like Petite Terre, like Mamoudzou, and the northeastern part of Grande Terre (Figure 1). Therefore, we refute the assumption that the proximity of an urbanized area drives an enhanced MP concentration distribution in the lagoon. Instead, we suggest that population density might be a means of identifying the sources of MPs infiltrating the environment (inland and in the lagoon) and that the local climate, including wind, and hydrodynamic features might play an important role in the distribution of the surface MP.
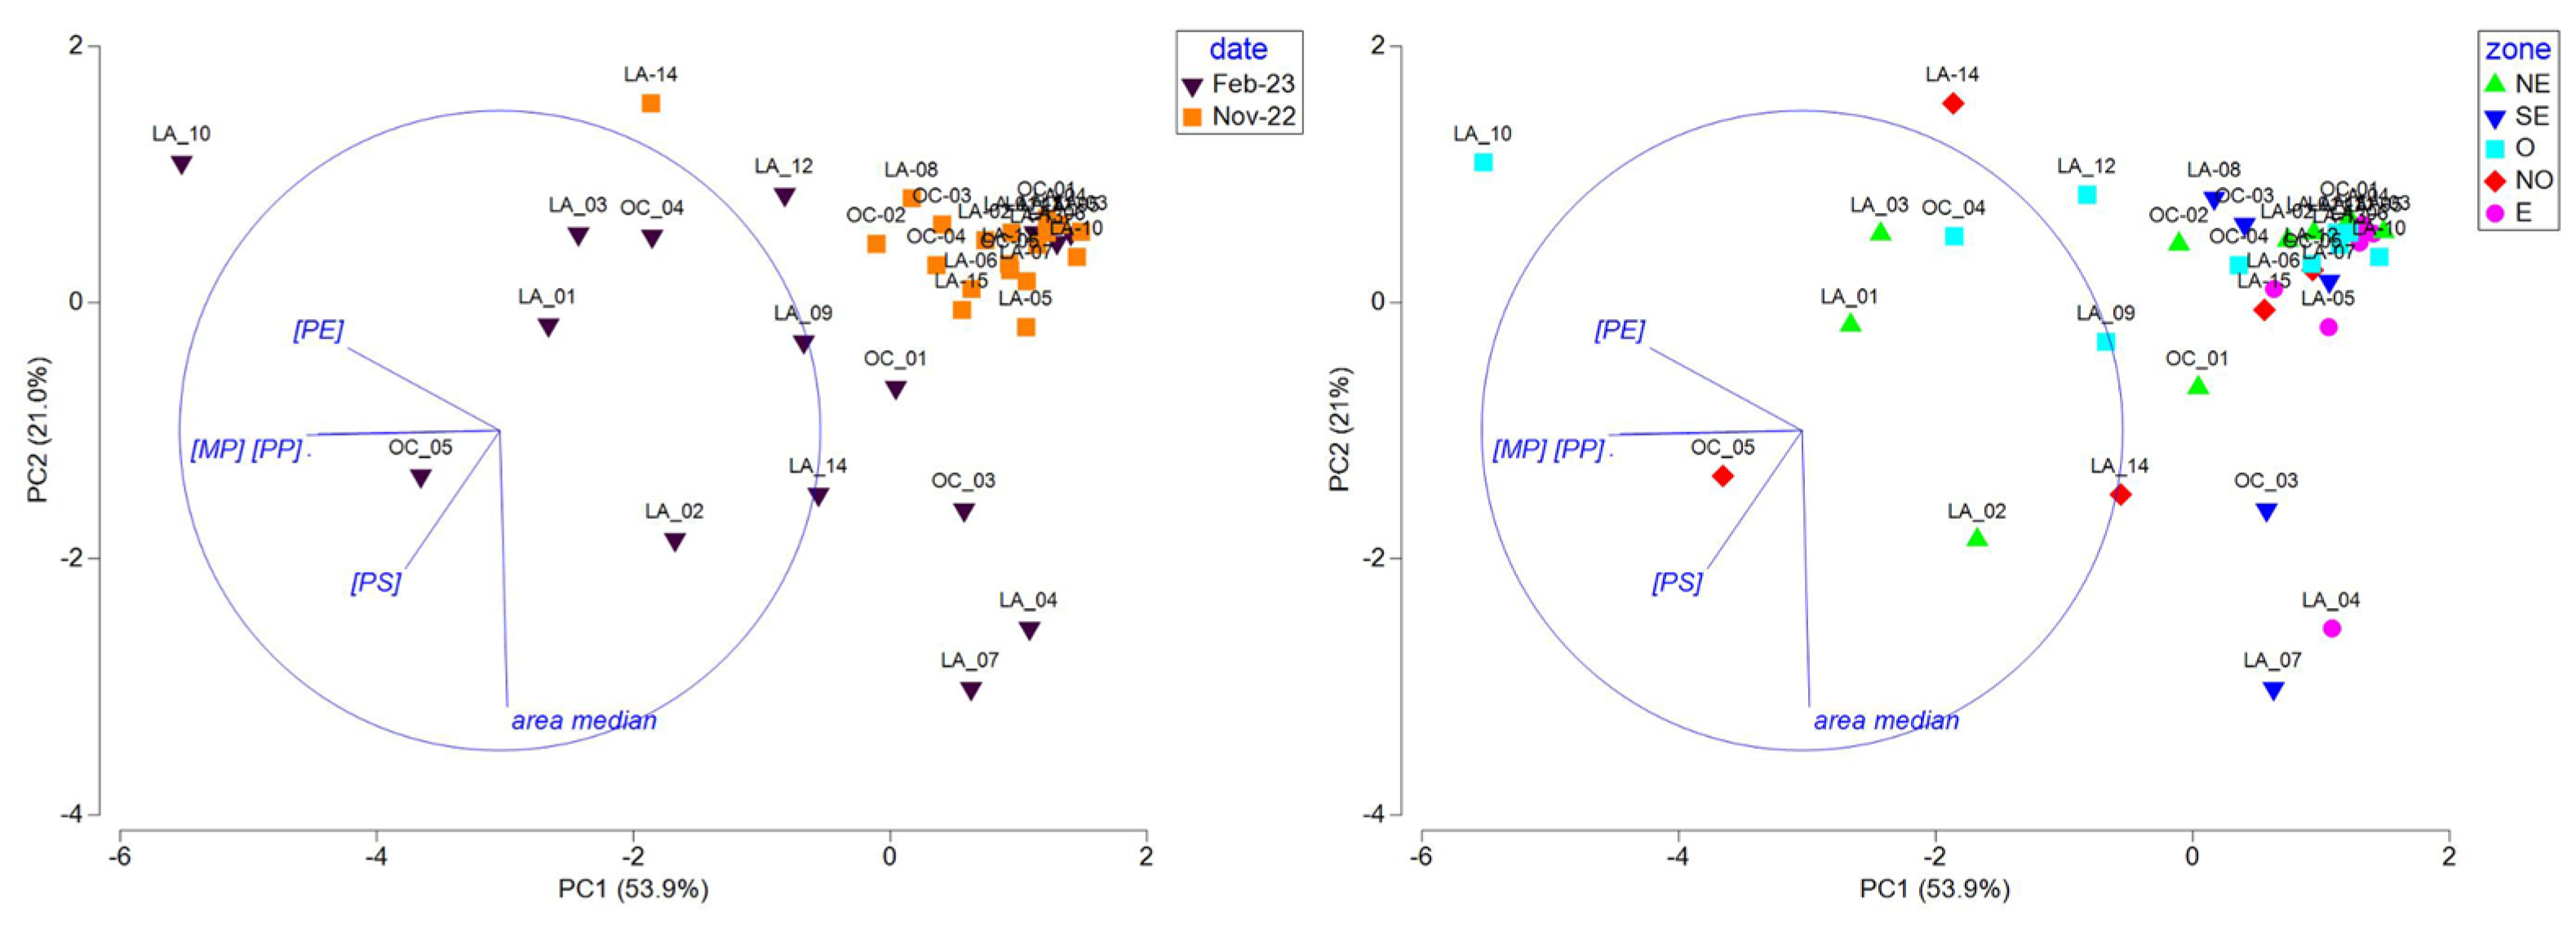
To deconvolute the roles of season, geographical zone, and hydrodynamic features (like origin of water masses and current intensity) on the observed concentrations of microplastics, PP, PE, and PS and on the median size distribution all along the lagoon, PCA was performed. At first, we investigated the site clustering over the entire dataset (Figure 5).
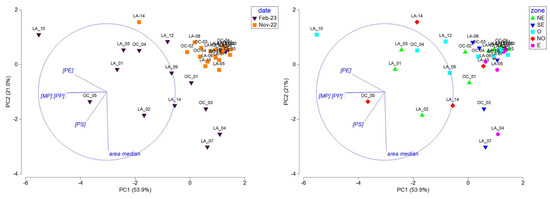
Figure 5.
PCA, including MPs (total MP concentration), PE, PP, and PS concentrations and median area data measured at all sites during the end of the dry season (2022-11) and the rainy (2023-02) season, represented by season (left) and geographical zone (right) (refer to Figure 3A,B; NE: northeast; SE: southeast; O: West; NO: northwest; and E: east).
The PCA was driven by the PP and MP concentrations on PC1 (54%) and the median area on PC2 (21%) and evidenced two different patterns based on season: a homogenous group of sampling sites during the end of the dry season (except for LA_14) characterized by low concentrations of microplastics comprising mostly small items (low median area) and sites presenting high disparity in concentration and median area during the rainy season. It also revealed that sites located in the east and southeast zones are gathered together and present low microplastic concentrations and variable median areas. The low concentrations observed during both seasons in those areas could be linked to the low population density in the southern and southeastern part of the Mayotte lagoon [59], but we cannot demonstrate this. At this stage, it is interesting to note that no correlation or clustering were observed, considering the water mass origin, i.e., lagoon, oceanic, or a mix of lagoon and ocean, the qualitative intensity of the currents determined with the CROCO hydrodynamical model, and the distance of the sampling sites to the adjacent coastline, i.e., distance categories of [0–2000 m], [2000–6000 m], and [>6000 m] (Table 1).
To deepen the specific features observed during the two seasons, PCAs were conducted with the same variables in separate seasons (Figure 6). During the end of the dry season, sites located in the east and west zones of the lagoon were negatively correlated or not correlated with PE, showing lower PE concentrations in those zones. Site clustering according to the water mass origin or current intensity were not observed. We thus hypothesized that the lower PE concentrations observed in the east and West areas are probably linked to local plastic use over the lagoon. During the rainy season, the PC1 axis (55%) was driven by the area and had an inverse relationship to the MP, PP, and PE concentrations and the PC2 (23.1%) to the PS concentrations. Interestingly, sites from the east and southeast zones were negatively correlated with PC1, showing fewer but larger microplastics, while sites from the west and northwest zones were highly variable in size and concentration and presented a correlation to the PS concentration for the NW zone. As for the end of the dry season, site clustering according to the water mass origin or current intensity was not observed during the rainy season.
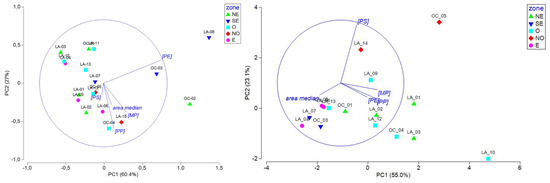
Figure 6.
PCA including MP, PE, PP, and PS concentrations and median particle area data measured during the end of the dry season (left) and during the rainy season (right), represented by geographical zone (refer to Figure 3A,B; NE: northeast; SE: southeast; O: west; NO: northwest; and E: east).
3.4. Microplastic Ecological Risk Assessment in Lagoon Surface Water
The ecological risks of microplastics in the surface water of the lagoon were assessed for each site and season using different indexes. The results are presented in Table 4 and Figure 7.
Table 4.
Risk assessment of microplastics: contamination factor (CFi); pollution load index (PLI) and corresponding risk level; polymer risk assessment index (H) and corresponding risk level; toxicity coefficient of microplastics (Ti); and potential ecological risk index (RI) and corresponding risk level (nd: not determined).

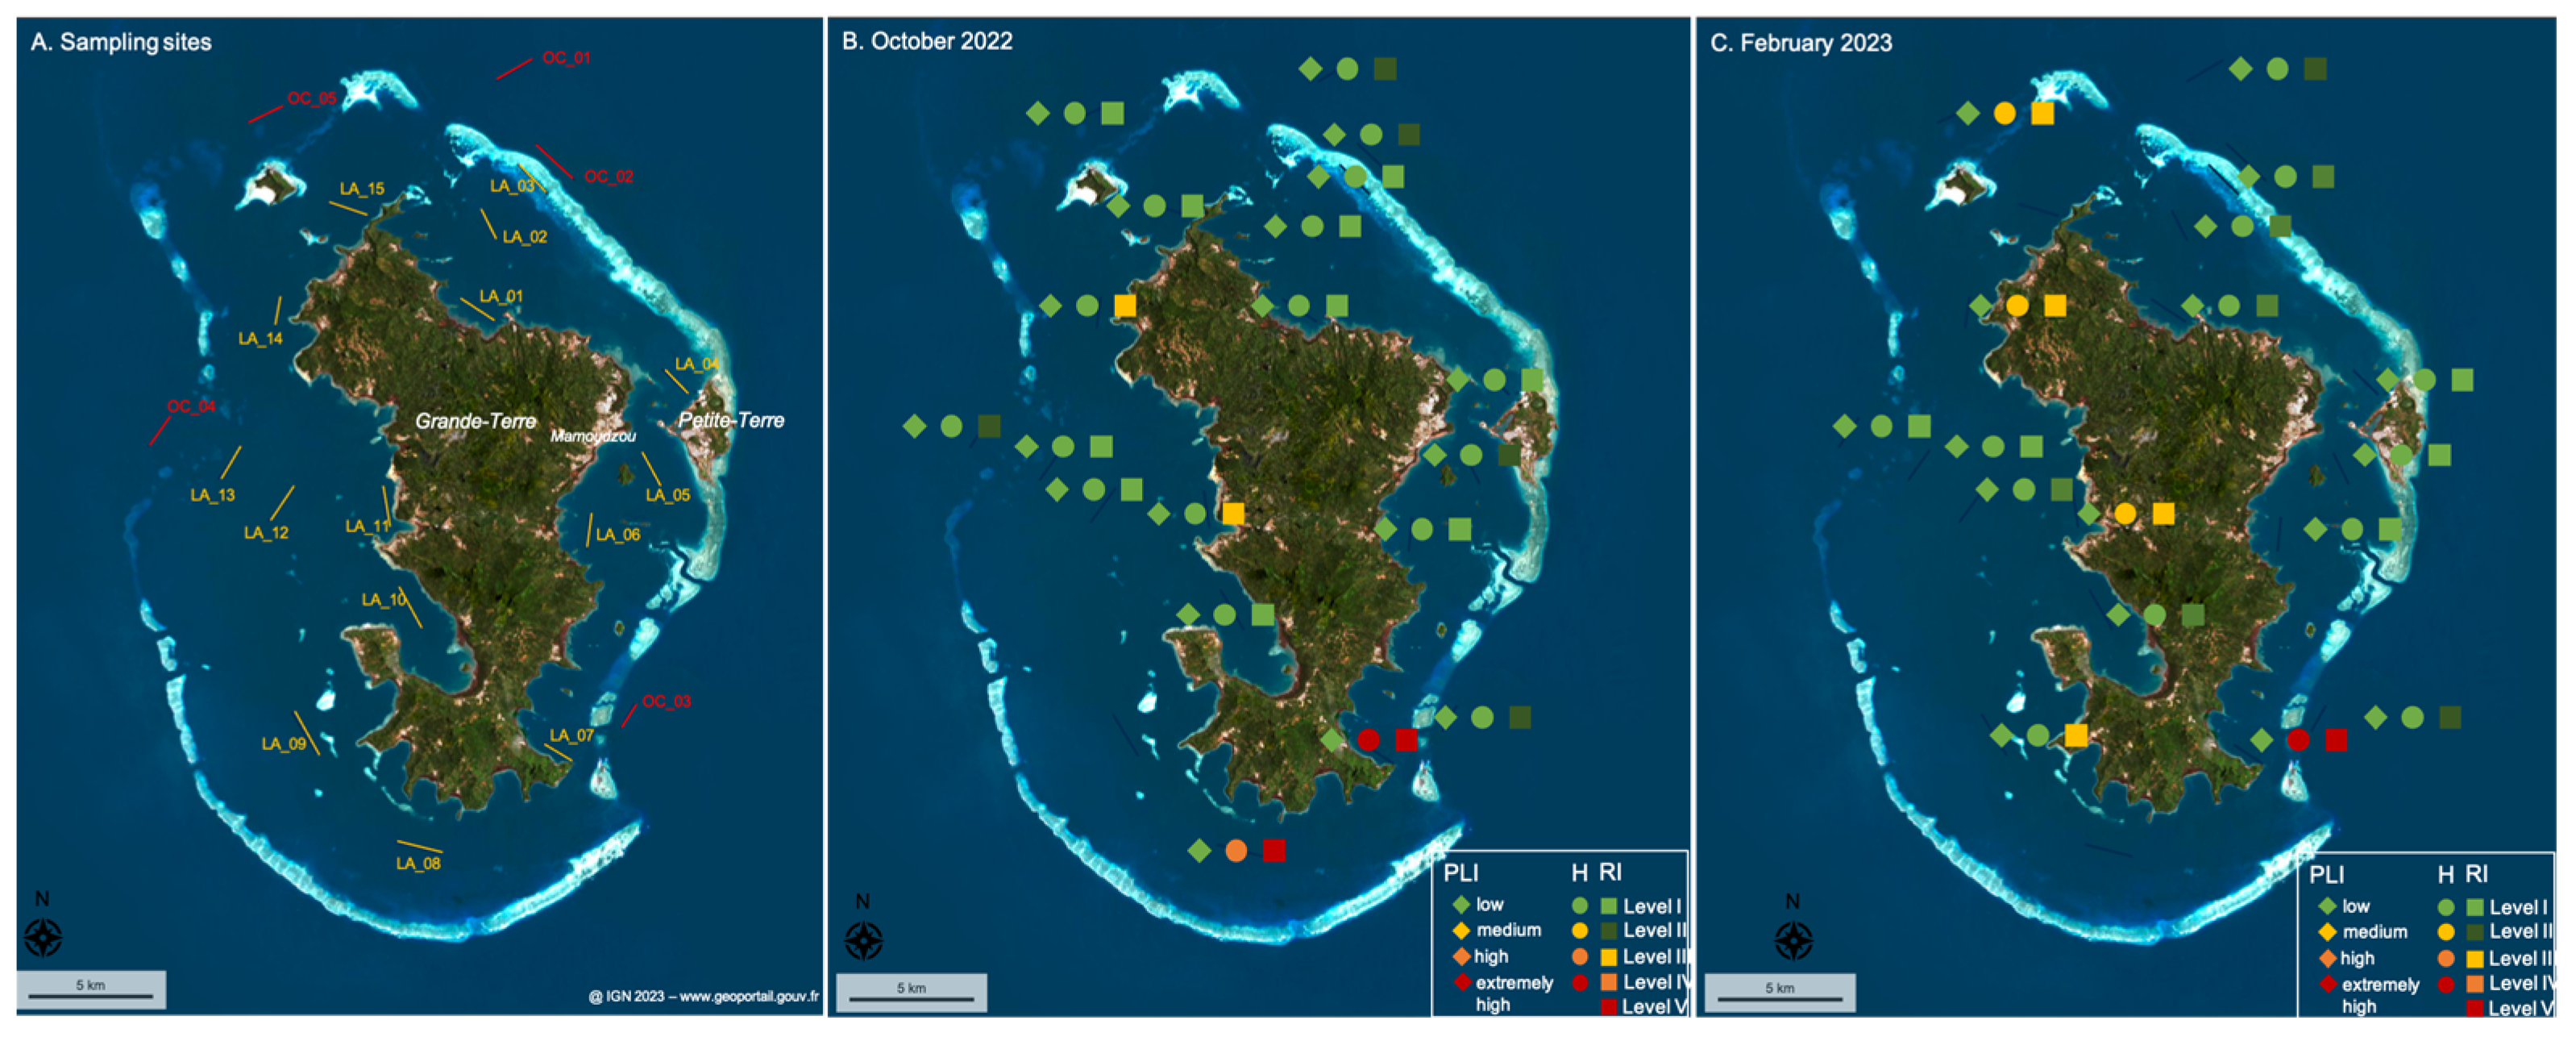
Figure 7.
(patial representation of three ecological risk indexes by their risk level: pollution load index (PLI), polymer risk assessment index (H), and potential ecological risk index (RI), determined at each site and season (A) in (B) October 2022 and (C) February 2023. Symbols and risk level are detailed in the legend.
The majority of sites evidenced low to medium levels of risk (e.g., Level I and Level II) during both seasons for the pollution load index (PLI), polymer risk index (H), and potential ecological risk index (RI)—except for the sites LA-11 and LA-14 during both seasons and the sites OC-05 and LA-09 during the rainy season only, which presented a high potential ecological risk (RI) level, and the sites LA-07 and LA-08, which showed high to extremely high polymer risk index (H) and potential ecological risk index (RI) values during both seasons (or just during the dry season for LA-08 as the MP concentration was not measured during the rainy season). This assessment demonstrates that the amount of microplastics in the surface water of the lagoon present a low risk for its environment, as all the pollution load indexes indicate a low level of risk. Rather than the amount, it is the type of polymers floating in the surface waters that create risk, as indicated by the presence of PVC and polyester microplastics at the sites LA-07 and LA-08, which induced high to extremely high polymer risk index (H) and potential ecological risk index (RI) values, and the abundance of PS particles at sites LA-11, LA-14, OC-05, and LA-09 which result in a high level of potential ecological risk (RI) (Figure 7). The levels of risk do not depend on urban pressure as the southern part of the island is less densely populated and the highest risk indexes were measured close to the coast (LA-07; LA-08) and even in a protected area (LA-07) of the lagoon, where fishing and recreational activities are limited (Figure 7). It is thus important to better identify the sources and means of transport of the polymer particles that present a high level of risk (e.g., PS, PVC, and polyester) in this part of the lagoon to limit threats to its biodiversity, especially in protected areas.
4. Conclusions
Microplastic concentrations and the type and size of polymers were assessed for the first time in the surface water of the Mayotte lagoon during contrasting seasons. Measurements evidenced that the MP concentrations were in the same range as those studied at other sites in the Western and Eastern Indian Ocean (with similar sampling methodologies and size ranges of observation) and were dominated by PP and PE polymers. During the rainy season, increased MP concentrations were measured, particularly concentrations of PP and PS particles, but their area distribution did not change compared to the end of the dry season, indicating that the equilibrium state is reached in a short period of time. The effects of an absence of geographical accumulation or depletion, water mass type (ocean versus lagoon), current intensity, and the distance of the sampling sites to the coast line on the spatial distribution of microplastics have been observed. The patterns suggest that the microplastics are well distributed and transported inside and outside the lagoon through the reef pass and that local hydrodynamics are a key aspect to understanding their fate, including flotation and settling, and their residence time in the lagoon. Efforts need to be made to characterize microplastic inputs from the island to the lagoon through rivers, including surface runoff; popular legal and illegal dumpsites; and atmospheric fallout. These characterizations, combined with an understanding of the plastic dynamics, are an important step in identifying geographical areas in which an MP assessment could be performed on surface sediment and biota (including corals, ichtyofauna, and bivalves). An adapted ecological risk assessment of microplastics in the habitats of the Mayotte lagoon and its biodiversity could then be performed in order to initiate local action to reduce those risks.
Supplementary Materials
The following supporting information can be downloaded at https://www.mdpi.com/article/10.3390/microplastics4020031/s1, Table S1: Environmental characteristics of sampling sites during end of dry and rainy seasons: date and GPS position of beginning and end of trawling, volume of water sampled in m3, type of water sampled determined with CROCO hydrodynamical model and looking at hourly water mass dynamics and distance to coastline; Table S2: Total microplastic concentrations (MP m−3) measured at 20 sites during end of dry and rainy seasons and identified polymer concentrations: PP m−3, PE m−3, PS m−3, PVC m−3, polyester m−3, and polyamide m−3 (nd: not determined).
Author Contributions
Conceptualization, E.S., C.C., D.D., C.L., M.L. and C.C.; methodology, E.S., D.D., C.L. and C.C.; formal analysis, M.P. and E.S.; investigation, E.S., J.G., D.D., M.P., N.N.P., S.R., C.L., M.L. and C.C.; writing—original draft preparation, E.S.; writing—review and editing, E.S., J.G., D.D. and C.C.; visualization, E.S.; funding acquisition, E.S., M.L. and C.C. All authors have read and agreed to the published version of the manuscript.
Funding
This research was funded by an OFB grant under the PLASMA project and an IRD-MIO Actions Sud 2022 incentive grant.
Institutional Review Board Statement
Not applicable.
Informed Consent Statement
Not applicable.
Data Availability Statement
Data is contained within the article or supplementary material.
Acknowledgments
The authors would like to acknowledge the students and teachers who participated in the field trips, as well as the boat captains.
Conflicts of Interest
The authors declare no conflicts of interest.
Abbreviations
The following abbreviations are used in this manuscript:
| MP | Microplastics |
| µFTIR | Micro-Fourier-transform infrared spectroscopy |
| PE | Polyethylene |
| PP | Polypropylene |
| PET | Polyethylene terephthalate |
| PS | Polystyrene |
| PA | Polyamide |
| PVC | Polyvinyl chloride |
| PC | Polycarbonate |
| EVA | Ethylene-vinyl acetate |
| PCA | Principal component analysis |
References
- Frias, J.P.G.L.; Nash, R. Microplastics: Finding a Consensus on the Definition. Mar. Pollut. Bull. 2019, 138, 145–147. [Google Scholar] [CrossRef] [PubMed]
- Zhang, Y.; Gao, T.; Kang, S.; Shi, H.; Mai, L.; Allen, D.; Allen, S. Current Status and Future Perspectives of Microplastic Pollution in Typical Cryospheric Regions. Earth-Sci. Rev. 2022, 226, 103924. [Google Scholar] [CrossRef]
- Gao, S.; Orlowski, N.; Bopf, F.K.; Breuer, L. A Review on Microplastics in Major European Rivers. WIREs Water 2024, 11, e1713. [Google Scholar] [CrossRef]
- Phuong, N.N.; Duong, T.T.; Le, T.P.Q.; Hoang, T.K.; Ngo, H.M.; Phuong, N.A.; Pham, Q.T.; Doan, T.O.; Ho, T.C.; Da Le, N.; et al. Microplastics in Asian Freshwater Ecosystems: Current Knowledge and Perspectives. Sci. Total Environ. 2022, 808, 151989. [Google Scholar] [CrossRef]
- Zhu, J.; Dong, G.; Feng, F.; Ye, J.; Liao, C.-H.; Wu, C.-H.; Chen, S.-C. Microplastics in the Soil Environment: Focusing on the Sources, Its Transformation and Change in Morphology. Sci. Total Environ. 2023, 896, 165291. [Google Scholar] [CrossRef] [PubMed]
- Pinheiro, M.; Martins, I.; Raimundo, J.; Caetano, M.; Neuparth, T.; Santos, M.M. Stressors of Emerging Concern in Deep-Sea Environments: Microplastics, Pharmaceuticals, Personal Care Products and Deep-Sea Mining. Sci. Total Environ. 2023, 876, 162557. [Google Scholar] [CrossRef]
- Sharma, S.; Bhardwaj, A.; Thakur, M.; Saini, A. Understanding Microplastic Pollution of Marine Ecosystem: A Review. Environ. Sci. Pollut. Res. 2023, 31, 41402–41445. [Google Scholar] [CrossRef] [PubMed]
- Shao, L.; Li, Y.; Jones, T.; Santosh, M.; Liu, P.; Zhang, M.; Xu, L.; Li, W.; Lu, J.; Yang, C.-X.; et al. Airborne Microplastics: A Review of Current Perspectives and Environmental Implications. J. Clean. Prod. 2022, 347, 131048. [Google Scholar] [CrossRef]
- Truong, T.-N.-S.; Strady, E.; Kieu-Le, T.-C.; Tran, Q.-V.; Le, T.-M.-T.; Thuong, Q.-T. Microplastic in Atmospheric Fallouts of a Developing Southeast Asian Megacity under Tropical Climate. Chemosphere 2021, 272, 129874. [Google Scholar] [CrossRef]
- Wang, C.; O’Connor, D.; Wang, L.; Wu, W.-M.; Luo, J.; Hou, D. Microplastics in Urban Runoff: Global Occurrence and Fate. Water Res. 2022, 225, 119129. [Google Scholar] [CrossRef]
- Guo, J.-J.; Huang, X.-P.; Xiang, L.; Wang, Y.-Z.; Li, Y.-W.; Li, H.; Cai, Q.-Y.; Mo, C.-H.; Wong, M.-H. Source, Migration and Toxicology of Microplastics in Soil. Environ. Int. 2020, 137, 105263. [Google Scholar] [CrossRef] [PubMed]
- Waldschläger, K.; Born, M.; Cowger, W.; Gray, A.; Schüttrumpf, H. Settling and Rising Velocities of Environmentally Weathered Micro- and Macroplastic Particles. Environ. Res. 2020, 191, 110192. [Google Scholar] [CrossRef]
- Iqbal, B.; Zhao, T.; Yin, W.; Zhao, X.; Xie, Q.; Khan, K.Y.; Zhao, X.; Nazar, M.; Li, G.; Du, D. Impacts of Soil Microplastics on Crops: A Review. Appl. Soil Ecol. 2023, 181, 104680. [Google Scholar] [CrossRef]
- Kalčíková, G. Beyond Ingestion: Adhesion of Microplastics to Aquatic Organisms. Aquat. Toxicol. 2023, 258, 106480. [Google Scholar] [CrossRef] [PubMed]
- Parolini, M.; Stucchi, M.; Ambrosini, R.; Romano, A. A Global Perspective on Microplastic Bioaccumulation in Marine Organisms. Ecol. Indic. 2023, 149, 110179. [Google Scholar] [CrossRef]
- Doyle, D.; Sundh, H.; Almroth, B.C. Microplastic Exposure in Aquatic Invertebrates Can Cause Significant Negative Effects Compared to Natural Particles—A Meta-Analysis. Environ. Pollut. 2022, 315, 120434. [Google Scholar] [CrossRef]
- Wang, C.; Zhao, J.; Xing, B. Environmental Source, Fate, and Toxicity of Microplastics. J. Hazard. Mater. 2021, 407, 124357. [Google Scholar] [CrossRef]
- Prata, J.C.; da Costa, J.P.; Lopes, I.; Duarte, A.C.; Rocha-Santos, T. Environmental Exposure to Microplastics: An Overview on Possible Human Health Effects. Sci. Total Environ. 2020, 702, 134455. [Google Scholar] [CrossRef]
- Prata, J.C. Microplastics and Human Health: Integrating Pharmacokinetics. Crit. Rev. Environ. Sci. Technol. 2023, 53, 1489–1511. [Google Scholar] [CrossRef]
- Owens, E.L.; Zhang, Q.; Mihelcic, J.R. Material Flow Analysis Applied to Household Solid Waste and Marine Litter on a Small Island Developing State. J. Environ. Eng. 2011, 137, 937–944. [Google Scholar] [CrossRef]
- Guillotreau, P.; Antoine, S.; Kante, F.; Perchat, K. Quantifying Plastic Use and Waste Footprints in SIDS: Application to Seychelles. J. Clean. Prod. 2023, 417, 138018. [Google Scholar] [CrossRef]
- Singh, S.J.; Elgie, A.; Noll, D.; Eckelman, M.J. The Challenge of Solid Waste on Small Islands: Proposing a Socio-Metabolic Research (SMR) Framework. Curr. Opin. Environ. Sustain. 2023, 62, 101274. [Google Scholar] [CrossRef]
- Burt, A.J.; Raguain, J.; Sanchez, C.; Brice, J.; Fleischer-Dogley, F.; Goldberg, R.; Talma, S.; Syposz, M.; Mahony, J.; Letori, J.; et al. The Costs of Removing the Unsanctioned Import of Marine Plastic Litter to Small Island States. Sci. Rep. 2020, 10, 14458. [Google Scholar] [CrossRef]
- Onyena, A.P.; Aniche, D.C.; Ogbolu, B.O.; Rakib, M.R.J.; Uddin, J.; Walker, T.R. Governance Strategies for Mitigating Microplastic Pollution in the Marine Environment: A Review. Microplastics 2022, 1, 15–46. [Google Scholar] [CrossRef]
- Mulochau, T.; Lelabousse, C.; Séré, M. Estimations of Densities of Marine Litter on the Fringing Reefs of Mayotte (France—South Western Indian Ocean)—Impacts on Coral Communities. Mar. Pollut. Bull. 2020, 160, 111643. [Google Scholar] [CrossRef] [PubMed]
- Li, W.C.; Tse, H.F.; Fok, L. Plastic Waste in the Marine Environment: A Review of Sources, Occurrence and Effects. Sci. Total Environ. 2016, 566–567, 333–349. [Google Scholar] [CrossRef]
- Ifremer Système d’Informations Halieutiques. Quartier Maritime Dzaoudzi. 2021. Activité Des Navires de Pêche; 2022. Available online: https://archimer.ifremer.fr/doc/00874/98578/ (accessed on 25 April 2025).
- INSEE. À Mayotte, Un Recensement Adapté à Une Population Aux Évolutions Hors Normes; 2023. Available online: https://www.insee.fr/fr/information/6687468 (accessed on 25 April 2025).
- Foucher, A.; Evrard, O.; Rabiet, L.; Cerdan, O.; Landemaine, V.; Vitter, M.; Desprats, J.-F. Impact of Rapid Deforestation and Conversion of Traditional Agricultural Practices into Food Crop Production on Land and Water Degradation: A Case Study from Mayotte Island, Indian Ocean, France (2011–2022). In Proceedings of the Copernicus Meetings, Brussels, Belgium, 5–9 June 2023. [Google Scholar]
- Gourbesville, P.; Thomassin, B.A. Coastal Environment Assessment Procedure for Sustainable Wastewater Management in Tropical Islands: The Mayotte Example. Ocean Coast. Manag. 2000, 43, 997–1014. [Google Scholar] [CrossRef]
- Nicolle, P.; Lebecherel, L.; Perrin, C.; Delaigue, O. Détermination de Valeurs Seuils Sécheresse Pour Les Eaux de Surface Du Département de Mayotte—Rapport Final. IRSTEA <hal.Inrae.Fr/Hal-02606202>; 2016; 95p. Available online: https://www.inrae.fr/ (accessed on 25 April 2025).
- Trégarot, E.; Failler, P.; Maréchal, J.-P. Evaluation of Coastal and Marine Ecosystem Services of Mayotte: Indirect Use Values of Coral Reefs and Associated Ecosystems. Int. J. Biodivers. Sci. Ecosyst. Serv. Manag. 2017, 13, 19–34. [Google Scholar] [CrossRef]
- Schott, F.A.; McCreary, J.P. The Monsoon Circulation of the Indian Ocean. Prog. Oceanogr. 2001, 51, 1–123. [Google Scholar] [CrossRef]
- Chevalier, C.; Devenon, J.L.; Pagano, M.; Rougier, G.; Blanchot, J.; Arfi, R. The Atypical Hydrodynamics of the Mayotte Lagoon (Indian Ocean): Effects on Water Age and Potential Impact on Plankton Productivity. Estuar. Coast. Shelf Sci. 2017, 196, 182–197. [Google Scholar] [CrossRef]
- GESAMP. Guidelines or the Monitoring and Assessment of Plastic Litter and Microplastics in the Ocean; IMO/FAO/UNESCO-IOC/UNIDO/WMO/IAEA/UN/UNEP/UNDP/ISA Joint Group of Experts on the Scientific Aspects of Marine Environmental Protection; GESAMP: Paris, France, 2019; p. 130. [Google Scholar]
- Strady, E.; Dang, T.H.; Dao, T.D.; Dinh, H.N.; Do, T.T.D.; Duong, T.N.; Duong, T.T.; Hoang, D.A.; Kieu-Le, T.C.; Le, T.P.Q.; et al. Baseline Assessment of Microplastic Concentrations in Marine and Freshwater Environments of a Developing Southeast Asian Country, Viet Nam. Mar. Pollut. Bull. 2021, 162, 111870. [Google Scholar] [CrossRef] [PubMed]
- Dehaut, A.; Hermabessiere, L.; Duflos, G. Current Frontiers and Recommendations for the Study of Microplastics in Seafood. TrAC Trends Anal. Chem. 2019, 116, 346–359. [Google Scholar] [CrossRef]
- Shabaka, S.; Moawad, M.N.; Ibrahim, M.I.A.; El-Sayed, A.A.M.; Ghobashy, M.M.; Hamouda, A.Z.; El-Alfy, M.A.; Darwish, D.H.; Youssef, N.A.E. Prevalence and Risk Assessment of Microplastics in the Nile Delta Estuaries: “The Plastic Nile” Revisited. Sci. Total Environ. 2022, 852, 158446. [Google Scholar] [CrossRef] [PubMed]
- Kosore, C.M.; Ojwang, L.; Maghanga, J.; Kamau, J.; Shilla, D.; Everaert, G.; Khan, F.R.; Shashoua, Y. Microplastics in Kenya’s Marine Nearshore Surface Waters: Current Status. Mar. Pollut. Bull. 2022, 179, 113710. [Google Scholar] [CrossRef]
- Lithner, D.; Larsson, Å.; Dave, G. Environmental and Health Hazard Ranking and Assessment of Plastic Polymers Based on Chemical Composition. Sci. Total Environ. 2011, 409, 3309–3324. [Google Scholar] [CrossRef]
- Nchimbi, A.A.; Kosore, C.M.; Oduor, N.; Shilla, D.J.; Shashoua, Y.; Khan, F.R.; Shilla, D.A. Microplastics in Marine Nearshore Surface Waters of Dar Es Salaam and Zanzibar, East Africa. Bull. Environ. Contam. Toxicol. 2022, 109, 1037–1042. [Google Scholar] [CrossRef]
- Hildebrandt, L.; El Gareb, F.; Zimmermann, T.; Klein, O.; Kerstan, A.; Emeis, K.-C.; Pröfrock, D. Spatial Distribution of Microplastics in the Tropical Indian Ocean Based on Laser Direct Infrared Imaging and Microwave-Assisted Matrix Digestion. Environ. Pollut. 2022, 307, 119547. [Google Scholar] [CrossRef]
- Baek, E.-R.; Kim, M.; Kang, D.-J.; Kang, J.-H. Distribution Characteristics of Microplastics in the Surface Mixed Layer of the Western Indian Ocean. Deep Sea Res. Part II Top. Stud. Oceanogr. 2024, 218, 105424. [Google Scholar] [CrossRef]
- Saliu, F.; Montano, S.; Garavaglia, M.G.; Lasagni, M.; Seveso, D.; Galli, P. Microplastic and Charred Microplastic in the Faafu Atoll, Maldives. Mar. Pollut. Bull. 2018, 136, 464–471. [Google Scholar] [CrossRef]
- Grangeon, T.; Cerdan, O.; Landemaine, V.; Vandromme, R.; Desprats, J.-F.; Salvador-Blanes, S.; Vanhooydonck, P.; Gaillot, A.; Maniere, L.; Pene-Galland, I.; et al. Les Observatoires Du Ruissellement: Comprendre Les Processus Pour Améliorer Les Modélisations. Houille Blanche 2020, 106, 7–16. [Google Scholar] [CrossRef]
- Vacelet, E.; Arnoux, A.; Thomassin, B.A.; Travers, M. Influence of Freshwater and Terrigenous Material on Nutrients, Bacteria and Phytoplankton in a High Island Lagoon: Mayotte, Comoro Archipelago, Indian Ocean. Hydrobiologia 1998, 380, 165–178. [Google Scholar] [CrossRef]
- Han, N.; Zhao, Q.; Ao, H.; Hu, H.; Wu, C. Horizontal Transport of Macro- and Microplastics on Soil Surface by Rainfall Induced Surface Runoff as Affected by Vegetations. Sci. Total Environ. 2022, 831, 154989. [Google Scholar] [CrossRef]
- SIDEVAM 976. Syndicat Intercommunal d’Elimination et de Valorisation Des Déchets de Mayotte; Rapport d’activité 2020; 2022. Available online: https://www.ccomptes.fr/fr/publications/syndicat-intercommunal-delimination-et-de-valorisation-des-dechets-de-mayotte-2 (accessed on 25 April 2025).
- Lahon, J.; Handique, S. Impact of Flooding on Microplastic Abundance and Distribution in Freshwater Environment: A Review. Environ. Sci. Pollut. Res. 2023, 30, 118175–118191. [Google Scholar] [CrossRef]
- Gündoğdu, S.; Çevik, C.; Ayat, B.; Aydoğan, B.; Karaca, S. How Microplastics Quantities Increase with Flood Events? An Example from Mersin Bay NE Levantine Coast of Turkey. Environ. Pollut. 2018, 239, 342–350. [Google Scholar] [CrossRef]
- James, K.; Kripa, V.; Padua, S.; Vineetha, G.; Parvathy, R. Influence of Precipitation and Currents on the Inter and Intra-Annual Fluctuation in the Distribution of Microplastics in the Coastal Environment of Kochi, Eastern Arabian Sea, Southwest Coast of India. Reg. Stud. Mar. Sci. 2025, 81, 103999. [Google Scholar] [CrossRef]
- Xia, W.; Rao, Q.; Deng, X.; Chen, J.; Xie, P. Rainfall Is a Significant Environmental Factor of Microplastic Pollution in Inland Waters. Sci. Total Environ. 2020, 732, 139065. [Google Scholar] [CrossRef]
- Felton, A.; Farner, S.; Day, L.; Gibbs-Huerta, S.E.; Zamarripa, B.; Hutchinson, J. Spatial–Temporal Characterization of Microplastics in the Surface Water of an Urban Ephemeral River. Microplastics 2025, 4, 9. [Google Scholar] [CrossRef]
- Li, C.; Wang, X.; Liu, K.; Zhu, L.; Wei, N.; Zong, C.; Li, D. Pelagic Microplastics in Surface Water of the Eastern Indian Ocean during Monsoon Transition Period: Abundance, Distribution, and Characteristics. Sci. Total Environ. 2021, 755, 142629. [Google Scholar] [CrossRef]
- Naidu, S.A.; Mawii, L.; Ranga Rao, V.; Anitha, G.; Mishra, P.; Narayanaswamy, B.E.; Anil Kumar, V.; Ramana Murthy, M.V.; Gvm, G. Characterization of Plastic Debris from Surface Waters of the Eastern Arabian Sea–Indian Ocean. Mar. Pollut. Bull. 2021, 169, 112468. [Google Scholar] [CrossRef]
- Nikhil, V.G.; Ranjeet, K.; Varghese, G.K. Spatio-Temporal Evaluation and Risk Assessment of Microplastics in Nearshore Surface Waters Post-2018 Kerala Deluge along the Southwest Coast of India. Mar. Pollut. Bull. 2023, 192, 115058. [Google Scholar] [CrossRef]
- Prata, J.C.; da Costa, J.P.; Duarte, A.C.; Rocha-Santos, T. Methods for Sampling and Detection of Microplastics in Water and Sediment: A Critical Review. TrAC Trends Anal. Chem. 2019, 110, 150–159. [Google Scholar] [CrossRef]
- Rehm, R.; Zeyer, T.; Schmidt, A.; Fiener, P. Soil Erosion as Transport Pathway of Microplastic from Agriculture Soils to Aquatic Ecosystems. Sci. Total Environ. 2021, 795, 148774. [Google Scholar] [CrossRef] [PubMed]
- INSEE. 2017 INSEE Analyses N15: 256 500 Habitants à Mayotte En 2017. Available online: https://www.Insee.Fr/Fr/Statistiques/3284395?Sommaire=4199393#consulter (accessed on 25 April 2025).


Disclaimer/Publisher’s Note: The statements, opinions and data contained in all publications are solely those of the individual author(s) and contributor(s) and not of MDPI and/or the editor(s). MDPI and/or the editor(s) disclaim responsibility for any injury to people or property resulting from any ideas, methods, instructions or products referred to in the content. |
© 2025 by the authors. Licensee MDPI, Basel, Switzerland. This article is an open access article distributed under the terms and conditions of the Creative Commons Attribution (CC BY) license (https://creativecommons.org/licenses/by/4.0/).