Article

Interactions of Potential Anticancer Drug 4-chloro-6-(1H-imidazo[4,5-b]phenazine-2-yl)benzene-1,3-diol with Supercoiled and Linear Plasmid DNAs


by
Dominika Janiszek
1,
Anna Banasiak
1,†,
Monika M. Karpinska
2,
Andrzej Niewiadomy
2,3,
Agnieszka Girstun
4,
Hanna Elzanowska
1,*,
Magdalena Maj-Zurawska
1 and
Pawel J. Kulesza
1,*
1
Faculty of Chemistry, University of Warsaw, Pasteura 1, 02-093 Warsaw, Poland
2
Department of Chemistry and Biology, Institute of Industrial Organic Chemistry, Łukasiewicz Research Network, Annopol 6, 03-236 Warsaw, Poland
3
Department of Chemistry, University of Life Sciences in Lublin, Akademicka 13, 20-950 Lublin, Poland
4
Faculty of Biology, University of Warsaw, Miecznikowa 1, 02-096 Warsaw, Poland
*
Authors to whom correspondence should be addressed.
Present Address: School of Chemistry, Dublin Institute of Technology (DIT), Kevin Street Dublin 8, Ireland.
Submission received: 1 July 2025 / Revised: 30 September 2025 / Accepted: 27 January 2026 / Published: 3 June 2026

Abstract

Introduction: Does DNA superhelicity effect nucleic acid interactions with drugs? To test such a possibility, the interactions of the linear and superhelical forms of the pGEX-4T-2 plasmid have been investigated with a newly synthesized compound, 4-chloro-6-(1H-imidazo [4,5-b]phenazine-2-yl)benzene-1,3-diol, positively tested for the antiproliferative (cell growth-limiting) properties, important for the development of anticancer drugs. Methods: The accumulation of the compound, and its possible reorientation (phase transition) within the plasmid layer adsorbed on a Glassy Carbon (GC) electrode has been monitored in 5 min. intervals using alternatively two voltammetric methods—Differential Pulse (DP), showing redox properties and—Alternating Current (AC), reflecting both redox and structural properties (capacity/resistance change related to DNA condensation) of the DNA-drug layers. Results and Discussion: The accumulation plots of the compound in plasmid layers are different for superhelical and linear pGEX-4T-2 and also depend on the DNA coverage by the compound. The reorientation (phase transition) occurs at a compound concentration 2 µM for the superhelical plasmid and 1.5 µM for the linear one, as compared to 8 µM for the compound layer formed on bare GC, thus proving the existence of the DNA–compound interactions. Interestingly, the phase transition is redox-sensitive, e.g., AC redox signal II is visible for the linear, but not for the superhelical plasmid, thus reflecting different orientation of the compound in these two types of pGEX-4T-2 plasmid, related to the condensation in the DNA–compound layer and seen as a decrease in the C/R signal. Conclusions: The results suggest that the reorientation of the compound leading to plasmid condensation occurs differently in supercoiled and linear pGEX-4T-2 (redox specific accumulation and condensation).

1. Introduction

Supercoiling is not only an intriguing feature of plasmid DNAs but also plays an important role in the structure of chromosomal DNAs [1,2,3]. For instance, the moderate supercoiling exhibited by chromosomal DNAs in vivo can be compared to the (negative) supercoiling of the pUC19 plasmid [4].
The relation between supercoiling and DNA transcription was predicted theoretically in the late 1980s by Liu and Wang [5], named the “twin transcriptional-loop model” and discussed in terms of supercoiling regulation, DNA conformational transition, and gene regulation in both prokaryotes and eukaryotes. Such a relation, referred to later as the “twin-supercoiled domain” model, has been shown experimentally in several studies [6,7,8,9,10,11,12,13]. Simultaneously, over the years, the use of plasmids in gene therapy, related to cancer research, has grown substantially, e.g., in “Lipoplexes”—complexes of plasmid DNA with cationic lipids [14,15] and in plasmid DNA-based vaccines [16,17,18,19].
The use of topologically different forms of plasmid DNA, possessing the same sequences and numbers of base pairs but various three-dimensional (3D) structures, opens a new route in studying DNA–drug interactions. The role of three-dimensional DNA structures in DNA–drug interactions is not well described yet. A rare example of the research on the subject is a recent demonstration (in vitro and in cells) of the preferential binding of specific proteins connected with cancer development and progression to supercoiled vs. relaxed and linear plasmid DNA [20,21,22]. Similarly, DNA structures (hairpin, Y- and X-shaped, described as origami structures) embedded in the PLL polymer (natural peptide poly-L-Lysine) have recently been used as an anticancer drug controlled-release system [23]. The influence of the DNA architecture on the functionality of such nano-sized surfaces has been pointed out.
Spectroscopic techniques, e.g., UV fluorescence and circular dichroism spectroscopy [24,25,26,27], have been widely applied to the study of plasmid DNA–drug interactions. Conformational sequence-related aspects of DNA–drug interactions have been reported for intercalators, such as anthracycline antibiotics [28], polyamide groove binders and threading intercalators, like binuclear ruthenium (II) complexes with a bidppz bridging ligand [29,30]. Interestingly, the femtosecond dynamics of DNA-mediated electron transfer has been detected [31,32]. In terms of the superhelicity of the plasmid used, relaxation of the DNA accompanying the intercalation has been postulated [31], and at high drug concentrations, the condensation of the DNA structure has also been observed [32,33]. Interestingly, the femtosecond dynamics of DNA-mediated electron transfer has been detected [34,35].
Extensive studies on DNA-mediated electrochemistry using MB, AQ, or Nile Blue (NB) have shown a number of possible interactions between DNA and each substance [36,37,38]. Interestingly, these interactions depended on the ‘architecture of DNA-modified surfaces’ [37] and included the intraduplex as opposed to interduplex mediation of the DNA electron transfer [38].
Electrochemistry offers a new approach to studying DNA–drug interactions. Using a variety of sensitive techniques, SW, DP, AC, or impedance, rather than CV, redox processes of drugs can be monitored at micromolar or sub-micromolar concentrations, thereby leading to a better understanding of the interactions between DNA and pharmaceuticals, as discussed in detail in a recent review [39], mentioning also other advantages of using electrochemical techniques, such as low cost of portable equipment and high reliability, as discussed in recent review [39].
The electrochemistry of DNA, mainly chromosomal dsDNA but sometimes also plasmids and the results of monitoring the DNA interactions with various electroactive substances, are summarized in extensive reviews [2,40,41,42,43,44,45,46,47]. The DNA–drug binding on glassy carbon (GC) electrodes has been reported with compounds such as nitroimidiazoles [48], daunomycin [49], benznidiazole [50], adriamycin [51], fludarabine [52], methotrexate [53], clofarabine (CLF) [54], temozolomide [55], gemcitabine (GEM) [56], topotecan [57] and lumazine [58], known for their anticancer properties, as well as drugs; e.g., antileukemia Glivec [59] and anti-influenza Peramivir [60]. The changes in the redox processes of DNA and drugs can be monitored simultaneously [48,50,51,59].
To study the mechanism of DNA interactions with various substances, electrodes other than mercury or glassy carbon (GC) are also used; e.g., gold electrodes that have been used to study adsorption of ds DNA [61,62] and DNA interactions with Methylene Blue (MB) [63], as well as anthraquinone (AQ) [64]. Also, the mechanism of action of copper(II )- phenanthroline complexes (potential anticancer drugs) with DNA [65], as well as the damaging effect of copper (I) polypirydyl complexes on DNA [66], have recently been studied.
Monitoring DNA damage due to DNA strand brakes [67,68,69,70], can easily be realized by detecting the oxidation of 8-oxo-guanine at much lower potential than the oxidation of guanine in the DNA layers adsorbed on the electrode. For instance, the peak observed at 0.513 V vs. Ag/AgCl at pH 4.7 can be attributed [71,72,73,74] to the oxidation of 8-oxoguanine related to DNA degradation versus the one at 0.825 V, typical for the oxidation of guanine. However, sometimes no oxidative DNA damage is detected and the non-specific DNA–drug interactions can be attributed to DNA condensation [75,76]. Recently, the cleavage processes of the circular plasmid pTagGPP2 and in calf thymus DNA have been studied using carbon nanotubes immobilized on screen-printed electrodes [77]. The use of the mercury electrode modified with a supercoiled plasmid has also been suggested for the detection of DNA strand-cleaving agents [67,68,69,70].
In electrochemistry, plasmid DNAs are less frequently used to probe DNA–drug interactions as compared to other DNA structures [2,40,41,42,43,44,45,46,47,78], even though plasmids can also be reduced on mercury electrodes, e.g., [67,68,69,78] and oxidized on carbon electrodes [77,78,79,80,81]. Traces of the plasmid DNA [79,80] or RNA [81] can be determined using adsorptive stripping potentiometry [79,80,81].
In our early study we used both chromosomal dsDNA as well as plasmid DNAs—pUC19 and pGEX-4T-2. Using dsDNA, we electrochemically probed [82,83] the interactions of pentamidine, bis-indole, and daunorubicine analogues using screen-printed electrodes (SPEs). The change in the oxidation signals of the drug and nucleic acid bases was detected in each case. We have also used the plasmid DNAs − pUC19 and pGEX-4T-2, adsorbed on SPEs [84] and glassy carbon (GC) [85] electrodes to study the interactions of both the superhelical (sc) and linear (lin) forms of these plasmids with a model compound—Methylene Blue (MB). We have shown a significant difference between the ability of the plasmids in these two distinct forms to interact with MB, particularly at sub-micromolar MB concentrations, thereby pointing again to the dependence of the electron transfer on the ‘DNA architecture’ [37].
In addition to probing the effect of superhelicity on DNA/MB interactions, the use of plasmids allows for lowering [85] DNA concentrations down to pg/mL and, consequently, MB drug concentrations to sub-micromolar values. The use of such low concentrations of the compound interacting with DNA is crucial when new drugs are tested. Another intriguing conclusion from studying the interactions of pUC19 and pGEX-4T-2 plasmids with MB (redox probe) is that the ratio of the two MB redox signals MB(II)/MB(I) is not constant with the increasing MB concentration and changes differently for each plasmid, contrary to the situation when MB is adsorbed on the bare electrode, i.e., not covered with a plasmid.
Using the same methodology as that in the case of MB/plasmid interactions, we electrochemically [86,87] studied the interactions of the scpUC19 plasmid with two potential anticancer drugs: IPBD and Cl-IPBD, and we tested their metabolic activities (MTT and LDH tests). When adsorbed on the bare electrode, the accumulation of these compounds could be detected, as in the case of MB, by the increase in each of the four redox peaks, (I) to (IV), almost the same for all MB redox peaks, but not for IPBD or Cl-IPBD redox peaks I, II and V. For instance, the accumulation of these compounds in the scpUC19 plasmid, seen as an increase in peak I, was higher for Cl-IPBD than for IPBD. Interestingly, the toxicity of Cl-IPBD was also much higher for Cl-IPBD than for IPBD. Such correlation suggests that toxicity might depend on a certain, specific orientation of the compound within the DNA structure, possibly realized by reorientation of the compound in the DNA layer when the redox state of the compound is changed. Fast reorientation of the compounds, prior to the accumulation in DNA structures, has been suggested in femtosecond spectroscopic measurements [34,35].
In this work, we further tested the idea of the ‘redox-specific accumulation and condensation’ due to the reorientation of the compounds incorporated into DNA electrode layers. Using a previously tested methodology [85], we employed a pGEX-4T-2 plasmid DNA in its two forms—the superhelical (sc) and linear (lin) forms—to study the interactions with a newly synthesized compound: 4-chloro-6-(1H-imidazo [4,5-b]phenazine-2-yl)benzene-1,3-diol, one of a variety of compounds synthesized previously [88,89], positively tested biologically for the antiproliferative (i.e., cell growth-limiting) properties using cancer cells. The compound is redox-active, possessing five distinct oxidation steps, (I)–(V), thereby allowing for monitoring the relations between these signals with accumulation, from 1–50 uM solutions on the bare electrode and on the electrode covered with either the linear (lin) or superhelical (sc) pGEX-4t-2 plasmid63.
In addition to using Differential Pulse (DP) voltammetry to monitor the redox signals of both DNA and the drug, as described before in our studies with MB [84,85], in this study, we additionally employed Alternating Current (AC) voltammetry to monitor the changes in the capacity and resistance of the DNA layers accompanying the DNA–drug interactions. The DP and AC measurements were taken sequentially in the same experiment and, therefore, these results represent the plasmid–compound interactions occurring in the same DNA layer adsorbed on the glassy carbon (GC) electrode. The simultaneous use of these two methods allowed for the detection of the phase transition leading to the compound condensation within the DNA layers; preliminary results have been reported as an Extended Abstract [86].

2. Experimental

2.1. Solutions, Reagents, and General Experimental Conditions

2.1.1. Plasmid Preparation

The supercoiled plasmid DNA, scpGEX-4T-2, was isolated from Escherica coli (XI1Blue MRF’) bacteria and processed to obtain the linear plasmid, linpGEX-4T-2. The procedure was performed by Katarzyna Michalska and Dominika Janiszek in the Professor Krzysztof Staron laboratory under the supervision of Dr. Agnieszka Girstun, Department of Molecular Biology, Institute of Biochemistry, University of Warsaw, Poland. The plasmids and other solutions were stored at 4 °C.
Plasmids were prepared and purified using standard methods, as described in our earlier publication [85].
The purity of the plasmids and their concentrations were determined spectroscopically. The concentrations of the DNA stock solutions determined were as follows: pGEX-4T-2: 252 µg/mL (supercoiled scpGEX-4T-2) and 81 µg/mL (linear linpGEX-4T-2). The ratio of absorbance at 260/280 nm less than 1.8 ensured the separation of DNA from protein impurities.
The details of the procedures used are included in the Supplementary Data presented previously [85].

2.1.2. Synthesis of 4-chloro-6-(1H-imidazo [4,5-b]phenazine-2-yl)benzene-1,3-diol

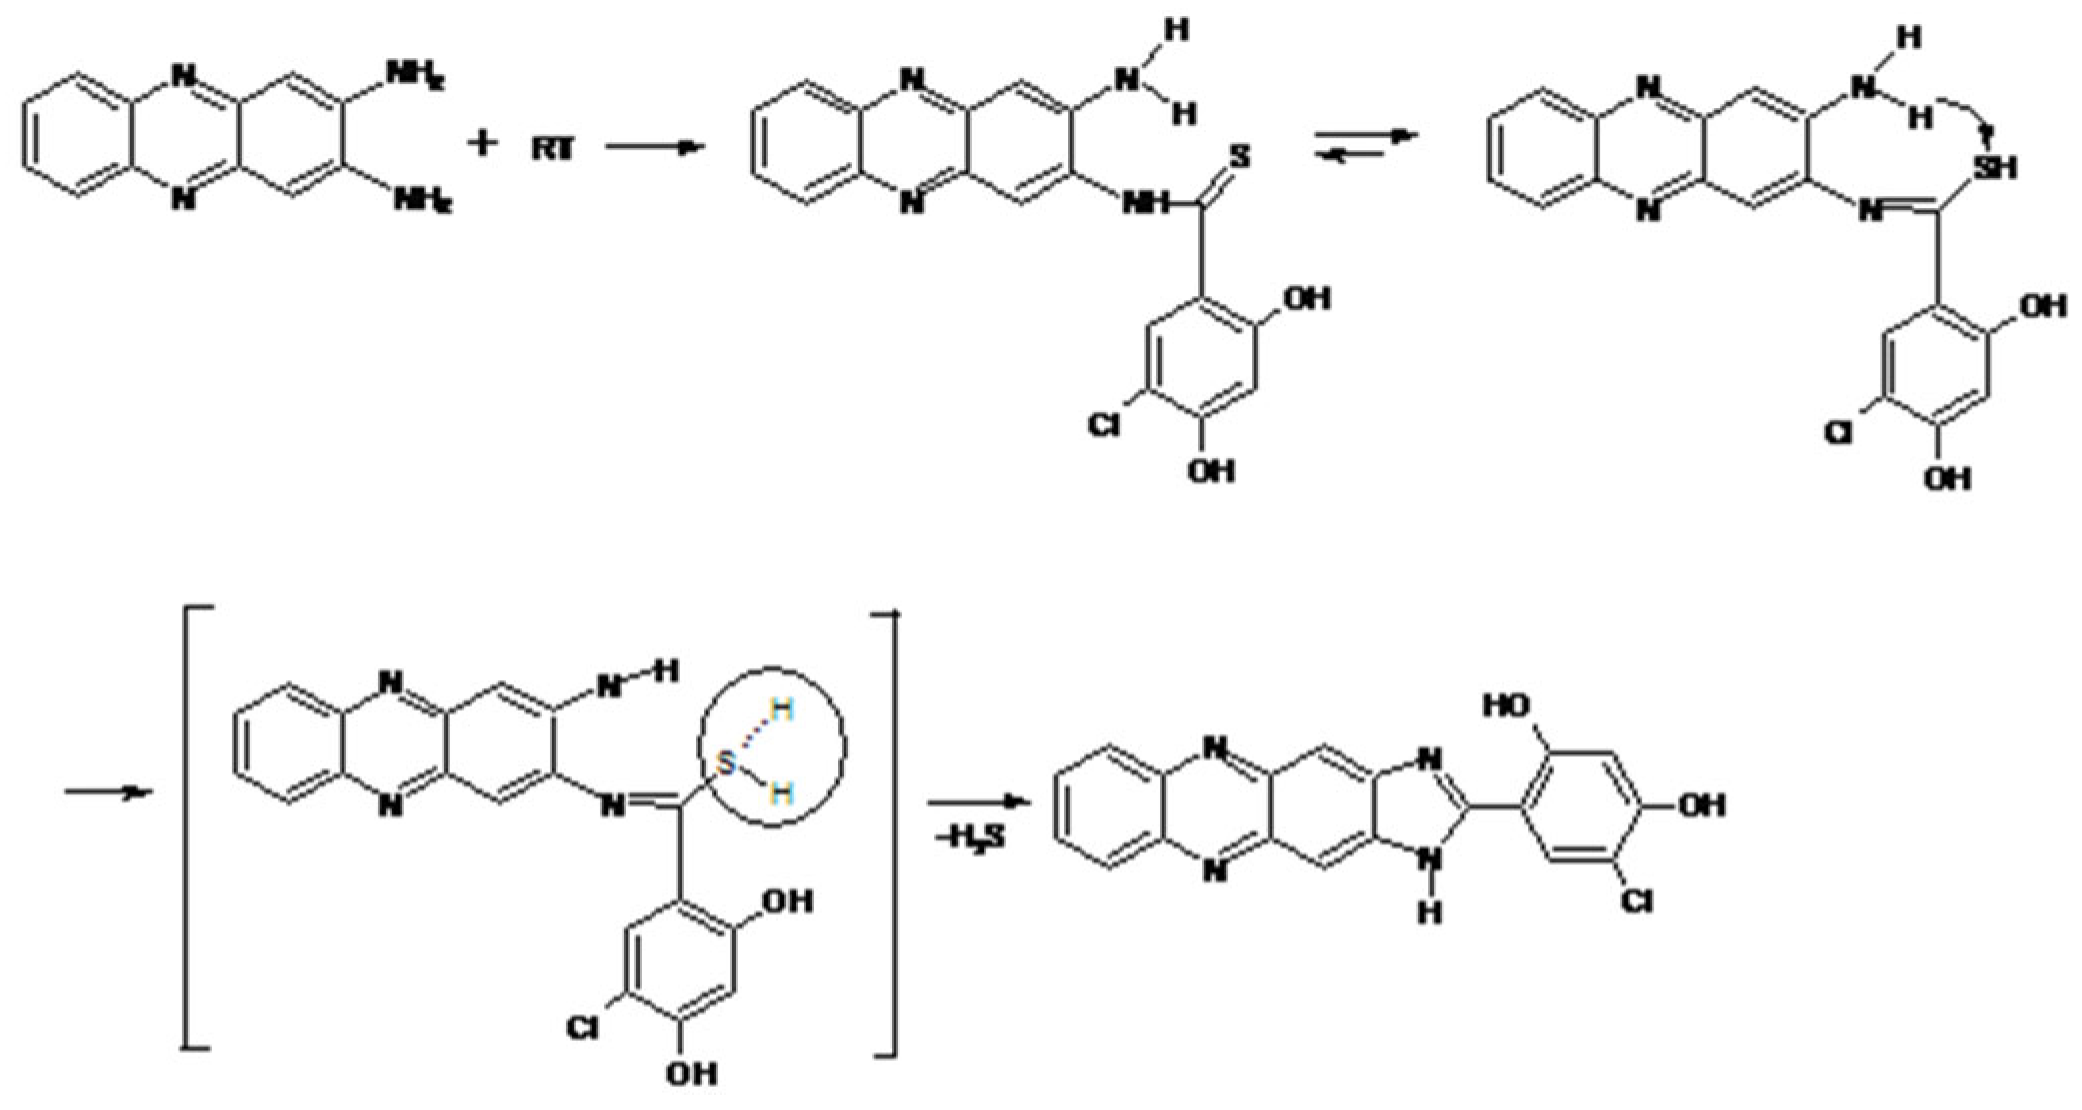
The reaction path used for the synthesis (performed by Monika M. Karpińska) of the compound-4-chloro-6-(1H-imidazo [4,5-b]phenazine-2-yl)benzene-1,3-diol, used later to study its interactions with the pGEX-4T-2 plasmid, is shown in Scheme 1. (Please note that the intermediate in parentheses should carry a formal charge on sulfur.)
A mixture of 2,3-diaminophenazyne (0.0013 mol) and sulfinylbis(5-chloro-2,4-dihydroxyphenyl)methanethione (S5ClDFM) (0.003 mol) in MeOH (6 mL) was heated to reflux for 3.5 h. The reaction mixture was then filtered without cooling. The formed solid was filtered via a Büchner funnel and combined with that removed after concentration of the filtrate. The compound was recrystallized from MeOH (4 mL).
Yield 71%; m.p. 210–211 °C; IR (KBr, cm−1): 3397 (OH), 3166 (OH), 2952 (CH), 1629 (C=N), 1580 (C=N), 1511 (C=C), 1479, 1368, 1355, 1282, 1247 (C-OH), 1203, 1186, 1164, 1139, 1084, 1025, 978, 931, 884, 827, 802, 789, 747, 711: 1H – NMR (500 MHz, DMSO-D6, δ): 11,29 (s, 1H, C3-OH); 8,30 (s, 1H, C5-H); 8,00 (m, 2H, CAr-H); 7,73 (m, 2H, CAr-H); 7,00 (s, 2H, CAr-H); 6,74 (s, 1H, C2-H) ppm: MS (EI, m/z, B): 363 (M+, 7), 312 (4), 258 (18), 224 (10), 218 (22), 202 (23), 194 (11), 192 (35), 187 (36), 171 (100), 162 (12), 159 (57), 142 (38), 127 (35), 114 (14), 79 (11), 69 (21), 53 (11), 51 (17), 44 (19), 38 (18), 36 (60). Anal. calcd. for C19H11ClN4O2 (362,77) C, 62,91; H, 3,06; N, 15,44%: Found: C, 62,99; H, 3,03; N, 15,51%.

2.1.3. General Experimental Conditions

All experiments were performed in 0.25 M acetate buffer (pH 4.7) with the addition of 18 mM MgCl2.
Acetic acid, sodium acetate, potassium chloride, and magnesium chloride were purchased from POCh, Gliwice, Poland.
Milli-Q-grade water (18.2 MΩ cm) was used for the preparation of all solutions.

2.2. Equipment

Electrochemical measurements were performed with the AUTOLAB PGSTAT 12 electrochemical analysis system with the GPES 4.8 software package (EcoChemie, The Netherlands) using Square Wave (SW) voltammetry (20 mV amplitude, 5 mV potential step, 25 Hz frequency), DP voltammetry ( 25 mV amplitude, 5 mV potential step), and AC voltammetry at either a 90° or 0° phase angle (5 mV amplitude, 66 Hz frequency).
All electrochemical experiments were performed using a conventional glass cell, containing the glassy carbon (GC) working electrode (3 mm diameter, 0.07 cm2 geometric area), reference saturated calomel electrode (SCE) (KCl), and carbon stick counter electrode.
Atomic force microscopy (AFM) imaging of plasmids was performed with Bruker Dimension Icon instrument using Bruker’s Sharp Nitride Lever (SNL) probes with a nominal force constant of 0.12 N/m (Bruker Scientific LLC, Billerrica, MA, USA) The images were acquired in Peak Force Tapping mode.

2.3. Procedure

As described before [85], meticulous cleaning of the working glassy carbon (GC) electrodes as well as the reference and counter electrodes and the glass cell was a crucial part of the experimental work. The cleaning procedure involved three steps: (1) polishing the GC electrode with alumina for at least 20 min, soaking in 0.1 M H2SO4, and rinsing with Milli-Q-grade water, (2) cleaning all other electrodes and the cell in an ultrasound bath containing 10% H2O2, or ethyl alcohol, and then (3) soaking in concentrated H2SO4 and/or HNO3 solution and rinsing with Milli-Q-grade water. The same GC electrode was used for the whole series of experiments. The stock DNA solutions were usually diluted 1000 times twice, or otherwise as needed, and microliter volumes of the diluted solutions were added to 15 mL of the acetate (pH 4.7) buffer solution to achieve concentrations of DNAs ca. 8 pg/mL.
The accumulation experiments were performed continuously using four voltammetric methods [Square Wave (SW), Differential Pulse (DP), and Alternating Current with phase detection at 90° (AC(90°)) as well as at 0° (AC(0°))]. The interval between the runs was monitored and kept almost constant (ca. 20 min). Contrary to the previous report [85], not only DP but also AC(0°) voltammetric experiments are shown and discussed in this work.
For the Atomic Force Microscopy (AFM) of the DNA, the glassy carbon (GC) plate was used as a working electrode in a three-electrode cell. The superhelical plasmid DNA was accumulated for 150 min from a 4 pg/mL DNA solution in 0.25 M acetate buffer, 18 mM MgCl2 (pH 4.7).

3. Results and Discussion

For the study of the interactions of the prospective anticancer drug with the two forms of DNA, it was crucial to test and prove that these two forms of the pGEX-4T-2 plasmid (4970 bp)—superhelical (sc) and linear (lin), differing only in their three-dimensional structures—were preserved on the electrode and stable and the layers were uniformly formed. The method of detection could not involve a DNA-interacting substance. For this reason, a label-free method (i.e., without addition of a redox indicator) for the detection of the plasmids (sc and lin) was chosen that involved the use of two different types of voltammetry—Differential Pulse (DP) and Alternating Current (AC) voltammetry. In DP, the oxidation of the nucleic acid bases was monitored as current increase at potentials higher than +0.7 V vs. the SCE, while the oxidation of the compound was detected in a wide range of potentials from −0.4 V to +0.6 V, as signals I-V. In AC voltammetry, although some redox signals could also be seen, mainly the capacitative/resistive characteristic (abbreviated as C/R) was detected.
The label-free accumulation of both the supercoiled and linear pGEX-4T-2 plasmids on the glassy carbon (GC) electrode is shown in Section 3.1, while the accumulation of the compound on bare GC is presented in Section 3.2. The interactions of the compound with both the supercoiled and linear plasmids are shown in Section 3.3, and in Section 3.4, the relevance of the plasmid superhelicity for the oxidation of nucleic acid bases in the presence of the compound is discussed.

3.1. Label-Free Detection of Linear (lin) and Supercoiled (sc) pGEX-4T-2 Plasmid Accumulation on Glassy Carbon (GC) Electrode

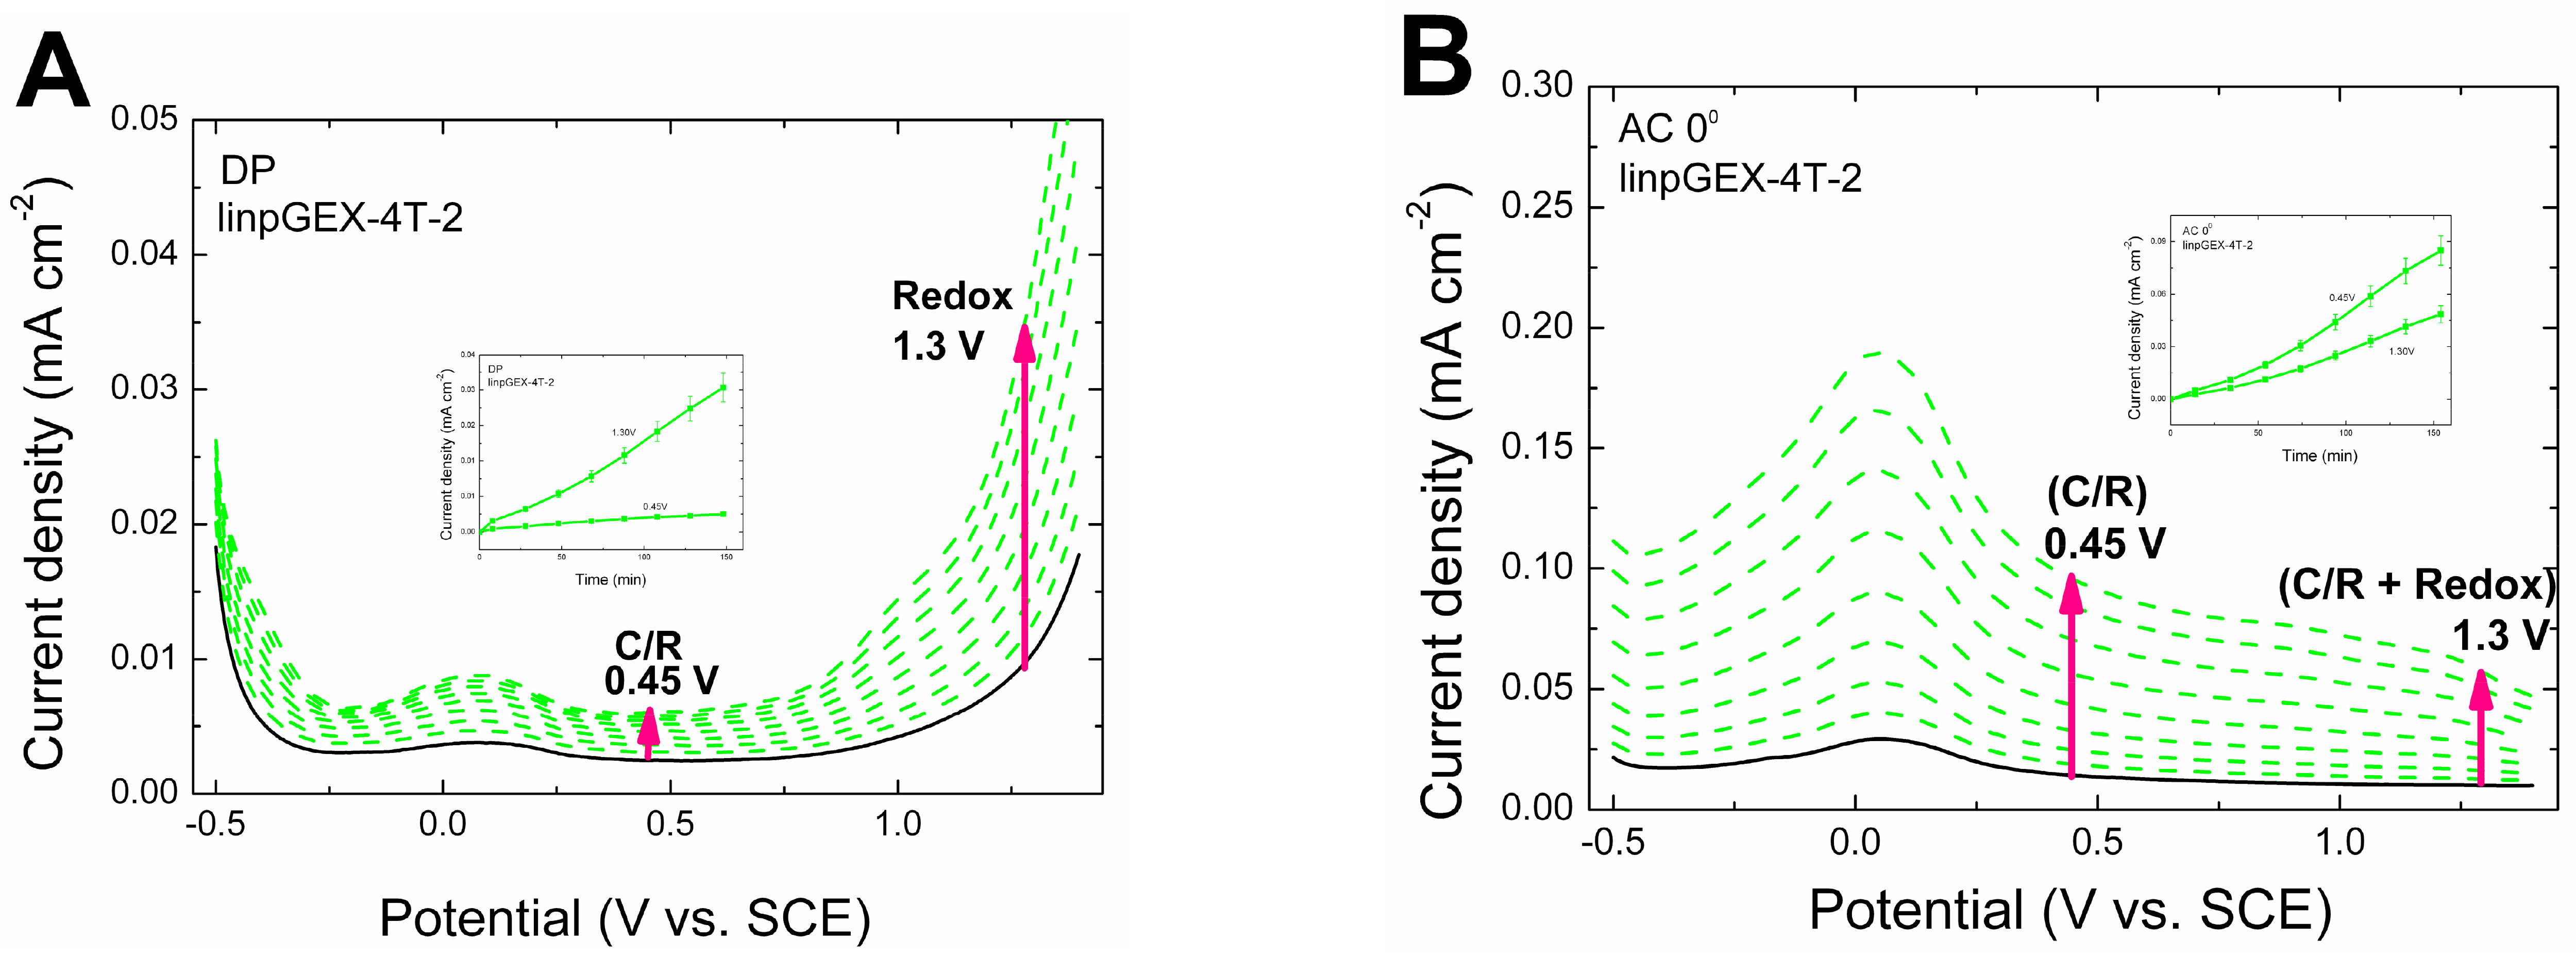
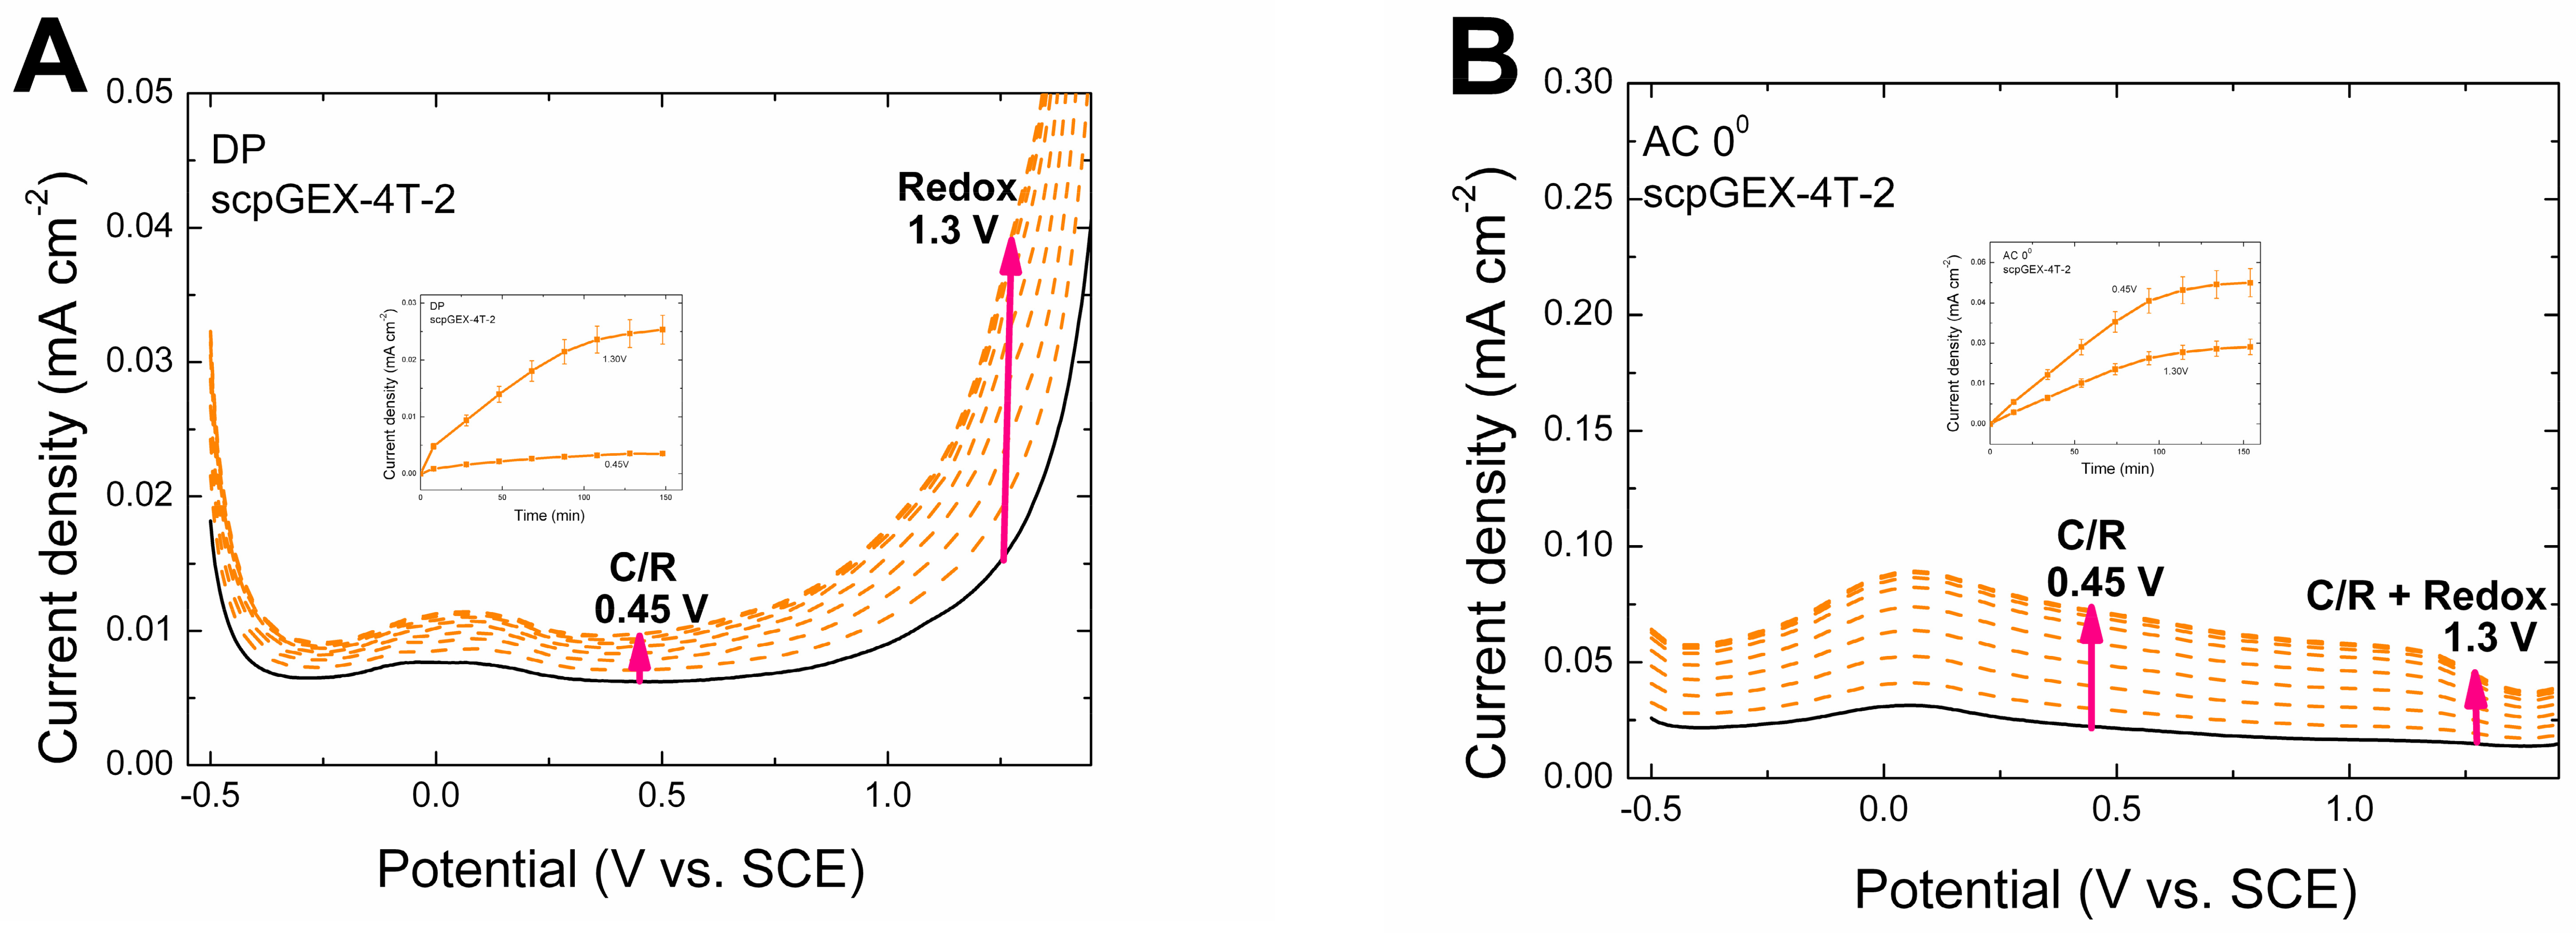
Figure 1A,B depict the voltammetric runs taken in highly diluted, ca. 8 pg/mL, linear pGEX-4T-2 plasmid solutions over a time period of 150 min; and Figure 2A,B show the corresponding voltammograms for the supercoiled pGEX-4T-2 plasmid. These voltammograms represent the DNA adsorption and accumulation on a glassy carbon (GC) electrode detected via two various phenomena: redox processes—oxidation of nucleic acid bases—in the DP method (Figure 1A and Figure 2A), and capacitative/resistive (C/R) properties of the plasmid layers adsorbed on a glassy carbon (GC) electrode in the AC method (Figure 1B and Figure 2B). The DP and AC measurements were taken sequentially within a ca. 20 min interval. This way, an atypical adsorption of the plasmid DNAs could be monitored from two different points of view yet in the same experiment.
In DP voltammetry, the oxidation of nucleic acid bases is typically detected as peaks at high positive potentials, more positive than 0.7 V vs. the SCE: guanine (G) at ca. 1.0 V and adenine (A) at ca. 1.3 V vs. the SCE [48]. The oxidation peaks are usually well defined for chromosomal DNAs and polynucleotides. For plasmids, on the contrary, separate G and A signals cannot be distinguished. As shown in Figure 1A and Figure 2A and discussed in detail in our previous works [84,85], these signals are merged for plasmid DNAs, causing difficulties in the typical, electrochemical detection of DNA via redox peaks. Yet, these obstacles can be overcome by measuring the signals at various potentials and not necessarily at the peak potentials.
In these experiments, except for the buffer, the substances other than DNA are not used; i.e., no mediator is added to amplify the DNA oxidation signal, and therefore such detection of nucleic acid bases can be called a label-free method.
The insets in Figure 1A and Figure 2A show the DNA accumulation curves calculated from the DP data at 1.3 V, with the potential positive enough to observe the oxidation of nucleic acid bases. These accumulation curves are compared with the signals taken at 0.45 V, i.e., at the potential where no DNA oxidation occurs. A significant increase in the signals at 1.3 V vs. 0.45 V proves the oxidation of the plasmids, even though the redox peaks are not developed. The signals at 0.45 V are significantly lower compared to the DNA oxidation signals since they are only related to the capacitative/resistive (C/R) changes in the plasmid layers adsorbed on the GC electrode, which are minimized in DP voltammetry. Still, the C/R changes resulting from the adsorption of the plasmids on the electrode can be effectively used as a measure of the accumulation of the DNA in the adsorbed layer using AC voltammetry. In AC voltammetry (Figure 1B and Figure 2B), yet another method of the label-free monitoring of DNA accumulation, the shape of the curves is completely different from the DP ones (Figure 1A and Figure 2A). For the buffer solution, the AC run is almost flat in the whole potential range. When a substance is adsorbed on the electrode, the AC runs can either increase or decrease, and they can also change shape, depending on the electrical properties of the adsorbed layer. Moreover, they also may change the shape of the signals due to the reorientation and/or condensation of the molecules within the layer.
It is important to note that in the case of the pGEX-4T-2 plasmid, except for increasing signals, no change in the signal characteristics is observed with DNA coverage of the GC electrode, confirming the formation of a uniform layer. It is also important to note that the formation of the plasmid layers on the GC electrode always results in the increase in the DP and AC plots with the same characteristics. No sudden reorientation or condensation of the plasmid molecules is observed.
The insets in Figure 1B and Figure 2B show that, using AC voltammetry, the accumulation of the plasmid pGEX-4T-2 DNAs (lin and sc) could be monitored at 0.45 V when no DNA redox reaction was present, and also at 1.3 V when the nucleic acid bases could be oxidized, but the effect was smaller than at 0.45 V. These accumulation curves are also similar to the ones calculated from the DP runs at 1.3 V (insets in Figure 1A and Figure 2A), proving the consistency of the results obtained using DP and AC voltammetry, as well as the formation of a uniform layer of basically the same structure at different DNA coverage.
The difference is observed, however, in the accumulation plots for the superhelical (Figure 2A,B) vs. linear forms of pGEX-4T-2 (Figure 1A,B) in both the DP and AC voltammograms. For these two plasmids possessing the same sequences of bases and differing only in their three-dimensional structures, the difference in their accumulation curves lies in the times needed to form a layer on the electrode and also in the shapes of these curves. The shape of the accumulation curve for the superhelical plasmid resembles the Langmuir isotherm, while the one for the linear plasmid is sigmoidal. This result proves that the superhelicity of these two forms of pGEX-4T-2 was retained in the adsorbed state and the adsorbed layers could be used to detect the differences in the interactions of the supercoiled and linear DNA with the compound under study.
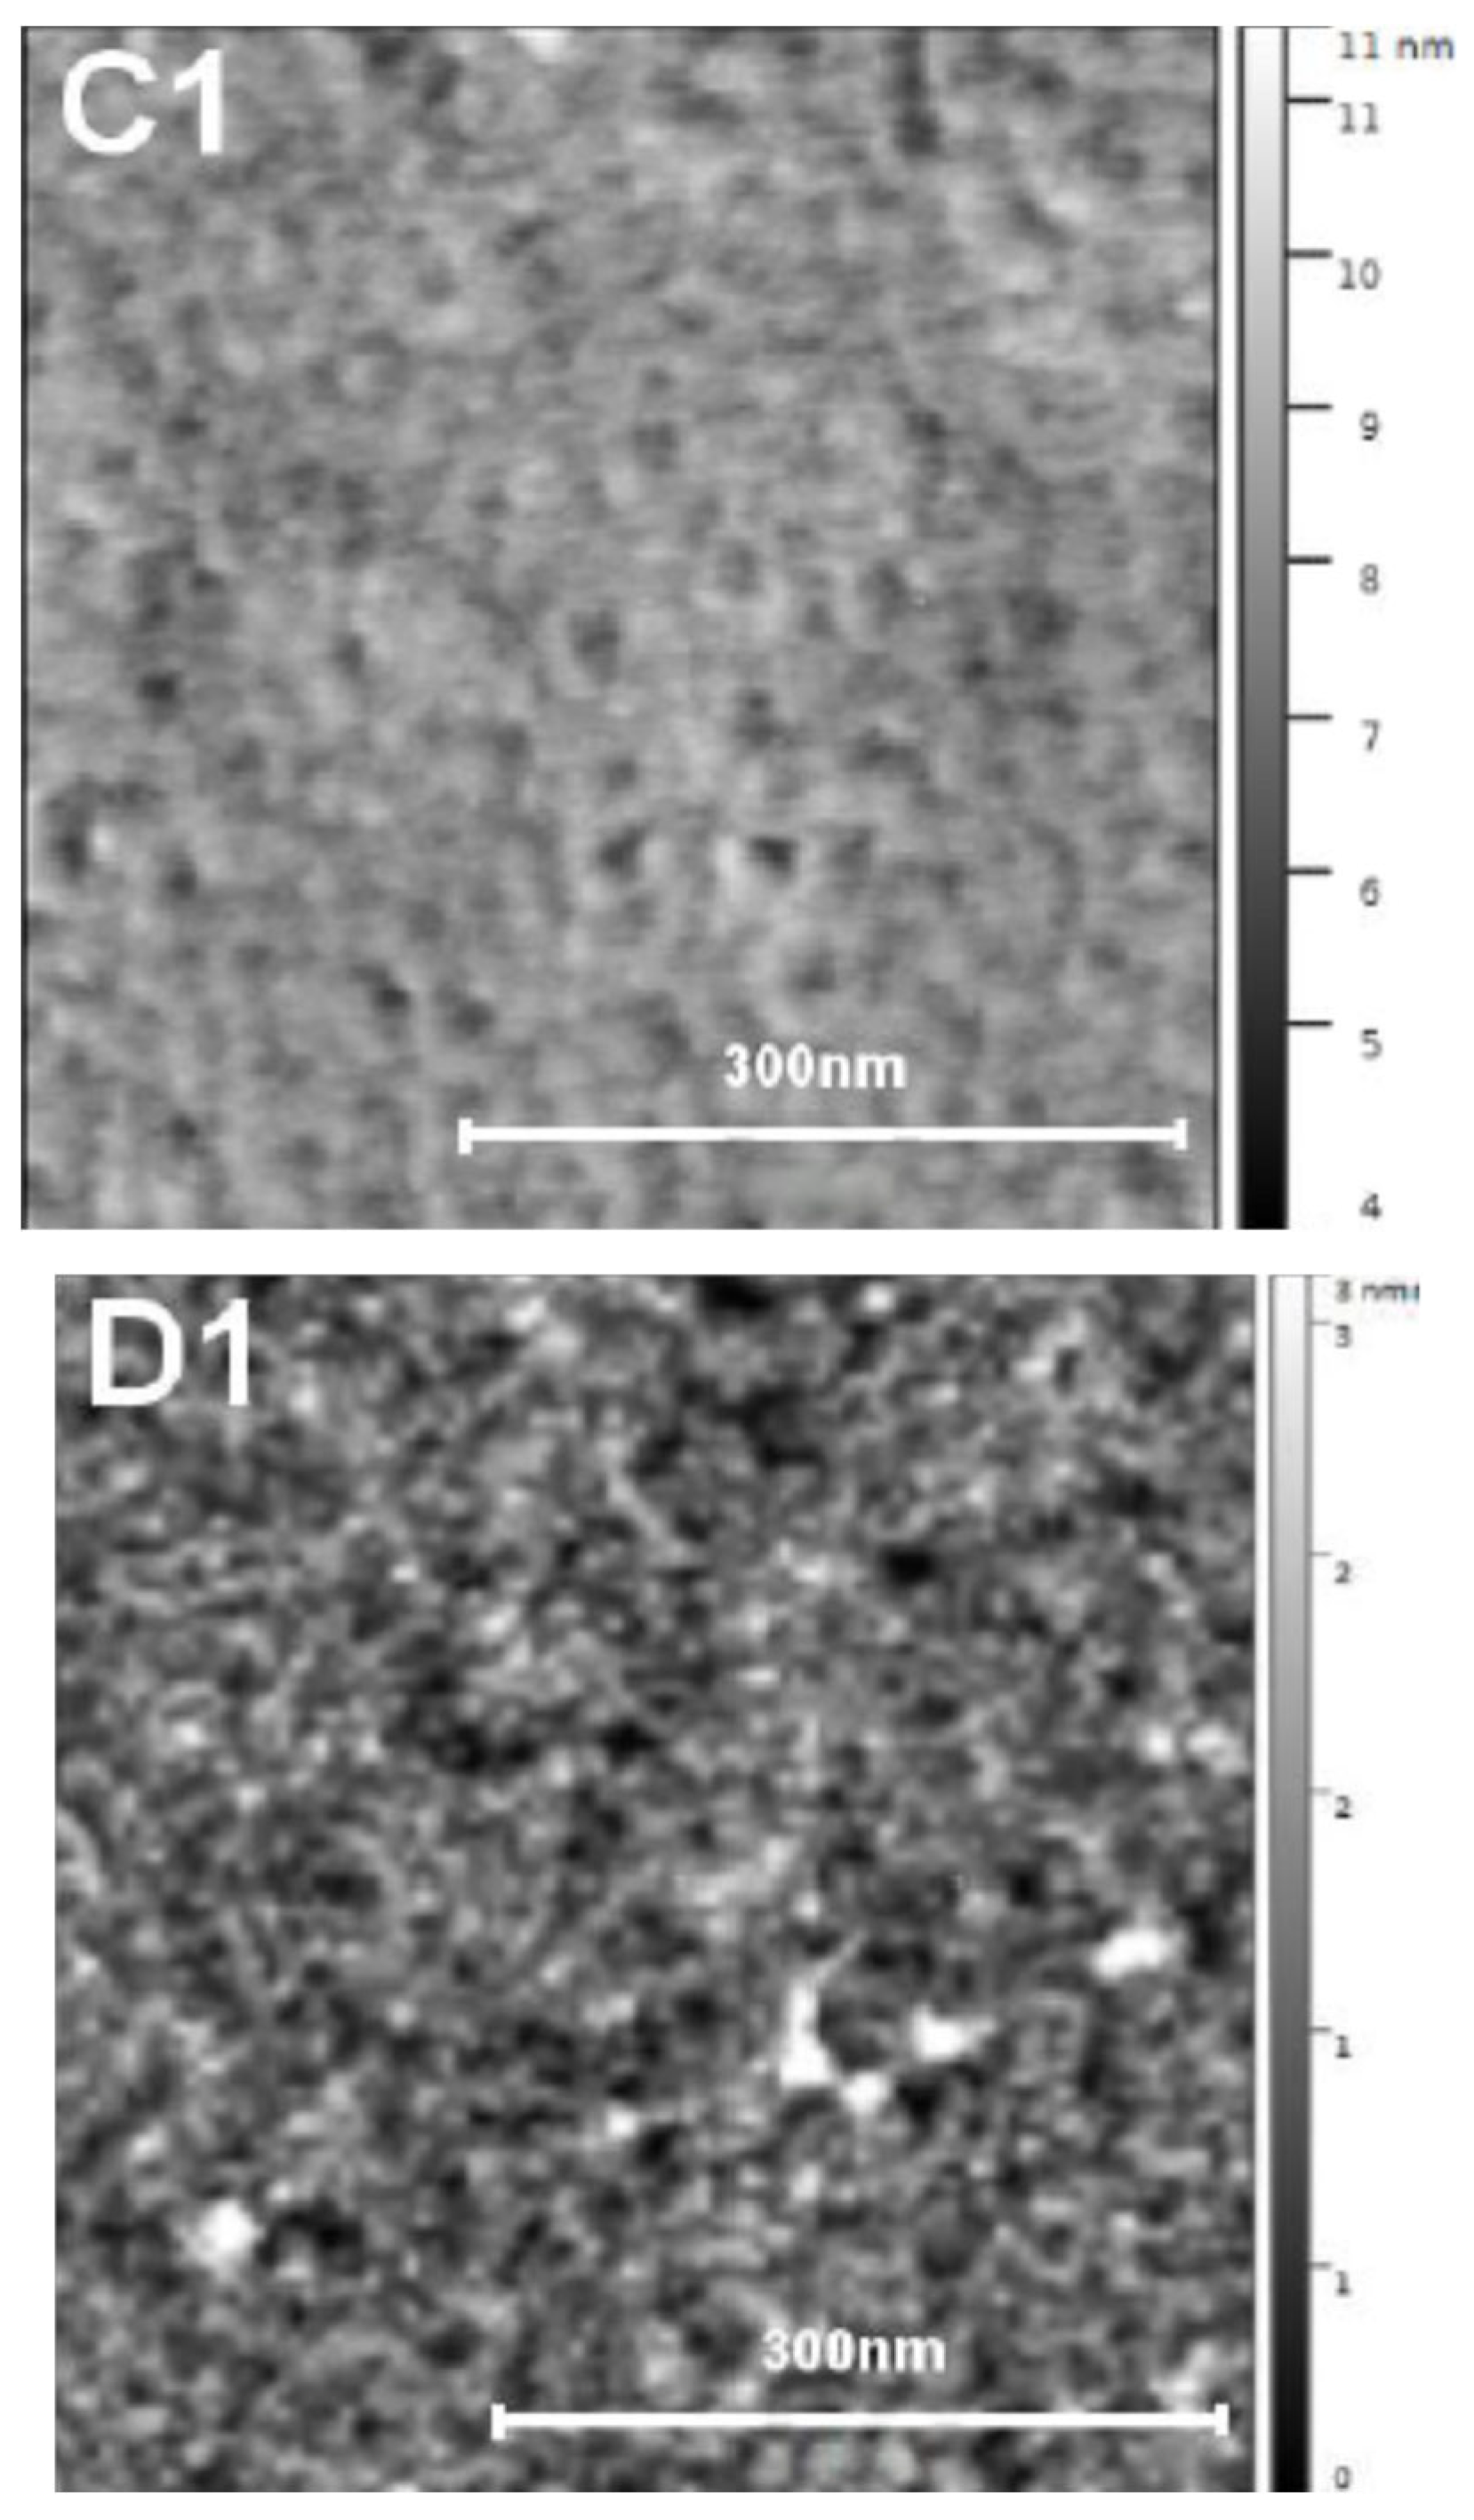
The AFM images (Figure 3) of the glassy carbon plate electrochemically covered with the superhelical plasmid confirm the formation of a well-structured layer featuring ca. 200 nm plasmid molecules. This layer was formed electrochemically (8 pg/mL) in the same manner as in the DP or AC measurements on a 10 nm × 10 nm GC plate made with the same kind of carbon as that of the typically used GC working electrodes.

3.2. Accumulation of 4-chloro-6-(1H-imidazo [4,5-b]phenazine-2-yl)benzene-1,3-diol on the GC Electrode

To study the interactions of the supercoiled and linear forms of pGEX-4T-2 with a potential anticancer drug, we chose a newly synthesized compound—4-chloro-6-(1H-imidazo [4,5-b]phenazine-2-yl)benzene-1,3-diol—which belongs to the benzene and pyridyl imidazoles, a group of compounds containing blocks condensed to the imidiazole ring (Scheme 1).
The compound possesses four conjugated rings, as well as a –Cl substituent (Scheme 1), suitable for the intercalations between the nucleic acid bases, while the –OH groups might take part in the DNA groove binding, thereby enhancing the attachment of the compound to the DNA [88,89].

3.2.1. Reorientation and Formation of a Condensed Layer

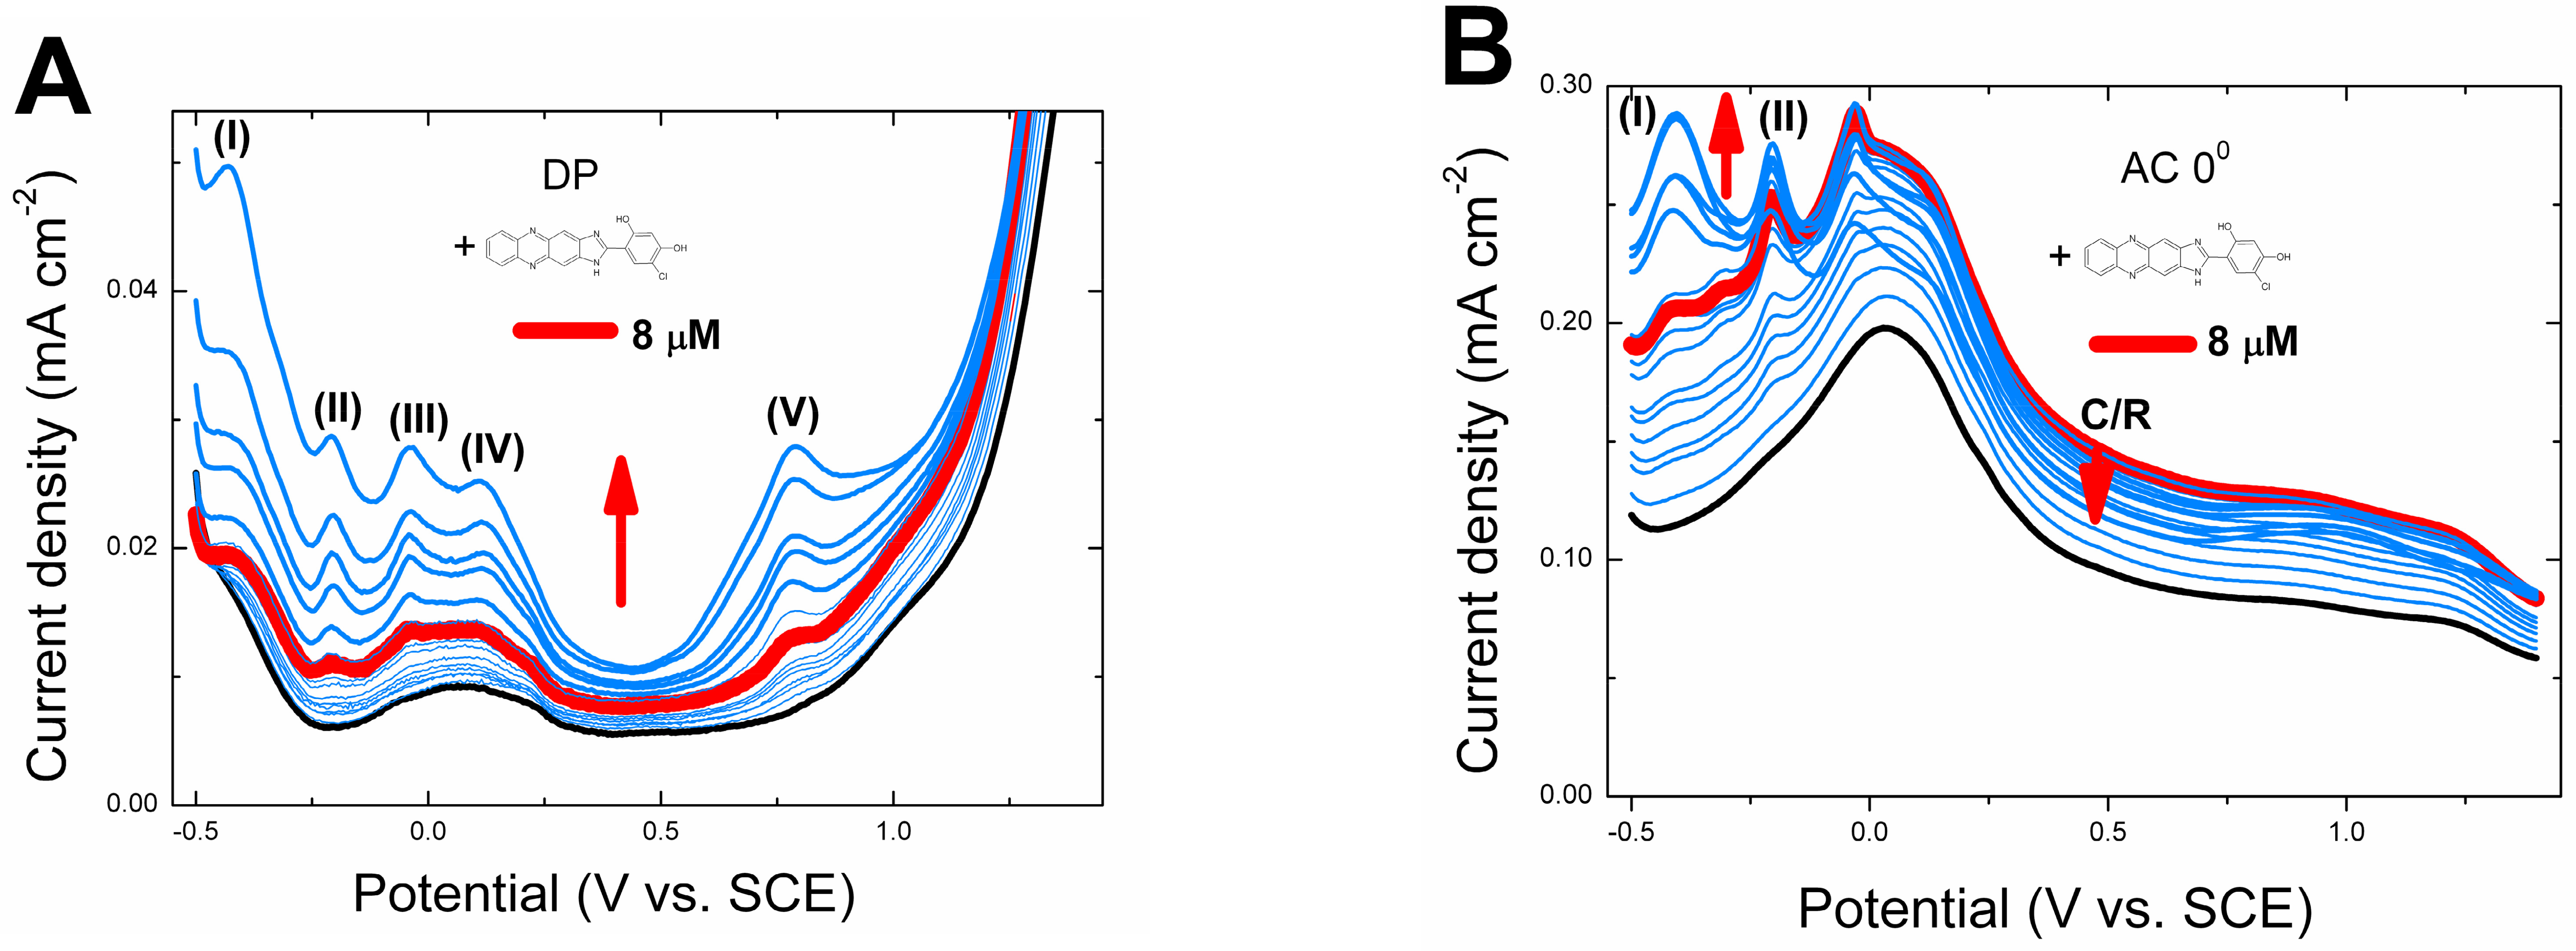
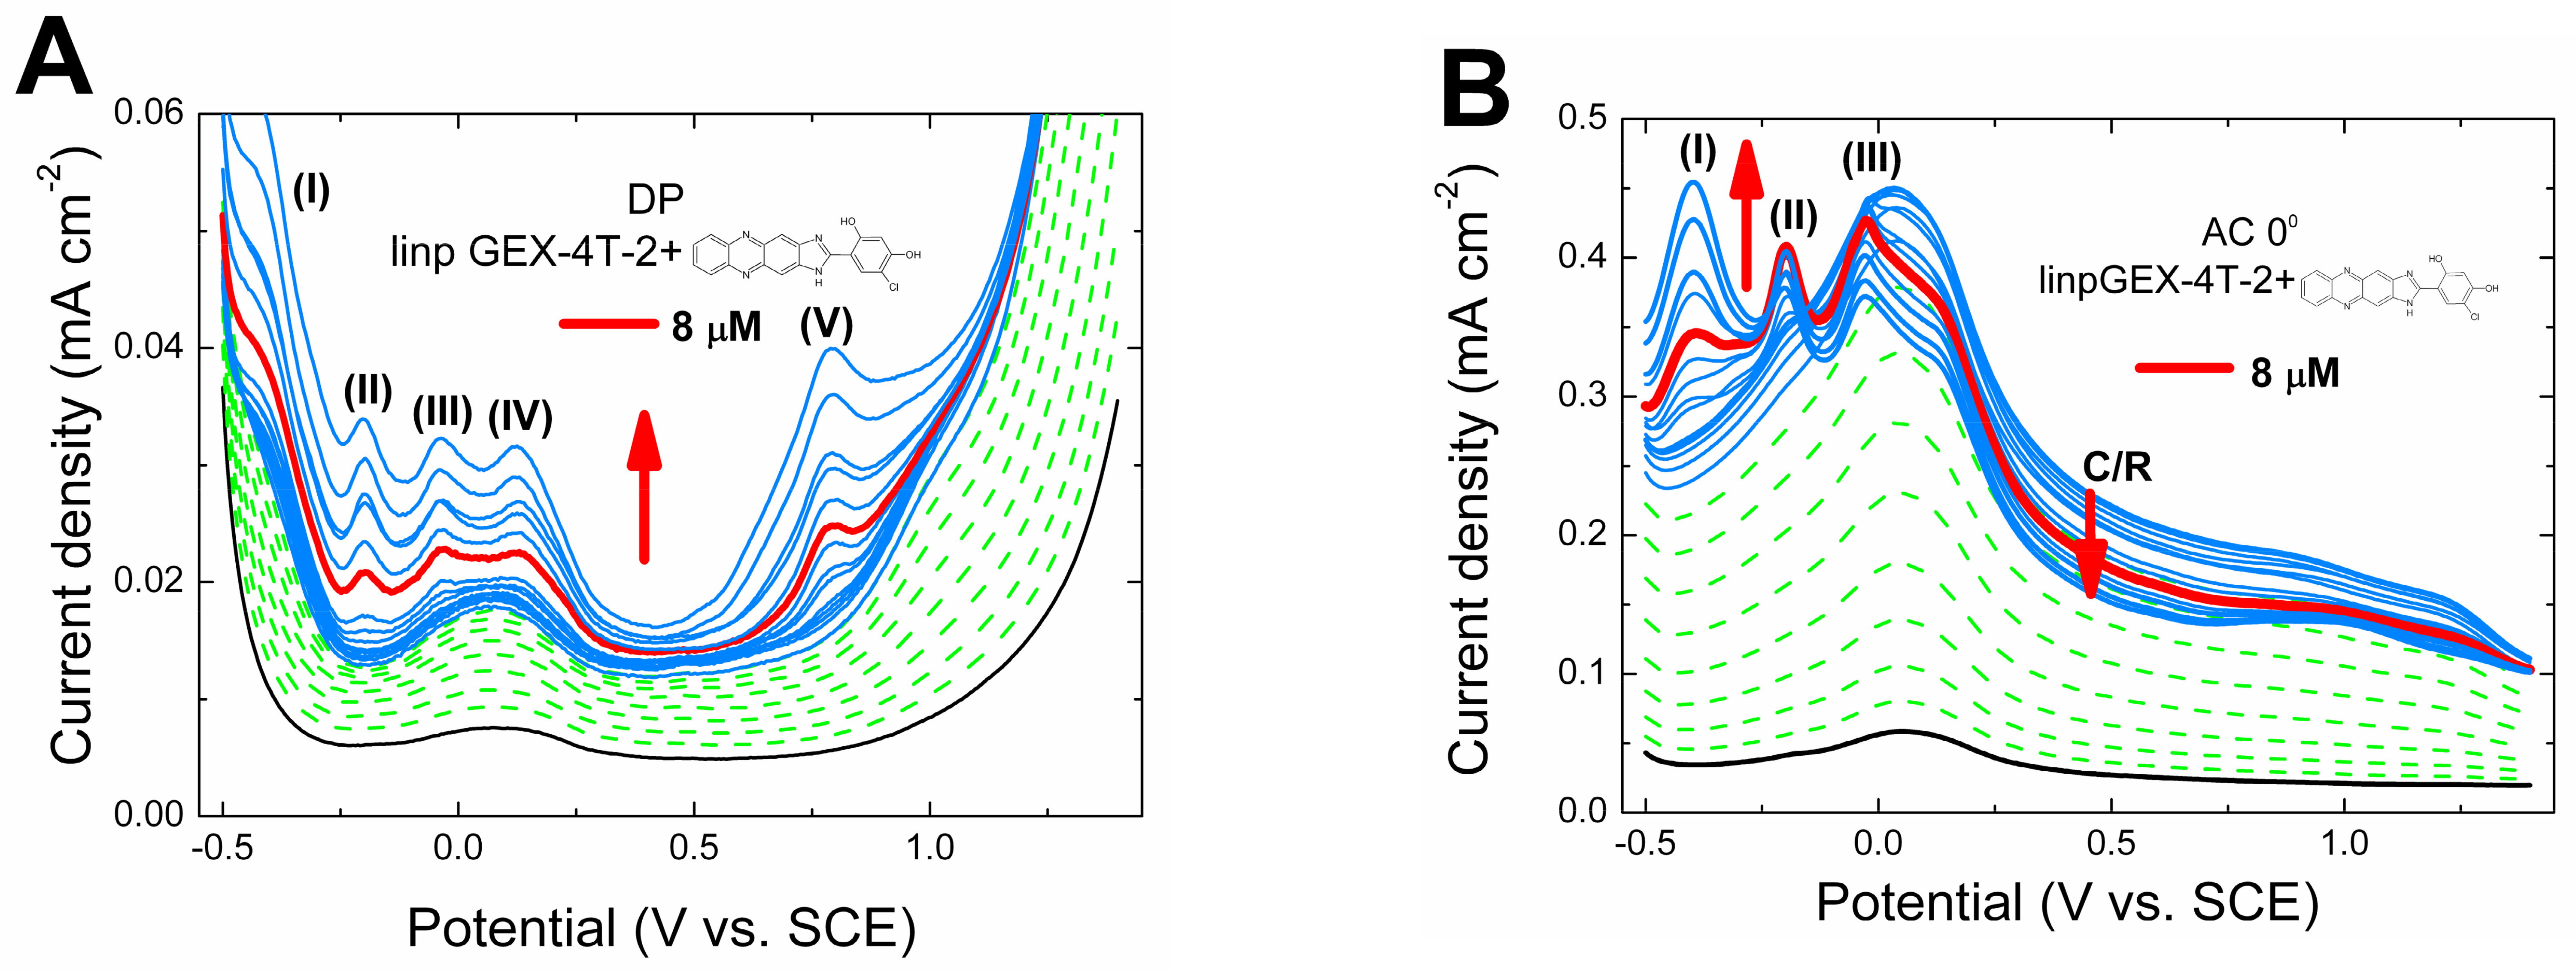
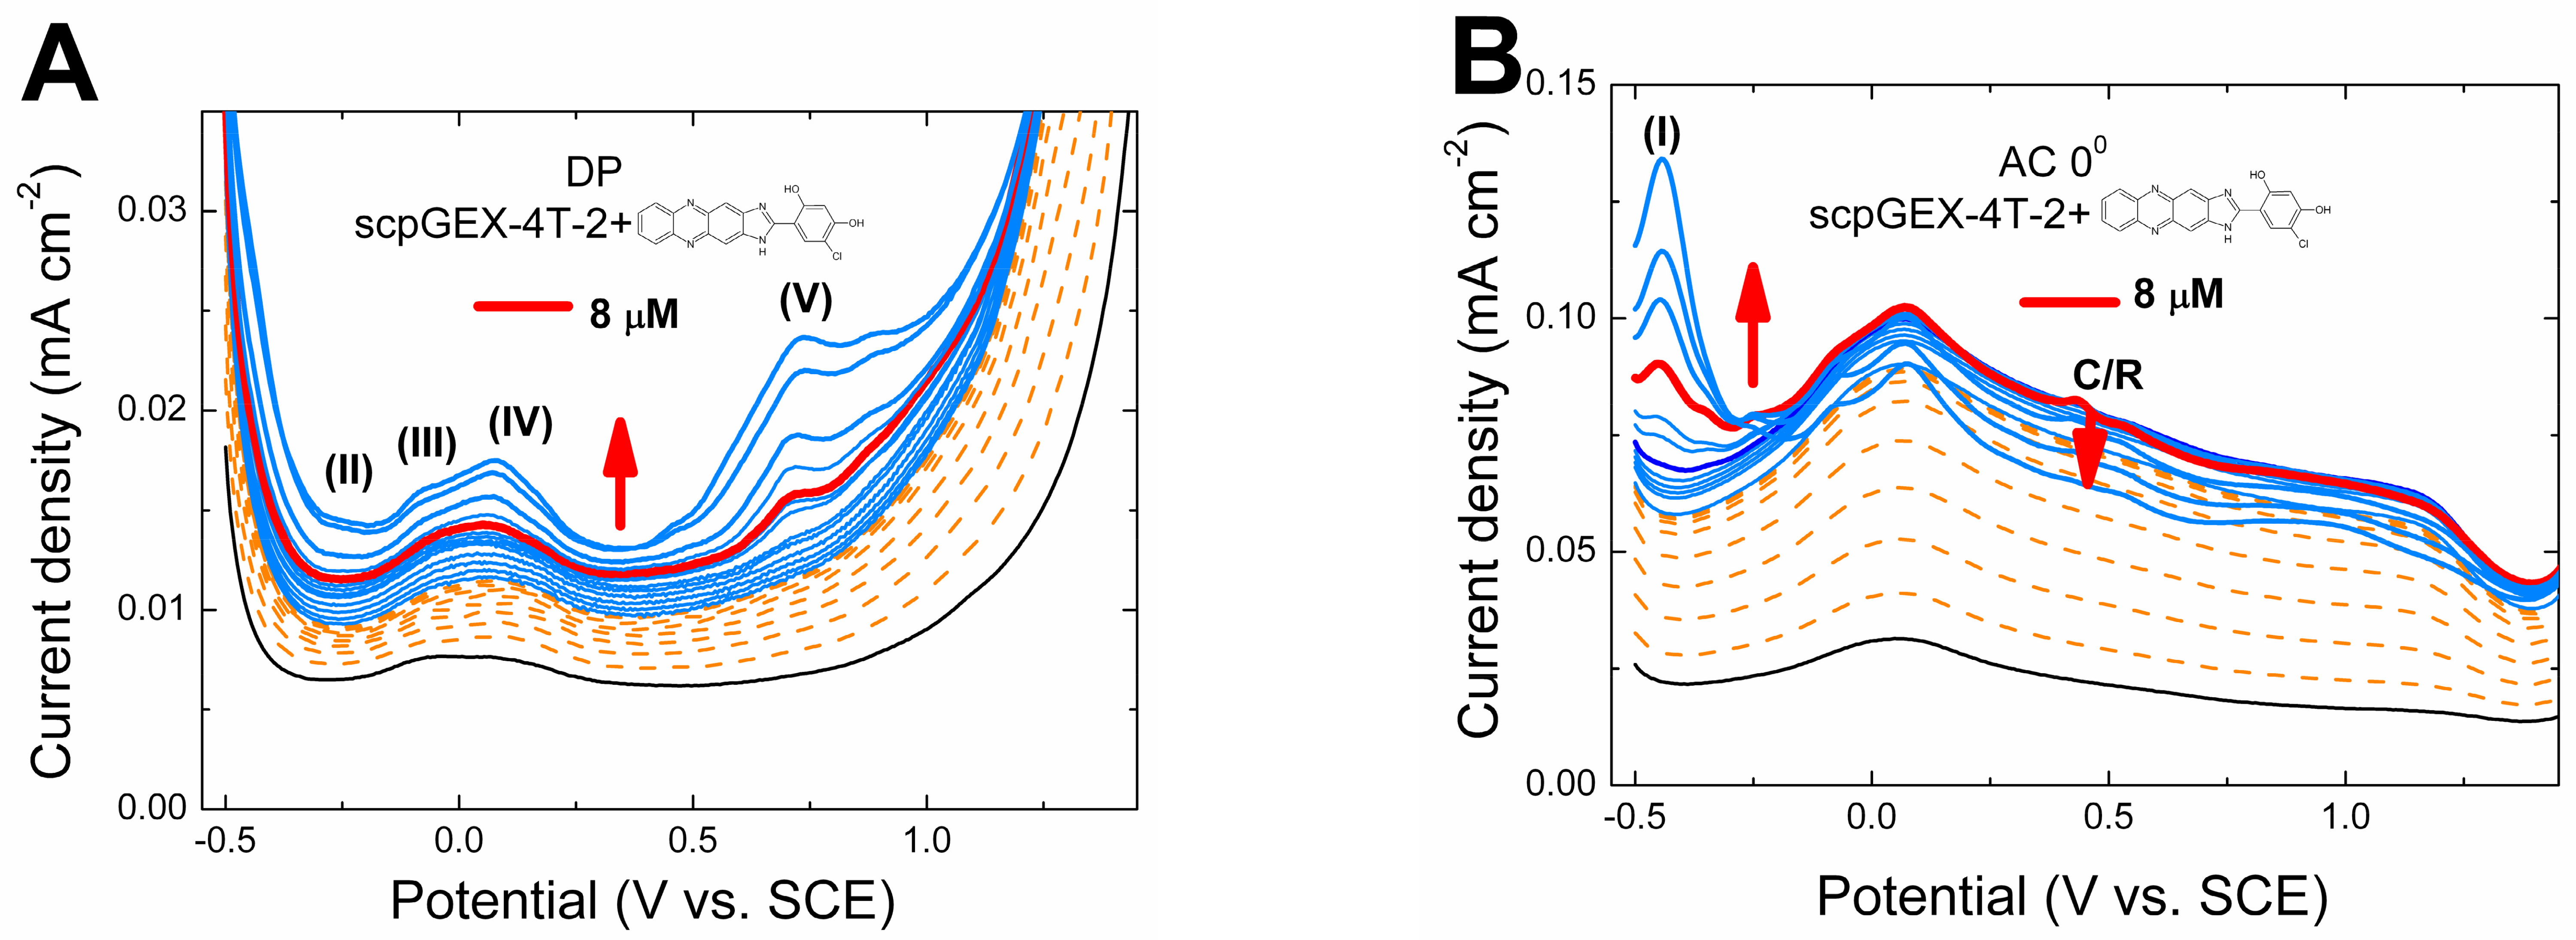
Figure 4A, Figure 5A and Figure 6A show the accumulation of the compound on the bare electrode (Figure 4A) and on the electrode covered by either the linear plasmid, linpGEX-4T-2 (Figure 5A), or superhelical plasmid, scpGEX-4T-2 (Figure 6A), using the DP method featuring mainly the oxidation of the compound in peaks (I) to (V).
Figure 4B, Figure 5B and Figure 6B depict the accumulation of the compound on the bare electrode (Figure 4B) and on the electrode covered by either the linear plasmid, linpGEX-4T-2 (Figure 5B), or superhelical plasmid, scpGEX-4T-2 (Figure 6B), showing mainly the changes in the capacity (C) and resistance (R), i.e., the C/R of the adsorbed layer using the AC method. The oxidation of the compound is limited to peaks (I) and (III), or even to peak (I) in the case of the supercoiled plasmid.
The green dotted lines in Figure 5 represent the accumulation of the linear (lin) plasmid and the red dotted lines in Figure 6 depict the accumulation of the circular (sc) plasmid prior to the accumulation of the compound.
The main conclusion from the experiments shown in Figure 4A,B, Figure 5A,B and Figure 6A,B is that the accumulation of the compound in the linear plasmid resembles (but is not the same as) the accumulation on the bare electrode, while the accumulation of this compound in the superhelical plasmid is much different.
The red lines in Figure 4A,B, Figure 5A,B and Figure 6A,B represent the runs taken at the 8 µM compound concentration. This concentration is the most important for understanding the features of the AC runs, shown in Figure 4B. At concentrations lower than 8 µM, the AC(0°) runs (Figure 4B, Figure 5B and Figure 6B) increase with the accumulation of the compound but decrease when the concentration of the drug increases. It should be noted that a decrease in AC voltammograms is often interpreted as the condensation of the electrode layer.
The change in the shape of the AC currents due to changes in the capacitative/resistive properties of the layers, shown in Figure 4B, which is the opposite to what is observed for the adsorption of plasmids in Figure 1A,B and Figure 2A,B, is typical for a number of compounds, e.g., flavins [90,91,92,93], which are capable of changing the orientation of the molecules on the electrode from flat to perpendicular. With a flat orientation, the molecules interact weakly with the electrode, and with the perpendicular orientation, the two molecules interact with each other. Another possible intermolecular interaction is the formation of two layers of the molecules lying flat on the electrode surface, possibly forming a condensed layer, usually due to the interactions between the rings (stacking interactions). This effect is mostly visible for the molecules possessing a ring structure, consisting of two, three, or more rings, like flavins [90,91,92,93], for instance, and the compound under investigation. Therefore, the accumulation of the compound on the GC electrode, described in Figure 4A,B, Figure 5A,B and Figure 6A,B, seems to reflect the reorientation of the molecules from ‘flat’ (at low concentrations) to ‘perpendicular’ (at high concentrations) with a borderline at 8 µM, marked in red. The reorientation of plasmids is, however, not that simple to imagine.
In the case of the interactions of pGEX-4T-2 plasmid DNA with the compound under investigation, the ‘flat’ orientation of this compound imbedded into the DNA structure might be imagined as follows: (a) intercalation between the nucleic acid bases, or (b) groove binding by one compound molecule, while the ‘two flat layers’ orientation could possibly be realized by groove binding with more than one compound molecule or some other complex configuration that still allows for the simultaneous interactions of the two molecules with the DNA helix at the same site or in close proximity.
As a consequence of such changes in the orientation of the compound within the plasmid layers, leading to the excessive accumulation of the compound within the plasmid structure, particularly in a superhelical form, condensation of the DNA might be envisioned. Recently, such condensation was visualized by excellent AFM images of plasmid molecules undergoing spectacular condensation in the presence of antitumor noncovalent polynuclear platinum complexes {33]. The formation of condensed layers has been observed in AC voltammetry for the DNA B-Z transition in the presence of metal ions [92]. Condensation of plasmid DNA in the presence of Pt compounds has been studied [33] and, recently, the spatiotemporal dynamics of protamine–DNA condensation was revealed by AFM [94].

3.2.2. Redox-Specific Accumulation

An interesting new aspect of the accumulation of the compound is that each of the orientations described above is redox-specific; i.e., it is characterized by a specific redox signal. The redox processes of the compound can be monitored by DP voltammetry and also by the AC method. As mentioned before in Section 3.1, the data obtained in this section were collected in one experiment. The DP and AC voltammograms were taken sequentially with a time interval of ca. 20 min., and therefore the correlation between the DP and AC signals was expected.
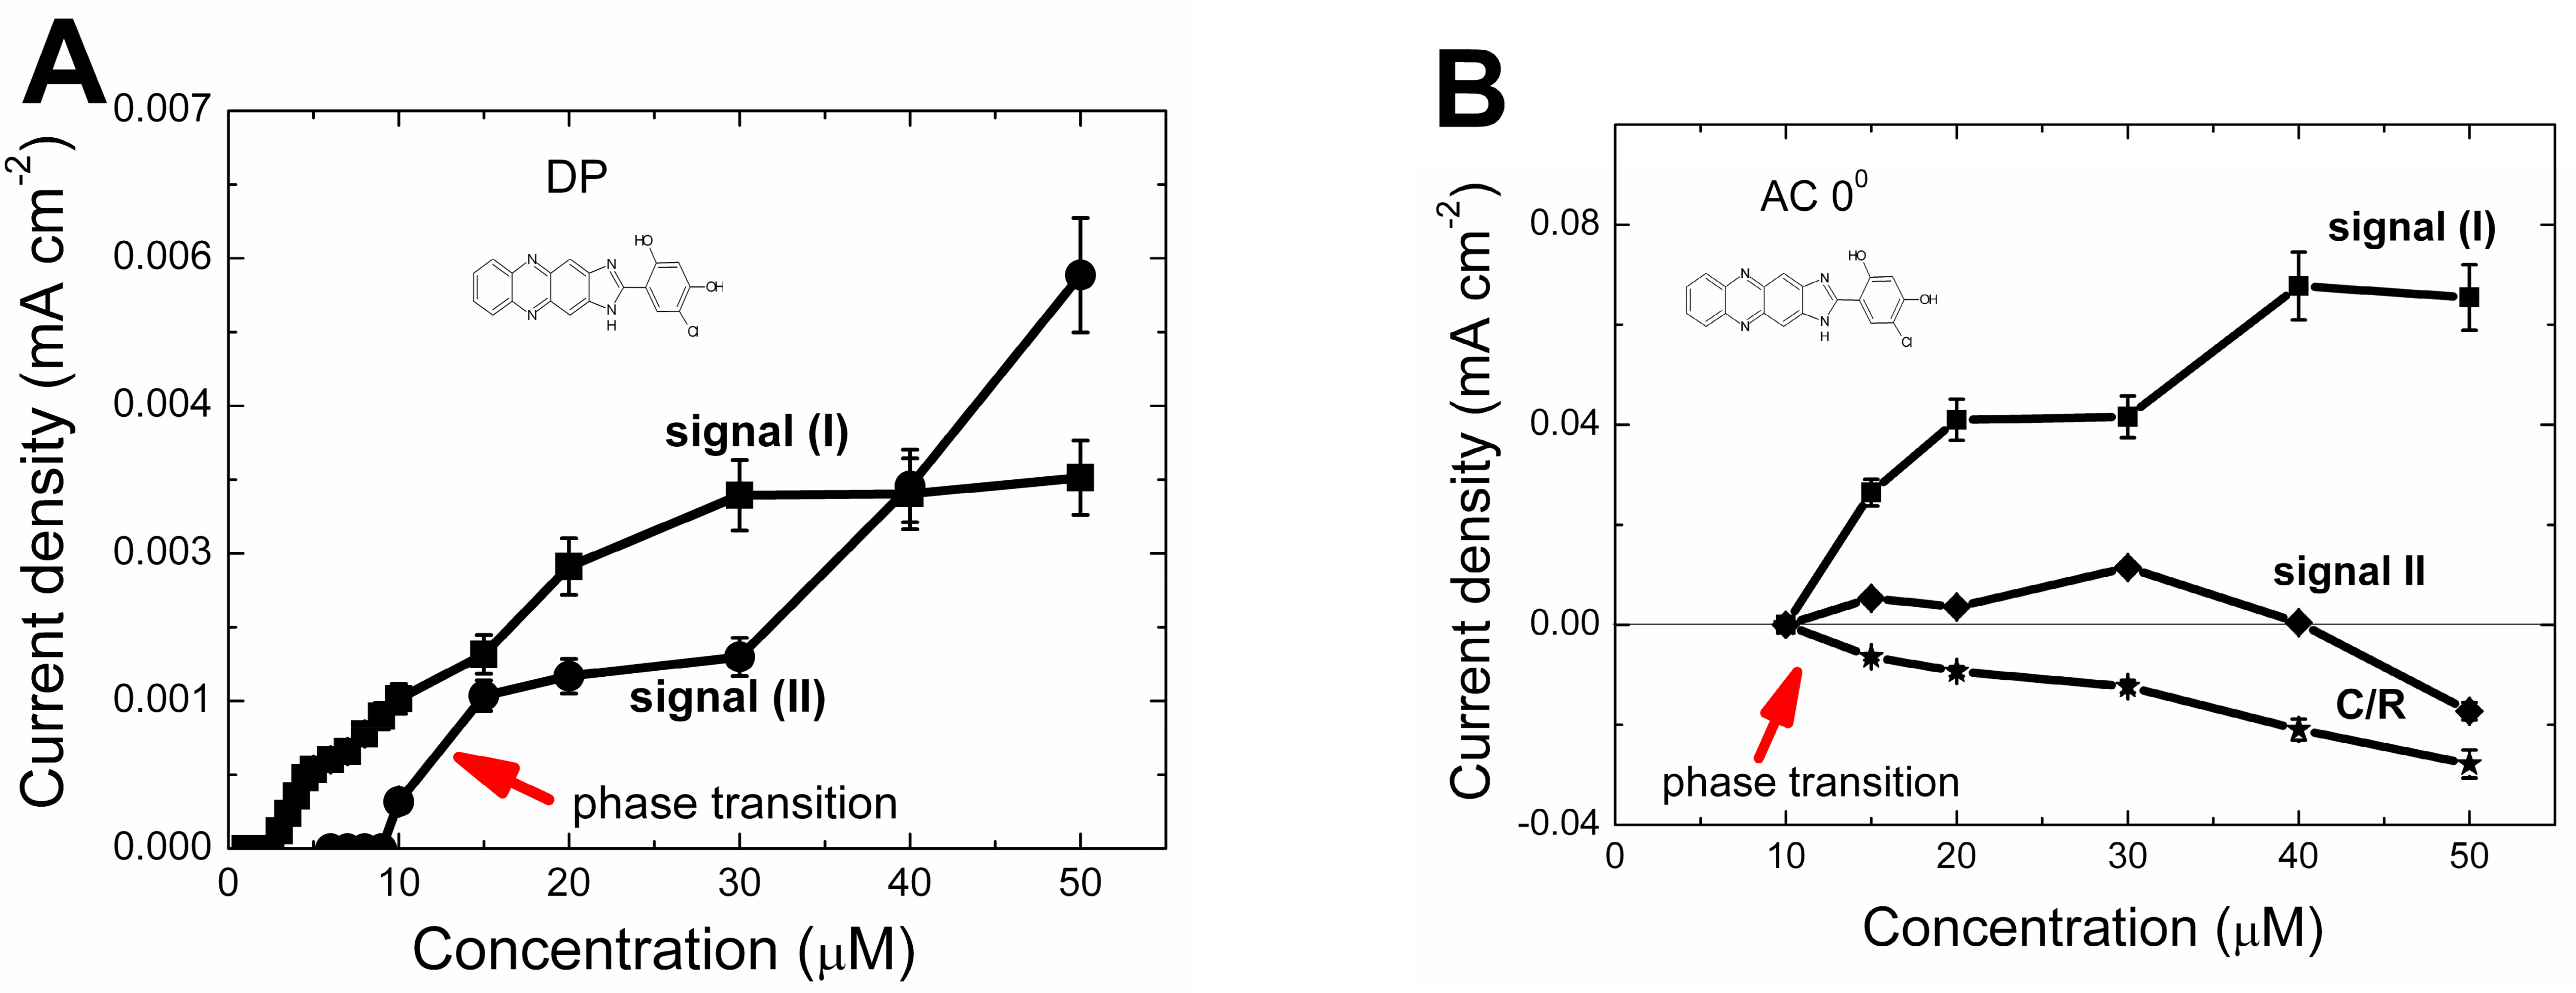
Figure 7A,B visualize the relations between the redox signals and C/R signals. In Figure 7A, redox signals (I) and (II) are calculated from the DP measurements, and in Figure 7B, redox signals (I) and (II) are calculated from the AC(0°) measurements. Additionally, Figure 7B also shows the AC(0°) signal, related to the C/R lowering. The AC(0°) signals can only be calculated at concentrations higher than ca. 10 µM, i.e., when C/R lowering is seen.
Surprisingly, this C/R lowering is accompanied by the increase in signal (I) and the expected decrease in signal (II). Signals (I) and (II) calculated from the DP measurements show a similar trend. At low compound concentrations, signal I dominates over signal II, and this trend is reversed at high compound concentrations, in agreement with the AC(0°) data. Apparently, the change in the orientation of the compound with molecular crowding results in activation of signal (II) over signal (I). Such a reorientation might be an interesting feature of the accumulation of the compound within the plasmid layers.
The correlation of the signals described above points unequivocally to the cause of the lowering of the C/R as related to the increased interactions of the compound molecules due to their crowding on the electrode surface. This might be accompanied by the condensation of the molecules due to the increased interactions (stacking interactions) between the ring-containing compounds. A similar phenomenon might be expected when the compound is accumulated in the pGEX-4T-2 plasmid. Recently, the reversible dissolution and growth of DNA condensates has been studied [95].

3.3. Redox-Specific Accumulation and Condensation

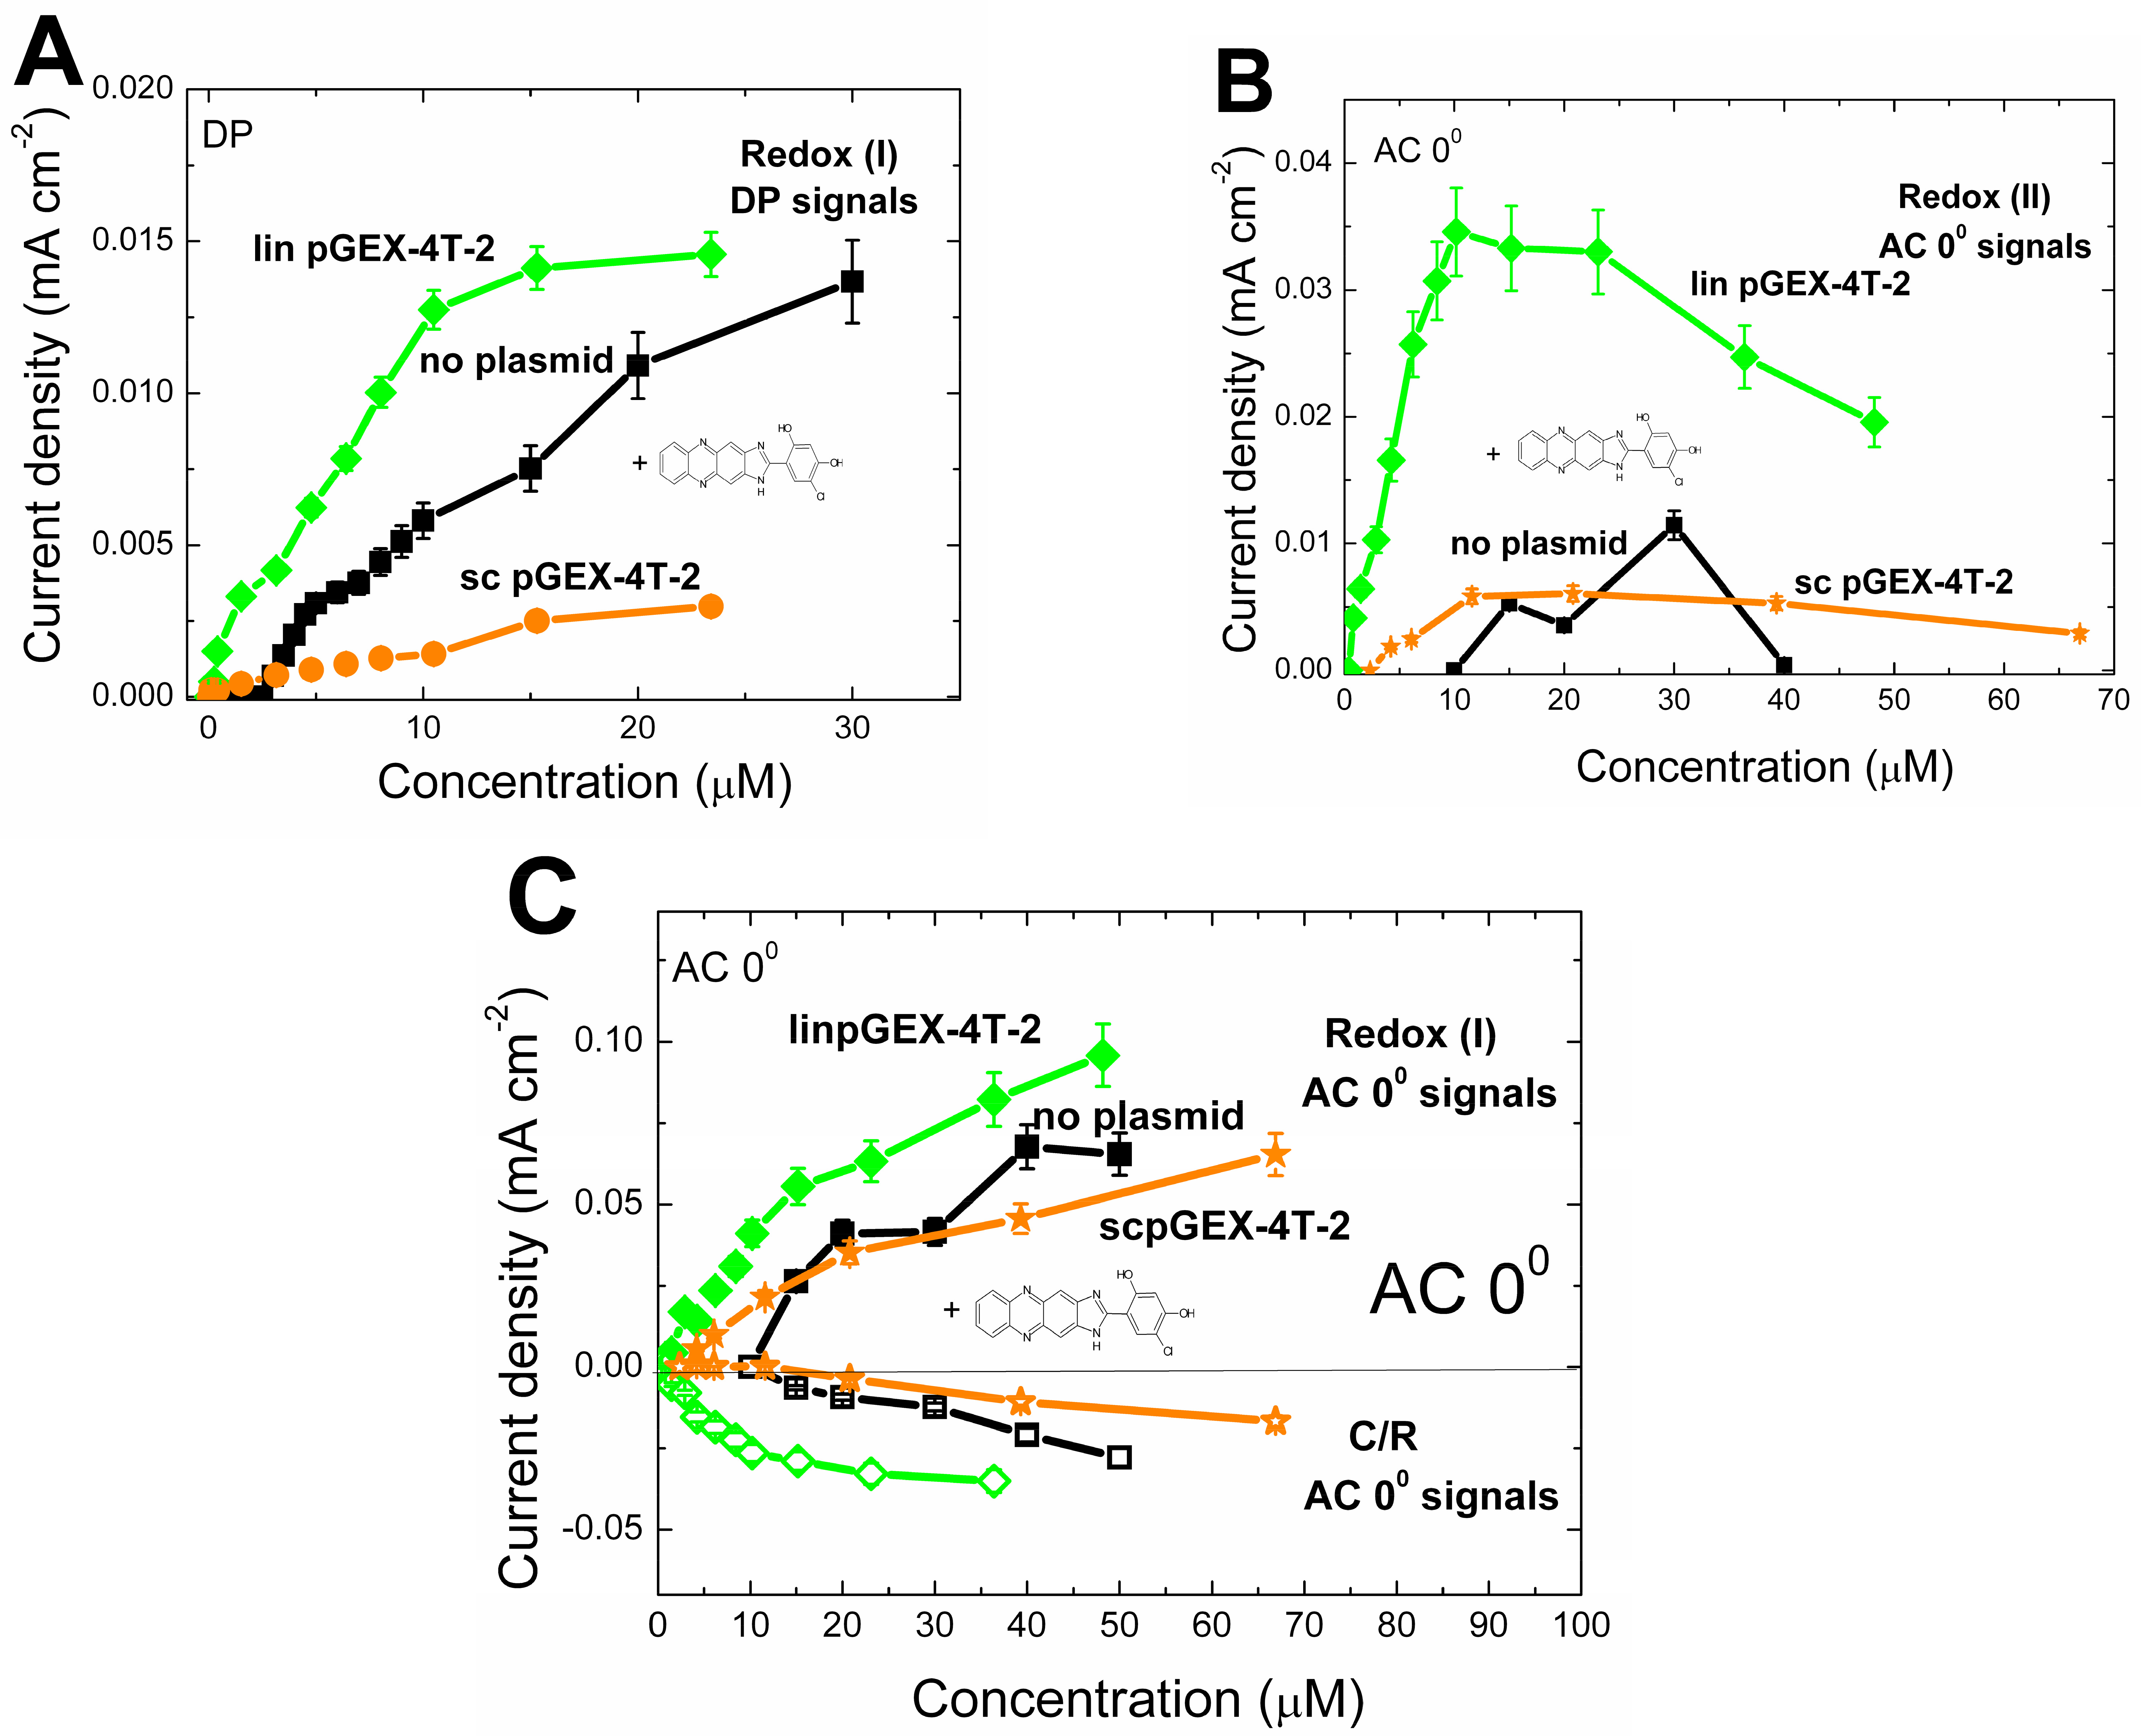
Figure 8A–C show the accumulation plots for the compound incorporation into either the linear (green lines) or superhelical (orange lines) pGEX-4T-2 plasmid in comparison with the accumulation plots obtained for the adsorption of the compound on a bare GC electrode (black lines). In each case, the opposite trend in signals (II) (Figure 8B) and (I) (Figure 8C) at high compound concentrations can be particularly well observed on the AC(0°) runs. After the initial increase, particularly for the linear plasmid, signal (II) decreases and is accompanied by an increase in signal (I). From the AC(0°) runs, we can also detect the formation of a condensed layer, seen as a decrease in the C/R signal (Figure 8C), while the DP signal (I) (Figure 8A) either still increases with the compound accumulation (black line) or reaches a plateau (green and orange lines). Apparently, the accumulation of the compound is accompanied by its condensation within the plasmids, or on bare GC. This accumulation is redox-specific: signal (I) increases while signal (II) diminishes.
Figure 8A–C also show the consistency of the results obtained using two different voltammetric methods. It should be mentioned, though, that the voltammetric runs were taken in the same experiment, and only with a ca. 20 min. interval. Interestingly, using only AC(0°), as shown in Figure 8C, both the C/R signal and redox signal (I) can be obtained in one single set of data.

3.4. The Relevance of Plasmid Superhelicity for the Oxidation of Nucleic Acid Bases in the Presence of the Compound

The preferential, redox-specific binding of the compound to the supercoiled pGEX-4T-2 vs. the linear one results from other features which distinguish sc plasmid from its linear counterpart. These are related to the interplay between the oxidation of the compound and the oxidation of the nucleic acid bases. Except for the effect of the superhelicity on the oxidation of the plasmid nucleic bases, the other effect might be the exposure of the nucleic bases due to DNA damage.

3.4.1. Possible Mediation of Nucleic Acid Oxidation by Supercoiled pGEX-4T-2 Plasmid

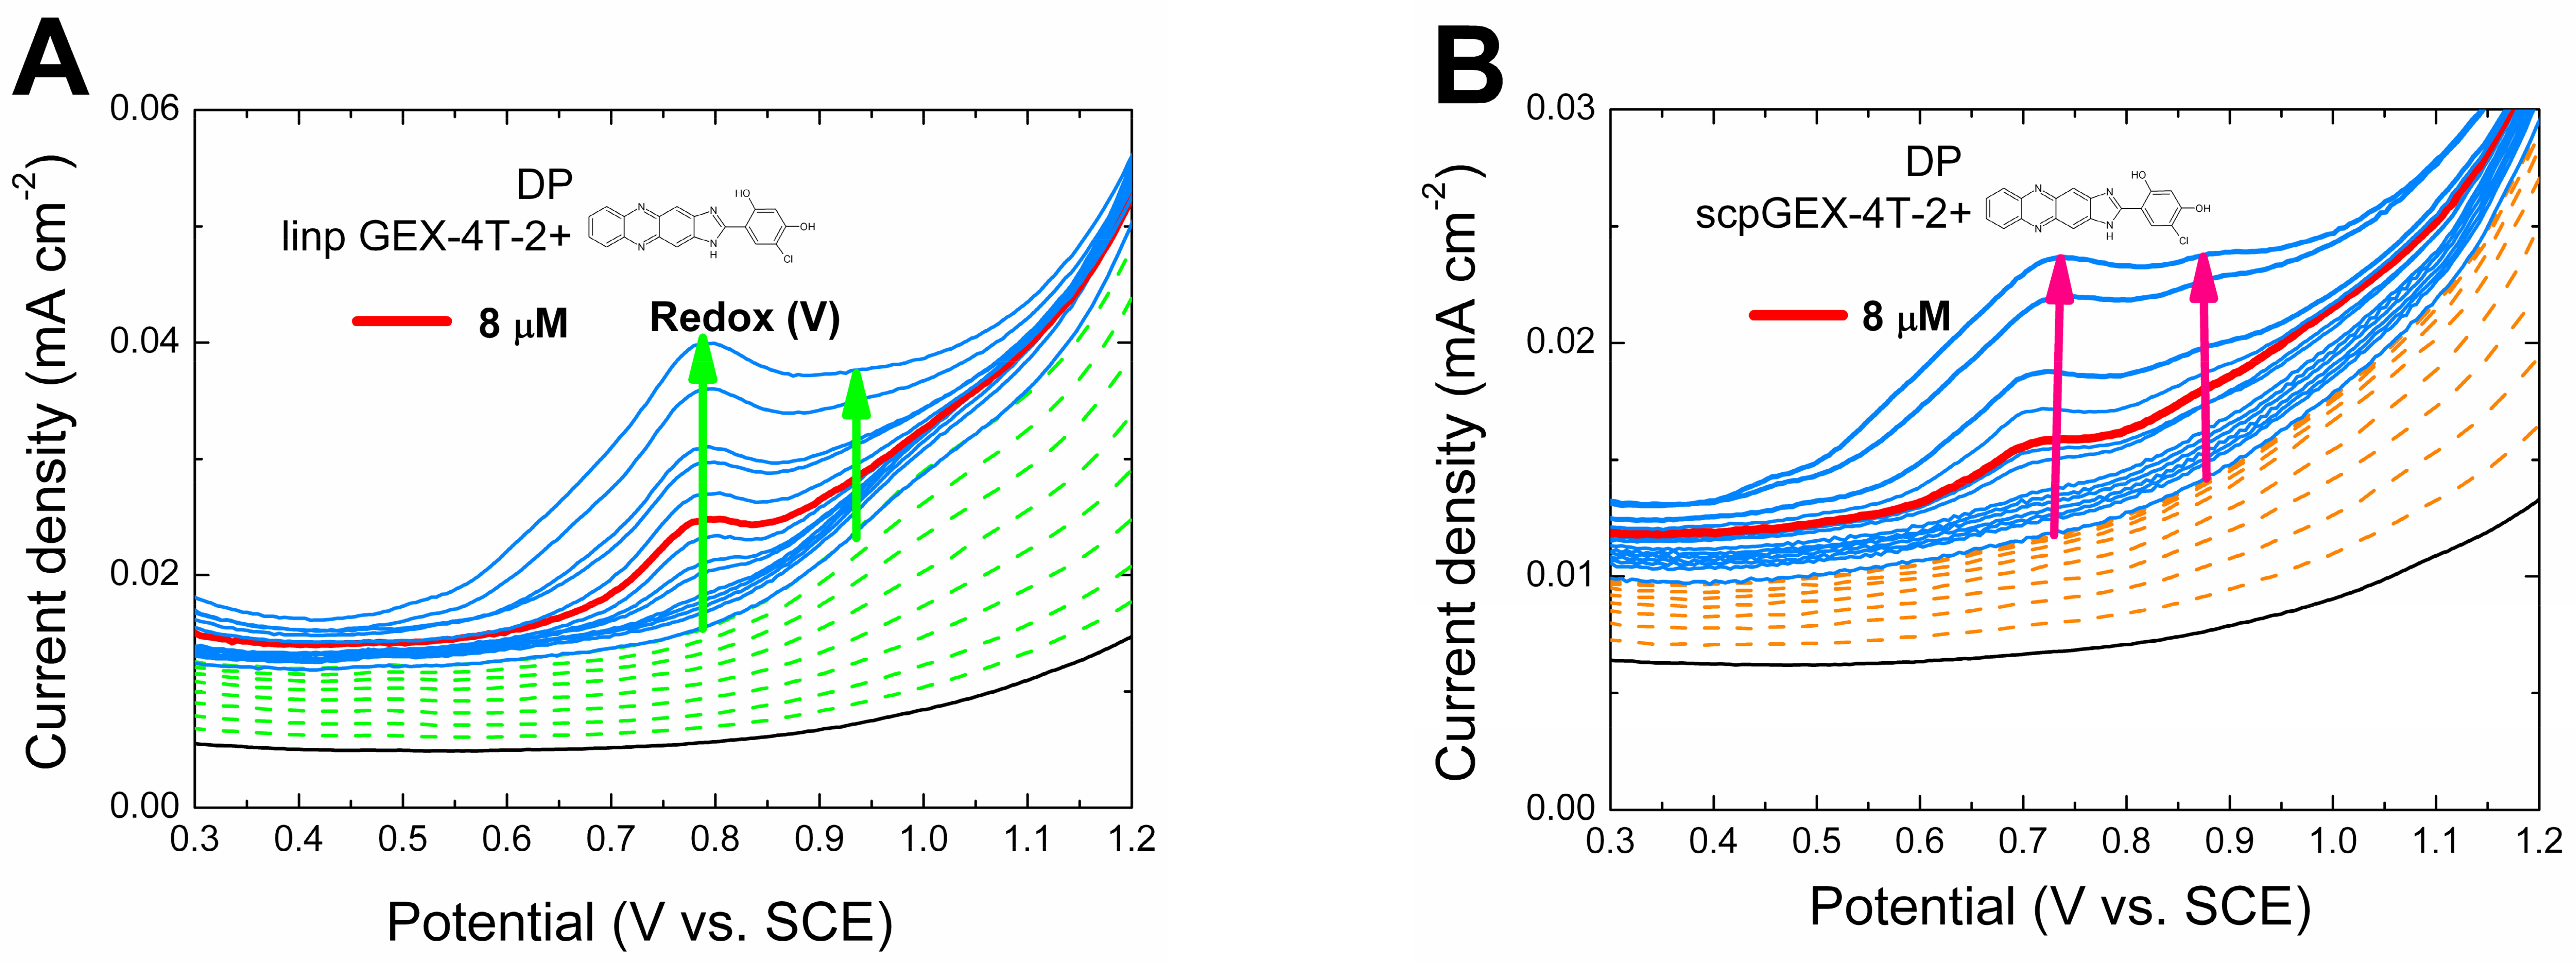
Figure 9A,B shows the magnification of the DP runs for the linear and superhelical plasmids, respectively. The difference in the shapes of the compound peak (V) is evident when the currents are compared at the peak maximum and at 0.9 V. In the case of the sc plasmid, an additional peak at 0.9 V appears, suggesting that the superhelicity might enhance the oxidation of the nucleic acid bases, which is possible at potentials higher than 0.7 V but is usually difficult to observe due to the slow redox reaction of DNA. It is possible, therefore, that the interactions of the compound with superhelical pGEX-4T-2 result from mediation, i.e., the enhancement of the electron transfer through the plasmid DNA.
The mediation of the DNA electron transfer by a variety of compounds (redox probes) has been postulated and proven in many experiments, e.g. for compounds such as: Methylene Blue (MB) [37,38,63], anthraquinone (AQ) [36,38,64], and Nile Blue (NB) [38], as well as a number of Ru or Os complexes [96,97]. Often, the reduction in the redox probe was examined, and the appearance of the signal was taken as a proof of the efficient electron transfer through the DNA duplex. Usually, the duplexes were attached to the gold (or carbon HOPG) surfaces via an alkanethiol linker, and the redox probes were sometimes covalently attached to the DNA in various manners. The mediation through the interaction with the probe has been of interest for a long time and the question of intraduplex, as opposed to interduplex, DNA-mediated electrochemistry [38] has been brought to attention, as well as the possibility of the charge traveling along the counterions associated with the sugar phosphate backbone [98]. Radical-mediated strand brakes [99], another type of mediation of the DNA electron transfer, has also been taken into account in in the mechanism of charge transfer through the DNA, possibly leading to the oxidation of deoxyribose [100], or adduct formation [101]. Mechanisms of charge transfer through the DNA other than mediation have also recently been suggested [98] due to the postulated unspecific weak interactions in loosely packed DNA monolayers consisting of redox-labeled DNA duplexes end-tethered to gold electrodes.
In this work, the compound under study, a prospective anticancer drug, may be regarded as a redox probe.

3.4.2. Exposure of Nucleic Acid Bases

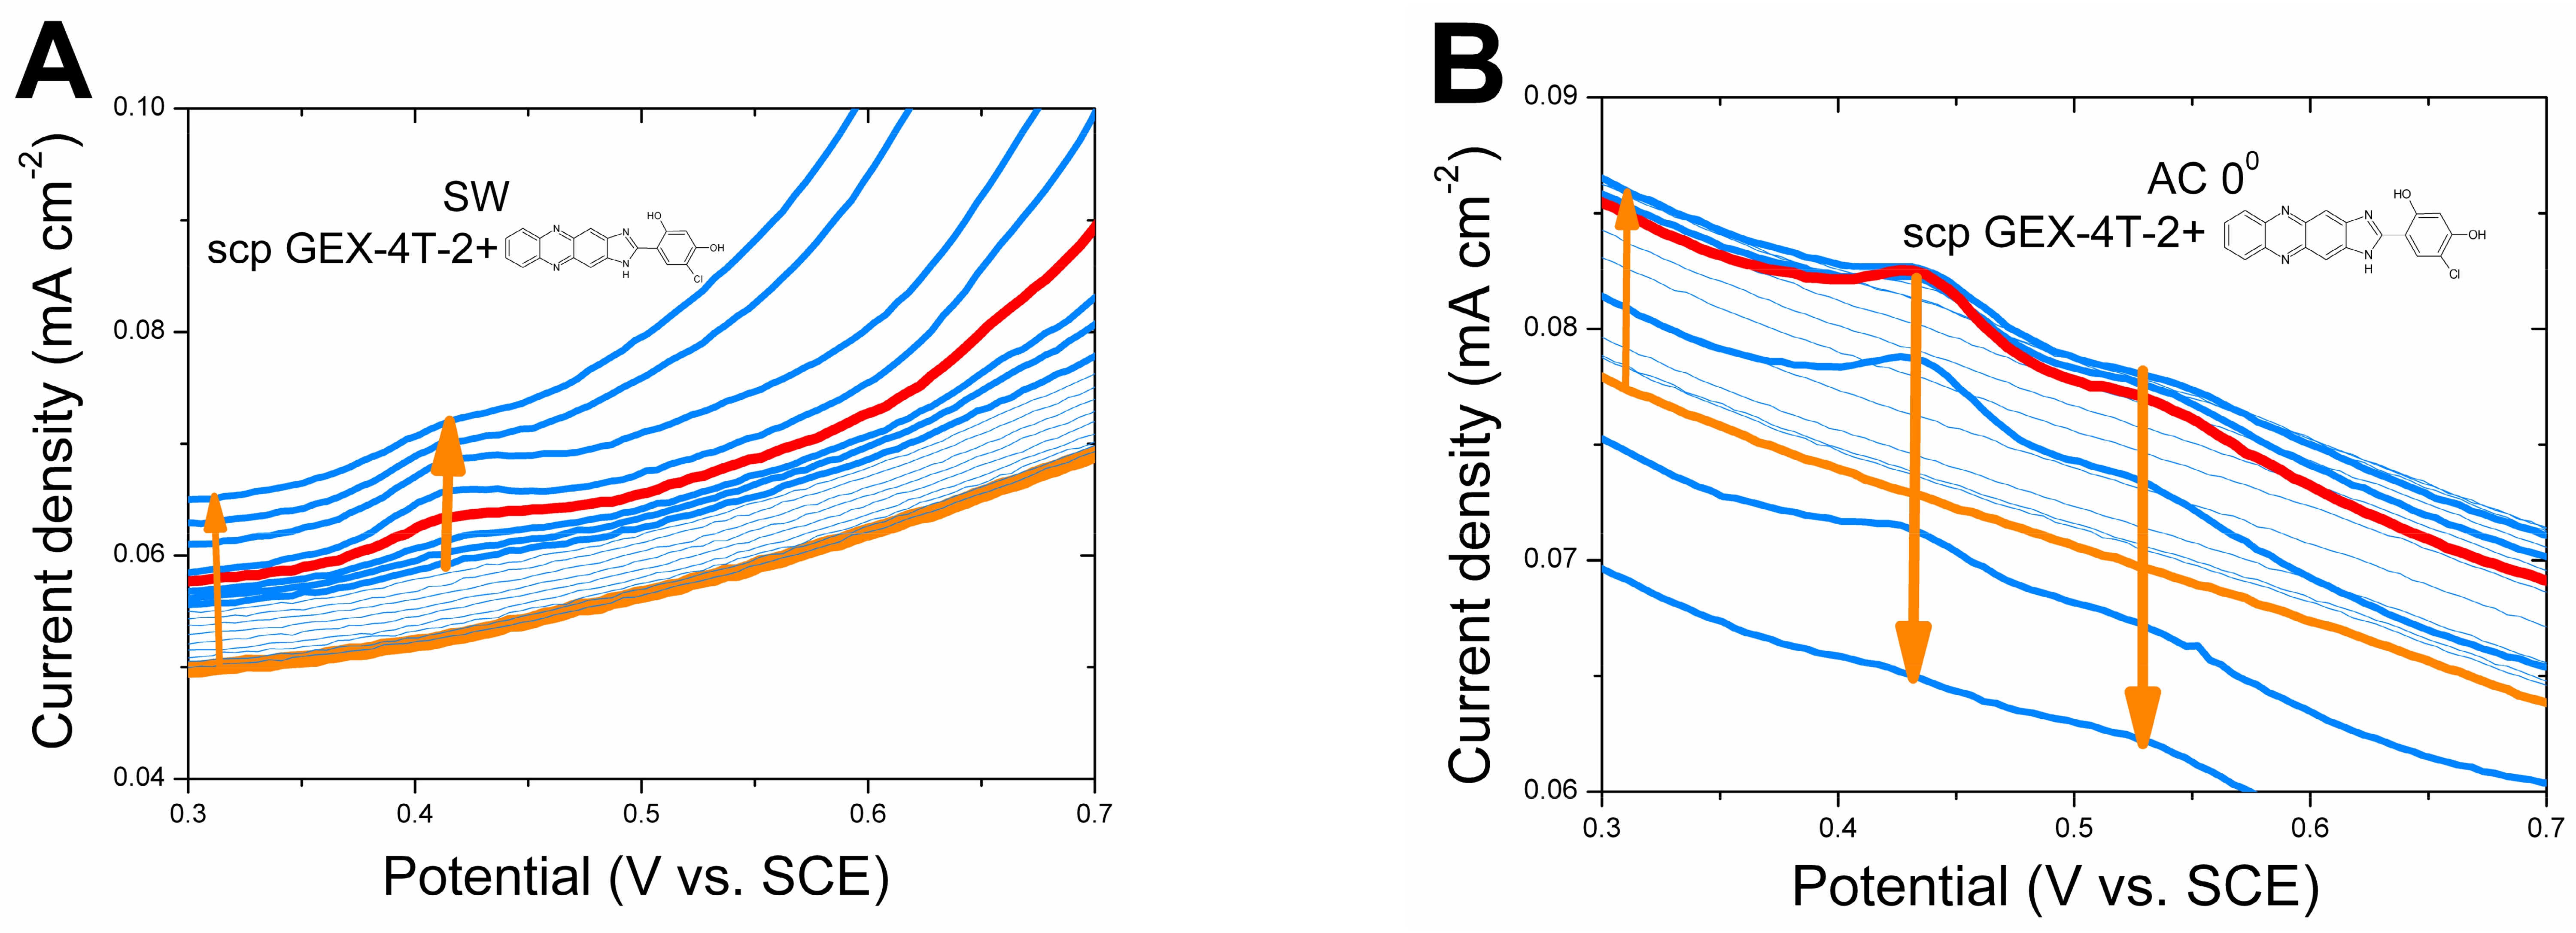
Another difference in the types of interactions of the compound with the linear and superhelical pGEX-4T-2 is in the possible decomposition of the plasmid DNA, which can be seen either as a signal of the guanine released or exposed to the electrode surface (at ca. 0.8V vs. the SCE at pH 4.7) or a signal of 8-oxyguanine (at ca. 0.4 V vs. the SCE at pH 4.7) [51,55,72] due to the oxidative damage of the DNA. As shown in Figure 10A,B, the accumulation of the compound results in the appearance of an additional SW peak at ca. 0.42 V, suggesting the release and/or exposure of guanine bases, i.e., DNA decomposition, as a result of the interactions between the compound and the plasmid. This effect is only observed in the case of the superhelical plasmid, confirming the difference in the DNA–compound interactions for the linear and superhelical pGEX-4T-2. It should be noted that the electrochemical experiments were performed over a time period of 6–8 h, which is usually sufficient to observe DNA decomposition.
This conclusion regarding the decomposition of the plasmid DNA in the presence of the compound under investigation could possibly be ruled out by taking into account the fact that the peak at ca. 0.42 V appears only at the intermediate concentrations of the compound within the DNA layers, while the overall current increase at high positive potentials (due to enhanced DNA oxidation) even when the peak at 0.42 V diminishes, and importantly, all DP signals, (I) to (V), still increase. It seems possible, therefore, that the peak at 0.42 V reflects the exposure of the nucleic acid bases in the process of the DNA helix transformation into a new structure. No evident decomposition of the plasmid DNA is observed.

4. Conclusions

The electrochemical methods offer a plethora of information about the interactions of potential anticancer drugs with DNA. Not only is DNA binding detected but detailed information about the redox properties, change in orientation, condensation, interplay between the drug and DNA oxidation, DNA decomposition, etc., can also be obtained in one, carefully performed experiment. In this work, the compound under study, a prospective anticancer drug, may be regarded as a redox probe, similar to MB or organometallic complexes. Instead of the typical monitoring of the reduction in such a probe, we looked at the interplay between multiple signals of the compound and the nucleic acid oxidation signal. Additionally, the use of AC voltammetry simultaneously with DP voltammetry proved the reorientation of the compound within the DNA layers, followed by its condensation. This reorientation is redox-specific: one of the signals (I) increases, while the other (II) diminishes. For the accumulation of the compound within the supercoiled plasmid, only signal (I) was observed at all compound concentrations from 1 µM to 50 µM, suggesting exceptionally strong interactions reflected in signal (I) and related to the superhelicity of the pGEX-4T-2 plasmid. For the supercoiled plasmid, the exposure of the nucleic acid bases accompanying the compound accumulation was also observed, which, surprisingly, did not seem to lead to the DNA decomposition but rather to the change in the DNA structure with the compound binding.

Author Contributions

Conceptualization and Methodology: electrochemistry—H.E., M.M.-Z. and P.J.K., Cl-IPBD synthesis—A.N. and M.M.K., plasmids preparation and handling—A.G.; investigation: electrochemistry—D.J. and A.B., synthesis—M.M.K.; plasmid preparation—D.J. and A.B.; student’ supervision—D.J. and A.B.: electrochemistry—H.E., plasmid preparation—A.G.; investigation, writing—original draft preparation, H.E.; writing—review and editing, H.E., M.M.-Z. and P.J.K. All authors have read and agreed to the published version of the manuscript.

Funding

This research received no external funding.

Institutional Review Board Statement

Not applicable.

Informed Consent Statement

Not applicable.

Data Availability Statement

Data is unavailable due to privacy.

Acknowledgments

The authors would like to thank Krzysztof Staroń (Faculty of Biology, U.W.) for his insight and support in understanding plasmid structure and preparation (superhelical and linear forms) and Sławomir Sęk (Faculty of Chemistry, U.W.) for providing AFM images of plasmids immobilized on Glassy Carbon plate electrodes. We are also grateful to Katarzyna Michalska for preparing the sc and lin forms of the pGEX-4T-2 plasmid.

Conflicts of Interest

The authors declare no conflict of interest.

Abbreviations

The following abbreviations are used in this manuscript:
DNADeoxyribonucleic Acid
BMMethylene Blue
RBRiboflavin
RURutin
CVCyclic Voltammetry
SWVSquare Wave Voltammetry
DPVDifferential Pulse Voltammetry
AC(0°)Alternating Current Voltammetry

References

  1. Sherratt, D.J. Bacterial Plasmids. Cell 1974, 3, 189–195. [Google Scholar] [CrossRef]
  2. Palecek, E. Local supercoil-stabilized DNA structures. Crit. Rev. Biochem. Mol. Biol. 1991, 26, 151–226. [Google Scholar] [CrossRef] [PubMed]
  3. Ljungman, M.; Hanawalt, P.C. Localized torsional tension in the DNA of human cells. Proc. Natl. Acad. Sci. USA 1992, 89, 6055–6059. [Google Scholar] [CrossRef]
  4. Serban, D.; Benevides, J.M.; Thomas, G.J., Jr. DNA secondary structure and Raman markers of supercoiling in Escherichia coli plasmid pUC19. Biochemistry 2002, 41, 847–853. [Google Scholar] [PubMed]
  5. Liu, L.F.; Wang, J.C. Supercoiling of the DNA template during transcription. Proc. Natl. Acad. Sci. USA 1987, 84, 7024–7027. [Google Scholar] [CrossRef]
  6. Leng, F.; McMacken, R. Potent stimulation of transcription-coupled DNA supercoiling by sequence-specific DNA-binding proteins. Proc. Natl. Acad. Sci. USA 2002, 99, 9139–9144. [Google Scholar] [CrossRef]
  7. Leng, F.; Armado, L.; McMacken, R. Coupling DNA supercoiling to transcription in defined protein systems. J. Biol. Chem. 2004, 279, 47564–47571. [Google Scholar] [CrossRef] [PubMed]
  8. Ma, J.; Bai, L.; Wang, M.D. Transcription under torsion. Science 2013, 340, 1580–1583. [Google Scholar] [CrossRef]
  9. Zhi, X.; Leng, F. Dependence of transcription-coupled DNA supercoiling on promoter strength in Escherichia coli.Topoisomerase I deficient strains. Gene 2013, 514, 82–90. [Google Scholar] [CrossRef]
  10. Fulcrand, G.; Dages, S.; Zhi, X.; Chapagin, P.; Gerstman, B.S.; Dunlap, D.; Leng, F. DNA supercoiling, a critical signal regulating the basal expression of the lac operon in Escherichia coli. Sci. Rep. 2016, 6, 19243. [Google Scholar] [CrossRef]
  11. Visser, B.J.; Sharma, S.; Chen, P.J.; McMullin, A.B.; Bates, M.L.; Bates, D. Psolaren mapping reveals a bacterial genome supercoiling landscape dominated by transcription. Nucleic Acids Res. 2022, 50, 4436–4449. [Google Scholar] [CrossRef] [PubMed]
  12. Janissen, R.; Barth, R.; Polinder, M.; van der Torre, J.; Dekker, C. Single-molecule visualization of twin-supercoiled domains generated during transcription. Nucleic Acids Res. 2023, 52, 1677–1687. [Google Scholar]
  13. Sarica, N.; Janniere, L.; Jester, B.C. Towards a better control of engineered circuit transcription in bacterial genomes. Appl. Microbiol. 2025, 5, 17–21. [Google Scholar] [CrossRef]
  14. Radler, J.O.; Koltover, J.; Salditt, T.; Safinya, C.R. Structure of DNA-cationic liposome complexes: DNA intercalation in multilamellar membranes in distinct interhelical packing regimes. Science 1997, 340, 1580–1583. [Google Scholar]
  15. Tros de Ilarduya, C.; Sun, Y.; Duzgunes, N. Gene delivery by lipoplexes and polyplexes. Eur. J. Pharm. Sci. 2010, 40, 159–170. [Google Scholar] [CrossRef]
  16. Meyer, M.; Wagner, E. Recent developments in the application of plasmid DNA-based vectors and small interfering RNA therapeutics for cancer. Hum. Gene Ther. 2006, 17, 1062–1076. [Google Scholar] [CrossRef]
  17. Fioretti, D.; Iurescia, S.; Fazio, V.M.; Rinaldi, M. DNA vaccines: Developing new strategies against cancer. J. Biomed. Biotechnol. 2010, 2010, 174378. [Google Scholar] [CrossRef] [PubMed]
  18. Prazeres, D.M.F.; Monteiro, G.A. Plasmid Biopharmaceuticals. Microbiol. Spectr. 2014, 2, 669–688. [Google Scholar] [CrossRef]
  19. Martinez-Puente, D.H.; Perez-Trujillo, J.J.; Zavala-Flores, L.M.; Garcia-Garcia, A.; Villanueva-Olivo, A.; Rodriguez-Rocha, H.; Valdes, J.; Saucedo-Cardenas, O.; Montes de Oca-Luna, R.; de Jesus Loera-Arias, M. Plasmid DNA for therapeutic applications in cancer. Pharmaceutics 2022, 14, 1861–1888. [Google Scholar] [CrossRef]
  20. Friedman, T.A. A Brief History of Gene Theraphy. Nat. Genet. 1992, 2, 93–98. [Google Scholar] [CrossRef]
  21. Brăzdova, M.; Navratilova, L.; Tichy, V.; Nemcova, K.; Lexa, M.; Hrstka, R.; Pečinka, P.; Adamik, M.; Vojtesek, B.; Paleček, E. Preferential binding of hot spot mutant p53 proteins to supercoiled DNA in vitro and in cells. PLoS ONE 2013, 8, e59567. [Google Scholar] [CrossRef]
  22. Almeida, A.M.; Eusebio, D.; Queiroz, J.A.; Sousa, F.; Sousa, A. Minicirce DNA vaccine purification and E7 antigen expresion assesment. In DNA Vaccines; Methods in MoleculaR Biology (Clifton, N.J.); Humana Press: New York, NY, USA, 2021; Volume 2197, pp. 207–222. [Google Scholar]
  23. Cho, Y.; Lee, J.B.; Hong, J. Controlled release of an anti-cancer drug from DNA structured films. Sci. Rep. 2014, 4, 4078. [Google Scholar] [CrossRef]
  24. Chaires, J.B. Drug-DNA interactions. Curr. Opin. Struct. Biol. 1998, 8, 314–320. [Google Scholar] [CrossRef] [PubMed]
  25. Palchaudhuri, R.; Hergenrother, P.J. DNA as a target for anticancer compounds: Methods to determine the mode of binding and the mechanism of action. Curr. Opin. Biotechnol. 2007, 18, 497–503. [Google Scholar] [CrossRef] [PubMed]
  26. Hicks, M.R.; Orkey, N.U.; Pisani, M.J.; Collins, J.G.; Wheate, N.J.; Aldrich-Wright, J.R. Using spectroscopic techniques to examine drug-DNA interactions. In Methods for Studying Nucleic Acid/Drug Interactions; Wanunu, M., Tor, Y., Eds.; CRC Press: New York, NY, USA, 2012; pp. 1–42. [Google Scholar]
  27. Sirajuddin, M.; Ali, S.; Badshah, A. Drug-DNA interactions and their study by UV-Visible, Fluorescence Spectroscopies and Cyclic Voltametry. J. Photochem. Photobiol. B Biol. 2013, 124, 1–19. [Google Scholar] [CrossRef]
  28. Palumbo, M.; Capasso, L.; Palu, G.; Marciani Magno, S. Conformational aspects of drug-DNA interactions: Studies on anthracycline antibiotics and psoralen. J. Biosci. 1985, 8, 689–697. [Google Scholar] [CrossRef]
  29. Wilhelmson, L.M.; Westerlund, F.; Lincoln, P.; Norden, B. DNA-binding of semirigid binuclear ruthenium complex delta,delta-[mu-(11,11′-bidppz)(phen)(4)ru(2)](4+): Extremely slow intercalation kinetics. J. Am. Chem. Soc. 2002, 124, 12092–12093. [Google Scholar] [CrossRef]
  30. Wu, L.; Reymer, A.; Persson, C.; Kazimierczuk, K.; Brown, T.; Lincoln, P.; Norden, B.; Billeter, M. Initial DNA interactions of the binuclear threading intercalator ∆,∆-[µ-bidppz(bipy)4Ru2]4+: An NMR study with [dCGCGAATTCGCG]2. Chem. Eur. J. 2013, 19, 5401–5410. [Google Scholar] [CrossRef] [PubMed]
  31. Osburne, M.S.; Zavodny, S.M.; Peterson, G.A. Drug-induced relaxation of supercoiled plasmid DNA in Bacillus subtilis and induction of the SOS response. J. Bacteriol. 1988, 170, 442–445. [Google Scholar] [CrossRef]
  32. Gadsby, E.D. Drug-DNA Interactions and Condensations: Investigation with Atomic Force Microscopy. Ph.D. Dissertation, Georgia Institute of Technology, Atlanta, GA, USA, 2004. [Google Scholar]
  33. Malina, J.; Farrell, N.P.; Brabec, V. DNA condensing effects and sequence selectivity of DNA binding of antitumor noncovalent polynuclear platinum complexes. Inorg. Chem. 2014, 53, 1662–1671. [Google Scholar] [CrossRef]
  34. Fiebig, T.; Wan, C.; Kelley, S.O.; Barton, J.K.; Zewail, A.H. Femtosecond dynamics of the DNA intercalator ethidium and electron transfer with mononucleotides in water. Proc. Natl. Acad. Sci. USA 1999, 96, 1187–1192. [Google Scholar] [CrossRef]
  35. Wan, C.; Fiebig, T.; Kelley, S.O.; Treadway, C.R.; Barton, J.K.; Zewail, A.H. Femtosecond dynamics of DNA-mediated electron transfer. Proc. Natl. Acad. Sci. USA 1999, 96, 6014–6019. [Google Scholar] [CrossRef] [PubMed]
  36. Gorodetsky, A.A.; Green, O.; Yavin, E.; Barton, J.K. Coupling into the base pair stack is necessary for DNA-mediated electrochemistry. Bioconjugate Chem. 2007, 18, 1434–1441. [Google Scholar] [CrossRef][Green Version]
  37. Gorodetsky, A.A.; Buzzeo, M.C.; Barton, J.K. DNA-mediated electrochemistry. Bioconjugate Chem. 2008, 19, 2285–2296. [Google Scholar] [CrossRef]
  38. Pheeney, C.G.; Barton, J.K. Intraduplex DNA-mediated electrochemistry of covalently tethered redox-active reporters. J. Am. Chem. Soc. 2013, 135, 14944–14947. [Google Scholar][Green Version]
  39. Ramotowska, S.; Ciesielska, A.; Makowski, M. What can electrochemical methods offer in determining DNA-drug interactions? Molecules 2021, 26, 3478. [Google Scholar] [CrossRef]
  40. Palecek, E. New trends in electrochemical analysis of nucleic acids. Bioelectrochem. Bioenerg. 1988, 20, 179–194. [Google Scholar]
  41. Paleček, E. Past, present and future of nucleic acids electrochemistry. Talanta 2002, 56, 809–819. [Google Scholar] [CrossRef]
  42. Erdem, A.; Ozsoz, M. Electrochemical DNA biosensors based on DNA-drug interactions. Electroanalysis 2002, 14, 965–974. [Google Scholar] [CrossRef]
  43. Rauf, S.; Gooding, J.J.; Akhtar, K.; Ghauri, M.A.; Rahman, M.; Anwar, M.A.; Khalid, A.M. Electrochemical approach of anticancer drugs-DNA interaction. J. Pharm. Biomed. Anal. 2005, 37, 205–217. [Google Scholar] [PubMed]
  44. Paleček, E.; Bartosik, M. Electrochemistry of nucleic acids. Chem. Rev. 2012, 112, 3427–3481. [Google Scholar] [CrossRef]
  45. Sato, S.; Takenaka, S. Electrochemical approaches to the study of DNA/drug interactions. In Methods for Studying Nucleic Acid/Drug Interactions; Wanunu, M., Tor, Y., Eds.; CRC Press: New York, USA, 2012; pp. 241–260. [Google Scholar]
  46. Ferapontova, E.E. DNA electrochemistry and electrochemical sensor for nucleic acids. Ann. Rev. Anal. Chem. (Palo. Alto. Calif.) 2018, 11, 197–218. [Google Scholar] [CrossRef] [PubMed]
  47. Ferapontova, E.E. Electron transfer in DNA at electrified interfaces. Chem. Asian J. 2019, 14, 3773–3781. [Google Scholar] [CrossRef]
  48. Oliveira-Brett, A.M.; Serrano, S.H.P.; Gutz, I.; La-Scalea, M.A.; Cruz, M.L. Voltammetric behavior of nitroimidazoles at a DNA-biosensor. Electroanalysis 1997, 9, 1132–1137. [Google Scholar] [CrossRef]
  49. Wang, J.; Ozsoz, M.; Cai, X.; Rivas, G.; Shiraishi, H.; Grant, D.H.; Chicharro, M.; Fernandes, J.; Palecek, E. Interactions of antitumor drug daunomycin with DNA in solution and at the surface. Bioelectrochem. Bioenerg. 1998, 45, 33–40. [Google Scholar] [CrossRef]
  50. La-Scalea, M.A.; Serrano, S.H.P.; Ferreira, E.I.; Oliveira-Brett, A.M.O. Voltammetric behavior of benznidazole at a DNA-electrochemical biosensor. J. Pharm. Biomed. Anal. 2002, 29, 561–568. [Google Scholar] [CrossRef]
  51. Oliveira-Brett, A.M.; Vivan, M.; Fernandes, I.R.; Piedade, J.A.P. Electrochemical detection of in situ adriamycin oxidative damage to DNA. Talanta 2002, 56, 959–970. [Google Scholar] [CrossRef] [PubMed]
  52. Satana, H.E.; Oliveira-Brett, A.M. In situ evaluation of fludarabine-DNA interaction using a DNA-electrochemical biosensor. Int. J. Electrochem. 2011, 2011, 1. [Google Scholar] [CrossRef]
  53. Pontinha, A.D.R.; Jorge, S.M.A.; Paquim, A.M.C.; Diculescu, V.C.; Oliveira-Brett, A.M. In situ evaluation of anticancer drug methotrexate-DNA interaction using a DNA-electrochemical biosensor and AFM characterization. Phys. Chem. Chem. Phys. 2011, 13, 5227–5234. [Google Scholar] [CrossRef]
  54. Satana, H.E.; Pontinha, A.D.R.; Diculescu, V.C.; Oliveira-Brett, A.M. Nucleoside analogue, electrochemical behaviour and in situ evaluation of DNA-Clofarabine interaction. Bioelectrochemistry 2012, 87, 3–8. [Google Scholar] [CrossRef]
  55. Lopes, I.C.; Oliveira, S.C.B.; Oliveira-Brett, A.M. In situ electrochemical evaluation of anticancer drug temozolomide and its metabolites-DNA interaction. Anal. Bioanal. Chem. 2013, 405, 3783–3790. [Google Scholar] [CrossRef] [PubMed]
  56. Buoro, R.M.; Lopez, I.C.; Diculescu, V.C.; Serrano, S.H.P.; Lemos, L.; Oliveira-Brett, A.M. In situ evaluation of gemcitabine-DNA interaction using a DNA-electrochemical biosensor. Bioelectrochemistry 2014, 99, 40–45. [Google Scholar] [CrossRef]
  57. Congur, G.; Erdem, A.; Mese, F. Electrochemical investigation of the interaction between topotecan and DNA at disposable graphite electrodes. Bioelectrochemistry 2015, 102, 21–28. [Google Scholar] [CrossRef]
  58. Karadeniz, H.; Eksin, E.; Erdem, A. Electrochemical detection of anticancer drug lumazine and DNA interactions by using carbon nanotube modified electrodes. J. Res. Pharm. 2019, 23, 682–688. [Google Scholar] [CrossRef]
  59. Diculescu, V.C.; Vivan, M.; Oliveira-Brett, A.M. Voltammetric behavior of antileukemia drug Glivec. Part I—Electrochemical study of glivec. Electroanalysis 2006, 18, 180. [Google Scholar] [CrossRef]
  60. Wypych, M.; Ignaczak, A.; Tokarz, P.; Seroka, J.; Koszelska, K.; Smarzewska, S. Theoretical, biological, and electrochemical explanation of the complexity of Peramivir’s drug-DNA interaction. Sci. Rep. 2025, 15, 44594. [Google Scholar] [CrossRef]
  61. Ferapontova, E.E.; Dominguez, E. Direct electrochemical oxidation of DNA on polycrystalline gold electrodes. Electroanalysis 2003, 15, 629–634. [Google Scholar] [CrossRef]
  62. Campos, R.; Kotlyar, A.B.; Ferapontova, E.E. DNA-mediated electron transfer in DNA duplexes tethered to gold electrodes via phosphorothioated dA tags. Langmuir 2014, 30, 11853–11857. [Google Scholar] [CrossRef]
  63. Farjami, E.; Campos, R.; Ferapontova, E.E. Effect of the DNA end of tethering to electrodes on electron transfer in methylene blue-labeled DNA duplexes. Langmuir 2012, 28, 16218–16226. [Google Scholar] [CrossRef]
  64. Jacobsen, M.F.; Ferapontova, E.E.; Gothelf, K.V. Synthesis and electrochemical studies of an anthraquinone-conjugated nucleoside and derived oligonucleotides. Org. Biomol. Chem. 2009, 7, 905–908. [Google Scholar] [CrossRef] [PubMed]
  65. Masuri, S.; Vaňhara, P.; Cabiddu, M.G.; Moráň, L.; Havel, J.; Cadono, E.; Pivetta, T. Copper(II) phenantroline based complexes as potential anticancer drugs: A walkthrough on the mechanism of action. Molecules 2022, 22, 49. [Google Scholar]
  66. Banasiak, A.; Fantoni, N.Z.; Kelet, A.; Colleran, J. Mapping the DNA damaging effect of polypyridyl copper complexes with DNA electroctrochemical biosensor. Molecules 2022, 27, 645. [Google Scholar] [CrossRef]
  67. Fojta, M.; Havran, L.; Palecek, E. Chronopotentiometric detection of DNA strand breaks with mercury electrodes modified with supercoiled DNA. Electroanalysis 1997, 9, 1033–1034. [Google Scholar] [CrossRef]
  68. Fojta, M.; Stankova, V.; Palecek, E.; Koscielniak, P.; Mitas, J. A supercoiled DNA-modified mercury electrode-based biosensor for the detection of DNA strand cleaving agents. Talanta 1998, 46, 155–161. [Google Scholar] [CrossRef]
  69. Fojta, M.; Kubicarova, T.; Palecek, E. Cleavage of supercoiled DNA by deoxyribonuclease I in solution and at the electrode surface. Electroanalysis 1999, 11, 1005–1012. [Google Scholar] [CrossRef]
  70. Oliveira-Brett, A.M.; Piedade, J.A.P.; Serrano, S.H.P. Electrochemical Oxidation of 8-Oxoguanine. Electroanalysis 2000, 12, 969–973. [Google Scholar] [CrossRef]
  71. Fojta, M. Electrochemical sensors for DNA interactions and damage. Electroanalysis 2002, 14, 1449–1463. [Google Scholar] [CrossRef]
  72. Oliveira, S.C.B.; Oliveira-Brett, A.M. Boron doped diamond electrode pre-treatments effect on the electrochemical oxidation of dsDNA, DNA bases, nucleotides, homopolynucleotides and biomarker 8-oxoguanine. J. Electroanal. Chem. 2010, 648, 60–66. [Google Scholar] [CrossRef]
  73. Chiorcea-Paquim, A.-M. 8-oxoguanine and 8-oxodeoxyguanosine biomarkers of oxidative DNA damage: A review on HPLC-ECD determination. Molecules 2022, 27, 1620. [Google Scholar] [CrossRef]
  74. Chiorcea-Paquim, A.-M.; Oliveira-Brett, A.M. DNA electrochemical biosensors for in situ probing of pharmaceutical drug oxidative DNA damage. Sensors 2021, 21, 1125. [Google Scholar] [CrossRef] [PubMed]
  75. Kapuscinski, J.; Darzynkiewicz, Z. Relationship between the pharmacological activity of antitumor drugs metantrone and mitoxantrone (novatrone) and their ability to condense nucleic acids. Proc. Nat. Acad. Sci. USA 1986, 83, 6302–6306. [Google Scholar] [CrossRef] [PubMed]
  76. Hou, X.M.; Zhang, X.H.; Wei, K.J.; Ji, C.; Dou, S.X.; Wang, W.C.; Li, M.; Wang, P.Y. Cisplatin induces loop structures and condensation of single DNA molecules. Nucleic Acids Res. 2009, 37, 1400–1410. [Google Scholar] [CrossRef]
  77. Agafonova, L.E.; Zhdanov, D.D.; Gladilina, Y.A.; Shishparenok, A.N.; Shumyantseva, V.V. Electrochemical approach for the analysis of DNA degradation in native DNA and apoptotic cells. Heliyon 2024, 10, e25602. [Google Scholar] [CrossRef]
  78. Palecek, E.; Fojta, M.; Tomschik, M.; Wang, J. Electrochemical biosensors for DNA hybridization and DNA damage. Biosens. Bioelectron. 1998, 13, 621–628. [Google Scholar] [CrossRef]
  79. Cai, X.; Rivas, G.; Farias, P.A.M.; Shiraishi, H.; Wang, J.; Fojta, M.; Palecek, E. Trace measurements of plasmid DNAs by adsorptive stripping potentiometry at carbon paste electrodes. Bioelectrochem. Bioenerg. 1996, 40, 41–47. [Google Scholar] [CrossRef]
  80. Cai, X.; Rivas, G.; Wang, J.; Palecek, E. Evaluation of different carbon electrodes for adsorptive stripping analysis of nucleic acids. Electroanalysis 1996, 8, 753–758. [Google Scholar] [CrossRef]
  81. Wang, J.; Cai, X.; Wang, J.; Jonsson, C.; Palecek, E. Trace Measurements of RNA by Potentiometric Stripping Analysis at Carbon Paste Electrodes. Anal. Chem. 1995, 67, 4065–4070. [Google Scholar] [CrossRef]
  82. Szpakowska, I.; Krassowska-Swiebocka, B.; Maciejewska, D.; Kazmierczak, P.; Jemielita, W.; Konrad, M.; Trykowska, J.; Maj-Zurawska, M. Electrochemical DNA Biosensor for Testing Pentamidine and Its Analogues as Potential Chemotherapeutics. Electroanalysis 2006, 18, 1422–1430. [Google Scholar] [CrossRef]
  83. Maciejewska, D.; Szpakowska, I.; Wolska, I.; Niemyjska, M.; Mascini, M.; Maj-Zurawska, M. DNA-based electrochemical biosensors for monitoring of bis-indoles as potential antitumoral agents. Bioelectrochemistry 2006, 69, 1–9. [Google Scholar] [CrossRef] [PubMed]
  84. Palinska, A.; Grodzka, A.; Elzanowska, H.; Kepska, B.; Zwierkowska, E.; Achmatowicz, S.; Maj-Zurawska, M. Methylene blue interactions with chromosomal and plasmid DNA on screen-printed carbon electrodes. Electroanalysis 2010, 22, 1306–1313. [Google Scholar] [CrossRef]
  85. Gniazdowska, A.; Palinska-Saadi, A.; Krawczyk, E.; Elzanowska, H.; Maj-Zurawska, M. Supercoiled and linear plasmid DNAs interactions with methylene blue. Bioelectrochemistry 2013, 92, 32–41. [Google Scholar] [CrossRef] [PubMed]
  86. Janiszek, D.; Karpinska, M.M.; Niewiadomy, A.; Girstun, A.; Elzanowska, H.; Maj-Zurawska, M.; Kulesza, P.J. Nucleic Acid-Drug Interactions: An Electrochemical Approach. In Proceedings of the Extended Abstracts, 3rd International Work-Conference on Bioinformatics and Biomedical Engineering, Granada, Spain, 15–17 April 2015; pp. 77–82. [Google Scholar]
  87. Janiszek, D.; Karpinska, M.M.; Niewiadomy, A.; Girstun, A.; Elzanowska, H.; Maj-Zurawska, M.; Kulesza, P.J. Phase Transition Detection in Accumulation of a Potential Anticancer Drug Cl-IPBD with DNA: Supercoiled and Linear pUC19 Plasmids. Electrochim. Acta 2010, 210, 422–434. [Google Scholar] [CrossRef]
  88. Karpinska, M.M.; Matysiak, J.; Niewiadomy, A. Synthesis of Novel 4-(1H-benzimidazol-2-yl)benzene-1,3-diols and Their Cytotoxic Activity against Human Cancer Cell Lines. Arch. Pharmacal Res. 2011, 34, 1639–1647. [Google Scholar] [CrossRef]
  89. Karpinska, M.M.; Matysiak, J.; Niewiadomy, A.; Wietrzyk, J.; Klopotowska, D. Synthesis and biological activity of novel 4- and 6-(1-alkyl/aryl-1H-benzimidazol-2-yl)benzene-1,3-diols. Monatshefte Fur Chem. 2012, 143, 269–276. [Google Scholar] [CrossRef]
  90. Birss, V.I.; Elzanowska, H.; Turner, R.A. The electrochemical behavior of flavin adenine dinucleotide in neutral solutions. Can. J. Chem. 1988, 66, 86–96. [Google Scholar] [CrossRef]
  91. Kamal, M.M.; Elzanowska, H.; Gaur, M.; Kim, D.; Birss, V.I. Electrochemistry of adsorbed flavin adenine dinucleotide in acidic solutions. J. Electroanal. Chem. 1991, 318, 349–367. [Google Scholar] [CrossRef][Green Version]
  92. Elzanowska, H.; van de Sande, J.H. Application of polarography to the study of complexation and stacking interactions of bases in the B-Z helical transition of poly[d(G-C)] and poly[d(G-m5C)] induced by Ni(II) and Mn(II). Bioelectrochem. Bioenerg. 1988, 19, 441–460. [Google Scholar] [CrossRef]
  93. McGarvey, C.; Beck, S.; Quach, S.; Birss, V.I.; Elzanowska, H. Adsorbed lumiflavin at mercury electrode surfaces. J. Electroanal. Chem. 1998, 456, 71–82. [Google Scholar] [CrossRef]
  94. Nishide, G.; Lim, K.; Kobayashi, A.; Qiu, Y.; Hazawa, M.; Ando, T.; Okada, Y.; Wong, R.W. Spatiotemporal Dynamics of Protamine-DNA Condensation Revealed by High-Speed Atomic Force Microscopy. Nucleic Acids Res. 2025, 53, gkaf152. [Google Scholar] [CrossRef]
  95. Agarwal, S.; Osmanovic, D.; Dizani, M.; Klocke, M.A.; Franco, E. Dynamic control of DNA condensation. Nat. Commun. 2024, 15, 1915. [Google Scholar] [CrossRef] [PubMed]
  96. Stemp, E.D.A.; Holmlin, R.E.; Barton, J. Electron transfer between metal complexes bound to DNA: Variations in sequence, donor, and metal binding mode. Inorg. Chim. Acta 2000, 297, 88–97. [Google Scholar] [CrossRef]
  97. Tran, V.T.; Turek-Herman, T.; Ferreira, M.; Martin, K.,N.; Beseiso, D.; Williams, B.R.; Frederic, R.; Gabelica, V.; Burgmayer, S.J.N.; Yatsunyk, L.A. Interactions of ruthenium(II) polypyridyl complexes with human telomeric DNA. J. Inorg. Biochem. 2023, 249, 112388. [Google Scholar] [CrossRef] [PubMed]
  98. Abi, A.; Ferapontova, E.E. Unmediated by DNA electron transfer in redox-labeled DNA duplexes end-tethered to gold electrodes. J. Am. Chem. Soc. 2012, 134, 14499–14507. [Google Scholar] [CrossRef]
  99. LaMarr, W.A.; Sandman, K.M.; Reeve, J.N.; Dedon, P.C. Differential effects of DNA supercoiling on radical-mediated DNA strand breaks. Chem. Res. Toxicol. 1997, 10, 1118–1122. [Google Scholar] [CrossRef] [PubMed]
  100. Collins, C.; Zhou, X.; Wang, R.; Barth, M.C.; Jiang, T.; Coderre, J.A.; Dedon, P.C. Differential Oxidation of Deoxyribose in DNA by γ and α-Particle Radiation. Radiat. Res. 2005, 163, 654–662. [Google Scholar] [CrossRef]
  101. Awada, M.; Dedon, P.C. Formation of the 1, N2-glyoxal adduct of deoxyguanosine by phosphoglycolaldehyde, a product of 3 ‘-deoxyribose oxidation in DNA. Chem. Res. Toxicol. 2001, 14, 1247–1253. [Google Scholar] [CrossRef]
Scheme 1. Schematic of reaction path leading to synthesis of 4-chloro-6-(1H-imidazo [4,5-b]phenazine-2-yl)benzene-1,3-diol; RT in first reaction step stands for sulfinylbis(5-chloro-2,4-dihydroxyphenyl)methanethione) (S5ClDFM).
Dna 06 00029 sch001
Figure 1. DP (A) and AC(0°) (B) voltammograms showing the accumulation of a linear (lin) pGEX-4T-2 plasmid on a GC electrode. Plasmid concentrations in 0.25 M acetate buffer, 18 mM MgCl2 (pH 4.7): black lines—0, i.e., buffer solution; green dashed lines—8.1 pg/mL linpGEX-4T-2. Accumulation times increase in the following order: (A) 0, 8, 28, and then every 20 min up to 168 min; (B) 0, 14, and then every 20 min up to 174 min. The insets show the dependence of the DP and AC(0°) current densities on the plasmid accumulation time. The voltammetric currents were measured at 0.45 V and 1.3 V vs. the SCE.
Dna 06 00029 g001
Figure 2. DP (A) and AC(0°) (B) voltammograms showing the accumulation of a supercoiled circular (sc) pGEX-4T-2 plasmid on a GC electrode. Plasmid concentrations in 0.25 M acetate buffer, 18 mM MgCl2 (pH 4.7): black lines—0, i.e., buffer solution; orange dashed lines—8.4 pg/mL scpGEX-4T-2. Accumulation times increase in the following order: (A)—0, 8, 28, and then every 20 min up to 168 min; (B)—0, 14, and then every 20 min up to 174 min. The insets show the dependence of the DP and AC(0°) current densities on the plasmid accumulation time. The voltammetric currents were measured at 0.45 V and 1.3 V vs. the SCE.
Dna 06 00029 g002
Figure 3. AFM images showing the glassy carbon (GC) plate electrode (10 mm × 10 mm) covered with pUC19 deposits: (C1) superhelical (RMS 0.628 mm) and (D1) linear (RMS 3.16 mm). The plasmid layer was formed electrochemically, using the same conditions as those for the voltammetric measurements. The concentration of DNA was 8 pg/mL, and the plasmid was accumulated within a few hours (Reprinted, with a permission, from E. Acta. 2016, 210, 422–434 [87]).
Dna 06 00029 g003
Figure 4. The accumulation of the compound on GC: (A) DP voltammograms and (B) AC(0°) voltammograms. Compound concentration increases in the following order: black lines—buffer solution; blue lines—compound concentrations: 1–50 μM. Red lines represent the runs obtained in an 8 µM solution of the compound. Numerals (I–V) refer to the oxidation signals of the compound.
Dna 06 00029 g004
Figure 5. The accumulation of the compound on GC covered with linpGEX-4T-2 (8.1 pg/mL): DP voltammograms (A) and AC(0°) voltammograms (B). Compound concentration increases in the following order: black lines—buffer solution; green dashed lines—linpGEX-4T-2; blue lines—compound concentrations: 0.4–48.2 μM. Red lines represent the runs obtained in an 8 µM solution of the compound. Numerals (I–V) refer to the oxidation signals of the compound.
Dna 06 00029 g005
Figure 6. The accumulation of the compound on GC covered with scpGEX-4T-2 (8.4 pg/mL): DP voltammograms (A) and AC(0°) voltammograms (B). Compound concentration increases in the following order: black lines—buffer solution; orange dashed lines—scpGEX-4T-2; blue lines—compound concentrations: 0.1–66.9 μM. Red lines represent the runs obtained in an 8 µM solution of the compound. Numerals (I-V) refer to the oxidation signals of the compound.
Dna 06 00029 g006
Figure 7. Accumulation plots of compound monitored as redox signals (I) and (II) in DP (A) and AC(0°) voltammetry (B) as well as C/R signal in AC(0°) voltammetry (Figure 4B). These results were obtained in the same experiment.
Dna 06 00029 g007
Figure 8. Accumulation of the compound on bare GC (black lines) in linear (green lines) and superhelical (orange lines) pGEX-4T-2 adsorbed on the GC electrode. The DP peak current densities of the compound were taken at −0.2 V (signal II), and the AC(0°) signals were taken at −0.2 V (signal II), −0.4 V (signal I), and 0.45 V (C/R signal). Plasmid concentrations were as follows: linpGEX-4T-2—8.1 pg/mL; scpGEX-4T-2—8.4 pg/mL. (A)—Redox II DP signals; (B)—Redox II AC(0°) signals; (C)—Redox (I) AC(0°) signals for accumulation of the compound on bare GC (no plasmid) and on GC covered with a linear (linpGEX-4T-2) as well as superhelical (scpGEX-4T-2—8) plasmid.
Dna 06 00029 g008
Figure 9. Magnification of DP signal (V): (A)—shown in Figure 5A and (B)—shown in Figure 6A.
Dna 06 00029 g009
Figure 10. Square Wave (SW) voltammograms (A) and AC(0°) voltammograms (B) showing the appearance of additional peaks at ca. 0.42 V (SW) and 0.62 V (AC(0°)) with the accumulation of the compound in the superhelical pGEX-4T-2 (8.4 pg/mL) plasmid. Orange lines—scpGEX-4T-2; blue lines—compound concentrations: 4.21, 6.08, 8.40 (red line!),11.6, 20.8, 39.3, and 66.9 μM. Red line represents the measurement at 8.40 μM, the lowest compound concentration needed to observe plasmid decomposition.
Dna 06 00029 g010
Disclaimer/Publisher’s Note: The statements, opinions and data contained in all publications are solely those of the individual author(s) and contributor(s) and not of MDPI and/or the editor(s). MDPI and/or the editor(s) disclaim responsibility for any injury to people or property resulting from any ideas, methods, instructions or products referred to in the content.