1. Introduction
The rapid expansion of agroindustry has significantly increased the generation of lignocellulosic residues, whose inadequate management contributes to greenhouse gas emissions, soil degradation, and water contamination. Among these residues, rice husk stands out as one of the most abundant agricultural by-products worldwide, with annual production exceeding 150 million tons due to the continuous growth of rice-processing industries [
1]. The continuous accumulation of rice husk represents an important environmental and logistical challenge because of its high silica content, low bulk density, and resistance to biodegradation. Consequently, considerable attention has been directed toward thermochemical valorization strategies aimed at converting this agroindustrial residue into value-added carbonaceous materials while simultaneously mitigating waste disposal problems [
2].
Among the thermochemical technologies used for biomass valorization, pyrolysis has emerged as one of the most promising approaches because of its ability to simultaneously produce bio-oil, combustible gases, and biochar under oxygen-limited conditions [
3]. In particular, biochar has attracted increasing scientific interest due to its porous structure, physicochemical stability, tunable surface properties, and broad applicability in environmental remediation, catalysis, carbon sequestration, and electrochemical systems [
4]. The physicochemical properties of biochar strongly depend on both the composition of the feedstock and the operational conditions employed during pyrolysis, particularly temperature and residence time, which largely determine the thermal severity of the process [
5]. Previous studies have shown that increasing pyrolysis temperature intensifies devolatilization, promotes structural reorganization of the carbon matrix, and enhances biochar aromaticity, while simultaneously reducing solid yield due to secondary cracking and gasification reactions [
6]. For rice husk biochar specifically, higher pyrolysis temperatures have been associated with increased fixed carbon content, larger surface areas, and lower concentrations of oxygen-containing functional groups [
6,
7]. More broadly, across lignocellulosic feedstocks, increasing pyrolysis temperature has been consistently linked to greater specific surface area, porosity, pH, ash, and fixed carbon content, alongside reduced cation exchange capacity and volatile matter, reflecting the progressive advancement of organic matter decomposition [
8]. However, the magnitude of these trends varies considerably with feedstock composition, particularly lignin and cellulose content, which explains why biochars from crop residues and wood biomass tend to develop larger surface areas than those from animal litter or solid waste feedstocks even under comparable thermal severity [
8,
9].
The structural evolution of biochar during pyrolysis is closely related to the thermal degradation behavior of lignocellulosic biomass components. Hemicellulose and cellulose mainly decompose between 200 and 400 °C, generating volatile compounds and condensable intermediates, whereas lignin degrades over a wider temperature range and contributes preferentially to the formation of aromatic carbonaceous residues [
10]. These transformations promote the progressive elimination of oxygen-containing functional groups, pore development, and reorganization of the carbon matrix [
11]. As thermal severity increases, biochar evolves from partially carbonized biomass toward more carbonized and thermally stable structures with lower chemical reactivity, as reported for several lignocellulosic feedstocks [
12].
Residence time, together with heating rate, reaction atmosphere, and biomass pretreatment, has also been identified as one of the key parameters governing product distribution and structural development during lignocellulosic biomass pyrolysis [
13]. Longer residence times favor secondary cracking reactions and further stabilization of the carbon matrix, whereas lower thermal severities generally preserve a larger fraction of the original biomass structure [
14]. However, most previous studies have primarily focused on the isolated effect of pyrolysis temperature, while the combined influence of temperature and residence time on the structural evolution and thermal stability of rice husk biochar remains insufficiently understood, particularly for silica-rich biomasses such as rice husk [
1]. This gap is particularly relevant for silica-rich biomasses such as rice husk, whose high mineral content has been shown to slow down carbon structural ordering relative to other lignocellulosic residues: a comparative reflectance study across rice husk, rice straw, and wheat straw biochars found that the rice husk samples exhibited a markedly slower increase in carbon reflectance with increasing carbonization temperature, attributed to their conspicuous mineral-rich, bimodally structured matrix, in contrast to the more uniform response of the other two feedstocks [
15].
Despite significant advances in biomass pyrolysis research, important knowledge gaps remain regarding the relationship between thermal severity and biochar structural evolution. In many studies, biochar characterization is limited to reporting final physicochemical properties without establishing direct relationships between biomass decomposition, pore development, surface chemistry evolution, and thermal stability [
2]. In addition, the influence of mineral phases on the reorganization of the carbon matrix during rice husk pyrolysis has not yet been fully clarified. These limitations hinder the rational design of biochars with tailored structural and stability properties.
Understanding how thermal severity governs biochar evolution is essential because pyrolysis conditions not only affect product yield but also control pore formation, surface chemistry transformation, carbon matrix reorganization, and long-term thermal stability. Therefore, elucidating these relationships is crucial for optimizing pyrolysis conditions and designing biochars for environmental and energy-related applications.
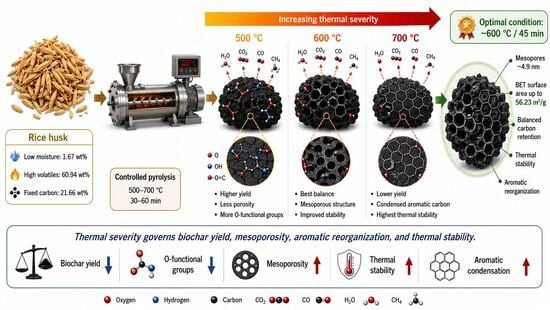
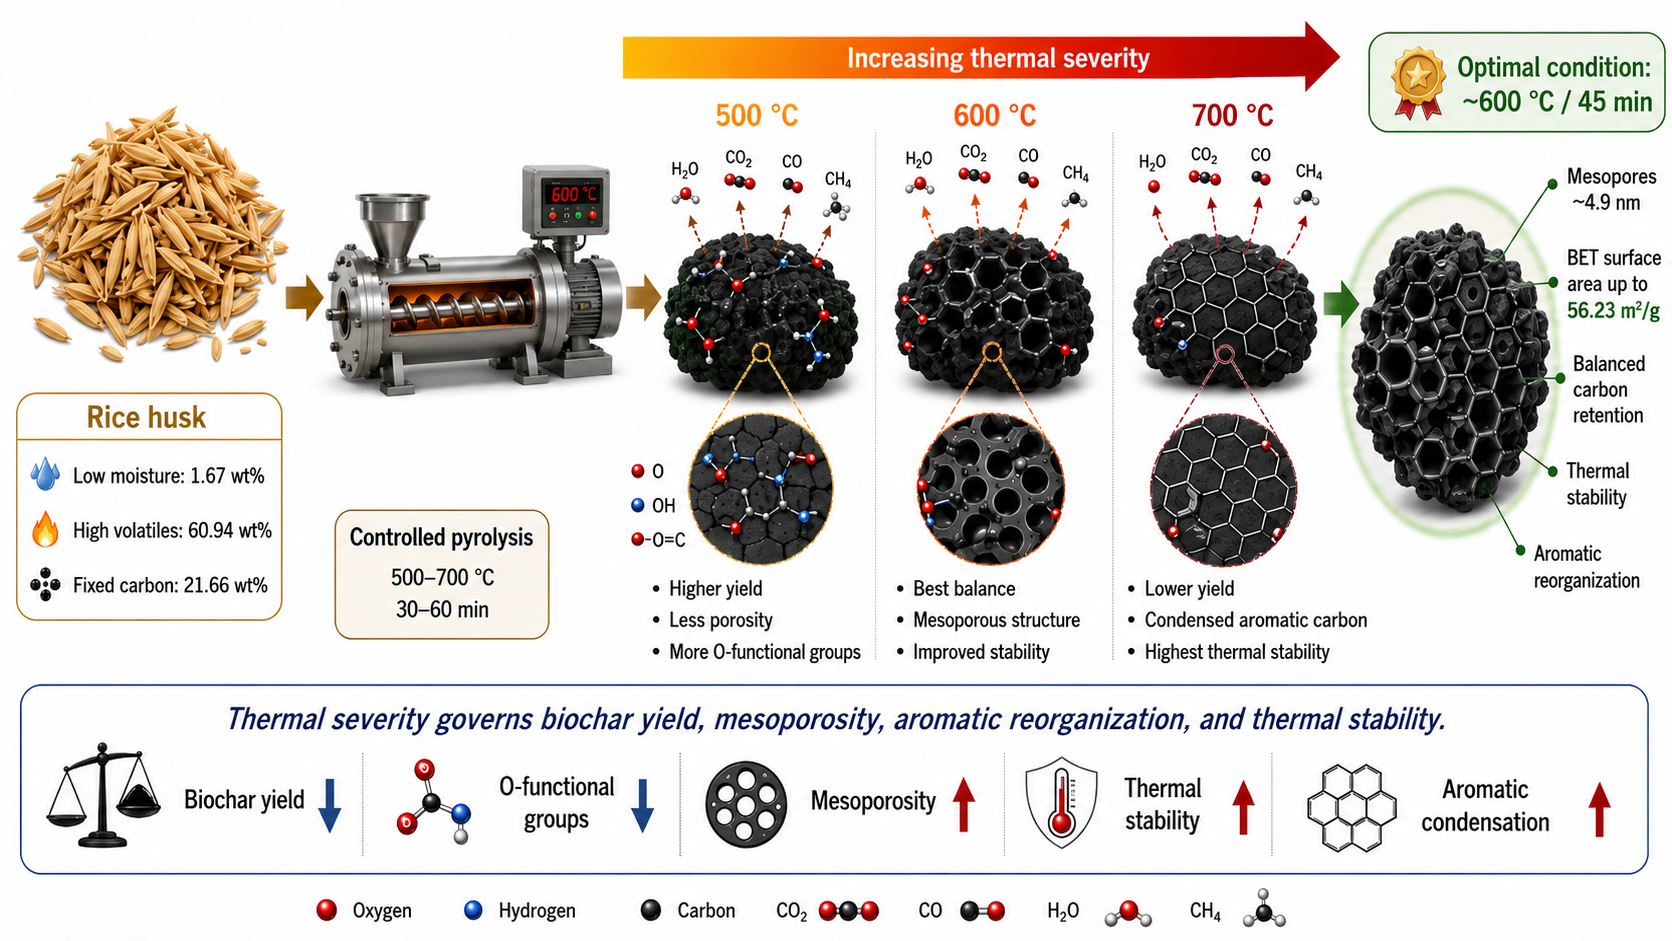
In this context, the present study investigated the evolution of rice husk biochar produced under different pyrolysis conditions. The combined effects of temperature and residence time on biochar yield, physicochemical properties, structural evolution, and thermal stability were systematically evaluated. In addition, thermogravimetric analysis was used to discuss the thermal degradation behavior of the raw biomass. The main contribution of this work lies in establishing process–structure–stability relationships linking biomass thermal decomposition with pore development, surface chemistry evolution, and thermal stabilization of rice husk biochar. Furthermore, this study statistically quantifies the interaction between temperature and residence time on biochar yield, providing further insight into the influence of thermal severity on silica-rich biomass pyrolysis.
2. Materials and Methods
2.1. Raw Material Preparation
Rice husk used as lignocellulosic feedstock in this study was collected from local rice-processing agro-industrial facilities located in the Department of Córdoba, Colombia. Raw biomass was manually cleaned to remove impurities, dust, and foreign particles adhered to the surface. Subsequently, the material was washed with deionized water and oven-dried at 105 °C until constant weight was achieved. The dried biomass was then sieved to obtain a homogeneous particle size fraction of approximately 2 mm.
High-purity nitrogen gas (99.999%) was used as inert atmosphere during all pyrolysis and thermal analysis experiments. Deionized water was employed in all cleaning and washing procedures. All chemicals and reagents used for analytical determinations were analytical grade and used without further purification.
2.2. Physicochemical Characterization of Raw Biomass
Proximate analysis of rice husk biomass, including moisture, volatile matter, ash content, and fixed carbon, was performed according to ASTM D7582 [
16] standard procedures. Bulk density measurements were carried out following ASTM C29/C29M-17a methodology [
17] Higher heating value (HHV) was determined according to ASTM D5865 [
18].
Elemental composition (carbon (C), hydrogen (H), oxygen (O), nitrogen (N) and sulfur (S)) was determined using a CHONS elemental analyzer (Perkin Elmer 2400 Serie II, PerkinElemer, Inc., Shelton, CT, USA), while oxygen content was calculated by difference. Atomic ratios (H/C, O/C) were calculated on an ash-free basis to evaluate the evolution of carbonization and aromaticity during pyrolysis.
Thermal degradation behavior of raw biomass was evaluated using simultaneous thermogravimetric analysis (TGA) performed in a Perkin Elmer STA6000 thermal analyzer (PerkinElemer, Inc., USA) under inert atmosphere. TGA-DTG profiles were obtained at different heating rates to evaluate the influence of thermal severity on biomass decomposition behavior.
2.3. Pyrolysis Experiments
Pyrolysis experiments were conducted in an AUGER-type thermochemical reactor operated under continuous nitrogen flow. The experimental design considered three pyrolysis temperatures (500, 600, and 700 °C) and three residence times (30, 45, and 60 min), resulting in a 3 × 3 factorial design with nine experimental conditions.
Unlike the TGA characterization, the heating rate during pyrolysis in the production reactor was not digitally controlled and depended on the furnace’s inherent thermal ramp. For this reason, TGA characterization of the raw biomass was performed at three different heating rates (15, 20, and 25 °C min
−1;
Section 2.2) to provide a broader assessment of the thermal decomposition behavior of the feedstock, independent of the specific, uncontrolled heating profile of the pyrolysis reactor.
Biochar, condensable liquid fractions, and non-condensable gases were quantified through mass balance analysis. The composition of non-condensable gases, including CO2, CO, CHx, H2, and O2, was determined under each experimental condition; the measurements were performed using a portable gas analyzer (GA-21 PLUS, Madur, Zgierz, Poland).
2.4. Structural and Thermal Characterization of Biochar
Surface functional groups of the obtained biochars were analyzed using Fourier transform infrared spectroscopy (FTIR) equipped with an attenuated total reflectance (ATR) accessory. FTIR spectra were used to evaluate the evolution of oxygen-containing functional groups and structural changes induced by increasing thermal severity.
Textural properties and pore structure of biochars were characterized by N2 adsorption–desorption at 77.4 K using the Brunauer–Emmett–Teller (BET) method for surface area determination using a NOVA 3000 surface area analyzer (Teknatoll, Auckland, New Zealand). Pore size distribution was additionally evaluated using NLDFT, Horvath–Kawazoe, and Saito–Foley methods to assess the evolution of mesoporosity and residual microporosity.
Thermal-oxidative stability of biochars was evaluated by differential scanning calorimetry (DSC) using a DSC100A analyzer (Guangzhou Biaoji Packaging Equipment Co., Ltd., Guangzhou, China) at a heating rate of 20 °C min
−1 from 30 to 600 °C, performed under both inert (N
2) and oxidative (pure O
2) atmospheres. Given the unavailability of thermogravimetric analysis (TGA) for the biochar samples, this comparative inert/oxidative DSC approach was adopted as a mass-independent indicator of thermal-oxidative stability, based on the onset temperature (T_onset), peak temperature (T_peak), and the temperature corresponding to 50% of the cumulative exothermic heat released (T
50) during the oxidation event, a methodological analog, based on heat flow rather than mass loss, of the T
50 concept used in the R
50 recalcitrance index [
19]. T_onset was determined as the temperature at which the DSC signal exceeded the pre-oxidation baseline by 10% of the peak height, following a threshold-crossing approach used when the classical tangent-line method is not consistently applicable across morphologically heterogeneous exothermic profiles, as observed across the nine conditions of this dataset.
2.5. Experimental Design and Statistical Analysis
A full factorial experimental design (3 × 3) was employed to evaluate the combined effects of pyrolysis temperature and residence time on biochar yield and structural evolution. All experiments were performed in triplicate (n = 3).
Biochar yield data were analyzed using two-way analysis of variance (ANOVA) considering temperature and residence time as fixed factors. Multiple comparisons between treatments were performed using Tukey’s honestly significant difference (HSD) test at a significance level of α = 0.05. Effect size was evaluated using partial eta squared ().
Additionally, response surface methodology (RSM) was applied to model biochar yield as a function of temperature and residence time using a second-order polynomial model. Model adequacy was evaluated through analysis of variance, coefficient of determination (R2), adjusted R2, and root mean square error (RMSE).
3. Results
3.1. Initial Composition and Thermal Behavior of Rice Husk Biomass
The physicochemical composition of raw rice husk biomass exhibited characteristics suitable for thermochemical conversion through pyrolysis, as summarized in
Table 1. The low moisture content (1.67 ± 0.08 wt%) reduced the energy demand associated with water evaporation during heating, while the high volatile matter content (60.94 ± 0.42 wt%) indicated the presence of thermolabile lignocellulosic fractions capable of generating condensable vapors and gaseous products during devolatilization. Fixed carbon content reached 21.66 ± 0.31 wt%, whereas ash content was 15.76 ± 0.27 wt%, consistent with the mineral-rich composition typically reported for rice husk biomass.
Elemental analysis revealed carbon, hydrogen, nitrogen, and oxygen contents of 43.20 ± 0.35 wt%, 7.48 ± 0.12 wt%, 0.46 ± 0.04 wt%, and 48.82 ± 0.48 wt%, respectively, while sulfur was not detected. The higher heating value (HHV) of 16.97 ± 0.25 MJ/kg further indicated the suitability of this biomass for thermo-chemical applications.
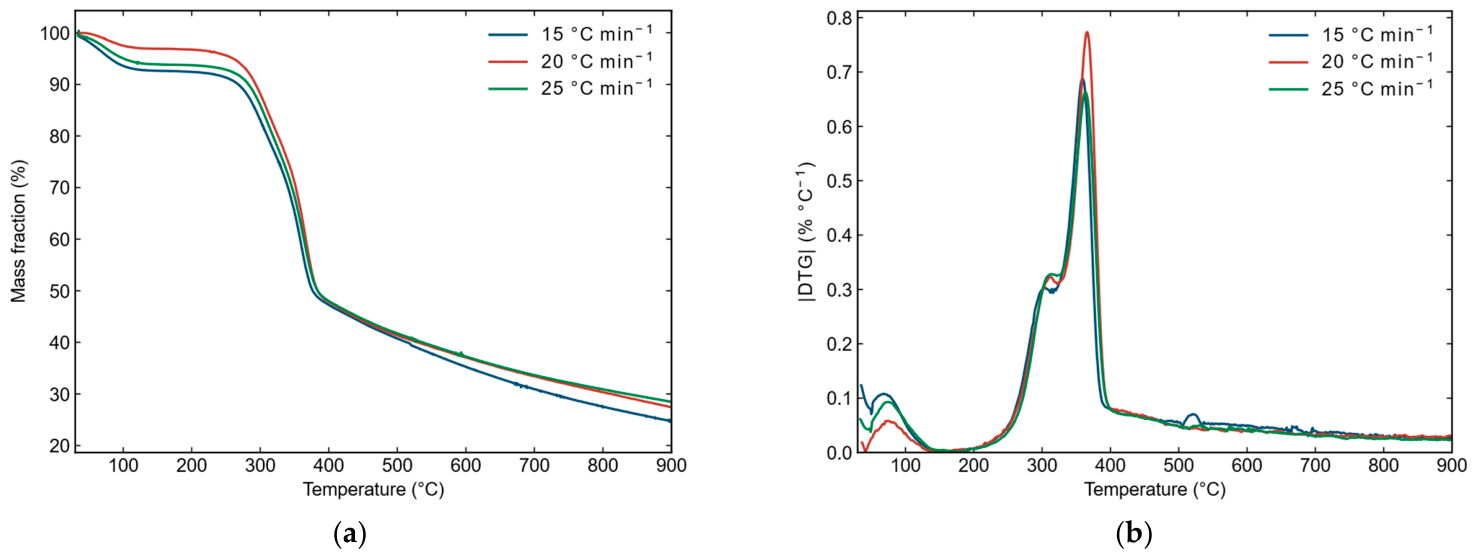
Thermogravimetric analysis (TGA) confirmed the multistage decomposition behavior characteristic of lignocellulosic materials. According to
Figure 1, three main thermal degradation regions were identified. The first region, occurring below approximately 120 °C, corresponded to moisture evaporation and desorption of weakly bound water molecules. The second region, between 200 and 400 °C, exhibited the highest mass loss and was associated with the rapid decomposition of hemicellulose and cellulose through depolymerization, fragmentation, and devolatilization reactions. Finally, a broader and slower degradation region above 400 °C was attributed to lignin decomposition and progressive aromatic reorganization leading to the formation of carbonaceous residues.
DTG profiles, shown in
Figure 1b, revealed that increasing the heating rate shifted the degradation peaks toward higher temperatures, indicating thermal lag effects and heat transfer limitations within the biomass matrix [
9]. This behavior suggests that thermal severity not only affects decomposition kinetics, but also governs the competition between volatile release, secondary cracking reactions, and stabilization of the carbon matrix. At higher heating rates, rapid heat transfer promoted incomplete thermal equilibrium within biomass particles, delaying the maximum degradation rate and modifying devolatilization pathways. Notably, the intensity of the main DTG peak did not increase monotonically with heating rate (20 °C min
−1 > 15 °C min
−1 > 25 °C min
−1): intermediate rates (20 °C min
−1) provided an optimal balance between heat transfer efficiency and reaction time, concentrating mass loss over a narrower temperature range, whereas lower rates (15 °C min
−1) allowed more time for secondary recombination reactions that broadened the degradation profile, and higher rates (25 °C min
−1) introduced intraparticle thermal gradients that delayed and dispersed core degradation despite the higher peak temperature.
The thermal decomposition behavior observed in this study is consistent with previous reports describing the degradation of hemicellulose and cellulose between 200 and 400 °C, as well as the broader lignin decomposition range associated with the formation of aromatic carbonaceous residues [
10]. More importantly, these results indicate that the initial lignocellulosic architecture of rice husk strongly influences its subsequent thermal evolution and the structural stabilization of the resulting biochar [
9,
20]. The obtained TGA–DTG profiles correspond to the original lignocellulosic biomass and allowed identification of the main thermal degradation stages preceding biochar formation, thereby providing a basis for understanding the subsequent structural evolution and thermal stability of the generated carbonaceous material.
The atomic ratios H/C = 2.06 ± 0.03 and O/C = 0.84 ± 0.02, calculated on an ash-free basis, are consistent with the typical profile of non-carbonized lignocellulosic biomass and confirm a predominantly aliphatic structure with a high degree of oxygen-containing surface functionalities [
11]. The H/C ratio of 2.06 indicates the presence of abundant aliphatic chains and hydrogen associated with cellulose, hemicellulose, and lignin structures that are progressively removed during pyrolysis. Likewise, the O/C ratio of 0.84 reflects the high density of oxygen-containing functional groups—including hydroxyl, carbonyl, and ether functionalities—characteristic of raw lignocellulosic biomass, whose progressive reduction with increasing thermal severity will be discussed in
Section 3.3.2. These values constitute the starting point of the implicit Van Krevelen evolution documented throughout this study [
21,
22]: as pyrolysis temperature increases from 500 to 700 °C, H/C and O/C ratios are expected to decrease toward values associated with increasingly aromatic and carbonized structures, thereby describing the transition from reactive biomass to thermally stabilized biochar.
3.2. Effect of Thermal Severity on Biochar Yield
Pyrolysis temperature and residence time significantly influenced biochar yield, with a statistically significant interaction depending on thermal severity levels (
Table 2). Two-way ANOVA revealed that temperature was the dominant factor, accounting for 88% of the total yield variance (F = 67.15;
p < 0.001;
= 0.882) (
Table 3), whereas residence time showed a significant effect of moderate magnitude (F = 9.83;
p = 0.001;
= 0.522). More importantly, the interaction between both factors was statistically significant (F = 6.19;
p = 0.003;
= 0.579), indicating that the effect of residence time on biochar yield was not uniform across temperature levels. Tukey’s HSD test confirmed that the three temperature levels generated completely differentiated homogeneous groups (
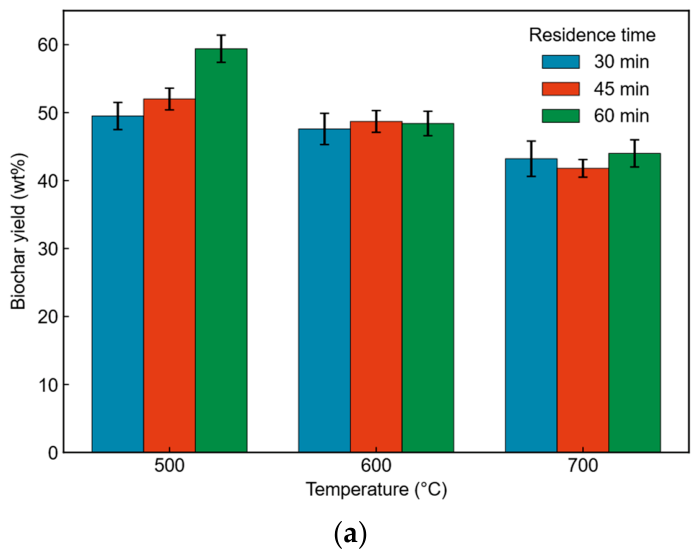
Table 4), with a minimum significant difference of 2.34 wt% (HSD, α = 0.05). However, at short residence times (30 min), biochar yields at 500 °C (49.5 ± 2.0 wt%) and 600 °C (47.6 ± 2.3 wt%) did not show statistically significant differences (Δ = 1.87 wt% < HSD = 2.34 wt%), indicating that under low thermal severity conditions carbonization did not reach a sufficiently differentiated state between these two temperature levels. This limitation disappeared at longer residence times, where differences between adjacent temperatures became consistently significant, explaining the observed significant A × B interaction.
The highest biochar yields were obtained at 500 °C (
Figure 2). In particular, at a residence time of 60 min, solid yield reached the maximum value of the experimental design, corresponding to 59.4 ± 2.0 wt% (homogeneous group a, Tukey test). Notably, the biochar yield obtained at 500 °C/30 min (49.5 ± 2.0 wt%) did not differ significantly from that obtained at 600 °C/30 min (47.6 ± 2.3 wt%), as a direct consequence of the significant A × B interaction that reduced the discriminating effect of temperature under short residence times. Under these conditions, thermal decomposition remained relatively moderate, allowing preservation of a significant fraction of the original lignocellulosic carbon matrix. The high biochar yield under low thermal severity conditions indicated that carbon retention processes predominated over extensive devolatilization and structural reorganization. Simultaneously, bio-oil production decreased with increasing residence time, suggesting progressive secondary cracking of condensable intermediates into lighter gaseous species. The gaseous fraction at 500 °C ranged from 28.4 ± 1.3 wt% (60 min) to 33.1 ± 2.6 wt% (30 min), with a composition dominated by CO
2 (~30 vol%) and CO (~27 vol%), and with no detectable H
2, confirming that at this temperature the process was mainly governed by devolatilization rather than secondary gasification reactions.
At 600 °C, biochar yield stabilized between 47.6 ± 2.3 wt% (30 min) and 48.7 ± 1.6 wt% (45 min), values corresponding to homogeneous group b according to Tukey’s HSD test, suggesting the establishment of a transition regime between carbon preservation and structural reorganization. Notably, at 600 °C residence time did not produce statistically significant differences in biochar yield (range 47.6–48.4 wt%, lower than HSD = 2.34 wt%), in marked contrast to the pronounced effect observed at 500 °C, providing direct evidence of the significant A × B interaction (
p = 0.003). Within this intermediate temperature range, devolatilization reactions intensified while carbonization became more pronounced. The combination of volatile release and progressive aromatic reorganization likely promoted the formation of a more organized carbon matrix without excessive destruction of the pore architecture. Yield differences relative to 500 °C were statistically significant in all comparisons (
p < 0.001), with an absolute decrease between marginal means of 5.40 wt% (95% CI: [3.06; 7.74]), reflecting the net effect of enhanced devolatilization induced by the 100 °C increase in pyrolysis temperature. The appearance of H
2 at 600 °C/45 min (2.0 ± 0.05 vol%) and its increase at 60 min (2.9 ± 0.09 vol%) identified this temperature level as the threshold for activation of reforming reactions, confirming the transitional thermochemical nature of this condition [
3,
15].
The lowest biochar yields of the experimental design, 43.2 ± 2.6 wt% (30 min), 41.8 ± 1.3 wt% (45 min), and 44.0 ± 2.0 wt% (60 min), were obtained at 700 °C, corresponding to homogeneous group c and statistically different from groups a and b in all pairwise comparisons (
p < 0.001). At this temperature, intensified thermal decomposition promoted extensive cracking reactions, gas release, and reorganization of the carbon matrix, resulting in reduced solid residue formation [
15,
23]. The gaseous fraction reached its maximum value at 700 °C/45 min (49.2 ± 2.6 wt%), accompanied by H
2 concentrations ranging from 4.5 ± 0.1 to 7.5 ± 0.2 vol% and CHx concentrations between 53 and 57 vol%, confirming that secondary gasification and deep hydrocarbon cracking became dominant above 700 °C. This condition represented the largest absolute yield decrease relative to the initial design point, corresponding to the greatest reduction between marginal means (Δ = 10.63 wt%; 95% CI: [8.29; 12.97]), thereby quantitatively describing the solid yield penalty associated with the highest evaluated thermal severity.
These results demonstrate a clear relationship between biochar yield and structural evolution. Lower temperatures favored greater solid recovery because de-volatilization remained incomplete and the original biomass matrix was partially preserved. In contrast, higher temperatures promoted extensive structural re-organization and stabilization of the carbon matrix at the expense of solid yield. Therefore, thermal severity governs the transition from regimes dominated by carbon retention toward increasingly reorganized carbonaceous structures characterized by lower yield but enhanced structural stability. It should be noted that the sum of gaseous components quantified at 500 °C did not reach 100 vol% (85.97–95.29%), unlike the complete gas balances obtained at 600 and 700 °C. This discrepancy suggests the presence of species not quantified by the chromatographic method under low thermal severity conditions, possibly including light oxygenated compounds, water vapor, or condensable fractions with high boiling points. This aspect constitutes an analytical limitation that should be considered when interpreting gas composition at 500 °C.
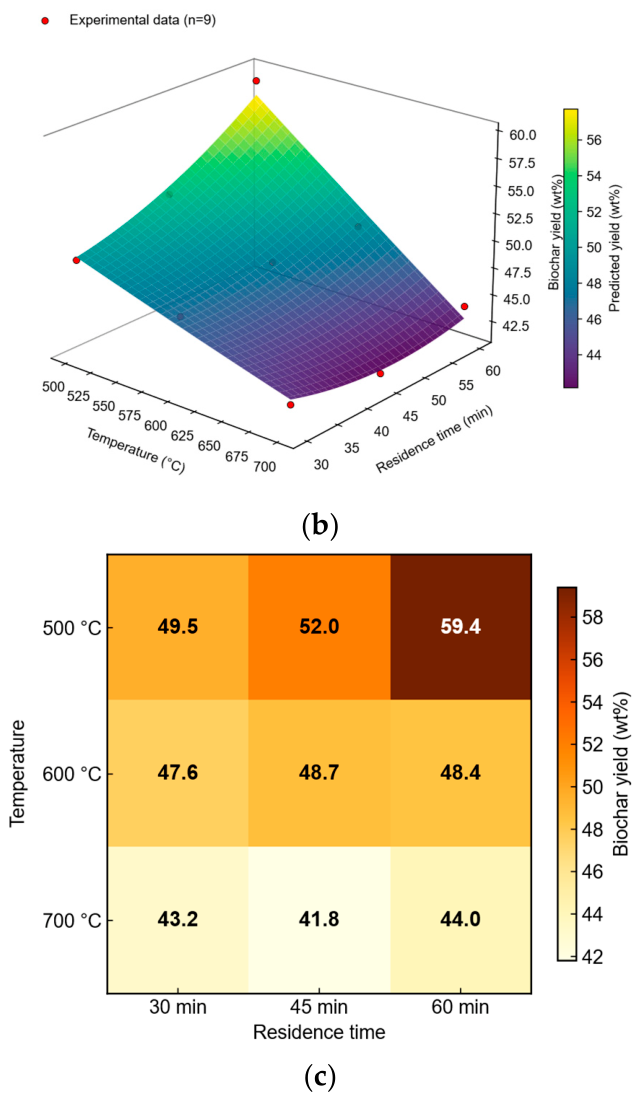
Overall, the factorial heat map demonstrates that thermal severity significantly controls product distribution during rice husk pyrolysis (
Figure 2). Moderate temperatures combined with longer residence times favored higher biochar yields, whereas elevated temperatures promoted greater thermal conversion of the biomass and progressively reduced solid recovery. The factorial representation also revealed that the influence of residence time was more pronounced at lower temperatures and gradually diminished as pyrolysis temperature increased, indicating a dependent interaction between both operational variables, consistent with the significant A × B interaction confirmed by ANOVA (
p = 0.003), which quantitatively describes how the effect of residence time on yield progressively decreases with increasing temperature. This trend was further described by the quadratic response surface model (
Table 5), whose equation represented biochar yield as a function of temperature and residence time with satisfactory model adequacy (R
2 = 0.953; adjusted R
2 = 0.875; RMSE = 1.88 wt%; F(5,3) = 12.19;
p = 0.033), confirming that the model significantly captured yield variation within the evaluated experimental domain. Notably, the interaction coefficient β
5 (T × t = −1.52 × 10
−3;
p = 0.094) was the most informative individual coefficient, consistent with the significant A × B interaction identified by ANOVA.
3.3. Structural Evolution of Biochar
3.3.1. Development of Porous Structure
Given that temperature was identified as the dominant factor governing biochar yield (
Section 3.2), porosimetry characterization was performed at a fixed, intermediate residence time (45 min) across the three pyrolysis temperatures, in order to isolate the temperature-driven structural response without extending textural analysis to all nine experimental conditions.
Nitrogen adsorption–desorption analysis revealed that thermal severity significantly influenced pore generation, structural ordering, and the evolution of the carbon matrix during rice husk pyrolysis.
Table 6 summarizes the textural and physicochemical properties of the biochars obtained under the extreme and optimal conditions of the experimental design. BET surface area increased markedly and monotonically with pyrolysis temperature, with the 700 °C biochar reaching nearly four times the surface area of the 500 °C biochar and statistically distinct homogeneous groups across all three temperatures (
p < 0.001). The modal pore diameter, in contrast, dropped sharply between 500 and 600 °C before stabilizing at 700 °C, indicating that mesopore refinement occurs mainly during the early stage of thermal severity, while surface area continues to develop through higher-temperature devolatilization (see mechanistic discussion in
Section 4.1).
NLDFT pore size distribution analysis showed a monomodal profile concentrated within the mesoporous region (2–10 nm), with a cumulative pore volume of approximately 0.1076 cm3/g. Horvath–Kawazoe and Saito–Foley analyses simultaneously revealed residual microporosity with characteristic pore diameters close to 1.82 nm, indicating that the carbon matrix preserved localized microporous domains even after severe thermal treatment.
The mechanism of pore development was temperature-dependent and directly associated with restructuring of the biomass matrix induced by devolatilization. At 500 °C, the resulting biochar exhibited an incipient porous structure with limited pore development due to incomplete decomposition of lignocellulosic fractions and partial preservation of the original biomass architecture. Under these conditions, volatile release was insufficient to generate an extensive network of interconnected pores.
Increasing the temperature to 600 °C promoted greater devolatilization and enhanced release of internal volatiles, creating additional voids within the carbon matrix. Simultaneously, progressive aromatic reorganization contributed to structural rigidity, stabilizing pore walls and preventing excessive contraction of the carbon framework. Consequently, this intermediate thermal severity favored optimal mesopore development and improved structural organization.
At 700 °C, structural reorganization became substantially more pronounced. Although carbonization and aromatic ordering increased considerably, excessive devolatilization likely induced matrix contraction and partial pore collapse. In addition, the high silica content characteristic of rice husk may have contributed to mineral-induced structural reorganization effects, restricting excessive pore expansion despite intensified carbonization. This behavior suggests that excessive thermal severity can compromise structural integrity, even when promoting greater aromatic reorganization and thermal stabilization.
Overall, the progressive evolution from partially carbonized biomass toward a reorganized porous carbonaceous network demonstrates that thermal severity directly governs pore generation, matrix contraction, aromatic ordering, and consolidation of the carbon structure.
3.3.2. Surface Chemical Reorganization of Biochar
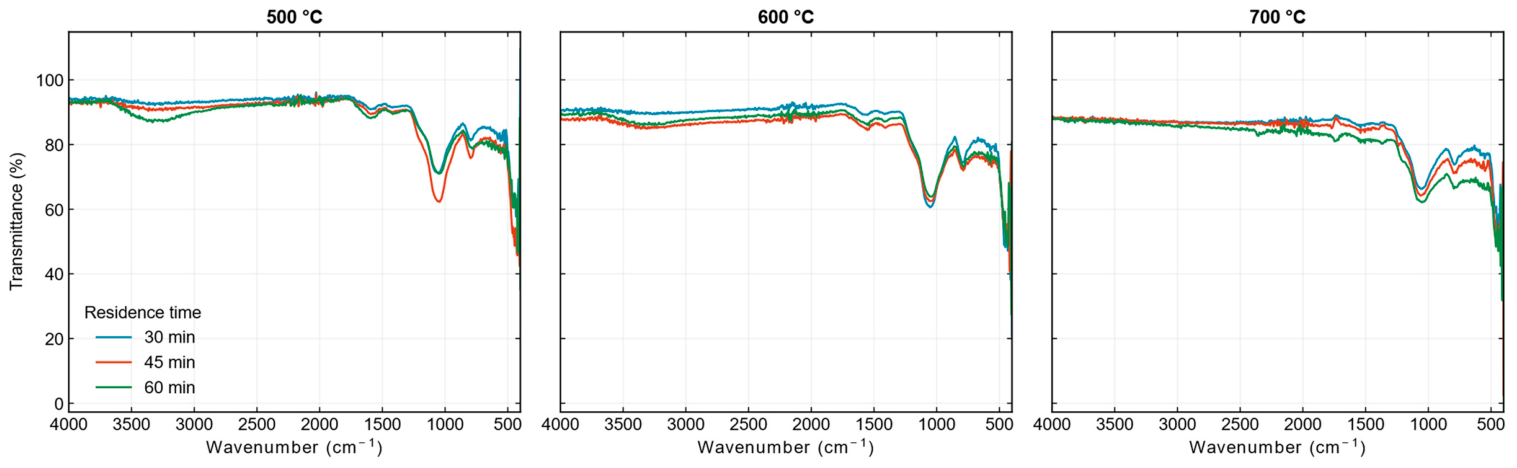
FTIR analysis, as shown in
Figure 3, revealed that thermal severity considerably affected the evolution of surface chemistry and oxygen-containing functional groups in rice husk-derived biochar. As pyrolysis temperature increased from 500 to 700 °C, significant spectral changes were observed, indicating progressive deoxygenation, defunctionalization, and reorganization of the carbon matrix.
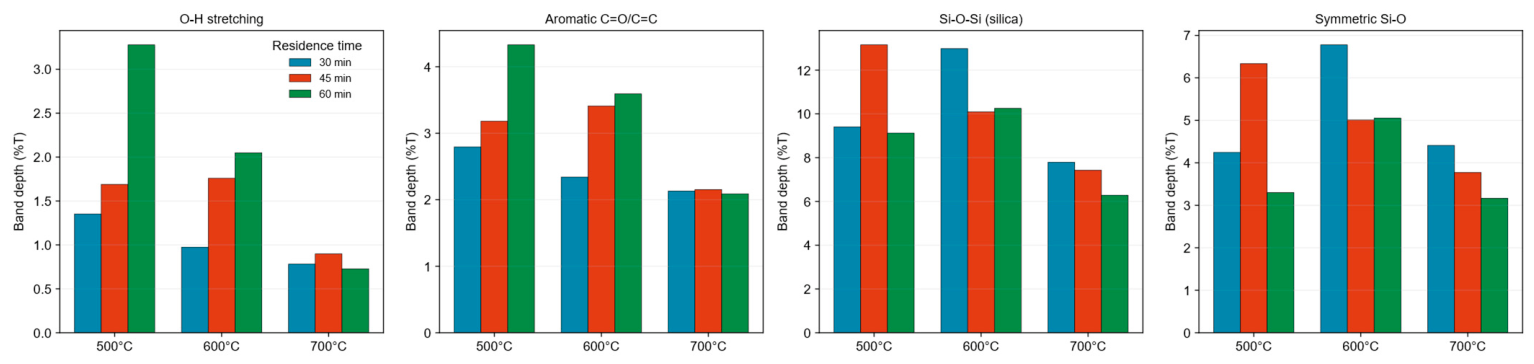
Band-depth quantification of the four characteristic FTIR bands (
Figure 4) revealed that the magnitude and consistency of the residence-time effect were themselves temperature-dependent. At 500 and 600 °C, band depths varied non-monotonically with residence time, with differences comparable in magnitude to replicate variability, indicating no consistent residence-time effect at these temperatures. At 700 °C, however, all four bands decreased consistently and monotonically with increasing residence time (e.g., Si-O-Si band depth: 7.8, 7.4, and 6.3%T at 30, 45, and 60 min, respectively), indicating that residence time contributes measurably to structural and mineral-phase reorganization only under the most severe thermal conditions evaluated. This pattern is consistent with the temperature-dependent residence-time effect already identified for thermal-oxidative stability (
Section 3.4) and for biochar yield (
Section 3.2), reinforcing that residence time acts as a secondary, condition-dependent factor rather than a uniformly influential one across the full experimental domain.
The broad absorption band centered at 3351 cm
−1, associated with O–H stretching vibrations of hydroxyl groups from alcohols, phenols, and residual lignocellulosic structures, progressively decreased with increasing thermal severity. This behavior indicates dehydration reactions and elimination of labile oxygen-containing functional groups during pyrolysis, a response commonly observed during biomass carbonization processes [
11]. Similarly, the aliphatic C–H stretching bands located near ~2917 and 2857 cm
−1 also exhibited a substantial reduction in intensity at higher temperatures, suggesting extensive cleavage of aliphatic side chains and progressive removal of thermally unstable hydrocarbon structures.
Within the intermediate spectral region, vibrations associated with aromatic groups located near 1578 and 1487 cm
−1 became comparatively more pronounced as temperature increased. These bands are related to C=C stretching vibrations of aromatic rings and indicate progressive aromatization and structural ordering of the carbon matrix. The persistence and relative intensification of these aromatic signals suggest that higher thermal severity promotes the transformation of lignocellulosic structures into increasingly aromatic carbonaceous domains through carbonization and secondary condensation reactions [
24].
The most pronounced spectral variation was observed near 1053 cm
−1, corresponding to C–O vibrations and Si–O–Si stretching associated with oxygen-containing groups and silica-rich mineral phases characteristic of rice husk. The progressive reduction of this band with increasing pyrolysis temperature indicates advanced deoxygenation and destruction of oxygen-containing surface functionalities. At the same time, the persistence of Si–O-related contributions further confirms the accumulation of inorganic silica phases during progressive removal of organic matter throughout carbonization [
6].
The observed chemical evolution demonstrates that temperature governs the transition from oxygen-rich reactive biomass to progressively more carbonized and chemically stabilized biochar structures. At 500 °C, the resulting biochar retained a significant fraction of oxygen-containing functional groups, which may favor higher surface reactivity and adsorption potential. In contrast, biochars produced at 700 °C exhibited advanced deoxygenation and aromatic enrichment, indicating the formation of chemically inert and structurally ordered carbonaceous networks.
Overall, these results confirm that temperature directly controls the evolution of surface functional groups through simultaneous dehydration, devolatilization, dealkylation, and aromatic reorganization processes, thereby determining the final chemical nature and reactivity of the resulting biochar.
3.4. Structural Evolution and Thermal Stabilization of the Carbon Matrix
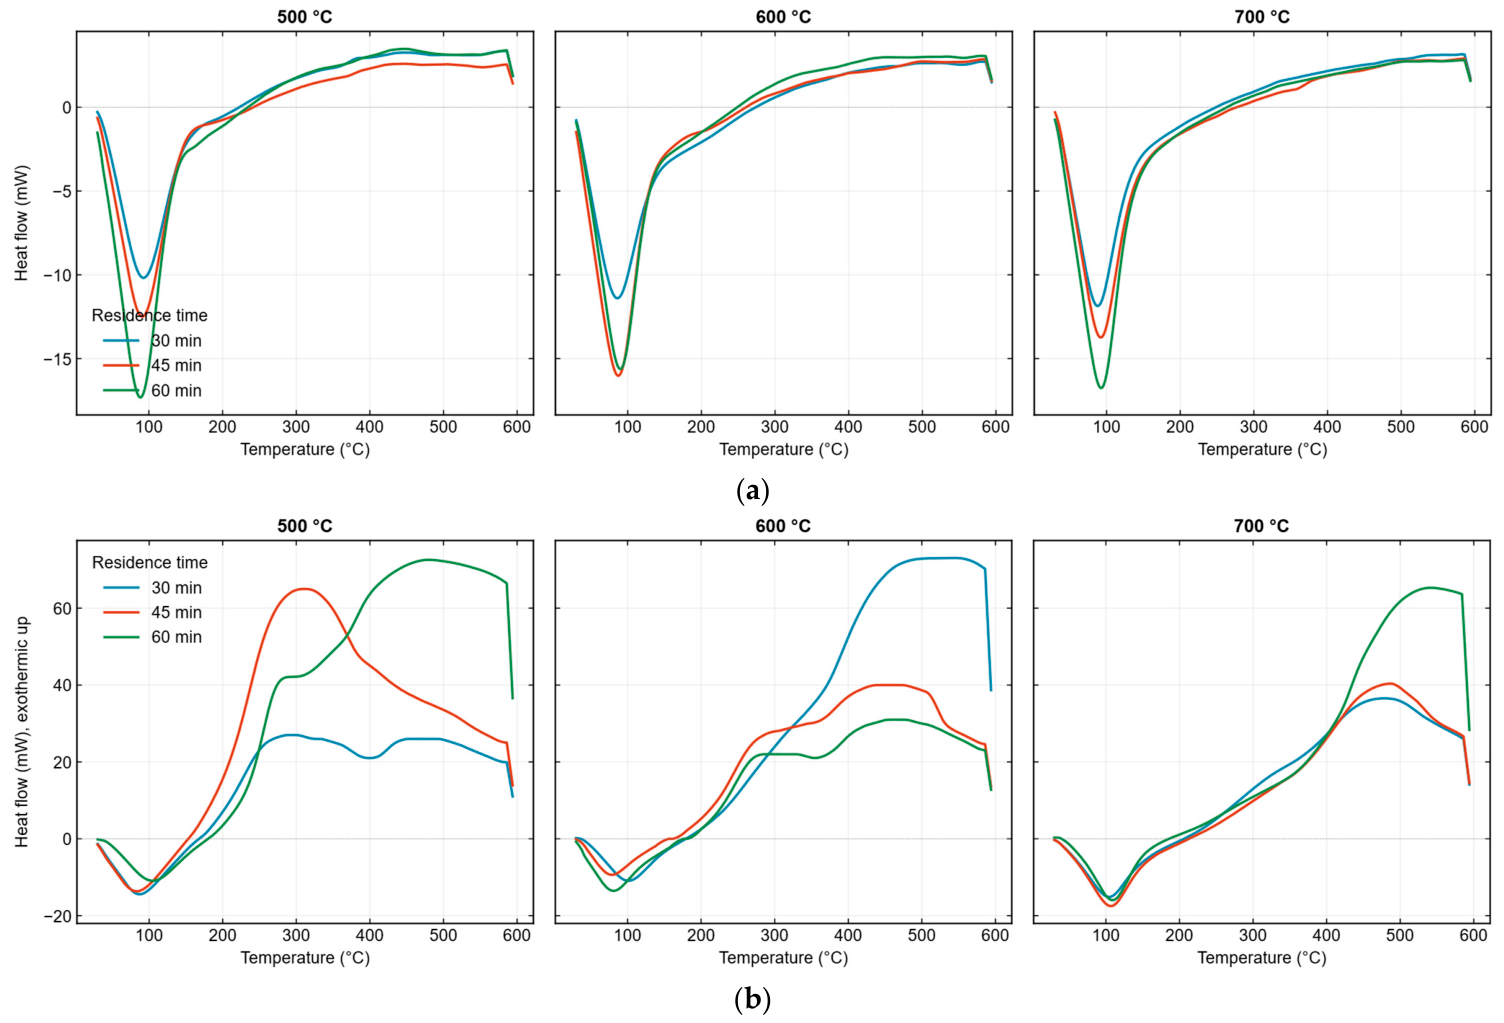
Differential scanning calorimetry (DSC) allowed evaluation of the energetic evolution and thermal stabilization of the biochars obtained under different pyrolysis conditions, as shown in
Figure 5. The thermograms exhibited progressive changes in the thermal behavior of the material as thermal severity increased, revealing structural transformations associated with devolatilization, carbon matrix reorganization, and aromatic condensation.
Complementary DSC analysis under oxidative atmosphere (pure O
2) revealed a two-stage thermal response across the nine conditions: an initial minor endothermic event below 150 °C, associated with residual moisture loss, followed by an exothermic event attributable to oxidation of the carbonaceous matrix (
Figure 5). The onset temperature of this exothermic event (T_onset) ranged from 210.0 °C (500 °C/30 min) to 269.7 °C (700 °C/60 min), the peak temperature (T_peak) ranged from 295.0 to 542.4 °C, and the temperature at 50% cumulative heat release (T
50) ranged from 349.0 to 497.3 °C (
Table 7). These values increased overall with thermal severity, indicating progressively greater resistance to oxidation, consistent with the reduction of oxygen-containing functional groups observed by FTIR (
Section 3.3.2) and the deoxygenation trend reflected in the O:C ratio (
Table 6). The highest thermal-oxidative resistance was observed at 700 °C/60 min (T_onset = 269.7 °C; T_peak = 542.4 °C; T
50 = 497.3 °C). The lowest T_peak and T
50 values were observed at 500 °C/45 min, while the lowest T_onset was observed at 500 °C/30 min (
Table 7), indicating that the three parameters, while broadly consistent, do not always co-locate at the same condition.
Biochars produced at 500 °C showed more pronounced thermal perturbations within the approximate range of 50–150 °C, a region mainly associated with residual moisture loss, release of remaining volatile compounds, and decomposition of less-condensed organic structures. This behavior indicates that under moderate pyrolysis temperatures the carbon matrix retained a greater proportion of thermolabile domains and partially stabilized oxygen-containing functional groups. Previous studies have reported that biochars produced at lower temperatures preserve less aromatic structures and higher contents of functionalized compounds due to incomplete carbonization [
11,
25].
As pyrolysis temperature increased to 600 and 700 °C, DSC curves showed a progressive reduction in energetic variations and greater thermal baseline stability. The reduction in these thermal events suggests that thermal severity promoted elimination of reactive structures and favored the formation of more condensed and energetically stable carbon matrices. This behavior is directly associated with dehydration, deoxygenation, and aromatic polycondensation processes occurring during advanced pyrolysis, which increase the thermal recalcitrance of biochar [
3,
26].
In particular, biochars produced at 700 °C exhibited the most stable thermal profiles, characterized by lower energetic perturbations and a more uniform thermal response throughout the evaluated temperature range. This behavior indicates a greater degree of structural reorganization of the carbon matrix, associated with increased aromaticity, reduction in reactive structural defects, and formation of more ordered carbon domains. Previous studies have demonstrated that elevated pyrolysis temperatures favor condensation of polyaromatic structures and increase the thermal and chemical stability of biochar [
14,
27,
28].
Comparison among residence times revealed that the effect of residence time on thermal-oxidative stability was temperature-dependent rather than uniform: at 700 °C, T_onset, T_peak, and T50 increased consistently with residence time (T_onset: 236.9, 246.4, and 269.7 °C for 30, 45, and 60 min, respectively), whereas at 600 °C the shortest residence time (30 min) showed the highest values across all three parameters (T_onset = 242.7 °C, versus 218.0–219.0 °C at 45 and 60 min), suggesting that residence-time effects on structural stabilization are not independent of thermal severity.
Overall, the DSC results demonstrate that thermal severity significantly controls the energetic and structural evolution of rice husk biochar. More severe pyrolysis conditions promoted the transition from partially carbonized structures toward more organized, aromatic, and thermally stable carbon matrices. Nevertheless, although elevated temperatures increased material stability, excessively severe conditions may induce structural densification of the carbon matrix and partial reduction of surface accessibility due to reorganization of certain porous domains.
4. Discussion
4.1. Pore Development Mechanism and the Role of Silica
The monotonic increase in BET surface area with thermal severity (14.5, 22.74, and 56.23 m
2/g at 500, 600, and 700 °C, respectively) reflects progressive devolatilization of the carbon matrix: as pyrolysis temperature increases, continued release of residual volatile and thermolabile fractions opens new micro- and mesoporous channels within the char structure, consistent with the parallel increase in fixed carbon and decrease in H/C and O/C ratios shown in
Table 6. Interestingly, the modal pore diameter did not follow the same monotonic trend, decreasing sharply from 500 °C (8.79 ± 0.31 nm) to 600 °C (4.74 ± 0.38 nm) before increasing slightly at 700 °C (4.90 ± 0.19 nm). This pattern suggests a two-stage pore development mechanism: an initial narrowing/refinement stage, in which wide, poorly organized channels from raw biomass are subdivided into smaller mesopores as devolatilization proceeds, followed by a coalescence stage at higher severity, in which continued matrix reorganization merges adjacent micropores into slightly larger, more numerous mesopores—increasing total surface area without substantially altering the modal pore diameter, rather than through the sintering/shrinkage mechanism that typically dominates surface-area decline in other biochars at comparable severities.
The high silica content of the parent biomass (15.76 ± 0.27 wt% ash, predominantly amorphous SiO
2 typical of rice husk) likely contributes to this behavior by acting as a rigid mineral scaffold embedded within the developing carbon matrix. This scaffold limits wholesale pore-wall collapse even at the highest severity tested, allowing surface area to continue increasing up to 700 °C, in contrast to the surface-area decline often reported for low-ash, low-silica woody biochars above 600 °C. This mineral-organic interaction is consistent with reports that biochars from crop residues, which typically retain higher mineral content, exhibit systematically different surface-area and carbon-content trajectories than wood-derived biochars produced under comparable pyrolysis conditions [
8].
This feedstock-specific behavior is further supported by a comparative reflectance study across rice husk, rice straw, and wheat straw biochars, which found that rice husk samples exhibited a markedly slower increase in carbon reflectance with increasing carbonization temperature than the other two feedstocks—attributed to their mineral-rich, bimodally structured matrix, in which silica-associated domains retard the structural ordering of the surrounding carbon [
15]. Taken together, these observations indicate that the high silica content of rice husk does not merely coexist with the developing carbon structure but actively modulates its reorganization pathway, distinguishing its structural evolution from that of lower-ash lignocellulosic feedstocks such as wood or low-silica straws [
9].
4.2. Chemical Reorganization and Thermal Stability of Biochar
Based on the previously discussed results, thermal severity significantly influenced the surface chemical evolution and thermal stability of rice husk biochar. Increasing pyrolysis temperature promoted progressive dehydration, deoxygenation, and devolatilization processes, leading to a carbon matrix with lower contents of functionalized structures and greater thermal stability upon heating. In this way, the combined interpretation of FTIR and DSC analyses allowed relationships to be established between surface chemical evolution and the thermal response of the carbonaceous material.
FTIR analyses showed a progressive reduction in bands associated with oxygen-containing functional groups and aliphatic hydrocarbons as thermal severity increased. In particular, the decrease in the broad band around 3351 cm
−1, associated with hydroxyl group (–OH) vibrations, together with the reduction in aliphatic C–H signals at 2917 and 2857 cm
−1, suggests gradual elimination of functionalized structures during carbonization. Simultaneously, signals located near 1578 cm
−1, associated with C=C vibrations of aromatic structures, exhibited relative persistence at higher pyrolysis temperatures. This behavior is consistent with previous studies reporting that increasing pyrolysis temperature promotes the loss of oxygen-containing groups and the development of less functionalized and chemically more stable carbon matrices [
11,
25].
Complementarily, DSC thermograms revealed that biochars produced at lower temperatures exhibited more pronounced thermal variations during heating, particularly within the initial temperature region, behavior mainly associated with the release of residual moisture and remaining volatile compounds. In contrast, biochars produced under higher thermal severity conditions showed more uniform thermal profiles with lower relative energetic perturbations, indicating progressive reduction of thermally labile components and greater stabilization of the carbon matrix.
In this context, DSC analysis does not directly identify aromatic reorganization processes or specific decomposition of lignocellulosic components; however, it does provide indirect evidence of the progressive thermal stabilization of the material as thermal severity increases during pyrolysis. The reduction in thermal events observed in biochars produced at elevated temperatures may be associated with a lower presence of reactive compounds and functionalized structures susceptible to further thermal transformations. Related studies have reported that pyrolysis at elevated temperatures favors the formation of more recalcitrant and thermally stable carbonaceous materials due to the overall advancement of the carbonization process [
3,
26].
It should be noted that DSC, whether under inert or oxidative atmosphere, quantifies heat flow rather than mass retention, and therefore does not directly measure thermal stability in the strict sense defined by mass-loss-based methods such as TGA. To address this limitation in the absence of TGA data for the biochar samples, thermal-oxidative stability in this study was assessed through the onset, peak, and half-release temperatures of the oxidative (pure O
2) DSC exotherm, a heat-flow-based analog of the T
50 concept used in the R
50 recalcitrance index [
19], rather than a direct substitute for mass-loss-based metrics. This distinction is made explicit to ensure terminological precision, and all thermal-oxidative stability claims in this study should be interpreted within this scope.
Beyond the numerical values of T_onset, T_peak, and T50, a qualitative distinction in exotherm morphology was observed across conditions. Most biochars exhibited a sharp, well-defined exothermic peak, consistent with a discrete oxidation event. In contrast, the biochars produced at 700 °C/60 min and 600 °C/30 min displayed a broad, continuously accelerating exothermic rise without a distinct early inflection, extending progressively toward the peak temperature. This morphology suggests a more gradual, distributed oxidation process lacking a single well-defined point of onset, a pattern consistent with a more homogeneous, less reactive carbon matrix, and therefore itself indicative of enhanced resistance to oxidation, rather than an artifact to be normalized away.
Overall, the results suggest that increasing thermal severity promoted a progressive transition from partially carbonized materials, containing higher concentrations of functional groups and residual volatile compounds, toward thermally more stabilized biochars. Nevertheless, although high-temperature conditions favored material stability, excessively severe thermal conditions may induce partial densification of the carbon matrix and reduced surface accessibility due to structural reorganization of certain porous domains.
Therefore, the integrated interpretation of FTIR and DSC analyses indicates that intermediate pyrolysis conditions, near 700 °C, may provide a favorable balance between thermal stability, partial preservation of surface functionality, and structural development of rice husk biochar.
4.3. Conceptual Model of Thermal Severity-Driven Structural Evolution
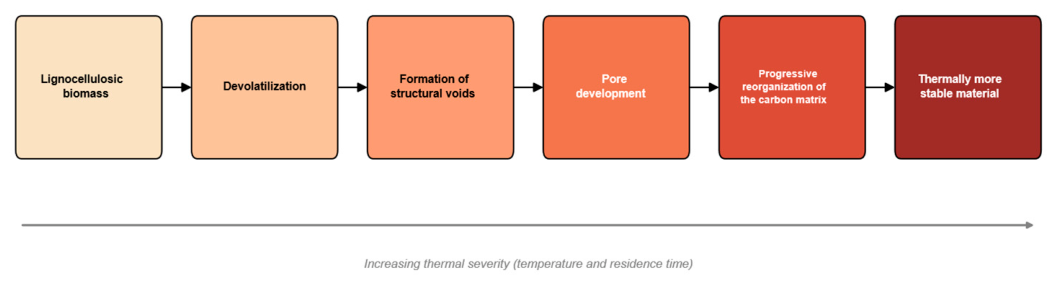
Based on the experimental evidence obtained from FTIR, BET, and DSC analyses, a conceptual framework is proposed to describe the structural evolution of rice husk biochar under increasing thermal severity during pyrolysis.
Initially, the lignocellulosic matrix undergoes progressive devolatilization processes mainly associated with the thermal degradation of hemicellulose and cellulose, promoting the release of volatile compounds and the initial formation of structural voids within the carbon matrix. At this stage, pore development begins together with gradual reorganization of the residual solid structure.
As temperature and residence time increase, the progressive elimination of oxygen-containing functional groups and secondary thermal decomposition reactions promote changes in the organization of the carbon matrix, favoring the formation of thermally more stable structures. Simultaneously, textural evolution leads to predominant mesopore development and progressive reduction of thermally labile components.
At higher levels of thermal severity, the carbonaceous material exhibits lower thermal reactivity and greater structural stability, behavior consistent with the overall advancement of carbonization and internal matrix reorganization processes. Nevertheless, excessively severe conditions may induce partial structural contraction and reduced surface accessibility due to reorganization of certain porous domains and the relative concentration of mineral phases.
The proposed conceptual model (
Figure 6) suggests that thermal severity not only controls product distribution during pyrolysis but also governs the progressive evolution of the structure and stability of rice husk biochar. This progression is consistent with the combined structural and thermal trends discussed throughout
Section 3.3 and
Section 4.1, converging on a single depiction of how thermal severity reshapes the biochar matrix from a functionalized, porous precursor into a thermally stabilized carbonaceous material.
5. Conclusions
In the present study, thermal severity associated with pyrolysis temperature, residence time, and heating rate was confirmed to be a determining factor in the structural evolution and thermal stabilization of rice husk biochar. The results demonstrated that the conversion of lignocellulosic biomass into carbonaceous material is not merely a simple carbonization process, but rather a progressive thermostructural reorganization involving devolatilization, pore formation, aromatic condensation, and stabilization of the carbon matrix.
The original biomass composition strongly influenced its thermal decomposition behavior and the subsequent formation of char. Biomass fractions enriched in lignin favored greater solid residue formation due to their aromatic and thermally resistant nature, whereas hemicellulose-rich fractions promoted earlier devolatilization and higher volatile production. Thermogravimetric analysis showed that the main decomposition stage occurred between 200 and 400 °C, corresponding primarily to hemicellulose and cellulose degradation, while lignin decomposition extended over a broader temperature range and contributed to stabilization of the carbon matrix.
Thermal severity significantly affected both biochar yield and structural transformation. Two-way ANOVA confirmed that temperature accounted for 88% of the total yield variance (), whereas the significant interaction between temperature and residence time (F = 6.19; p = 0.003) indicated that the effect of residence time on yield depended on temperature level, being more pronounced at 500 °C (range 49.5–59.4 wt%) and practically negligible at 600 °C (range 47.6–48.7 wt%). Lower pyrolysis temperatures (500 °C) favored carbon retention and higher solid yields by preserving part of the original biomass architecture. In contrast, increasing temperature to 700 °C promoted devolatilization and secondary cracking reactions, reducing biochar yield while favoring deeper structural reorganization and greater aromatic ordering. Therefore, a clear trade-off relationship was identified between solid yield and structural stabilization.
Furthermore, thermal severity strongly influenced pore structure evolution. Surface area increased monotonically with temperature, from 14.5 m2/g at 500 °C to 56.23 m2/g at 700 °C, through progressive devolatilization-induced pore generation, without evidence of matrix contraction or pore collapse within the evaluated temperature range. The modal pore diameter, in contrast, decreased sharply between 500 and 600 °C before stabilizing at 700 °C, suggesting an initial pore-refinement stage followed by pore coalescence at higher severity. The obtained biochars exhibited predominantly mesoporous structures with residual microporosity, indicating that pore development is directly linked to volatile release and carbon matrix reorganization during pyrolysis.
Surface chemical analysis confirmed that increasing thermal severity promoted progressive deoxygenation and defunctionalization of the biochar surface. The disappearance of hydroxyl, carbonyl, and aliphatic groups, together with the persistence and increasing intensity of aromatic C=C structures, indicated a transition from reactive lignocellulosic biomass toward condensed aromatic carbonaceous networks. Inert and oxidative DSC analyses simultaneously showed that increasing aromatic condensation reduced thermal reactivity and improved thermal-oxidative stability, reaching a maximum at the highest thermal severity evaluated (700 °C/60 min).
Complementary oxidative DSC analysis (pure O2) showed that the onset, peak, and half-release temperatures of the oxidative exotherm increased overall with thermal severity, reaching a maximum at 700 °C/60 min, providing a mass-independent, heat-flow-based line of evidence for thermal-oxidative stability that complements the mass-based assessments typically used in biochar research.
Overall, the results demonstrate that thermal severity governs biochar development through an integrated mechanism involving devolatilization-driven restructuring, elimination of oxygen-containing functional groups, pore formation, aromatic condensation, and stabilization of the carbon matrix. Among the evaluated conditions, the highest thermal severity (700 °C) provided the greatest structural organization, pore development, and thermal-oxidative stability, whereas lower severities favored carbon retention (biochar yield), evidencing a trade-off between these two performance dimensions. These findings contribute to the understanding of biochar formation mechanisms and provide a scientific basis for tailoring rice husk biochars with controlled structural and thermal properties for potential environmental and energy-related applications.




 ,
,