Article

Cloud Point Extraction as a Green Method for the Extraction of Antioxidant Compounds from the Juice of Second-Grade Apples

by
Maria-Ioanna Togantzi
1,
Martha Mantiniotou
1,
Dimitrios Kalompatsios
1,
Vassilis Athanasiadis
1,
Ioannis Giovanoudis
1,2 and
Stavros I. Lalas
1,*
1
Department of Food Science and Nutrition, University of Thessaly, Terma N. Temponera Street, 43100 Karditsa, Greece
2
Department of Agriculture Crop Production and Rural Environment, School of Agricultural Sciences, University of Thessaly, 38446 Volos, Greece
*
Author to whom correspondence should be addressed.
Biomass 2025, 5(3), 48; https://doi.org/10.3390/biomass5030048
Submission received: 24 July 2025 / Revised: 10 August 2025 / Accepted: 18 August 2025 / Published: 19 August 2025

Abstract

Every year, a substantial amount of food is discarded globally. A significant portion of this waste is composed of fruit by-products or fruits that do not meet consumer standards. Apples rank as the third most extensively produced fruit crop globally, generating substantial waste. This study examined apples that did not meet food industry standards and were destined for disposal. The objective was to recover bioactive compounds from their juice using Cloud Point Extraction (CPE). Like other extraction methods, CPE isolates target compounds from the sample, enhancing recovery yield. A primary advantage of CPE is that it operates without requiring specialized equipment or hazardous reagents. Additional benefits include efficacy, simplicity, safety, and speed. Furthermore, a food-grade surfactant, lecithin, was used to encapsulate bioactive compounds, ensuring non-toxicity for both humans and the environment. After three CPE steps, we recovered 95.95% of the total polyphenols from second-grade apple juice (initial TPC: 540.36 mg GAE/L). The findings highlight CPE’s effectiveness for polyphenol extraction and for producing antioxidant-rich extracts. These extracts may be utilized as nutritional supplements, feed additives, and for nutraceutical or medicinal applications.

1. Introduction

Bioactive molecules, which are essential for human health, are abundant in fruits and vegetables. Apple (Malus domestica Borkh) is widely cultivated and consumed globally [1]. This fruit is a member of the Rosaceae family and generates a wide variety of products, such as tea, jams, preserved fruits, purees, and juices [2]. Among the polyphenolic compounds found in apple juice, there are five main types: phenolic acids (mainly chlorogenic acid), flavonols (mainly different quercetin glycosides), flavanones (hesperidin), flavan-3-ols (catechin and epicatechin), and anthocyanins (mainly pelargonin chloride) [3].
Apples are widely consumed worldwide, with annual production exceeding 80 million tons [4]. Climate and environmental conditions, transportation and storage infrastructure, agricultural techniques, production surpluses, compliance with standards and laws, technological limitations, and primary processing all contribute to food losses during production and harvest [5]. Additionally, processing and production limitations, distribution system issues, product and packaging deterioration, marketing and sales strategies, over-purchasing and under-portioning, and storage mistakes are the main contributors to food waste during industrial processing, distribution, and consumption [6]. Social consequences such as starvation, nutritional deficiencies, and difficulties obtaining food are also caused by food losses or waste [7]. Also, greenhouse gas emissions, soil degradation, energy consumption, water resource waste, and economic implications such as the opportunity cost of farmland, the value of wasted food, and the value of negative externalities are more results of food waste.
Given that apple waste, which contains apples of lower quality (second-grade) that are not suitable for standard commercial sale, is not amenable to landfill disposal, it contributes to environmental strain [8]. In this regard, it is crucial to employ it in any manner that is convenient. Apple waste is rich in bioactive compounds. Recovering these compounds could be an effective way to valorize low-quality apples. They can be extracted from apples of a lower grade and employed in a variety of sectors [9]. Financial considerations have also stimulated researchers’ interest in repurposing apple waste into edible products. Additionally, non-food uses for these apples include manufacturing of chemicals, biofuels, or compost. Therefore, reusing apple waste is an important step in controlling pollution, conserving natural bioresources, and ensuring industrial economic stability [10].
Despite its widespread use and simplicity, solid–liquid extraction has a number of downsides when recovering polyphenols in the food industry. These include the lengthy processes involved, high production costs, and the heavy reliance on organic solvents [11]. Similarly, other approaches such as supercritical fluid extraction and ultrasound- and microwave-assisted extraction require excessive energy or expensive equipment to be practical for large-scale operations [12,13]. In addition, extracting all of the plant’s chemical components using traditional solvents is a challenging task since extraction of both polar and non-polar molecules cannot be performed simultaneously. Consequently, there is a significant need for an affordable, high-throughput approach to straightforwardly extract bioactive compounds on a large scale [14,15]. An environmentally conscious and viable extraction technique is the utilization of Cloud Point Extraction (CPE) in the isolation of bioactive molecules from plant sources [16]. Many sectors could benefit from this extraction method, including the food and pharmaceutical industries. This technique requires the use of a surfactant compound which is added to a liquid sample (waste) to extract selected bioactive compounds, and then is separated from the water phase of the sample [17]. The efficiency of bioactive component recovery can be enhanced by replicating CPE, a unique extraction process, in numerous phases [18]. Preconcentration of the recovered polyphenols in the surfactant phase is another significant advantage of this method in terms of its content analysis [19].
The objective of this study was to provide valuable and feasible valorization for second-grade apples (waste) into high-added-value extracts that would be employed in food, cosmetic, and pharmaceutical industries. The CPE technique was used for the extraction of antioxidants, mainly polyphenols and ascorbic acid. Optimization of the essential parameters of CPE procedure, including pH level and surfactant and salt concentration, took place. The results were evaluated through the determination of the above bioactive compounds and two in vitro antioxidant capacity assays. To the best of the authors’ knowledge, such a study has not been conducted to date.

2. Materials and Methods

2.1. Plant Material

Second-grade ‘Red Delicious’ apples were donated by a local farmer in Agia, Larissa, Greece (approx. 39°42′37.8″ N 22°45′05.2″ E). The apples showed visible quality imperfections (e.g., surface marks, irregular shapes), making them unsuitable for standard commercial sale.

2.2. Chemicals and Reagents

Sodium hydroxide pellets, anhydrous sodium carbonate, sodium bicarbonate, gallic acid, and Folin–Ciocalteu reagent were bought from Penta (Prague, Czechia). Hydrochloric acid, trichloroacetic acid, 2,4,6-tris(2-pyridyl)-s-triazine (TPTZ), 1,1-diphenyl-2-picrylhydrazyl (DPPH), L-Ascorbic acid, and methanol were obtained from Sigma-Aldrich (Steinheim, Germany). Soy lecithin (>97%) and sodium chloride were obtained from Carlo Erba (Milano, Italy). Citric acid anhydrous and iron (III) chloride hexahydrate were purchased from Merck (Darmstadt, Germany). Deionized water used in the conducted experiments was generated by a deionizing column.

2.3. Fruit Juice Analysis

The physicochemical properties of second-grade apple juice were determined. Upon arrival at the laboratory, an approximate mass of 2 kg of apples were washed thoroughly to remove any dust or foreign materials. The fruits were then cut into pieces using a ceramic knife and processed using an Oscar NeoDA100 cold-press juicer (Vitality 4 Life, Byron Bay, Australia) for approximately 10 min per kg of apples. To isolate the fruit juice, each slurry was passed through a sieve with a mesh size of 0.8 mm. A Neya 16R centrifuge from Remi Elektrotechnik Ltd. (Palghar, India) was employed to centrifuge apple pulp and discard solid residue. The resulting apple juice had a volume of 1 L and was used for all subsequent analyses. After filtration of the fruit pulp, the active acidity (pH) of juice was determined. A PC 60 VioLab pH meter (XS Instruments, Carpi, Italy) connected to an XS 201T DHS digital electrode was used for pH measurement. The titratable acidity (TA) of apple juice was determined by employing a traditional titration method. An acid–base titration was used to bring 2 mL of supernatant to a pH of 8.1. This was followed by diluting the mixture with 20 mL of deionized water. The results were expressed as the % w/w of malic acid. Total soluble solids (TSS) was determined using a Quartz digital refractometer (Medline Scientific Limited, Oxon, UK) and expressed in °Brix. Finally, the color coordinates (L*, a*, b*) of apple juice were measured using a Lovibond CAM-System 500 colorimeter from The Tintometer Ltd. (Amesbury, UK). All physicochemical measurements (pH, TA, TSS, color) were performed in triplicate.

2.4. Polyphenol Recovery Through CPE

2.4.1. CPE Procedure

The CPE procedure was conducted as in our previous work [20]. The apple juice was centrifuged for 20 min at 4500 rpm, after which the solids were discarded. The pH of the juice (ranging from 1 to 12) was then adjusted using citric acid or sodium bicarbonate [21]. Soy lecithin in different concentrations (1–25% w/v) was employed as the surfactant, since it is of natural origin and has no legislation limits (quantum satis) [22]. Sodium chloride was also used in various concentrations (1–25% w/v), as it is capable of decreasing the cloud point temperature [23]. The CPE method is also quite sensitive to temperature. As such, it is advised to increase the extraction temperature by ~15–20 °C over the surfactant’s cloud point. The extraction yield is therefore increased. Since thermolabile chemicals can decompose, temperatures between 40 and 60 °C are recommended [24]. To that end, we opted to conduct CPE using an MR Hei-Standard magnetic stirrer from Heidolph Instruments GmbH & Co. KG (Schwabach, Germany) at 45 °C for 20 min. The phases were separated after the centrifugation process at 3500 rpm for 5 min and by means of the decanting process (first stage), where the surfactant-rich phase was highly viscous. Centrifugation was followed by the determination of the volumes of the surfactant and water phases. The remaining polyphenols in the aqueous phase were removed using a subsequent second or third CPE stage. The recovery findings were the average of three extraction trials, as each CPE experiment was conducted under identical conditions in three separate replicates.

2.4.2. Polyphenol Recovery Calculation

A polyphenol mass balance was used to measure the percentage of polyphenol recovery. Based on prior investigation [25], we approximated the surfactant recovery using the following equation:
Recovery   ( % )   =   C s · V s C o · V o   ×   100   =   C o · V o     C w · V w C o · V o   ×   100
where Cs is the polyphenol concentration in the surfactant phase volume (Vs), Co is the polyphenol content in the initial sample volume (Vo = 10 mL), and Cw is the polyphenol concentration in the aqueous phase volume (Vw).

2.5. Bioactive Compound Determination

2.5.1. Total Polyphenol Content (TPC)

Determination of TPC was conducted, as per previously established work [20], based on the Folin–Ciocalteu method. By producing an oxidized phenolate ion, the Folin–Ciocalteu reagent is reduced (from Mo+6 to Mo+5) when a phenolic proton dissociates under acidic conditions [26]. Briefly, a 2 mL polypropylene tube was filled with 1600 μL of a 5% w/v aqueous sodium carbonate solution two min after 200 μL of diluted sample and 200 μL of Folin–Ciocalteu reagent were mixed. Following 20 min of incubation at 40 °C, the absorbance of the bluish mixture at 740 nm was recorded. All spectrophotometric analyses were conducted using a Shimadzu UV-1900i spectrophotometer from Shimadzu Europa GmbH (Duisburg, Germany). Using a gallic acid calibration curve (10–100 mg/L in methanol), the total polyphenol content was determined. The results were expressed as mg of gallic acid equivalents (GAE) per L of liquid material.

2.5.2. Individual Polyphenol Quantification

Following the methodology outlined in our earlier work [27], we used high-performance liquid chromatography (HPLC) to quantify the different polyphenols in apple juice. A liquid chromatograph model CBM-20A connected with an SPD-M20A diode array detector (DAD) from Shimadzu Europa GmbH (Duisburg, Germany) was employed for the quantification process of individual polyphenolic compounds. The separation process of these compounds was performed on a Phenomenex Luna C18(2) column (100 Å, 5 μm, 4.6 mm × 250 mm) from Phenomenex Inc. (Torrance, CA, USA), where the temperature was kept constant at 40 °C. Mobile phase A: water with 0.5% (v/v) formic acid; mobile phase B: acetonitrile. This started at 0% and gradually increased to 40% B, 50% B after 10 min, 70% B after another 10 min, and was finally constant for 10 min. The mobile phase was set to flow at a rate of 1 mL/min. Calibration curves were used to quantify the compounds, which were identified by comparing their absorbance spectra and retention times to those of pure standards (0–50 mg/L). Detailed information about the identification and quantification of each polyphenol is listed in Table A1. The results were expressed as mg per L of liquid material.

2.5.3. Ascorbic Acid Content (AAC)

A previously established colorimetric method was used to determine AAC [20]. This approach was verified by Jagota and Dani [28]. The potent reductant ascorbic acid can react with the Folin–Ciocalteu reagent and absorb light at 760 nm in acidic conditions without turning into its dehydro form. The mixture consisted of 100 μL of the extract and 900 μL of a 10% w/v aqueous trichloroacetic acid solution. The sample was then mixed with 500 μL of a solution that included 10% (v/v) Folin–Ciocalteu reagent. The absorbance was measured at 760 nm after a 10 min delay. An ascorbic acid calibration curve (10–80 mg/L) was employed to express the results in mg ascorbic acid per L of liquid sample.

2.6. In Vitro Antioxidant Capacity Evaluation

2.6.1. Ferric-Reducing Antioxidant Power (FRAP)

The antioxidant capacity was assessed using the FRAP assay, using a well-established methodology [27]. Starting under acidic conditions using aqueous hydrochloric acid solution (0.05 M), the reduction of Fe(III)-TPTZ to Fe(II)-TPTZ produces a blue mixture and is essential to the process because it maintains iron solubility [26]. Volumes of the diluted sample (100 μL) and a FeCl3 solution (100 μL, 4 mM in 0.05 M HCl) were mixed in a 2 mL polypropylene tube. Then, an immediate addition of TPTZ solution (1800 μL, 1 mM in 0.05 M HCl) was performed after incubating the mixture at 37 °C for 30 min. Finally, the absorbance of the bluish mixture was recorded at 620 nm after a 5 min delay. A calibration curve (50–500 μM ascorbic acid in 0.05 M HCl) was used to determine the ferric-reducing power of the liquid material. The results were expressed as mmol ascorbic acid equivalents (AAE) per L of liquid material.

2.6.2. DPPH Radical Scavenging Activity

Using an approach by Mantiniotou et al. [27], we further assessed the antioxidant activity of apple juice by measuring the inhibitory activity. The foundation of this process is using electron delocalization in an extended conjugated π system to create a stable, decolorized chemical that does not polymerize [26]. Briefly, the volume of the appropriately diluted sample (50 μL) was combined with purple methanolic DPPH solution (1950 μL, 100 μM). The mixture was then left at room temperature for 30 min in the absence of light. The absorbance of the decolorized solution was measured at 515 nm. DPPH solution and methanol were mixed to form a blank sample, and the absorbance was recorded without delay. Equation (2) was used to determine the inhibition percentage:
Inhibition   %   =   A 515 i     A 515 f A 515 i   ×   100
Finally, a calibration curve for the antiradical activity of ascorbic acid (100–1000 μmol/L in methanol) was employed, and the results were expressed as mmol AAE per L of liquid material.

2.7. Statistical Processing

Triplicate analyses were performed on the samples. Data were presented as the mean of three replicates with the standard deviation. The Kolmogorov–Smirnov test was employed to determine if the data were normally distributed. Statistically significant differences were determined using a one-way analysis of variance (ANOVA) in IBM SPSS Statistics (Version 29.0). To further establish statistical significance, we employed a p-value threshold of less than 0.05.

3. Results and Discussion

3.1. Physicochemical Characteristics of Apple Juice

We first performed a thorough examination of the apple juice physicochemical properties before applying and optimizing the CPE technique. Results are summarized in Table 1. Active acidity was measured at 3.83 ± 0.13, whereas TA had a value of 0.93 ± 0.06% w/w of malic acid and TSS was determined at 14.41 ± 0.79. The latter two values were further examined to express sweetness and astringency indices. Finally, the specific color coordinates L* (75.1 ± 0.9), a* (3.2 ± 0.1), and b* (20.3 ± 0.6) gave apple juice a brownish color.
Similar results were obtained in the study from Cendrowski et al. [29] who examined Szampion variety apple juices from Poland. The value of pH was found to be 3.6 and the TSS 13.2 °Brix, whereas the color coordinates L* (93.71), a* (0.40), and b* (7.12) were also determined. In addition, Will et al. [30] examined juice from ‘Topaz’ and ‘Boskoop’ apple cultivars. The authors determined TSS of 13.45–14.03, a pH level of 3.08–3.11, and TA levels of 10.4–10.5, respectively.

3.2. Optimizing CPE Procedure

3.2.1. Optimal pH Level

An essential CPE parameter is pH optimization. Depending on the chemical composition and pH of the solution, analytes might exist in several forms in solution. Both charged and uncharged versions of the analyte may be present in the extract. The neutral form of the molecule has a stronger interaction with the micellar aggregation than the ions generated when a weak acid or base is protonated [31]. If this is the case, the analyte is best partitioned into the micellar phase of the nonionic surfactant at pH values where its uncharged form predominates, and the extraction efficiency is maximized [32].
The recovery of polyphenols was therefore the subject of research to determine the effect of different pH levels. The impact of pH on the extraction efficiency of polyphenolic compounds was clear. Statistically significant differences (p < 0.05) were observed at the maximum recovery of ~75% at a pH value of 4, as shown in Figure 1. Polyphenol recovery decreased with increasing pH values beyond this point. The lowest percentage of polyphenol recovery (~45%) was found at pH 12. It can be deduced that optimum pH level is relevant to the bioactive compounds found in each plant material. For instance, it was reported that the optimum pH level was acidic (i.e., at 3.50) when recovering polyphenols from peaches [33] and neutral in overripe banana [20] and lemon peels [34]. However, pH levels above 7 are not recommended according to the literature.

3.2.2. Optimal Surfactant Concentration

Amphiphilic compounds like lecithin may include several compounds such as phosphatidylcholine, phosphatidic acid, phosphatidylinositol, and phosphatidylethan-olamine. These emulsifiers are widely used in the food industry and do not have any limits on the maximum levels (quantum satis). Phospholipids have beneficial impacts on human health, and lecithins are in line with regulations, rendering them a safer alternative compared to synthetic surfactants [35]. Therefore, this extraction technique could be adopted by food industries due to its ease of implementation and low expenses.
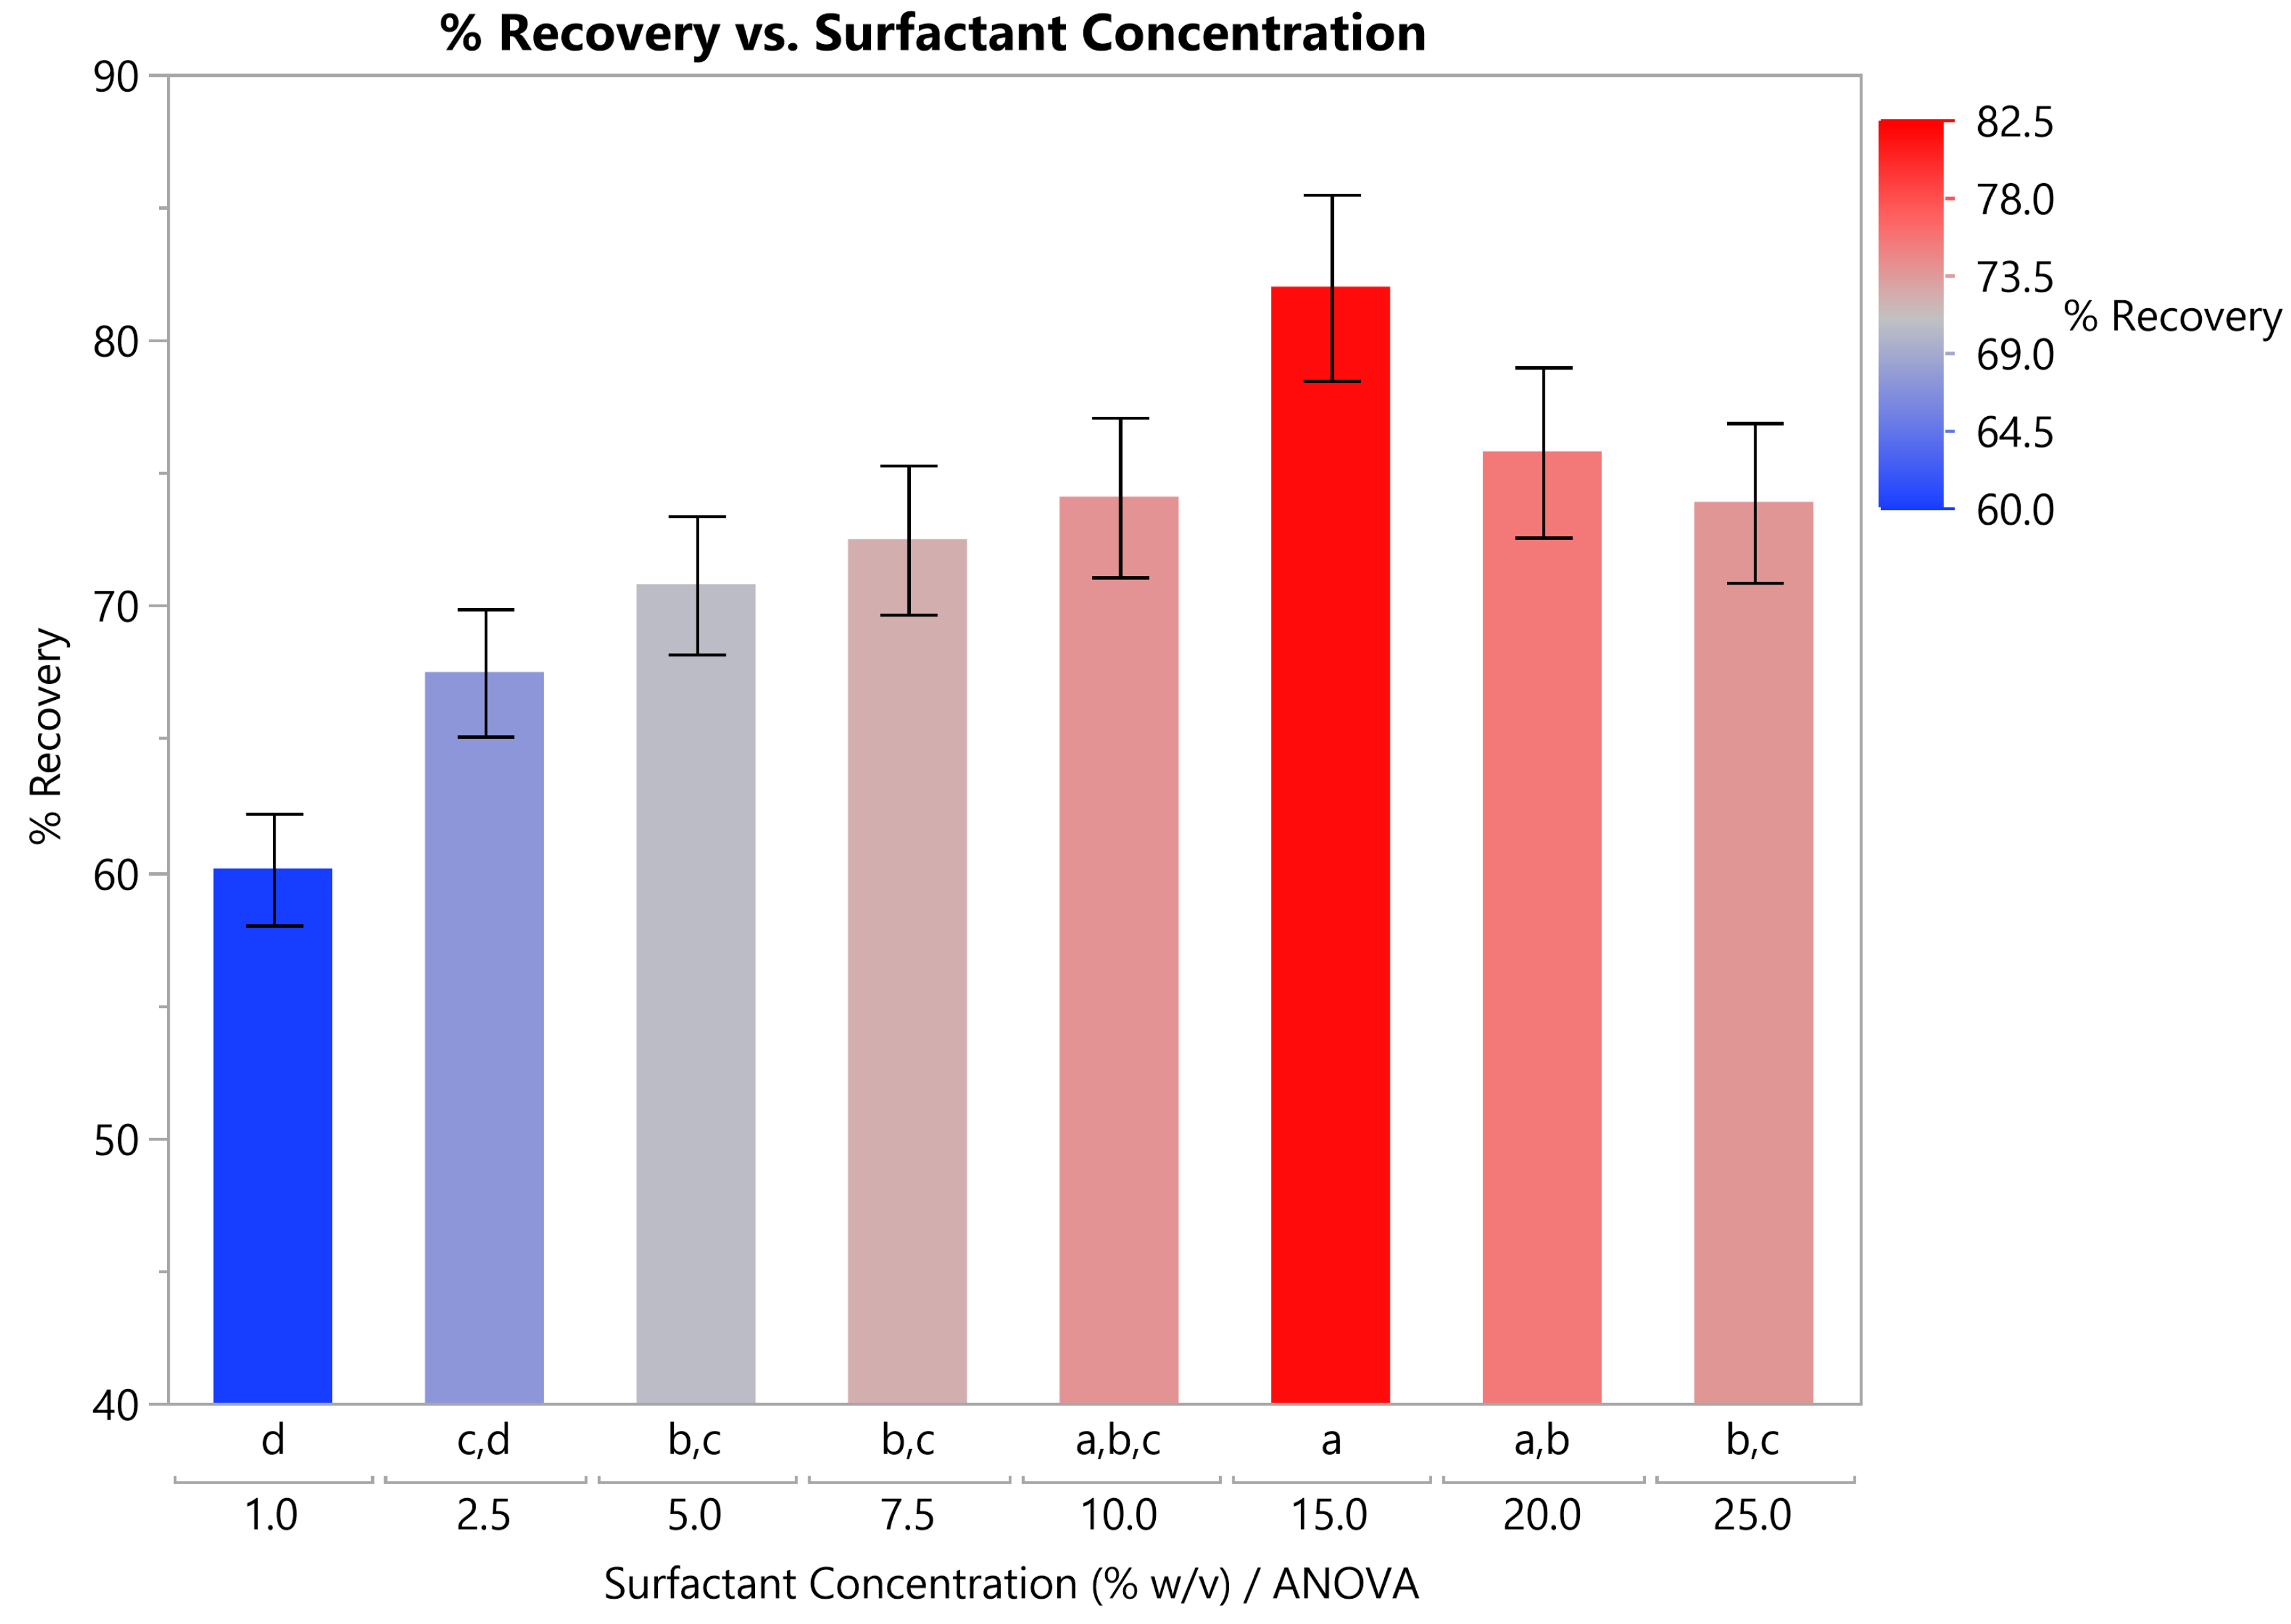
According to the obtained results in Figure 2, a polyphenol recovery yield ranging from ~60 to 82% was obtained in a dose-dependent manner with lecithin concentration. Surfactant molecules become tightly bonded and aggregate into colloidally sized molecular aggregates when their concentration exceeds a specific threshold. To prevent their hydrophobic tails from coming into contact with water, micelles point their hydrophilic heads toward the direction of the water molecules on the surface [36]. This is a probable mechanism in which bioactive compounds are isolated from their matrix. However, a 15% lecithin concentration was found the optimum with statistically non-significant differences with the 20% concentration, whereas concentrations above this level did not improve the yield. As a result, we selected a 15% concentration, which yielded the same recovery rate as a 20% concentration while minimizing lecithin wastage, especially when considering a possible application in the food industry. It was anticipated that the total recovery would increase when multiple steps of CPE with the selected concentration were implemented. In a similar study from Karadag et al. [37], the authors used 15% w/v of lecithin to isolate bioactive compounds from olive mill wastewater.

3.2.3. Optimal Salt Concentration

In the presence of an electrolyte concentration that is relatively high, the non-electrolyte becomes less soluble, a phenomenon known as the salting-out effect. Inserting salt into a micellar solution raises the dehydration level of the micelles, which in turn increases the hydrophobic interactions between them. A turbidity issue might occur when the surfactant concentration is too high. Using the salting-out effect in CPE eliminates the heating process, which in turn reduces the separation time [38]. Particularly for more polar compounds, electrolytes increase extraction efficiency [39].
Τhe impact of salt concentration in terms of enhancing polyphenol extraction through the salting-out effect was examined. Figure 3 illustrates the obtained results where the recovery rate ranged from 70 to 87.5%. It was found that the optimum salt concentration with no statistically significant differences (p > 0.05) was between 5 and 10%. In previous studies, different salt proportions were demanded. Specifically, Motikar et al. [40] used 14% sodium chloride to extract polyphenols from pomegranate peels, whereas Giovanoudis et al. [22] only used 3% w/v salt to recover polyphenols from peach wastewater. This difference in salt concentration could be a matter of different matrices. In preliminary experiments, sodium chloride was found to be the most preferable salt. However, the appropriate salt concentration was chosen to be 5% w/v considering the cost of operation.

3.3. Optimal Sample Analysis

3.3.1. Optimized Polyphenol Recovery Through CPE

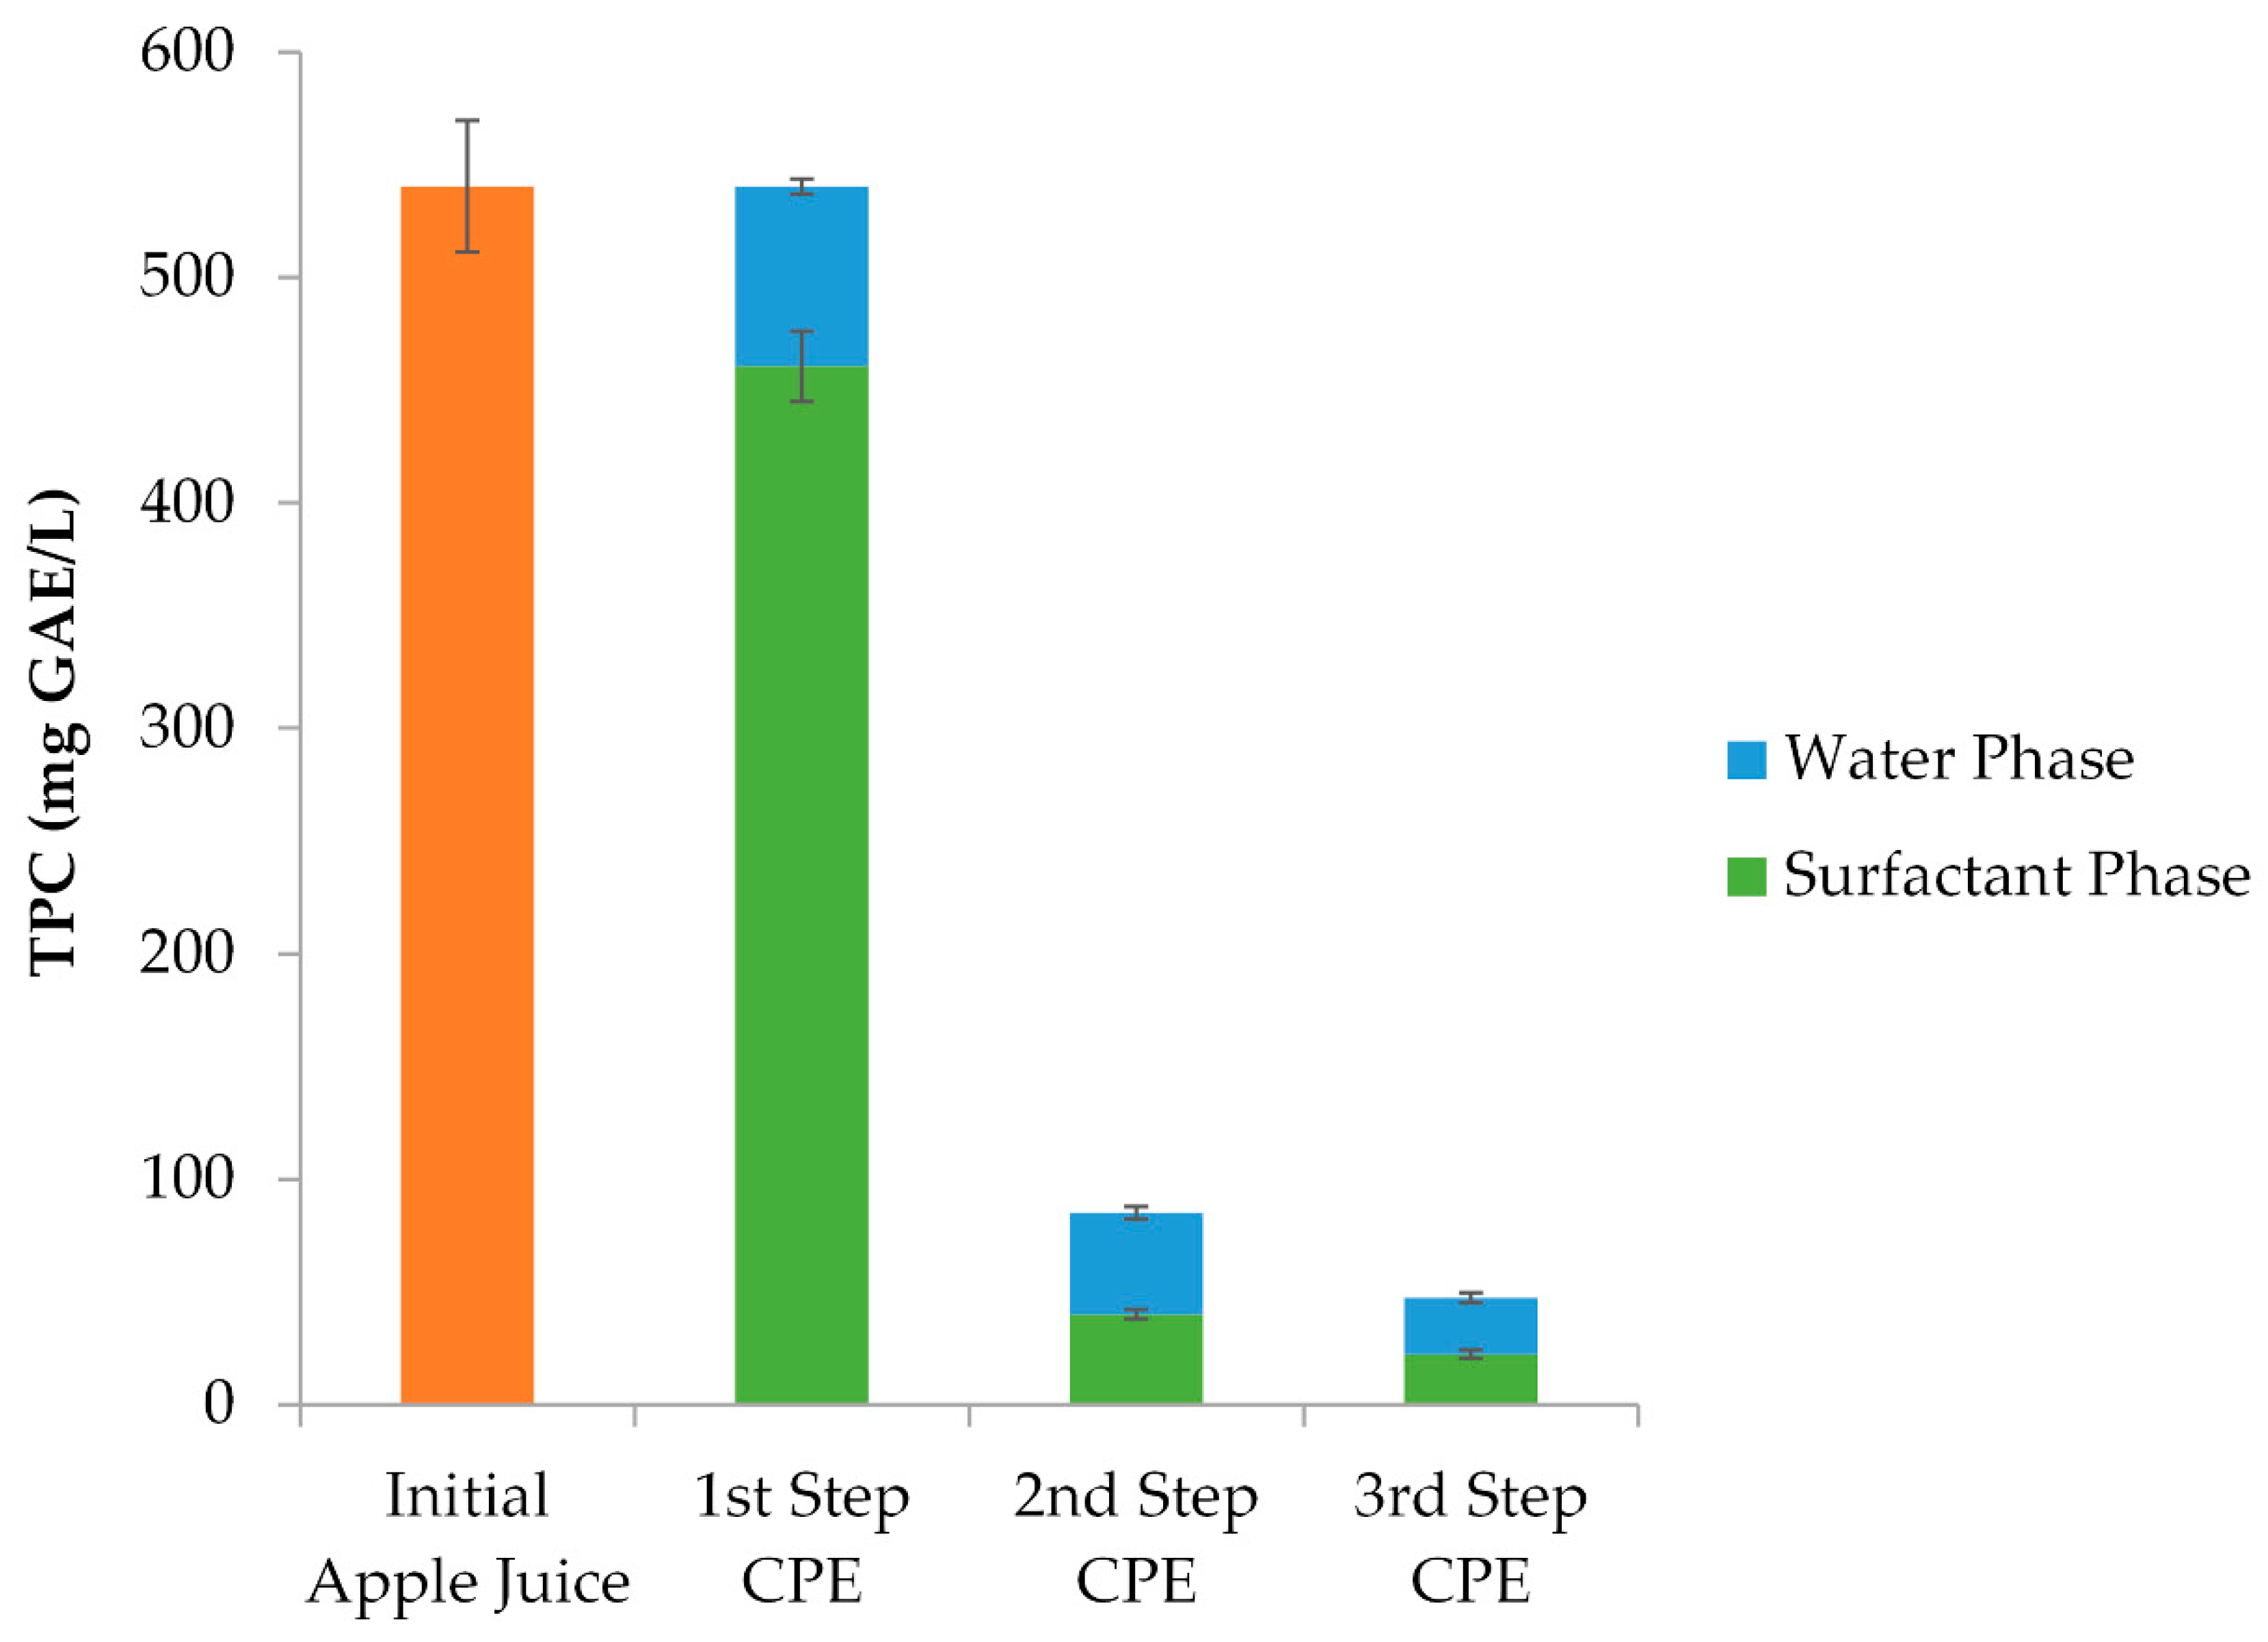
This study aimed to quantify the amount of polyphenol that CPE could extract from second-grade apple juice. After the optimization process, the procedure was conducted in a three-step CPE involving a 15% w/v lecithin and 5% w/v salt concentration at pH 4 for each step. The three phases of CPE and the recovery from the initial sample are shown in Figure 4, together with the TPC recoveries from the surfactant/micellar phase (SP) and the water phase. The surfactant phase TPC recovery was 85.85% in the first extraction step, 6.48% in the second, and 3.62% in the third. Through all stages of CPE, the surfactant phases achieved a total recovery of up to 95.95%. The TPC values from each distinct step of the CPE summed to 540.36 mg GAE/L. In contrast, the final sample from CPE, which contained the combined three micellar phases, produced a total of 518.47 mg GAE/L, which was comparable to the initial juice.

3.3.2. Comparison Between Apple Juice and Surfactant Phase

The combined surfactant samples from all three CPE stages were used for all analyses. The results are demonstrated in Table 2. A preliminary sample taken before treatment and a final sample consisting of all three micellar phases were both measured. Furthermore, preliminary experiments were implemented to examine the antioxidant properties of lecithin and its potential impact on the extract’s antioxidant properties. It was found that lecithin had no antioxidant capabilities and, hence, did not affect the antioxidant capabilities of the extract. A 3.14% decrease in TPC was noted in the final CPE sample after combining all three samples from CPE procedure (523 mg GAE/L) when compared to apple juice (540 mg GAE/L), but no statistically significant difference (p > 0.05) was found between them. The reason that some polyphenols remained in the water phase could lie in their high hydrophilicity. Similar results were obtained in the study by Will et al. [30] who determined ~650 mg GAE/L in ‘Topaz’ apple juice and ~850 mg GAE/L in ‘Boskoop’ apples, whereas Nour et al. [41] quantified 284.70 mg GAE/L of apple juice through the HPLC method and Cendrowski et al. [29] determined 426.9 mg GAE/L. In the latter study [29], the authors also determined the AAC value from apple juice, found to be 11.4 mg/L, which was significantly lower than the CPE-recovered ascorbic acid (35.4 mg/L). However, the differences in TPC (540 mg GAE/L) and AAC (39.1 mg/L) values could be a matter of different apple cultivars. Regarding antioxidant capacity, it was found that apple juice had significantly higher value both in FRAP and DPPH methods, despite having similar values in TPC. This finding could be a matter of specific polyphenols that were not recovered or (yielded in lower proportions) by the CPE technique. It should be noted that CPE did not yield as many polyphenols as in our previous work [27]. In this study, we employed multiple extraction techniques including Pulsed Electric Field, ultrasound-assisted extraction, and stirring. We yielded 772.5 mg GAE/L using 50% hydroethanolic mixture as the extraction solvent, which was a significantly higher amount than from the obtained SP sample (523 mg GAE/L). However, the vast difference in the recovered polyphenols could be a matter of different apple cultivars and quality.
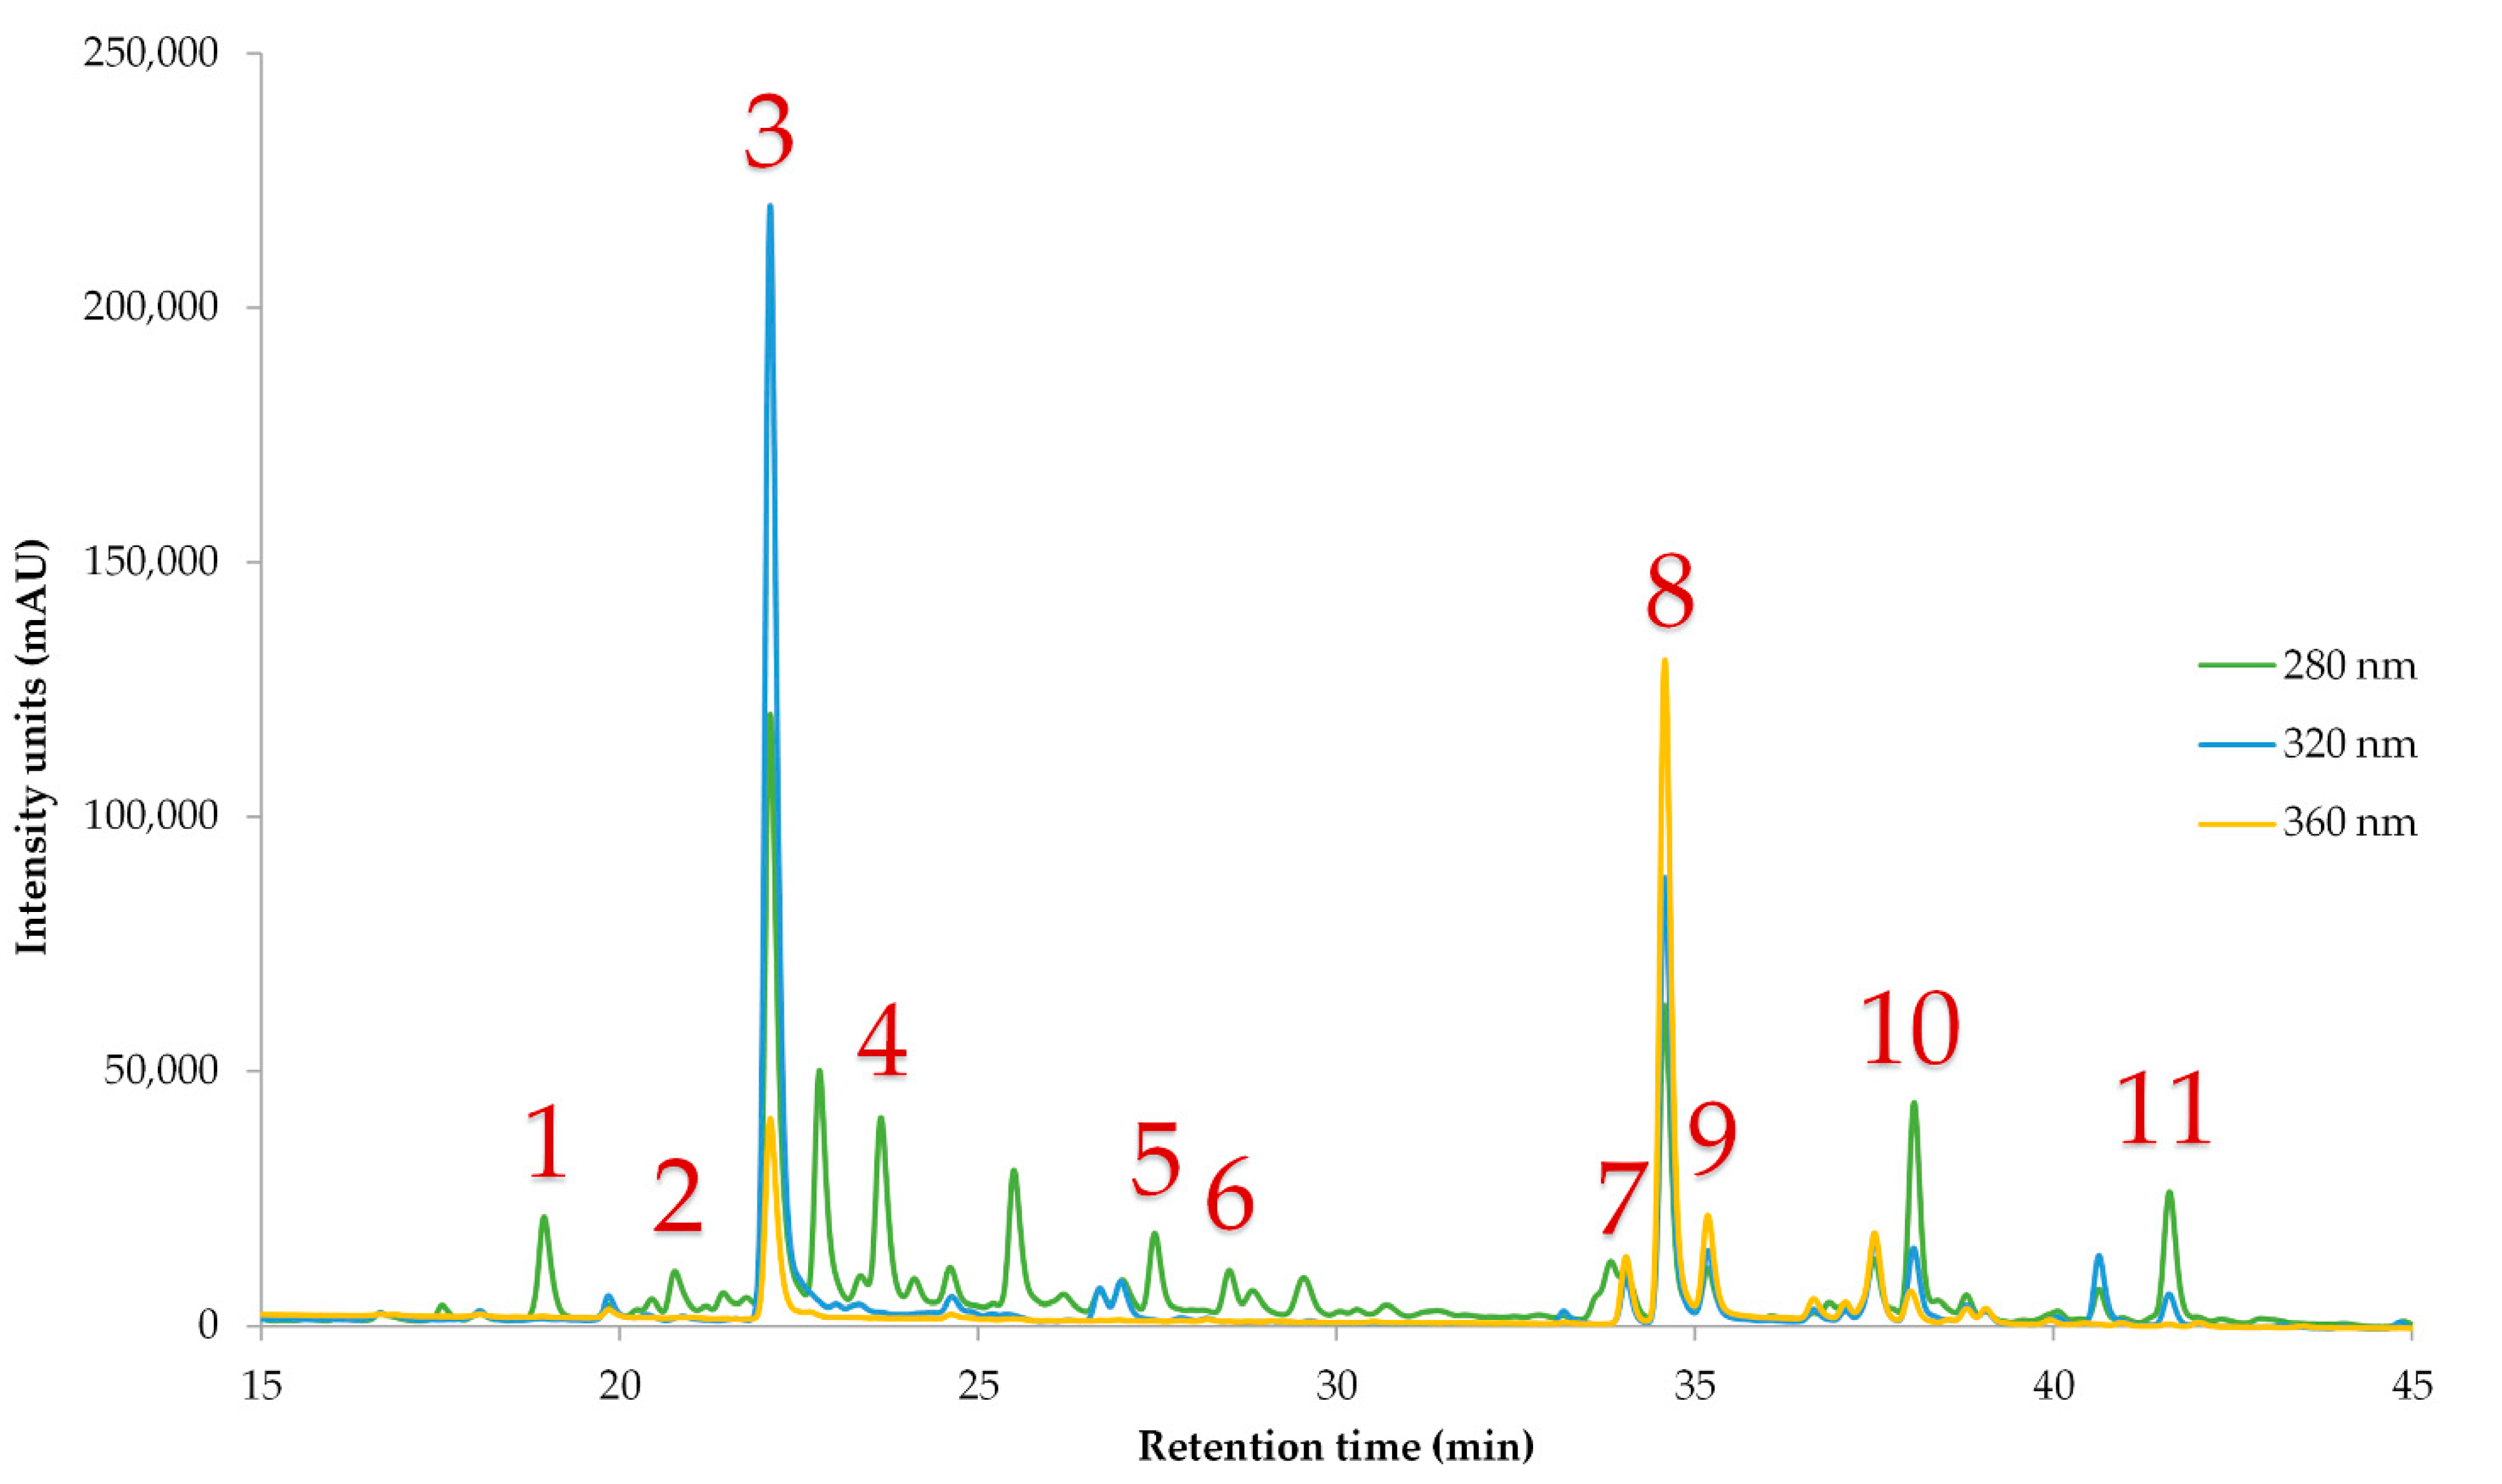
Eleven individual polyphenols were quantified using the HPLC–DAD method, and the results are presented in Figure 5. Pelargonin and especially chlorogenic acid were the most abundant polyphenols found in apple juice, yielding a total of 414.4 mg/L (80.6% of total polyphenols). Chlorogenic acid was also the most abundant polyphenol in the study by Nour et al. [41], yielding ~50% of the total quantified polyphenols (284.70 mg/L). This specific polyphenol is known for its significant health benefits, including antioxidant and anti-inflammatory properties and safeguarding against cardiovascular diseases and diabetes [42,43]. It should be noted that most identified polyphenols did not significantly vary (p > 0.05) between apple juice and optimal SP samples with the exception of carnosol, narirutin, and the two quercetin derivatives (p-values are also shown in Table 2). Finally, the SP sample was stable enough in terms of polyphenol stability, as the quantified polyphenols did not significantly vary after one month of storage. In a future study, we could thoroughly examine the stability of an SP sample with CPE-extracted polyphenols after a prolonged exposure time.

3.3.3. Correlation Analysis

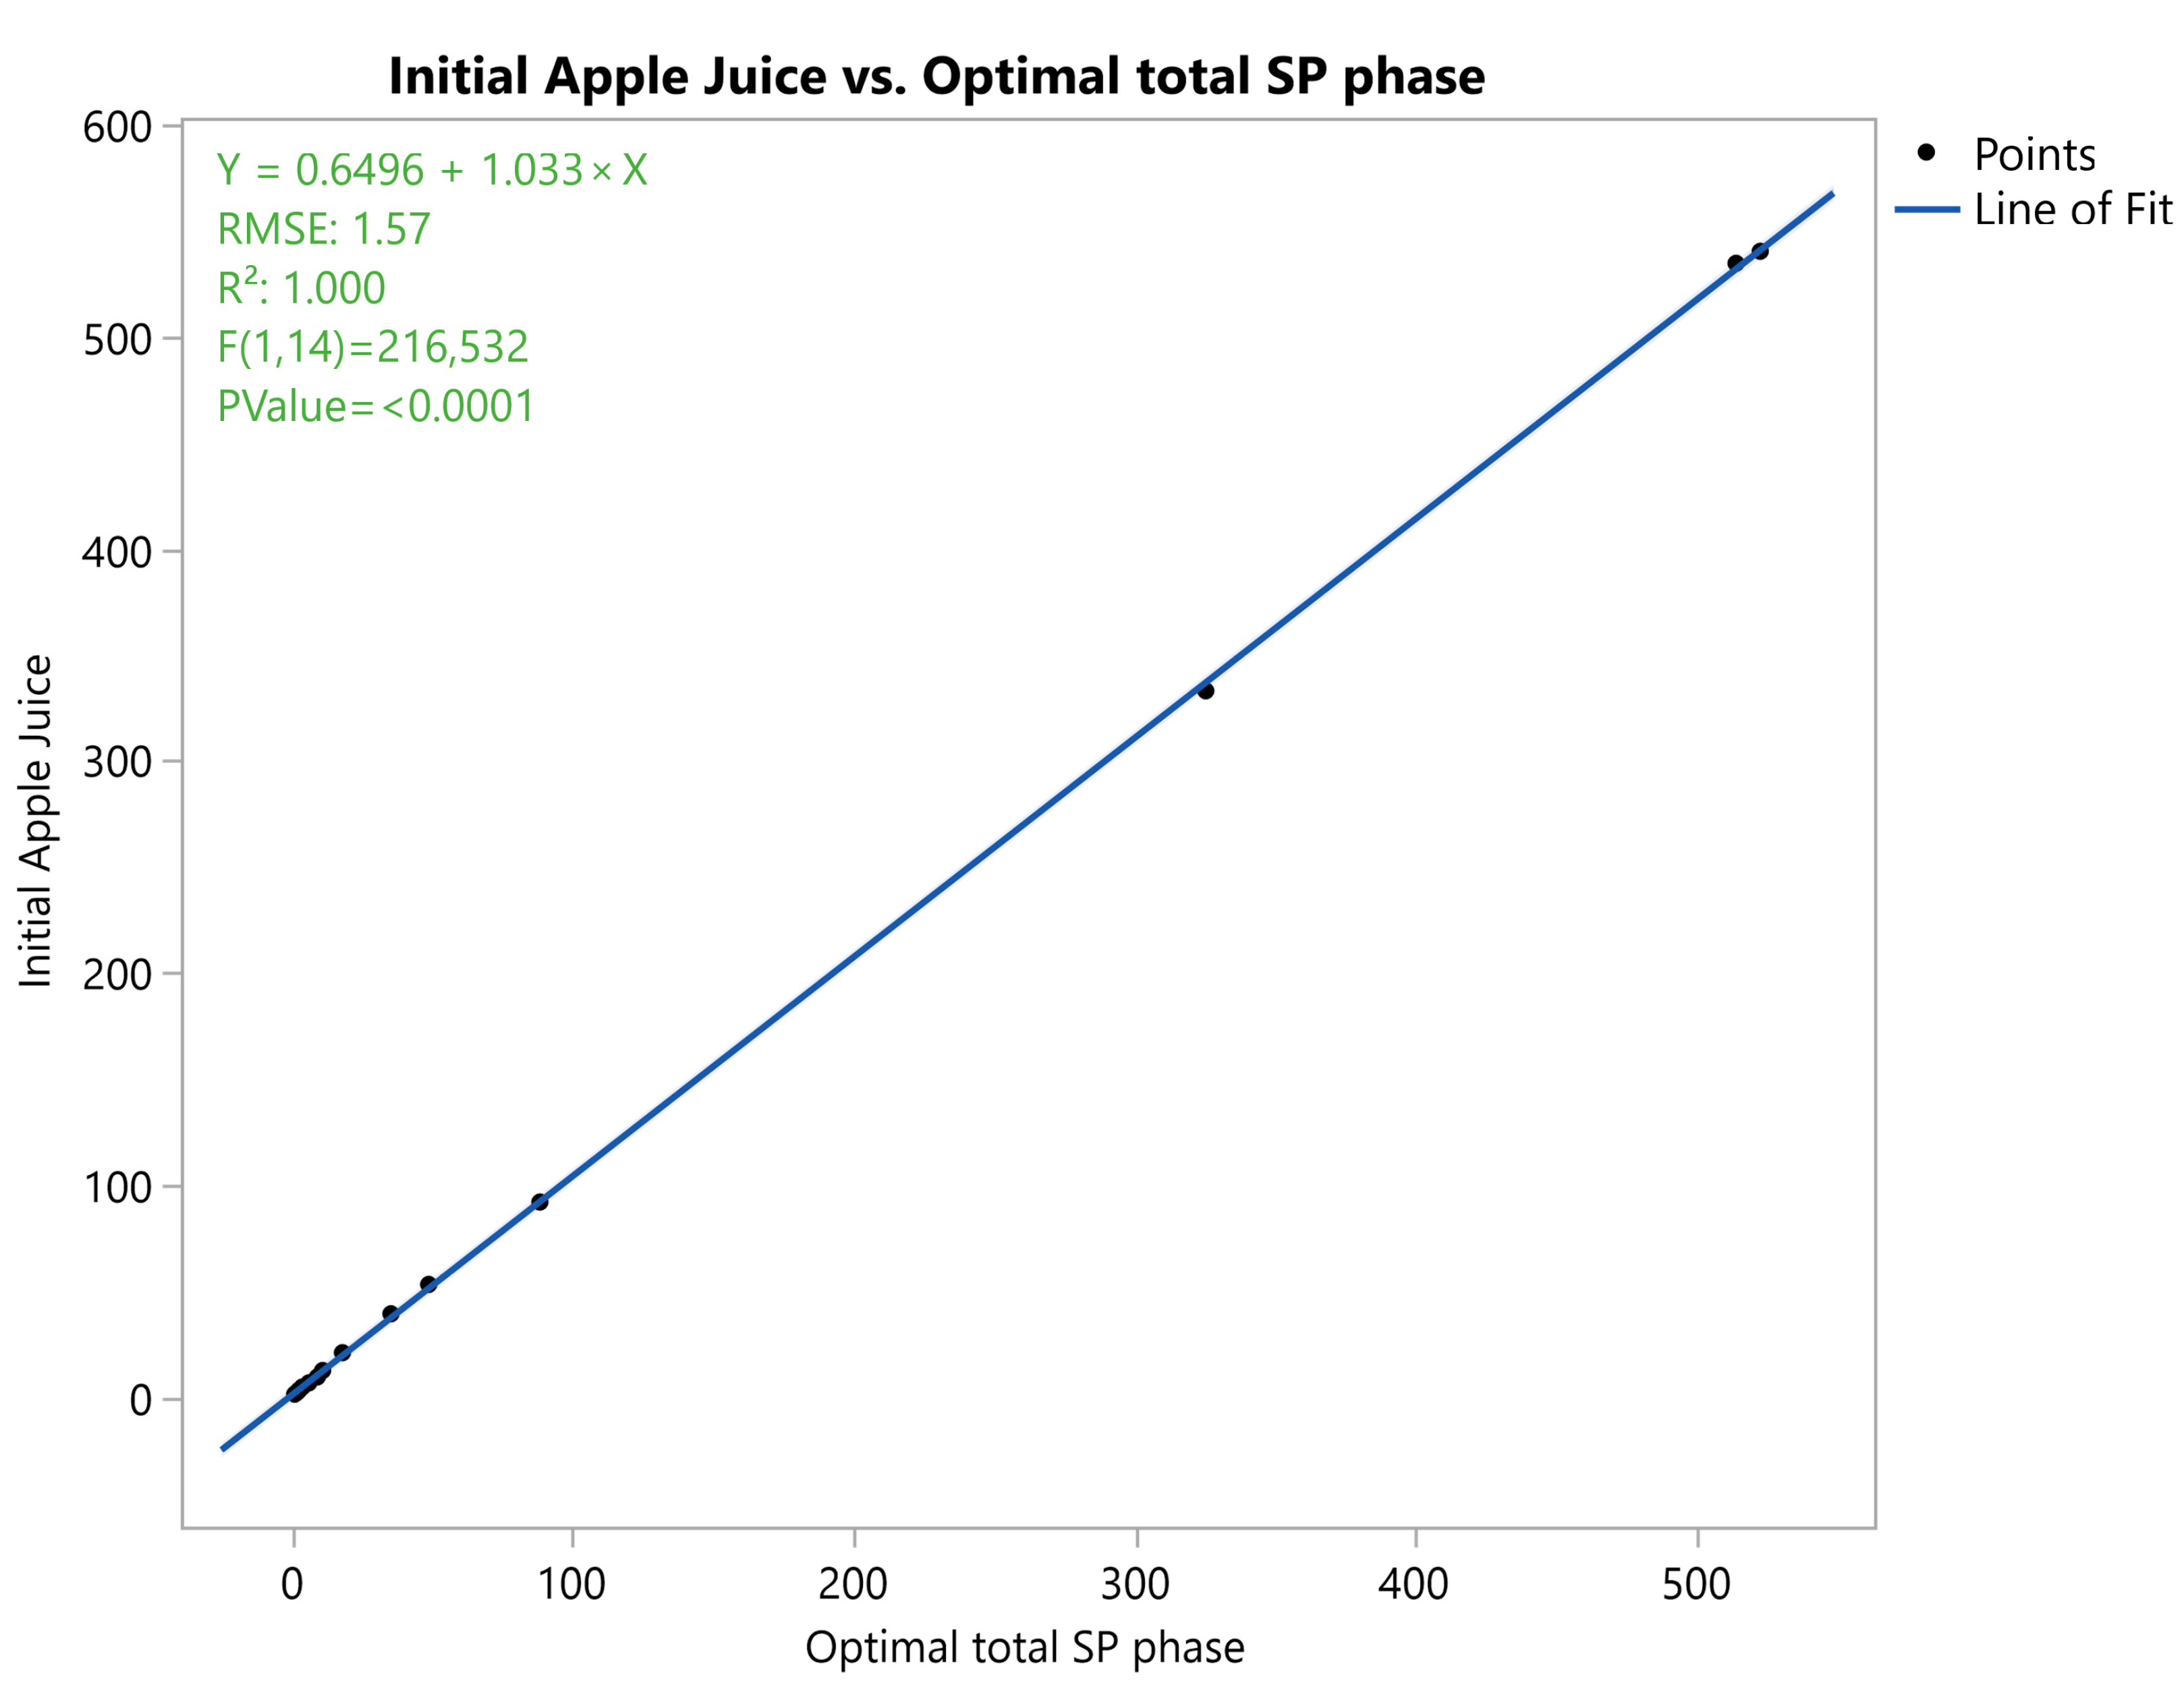
Figure 6 shows a perfect linear correlation between initial apple juice and optimal total SP, as evidenced by an R2 value of 1.000. This means that 100% of the variability in the dependent variable is explained by the independent variable. The F-statistic (F(1,14) = 216.532, with p-value < 0.0001) further confirms the significance of this relationship, indicating that the observed pattern is statistically strong and unlikely to be due to random chance. Such an exceptionally high correlation suggests either a well-controlled experimental setting or highly dependent variables, reinforcing the predictive power of initial apple juice in determining the optimal total SP. However, in practical applications, it is essential to assess potential overfitting, data accuracy, or experimental limitations to ensure the validity of these findings.

4. Conclusions

The present investigation evaluated the antioxidant capacity and polyphenol recovery of second-grade apple juice using CPE. The primary objective was to optimize the CPE with a natural surfactant, lecithin, through the optimization of its essential parameters: pH, surfactant concentration, and salt content. The optimal surfactant-rich phase (SP) sample showed consistent concentrations of bioactive compounds. These results indicate that second-grade apples represent a viable source of food additives for human consumption, owing to their high polyphenol content, including catechin and pelargonin, which can enhance the antioxidant properties of food products. Future studies should compare the CPE technique with other green extraction techniques in terms of polyphenol recovery efficiency, operational simplicity, large-scale applicability, and total cost. It is also essential to assess polyphenol stability after prolonged storage and explore the feasibility of simultaneously extracting flavor compounds from second-grade apples. The long-term stability of polyphenols recovered in the SP could benefit sectors including food and pharmaceuticals, improving both flavor profile and bioactivity, and thereby increasing consumer appeal.

Author Contributions

Conceptualization, V.A., I.G., and S.I.L.; methodology, V.A.; software, V.A.; validation, V.A.; formal analysis, M.-I.T., M.M., and V.A.; investigation, M.-I.T., D.K., and M.M.; resources, I.G. and S.I.L.; data curation, D.K., M.M., and V.A.; writing—original draft preparation, D.K. and M.M.; writing—review and editing, M.-I.T., D.K., M.M., V.A., I.G., and S.I.L.; visualization, D.K. and M.M.; supervision, V.A., I.G., and S.I.L.; project administration, S.I.L.; funding acquisition, S.I.L. All authors have read and agreed to the published version of the manuscript.

Funding

This research received no external funding.

Data Availability Statement

The original contributions presented in this study are included in the article; further inquiries can be directed to the corresponding author.

Conflicts of Interest

The authors declare no conflicts of interest.

Appendix A

Table A1. Equation of calibration curves for each compound identified through HPLC-DAD.
Polyphenolic CompoundEquationR2RT (min)λmaxLOD
(mg/L)
LOQ
(mg/L)
Pelargonin chloridey = 1610.01x − 2626.920.99718.9002752.848.61
Catechiny = 11,920.79x − 128.190.99720.9332782.547.71
Chlorogenic acidy = 50,320.40x − 23,038.360.99421.9473253.6711.11
Vanillic acidy = 28,178.39x + 15,571.90.99923.9002702.316.99
Syringic acidy = 24,093.04x + 6513.280.99927.4103603.179.59
Carnosoly = 2553.28x − 17,572.600.95928.53127118.5556.21
Rutiny = 46,365.62x − 31,562.740.99734.1072542.658.03
Quercetin 3-D-galactosidey = 41,489.69x − 35,577.550.99334.5982573.9612.00
Quercetin 3-b-D-glucosidey = 45,580.75x + 94,644.940.99035.1662564.8314.65
Narirutiny = 48,756.23x + 20,853.700.99838.0232821.986.00
Hesperidiny = 33,528.61x − 30,502.750.99541.6492833.5910.87

References

  1. Vasile, M.; Bunea, A.; Ioan, C.R.; Ioan, B.C.; Socaci, S.; Viorel, M. Phytochemical Content and Antioxidant Activity of Malus domestica Borkh Peel Extracts. Molecules 2021, 26, 7636. [Google Scholar] [CrossRef]
  2. Patocka, J.; Bhardwaj, K.; Klimova, B.; Nepovimova, E.; Wu, Q.; Landi, M.; Kuca, K.; Valis, M.; Wu, W. Malus domestica: A Review on Nutritional Features, Chemical Composition, Traditional and Medicinal Value. Plants 2020, 9, 1408. [Google Scholar] [CrossRef]
  3. Acquavia, M.A.; Pascale, R.; Foti, L.; Carlucci, G.; Scrano, L.; Martelli, G.; Brienza, M.; Coviello, D.; Bianco, G.; Lelario, F. Analytical Methods for Extraction and Identification of Primary and Secondary Metabolites of Apple (Malus domestica) Fruits: A Review. Separations 2021, 8, 91. [Google Scholar] [CrossRef]
  4. Asma, U.; Morozova, K.; Ferrentino, G.; Scampicchio, M. Apples and Apple By-Products: Antioxidant Properties and Food Applications. Antioxidants 2023, 12, 1456. [Google Scholar] [CrossRef]
  5. Perdana, T.; Kusnandar, K.; Perdana, H.H.; Hermiatin, F.R. Circular Supply Chain Governance for Sustainable Fresh Agricultural Products: Minimizing Food Loss and Utilizing Agricultural Waste. Sustain. Prod. Consum. 2023, 41, 391–403. [Google Scholar] [CrossRef]
  6. Kechagias, E.P.; Gayialis, S.P.; Panayiotou, N.; Papadopoulos, G.A. A Holistic Framework for Evaluating Food Loss and Waste Due to Marketing Standards across the Entire Food Supply Chain. Foods 2024, 13, 3273. [Google Scholar] [CrossRef]
  7. Said, Z.; Vigneshwaran, P.; Shaik, S.; Rauf, A.; Ahmad, Z. Climate and Carbon Policy Pathways for Sustainable Food Systems. Environ. Sustain. Indic. 2025, 27, 100730. [Google Scholar] [CrossRef]
  8. Putra, N.R.; Rizkiyah, D.N.; Abdul Aziz, A.H.; Che Yunus, M.A.; Veza, I.; Harny, I.; Tirta, A. Waste to Wealth of Apple Pomace Valorization by Past and Current Extraction Processes: A Review. Sustainability 2023, 15, 830. [Google Scholar] [CrossRef]
  9. Selmi, H.; Presutto, E.; Totaro, M.; Spano, G.; Capozzi, V.; Fragasso, M. Apple Waste/By-Products and Microbial Resources to Promote the Design of Added-Value Foods: A Review. Foods 2025, 14, 1850. [Google Scholar] [CrossRef] [PubMed]
  10. Zaky, A.A.; Witrowa-Rajchert, D.; Nowacka, M. Turning Apple Pomace into Value: Sustainable Recycling in Food Production—A Narrative Review. Sustainability 2024, 16, 7001. [Google Scholar] [CrossRef]
  11. Vicente-Zurdo, D.; Gómez-Mejía, E.; Morante-Zarcero, S.; Rosales-Conrado, N.; Sierra, I. Analytical Strategies for Green Extraction, Characterization, and Bioactive Evaluation of Polyphenols, Tocopherols, Carotenoids, and Fatty Acids in Agri-Food Bio-Residues. Molecules 2025, 30, 1326. [Google Scholar] [CrossRef] [PubMed]
  12. Bhadange, Y.A.; Carpenter, J.; Saharan, V.K. A Comprehensive Review on Advanced Extraction Techniques for Retrieving Bioactive Components from Natural Sources. ACS Omega 2024, 9, 31274–31297. [Google Scholar] [CrossRef]
  13. Roobab, U.; Aadil, R.M.; Kurup, S.S.; Maqsood, S. Comparative Evaluation of Ultrasound-Assisted Extraction with Other Green Extraction Methods for Sustainable Recycling and Processing of Date Palm Bioresources and by-Products: A Review of Recent Research. Ultrason. Sonochem. 2025, 114, 107252. [Google Scholar] [CrossRef]
  14. Lee, J.-E.; Jayakody, J.T.M.; Kim, J.-I.; Jeong, J.-W.; Choi, K.-M.; Kim, T.-S.; Seo, C.; Azimi, I.; Hyun, J.; Ryu, B. The Influence of Solvent Choice on the Extraction of Bioactive Compounds from Asteraceae: A Comparative Review. Foods 2024, 13, 3151. [Google Scholar] [CrossRef]
  15. Chaves, J.O.; de Souza, M.C.; da Silva, L.C.; Lachos-Perez, D.; Torres-Mayanga, P.C.; da Fonseca Machado, A.P.; Forster-Carneiro, T.; Vázquez-Espinosa, M.; González-de-Peredo, A.V.; Barbero, G.F.; et al. Extraction of Flavonoids From Natural Sources Using Modern Techniques. Front. Chem. 2020, 8, 507887. [Google Scholar] [CrossRef]
  16. Chen, Y.; Du, K.; Li, J.; Bai, Y.; An, M.; Tan, Z.; Chang, Y. A Green and Efficient Method for the Preconcentration and Determination of Gallic Acid, Bergenin, Quercitrin, and Embelin from Ardisia japonica Using Nononic Surfactant Genapol X-080 as the Extraction Solvent. Int. J. Anal. Chem. 2018, 2018, e1707853. [Google Scholar] [CrossRef]
  17. Sznek, B.; Kupczyk, O.; Czyrski, A. Cloud Point Extraction as an Environmentally Friendly Technique for Sample Preparation. Processes 2025, 13, 430. [Google Scholar] [CrossRef]
  18. Arya, S.S.; Kaimal, A.M.; Chib, M.; Sonawane, S.K.; Show, P.L. Novel, Energy Efficient and Green Cloud Point Extraction: Technology and Applications in Food Processing. J. Food Sci. Technol. 2019, 56, 524–534. [Google Scholar] [CrossRef] [PubMed]
  19. Travičić, V.; Cvanić, T.; Vidović, S.; Pezo, L.; Hidalgo, A.; Šovljanski, O.; Ćetković, G. Sustainable Recovery of Polyphenols and Carotenoids from Horned Melon Peel via Cloud Point Extraction. Foods 2024, 13, 2863. [Google Scholar] [CrossRef]
  20. Athanasiadis, V.; Chatzimitakos, T.; Mantiniotou, M.; Kalompatsios, D.; Bozinou, E.; Lalas, S.I. Investigation of the Polyphenol Recovery of Overripe Banana Peel Extract Utilizing Cloud Point Extraction. Eng 2023, 4, 3026–3038. [Google Scholar] [CrossRef]
  21. Giovanoudis, I.; Athanasiadis, V.; Chatzimitakos, T.; Kalompatsios, D.; Bozinou, E.; Gortzi, O.; Nanos, G.D.; Lalas, S.I. Implementation of Cloud Point Extraction Using Surfactants in the Recovery of Polyphenols from Apricot Cannery Waste. Eng 2023, 4, 1225–1235. [Google Scholar] [CrossRef]
  22. Giovanoudis, I.; Athanasiadis, V.; Chatzimitakos, T.; Kalompatsios, D.; Bozinou, E.; Gortzi, O.; Nanos, G.D.; Lalas, S.I. Isolation of Polyphenols from Two Waste Streams of Clingstone Peach Canneries Utilizing the Cloud Point Extraction Method. Biomass 2023, 3, 291–305. [Google Scholar] [CrossRef]
  23. Soto-Ángeles, A.G.; Rodríguez-Hidalgo, M.d.R.; Soto-Figueroa, C.; Vicente, L. Complementary Experimental-Simulational Study of Surfactant Micellar Phase in the Extraction Process of Metallic Ions: Effects of Temperature and Salt Concentration. Chem. Phys. 2018, 501, 15–25. [Google Scholar] [CrossRef]
  24. Hagarová, I.; Urík, M. Cloud Point Extraction in Beverage Analysis: Innovations and Applications for Trace Elements. Beverages 2024, 10, 67. [Google Scholar] [CrossRef]
  25. Kiai, H.; Raiti, J.; El-Abbassi, A.; Hafidi, A. Recovery of Phenolic Compounds from Table Olive Processing Wastewaters Using Cloud Point Extraction Method. J. Environ. Chem. Eng. 2018, 6, 1569–1575. [Google Scholar] [CrossRef]
  26. Christodoulou, M.C.; Orellana Palacios, J.C.; Hesami, G.; Jafarzadeh, S.; Lorenzo, J.M.; Domínguez, R.; Moreno, A.; Hadidi, M. Spectrophotometric Methods for Measurement of Antioxidant Activity in Food and Pharmaceuticals. Antioxidants 2022, 11, 2213. [Google Scholar] [CrossRef]
  27. Mantiniotou, M.; Bujor, B.-C.; Athanasiadis, V.; Chatzimitakos, T.; Kalompatsios, D.; Kotsou, K.; Bozinou, E.; Lalas, S.I. Response Surface Methodology-Aided Optimization of Bioactive Compound Extraction from Apple Peels Through Pulsed Electric Field Pretreatment and Ultrasonication. Eng 2024, 5, 2886–2901. [Google Scholar] [CrossRef]
  28. Jagota, S.K.; Dani, H.M. A New Colorimetric Technique for the Estimation of Vitamin C Using Folin Phenol Reagent. Anal. Biochem. 1982, 127, 178–182. [Google Scholar] [CrossRef]
  29. Cendrowski, A.; Przybył, J.L.; Studnicki, M. Physicochemical Characteristics, Vitamin C, Total Polyphenols, Antioxidant Capacity, and Sensory Preference of Mixed Juices Prepared with Rose Fruits (Rosa rugosa) and Apple or Strawberry. Appl. Sci. 2024, 14, 113. [Google Scholar] [CrossRef]
  30. Will, F.; Roth, M.; Olk, M.; Ludwig, M.; Dietrich, H. Processing and Analytical Characterisation of Pulp-Enriched Cloudy Apple Juices. LWT-Food Sci. Technol. 2008, 41, 2057–2063. [Google Scholar] [CrossRef]
  31. Hodala, A.J.; Wood, I.G.; Carbone, P. Understanding the Influence of Electrostatic Interactions on Observed pKa Shifts in Surfactant Aggregates Using Classical Simulations. J. Mol. Liq. 2025, 427, 127410. [Google Scholar] [CrossRef]
  32. Kojro, G.; Wroczyński, P. Cloud Point Extraction in the Determination of Drugs in Biological Matrices. J. Chromatogr. Sci. 2020, 58, 151–162. [Google Scholar] [CrossRef]
  33. Giovanoudis, I.; Athanasiadis, V.; Chatzimitakos, T.; Kalompatsios, D.; Mantiniotou, M.; Bozinou, E.; Gortzi, O.; Nanos, G.D.; Lalas, S.I. Antioxidant Capacity in Two Different Cultivars of Ripe and Unripe Peaches Utilizing the Cloud-Point Extraction Method. AgriEngineering 2023, 5, 2139–2154. [Google Scholar] [CrossRef]
  34. Athanasiadis, V.; Chatzimitakos, T.; Mantiniotou, M.; Bozinou, E.; Lalas, S.I. Exploring the Antioxidant Properties of Citrus limon (Lemon) Peel Ultrasound Extract after the Cloud Point Extraction Method. Biomass 2024, 4, 202–216. [Google Scholar] [CrossRef]
  35. Wang, M.; Yan, W.; Zhou, Y.; Fan, L.; Liu, Y.; Li, J. Progress in the Application of Lecithins in Water-in-Oil Emulsions. Trends Food Sci. Technol. 2021, 118, 388–398. [Google Scholar] [CrossRef]
  36. Mortada, W.I. Recent Developments and Applications of Cloud Point Extraction: A Critical Review. Microchem. J. 2020, 157, 105055. [Google Scholar] [CrossRef]
  37. Karadag, A.; Kayacan Cakmakoglu, S.; Metin Yildirim, R.; Karasu, S.; Avci, E.; Ozer, H.; Sagdic, O. Enrichment of Lecithin with Phenolics from Olive Mill Wastewater by Cloud Point Extraction and Its Application in Vegan Salad Dressing. J. Food Process. Preserv. 2022, 46, e16645. [Google Scholar] [CrossRef]
  38. Hyde, A.M.; Zultanski, S.L.; Waldman, J.H.; Zhong, Y.-L.; Shevlin, M.; Peng, F. General Principles and Strategies for Salting-Out Informed by the Hofmeister Series. Org. Process Res. Dev. 2017, 21, 1355–1370. [Google Scholar] [CrossRef]
  39. Dewulf, B.; Cool, V.; Li, Z.; Binnemans, K. Effect of Polar Molecular Organic Solvents on Non-Aqueous Solvent Extraction of Rare-Earth Elements. Sep. Purif. Technol. 2022, 294, 121197. [Google Scholar] [CrossRef]
  40. Motikar, P.D.; More, P.R.; Arya, S.S. A Novel, Green Environment-Friendly Cloud Point Extraction of Polyphenols from Pomegranate Peels: A Comparative Assessment with Ultrasound and Microwave-Assisted Extraction. Sep. Sci. Technol. 2021, 56, 1014–1025. [Google Scholar] [CrossRef]
  41. Nour, V. Increasing the Content of Bioactive Compounds in Apple Juice Through Direct Ultrasound-Assisted Extraction from Bilberry Pomace. Foods 2024, 13, 4144. [Google Scholar] [CrossRef] [PubMed]
  42. Naveed, M.; Hejazi, V.; Abbas, M.; Kamboh, A.A.; Khan, G.J.; Shumzaid, M.; Ahmad, F.; Babazadeh, D.; Xia, F.F.; Modarresi-Ghazani, F.; et al. Chlorogenic Acid (CGA): A Pharmacological Review and Call for Further Research. Biomed. Pharmacother. 2018, 97, 67–74. [Google Scholar] [CrossRef] [PubMed]
  43. Yu, Y.; Zhang, Z.; Chang, C. Chlorogenic Acid Intake Guidance: Sources, Health Benefits, and Safety. Asia Pac. J. Clin. Nutr. 2022, 31, 602–610. [Google Scholar] [CrossRef] [PubMed]
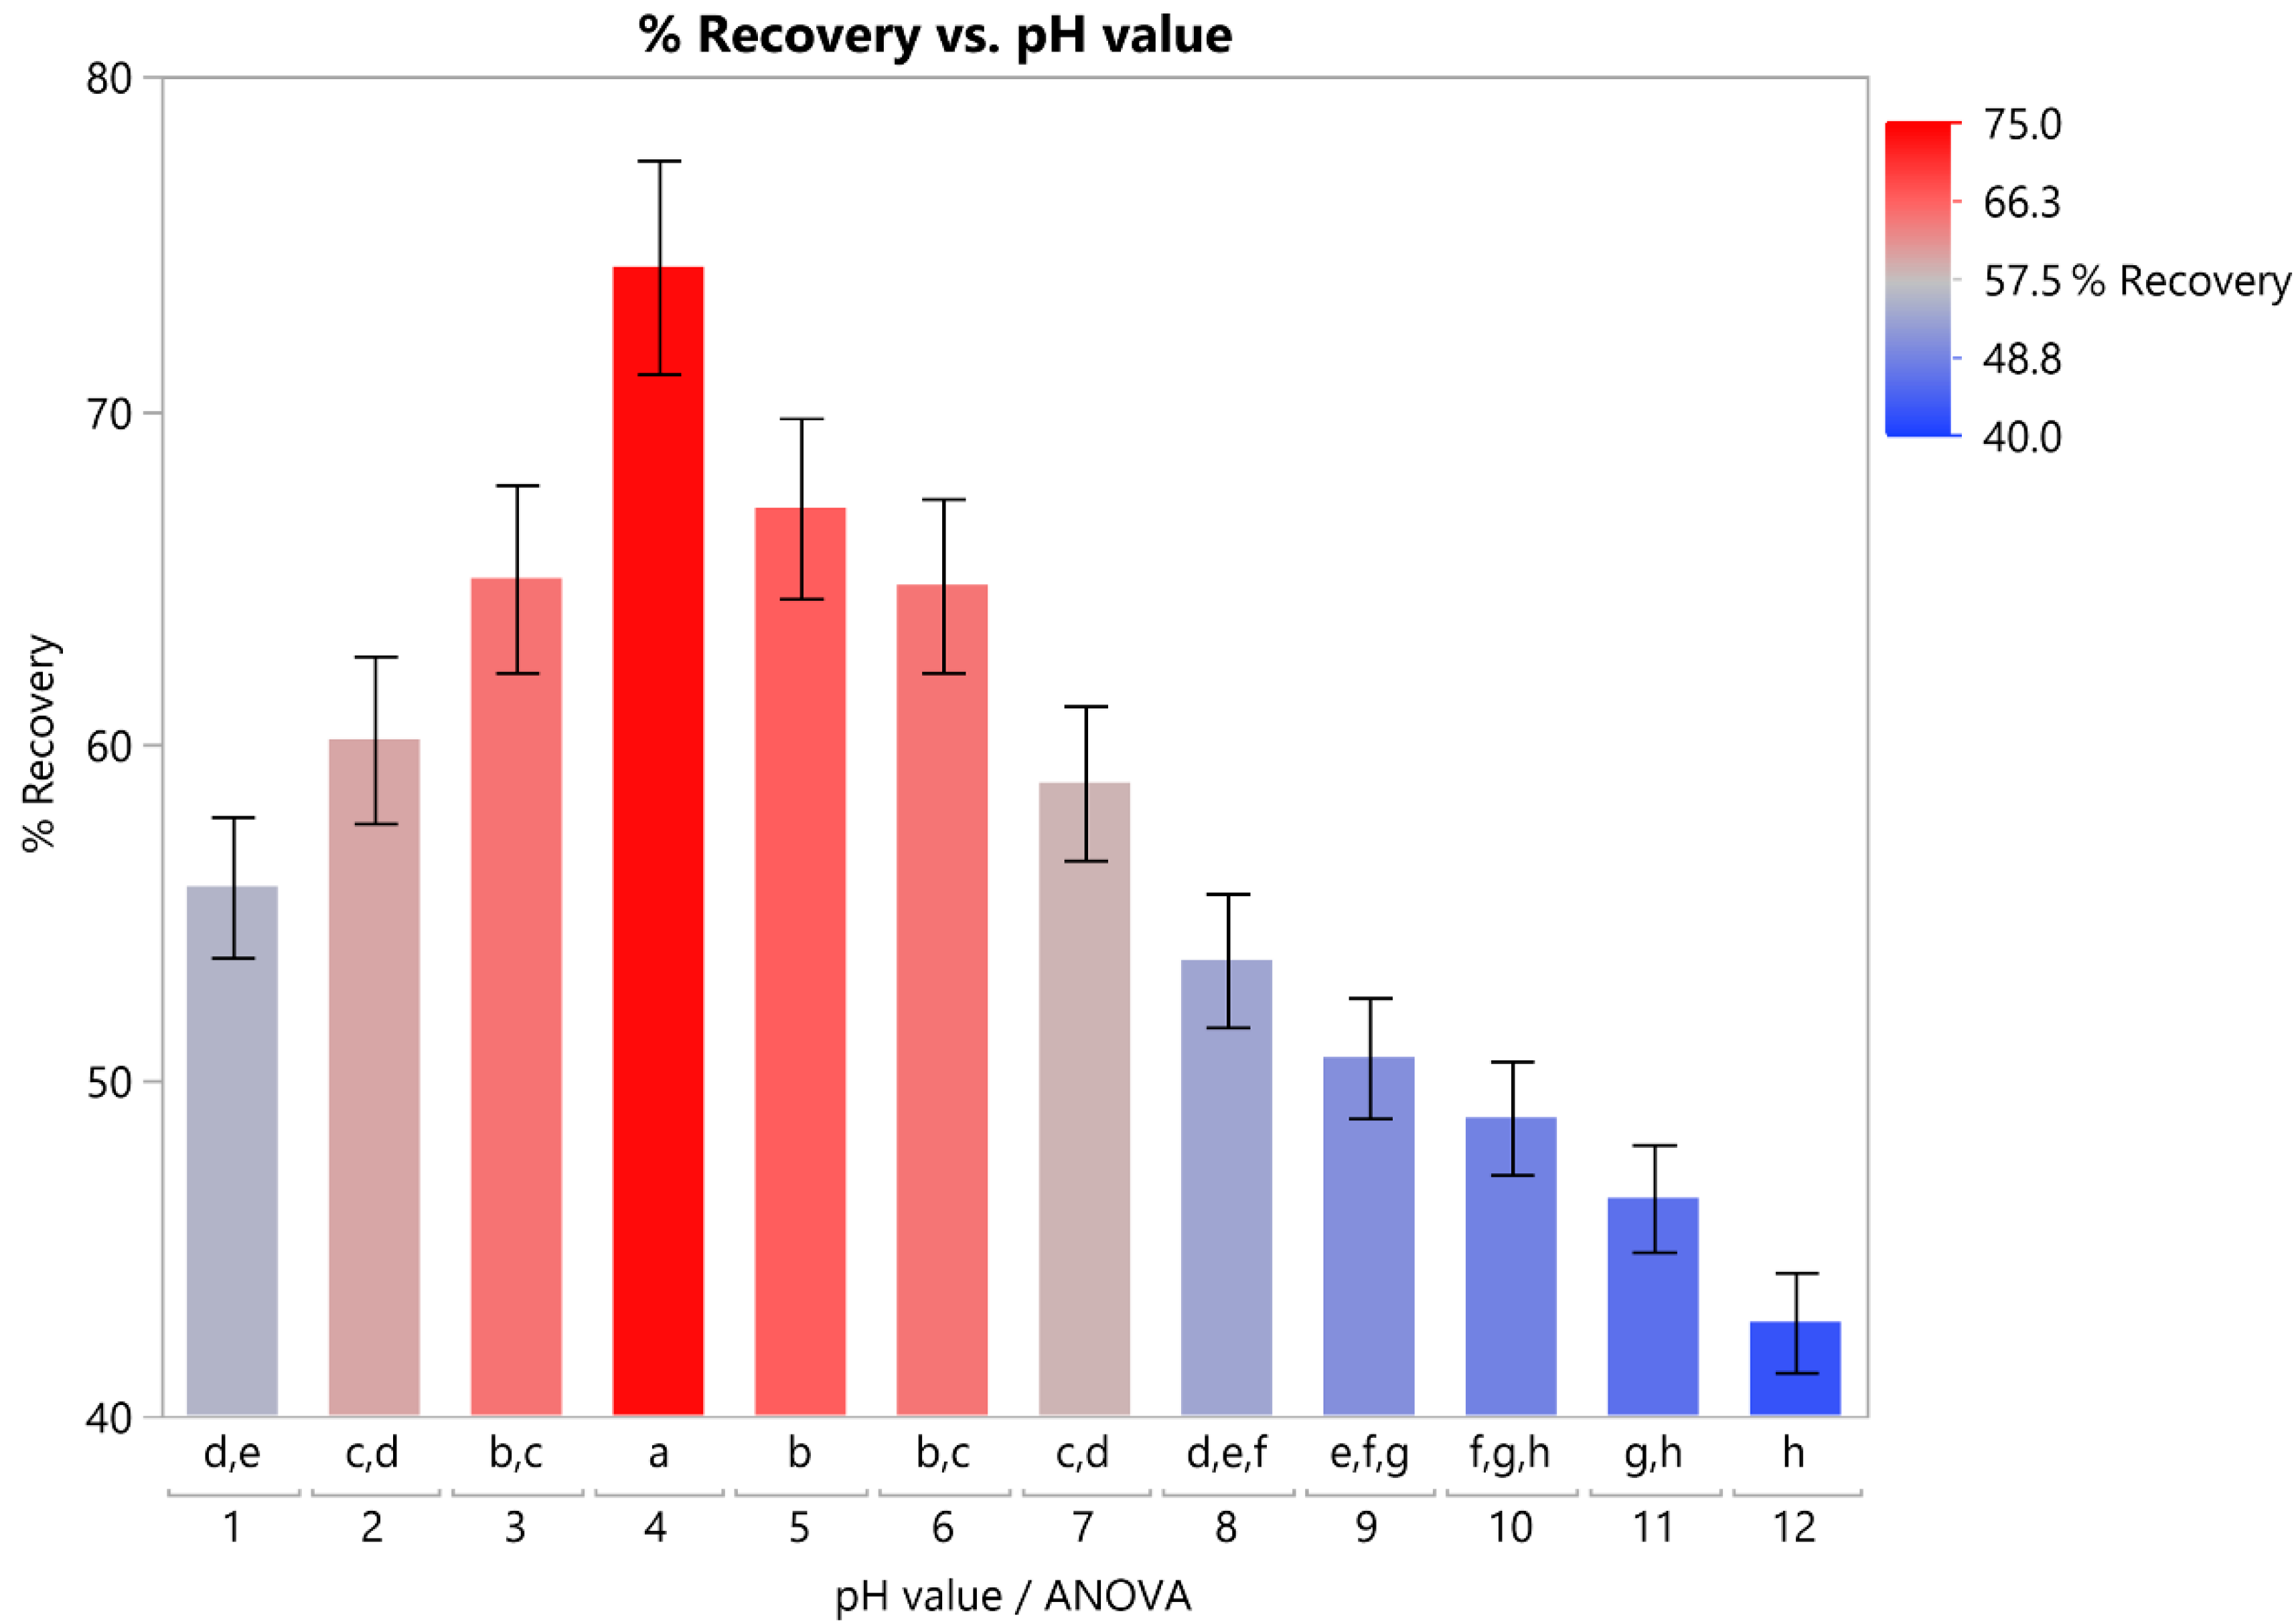
Figure 1. The recovery of polyphenols from apple juice is influenced by the pH level. Error bars show the standard deviations, while lowercase letters represent the means (e.g., a–h). Significant differences (p < 0.05) were observed between these trials.
Biomass 05 00048 g001
Figure 2. The recovery of polyphenols from apple juice is affected by the concentration of the surfactant (lecithin). Error bars show the standard deviations, and lowercase letters represent the means (e.g., a–d). There are statistically significant differences (p < 0.05) between the samples.
Biomass 05 00048 g002
Figure 3. The recovery of polyphenols from apple juice is affected by the content of salt (NaCl). Error bars show standard deviations, and lowercase letters represent means, which show statistically significant differences (p < 0.05).
Biomass 05 00048 g003
Figure 4. Total polyphenol content (TPC) of apple juice with 15% w/v lecithin; standard deviations are presented with error bars.
Biomass 05 00048 g004
Figure 5. Apple juice HPLC chromatograms showing identified polyphenolic molecules at 280, 320, and 360 nm. 1: Pelargonin chloride; 2: catechin; 3: chlorogenic acid; 4: vanillic acid; 5: syringic acid; 6: carnosol; 7: rutin; 8: quercetin 3-D-galactoside; 9: quercetin 3-β-D-glucoside; 10: narirutin; 11: hesperidin.
Biomass 05 00048 g005
Figure 6. Strong linear correlation between initial apple juice and optimal total SP.
Biomass 05 00048 g006
Table 1. Physicochemical characteristics and color of apple juice samples.
ParametersApple Juice
Active acidity (pH)3.83 ± 0.13
Titratable acidity (TA) (as % w/w malic acid)0.93 ± 0.06
Total soluble solids (TSS) (°Brix)14.41 ± 0.79
Sweetness index (TSS/TA ratio)15.5 ± 0.17
Astrigency index (TA/TSS ratio)0.06 ± 0
L* (lightness)75.1 ± 0.9
a* (redness)3.2 ± 0.1
b* (yellowness)20.3 ± 0.6
HEX codeCFB594
Color
Values show the average of three separate measurements ± standard deviation. We used the measured L*, a*, and b* values to fill the table cell with the correct hue of the extract, which is represented by the proper HEX code.
Table 2. Parameters and polyphenolic compounds in the initial apple juice and the surfactant phase (SP) under optimal CPE conditions.
ParametersInitial Apple JuiceOptimal Total SPp-Value
TPC (mg GAE/L)540 ± 29 523 ± 20 0.4377
FRAP (mmol AAE/L)4.52 ± 0.29 *3.79 ± 0.21 0.0247
DPPH (mmol AAE/L)3.13 ± 0.13 *2.68 ± 0.09 0.0075
AAC (mg/L)39.1 ± 1.7 35.4 ± 1.9 0.0645
Polyphenolic Compounds (mg/L)
Pelargonin chloride91.8 ± 3.6 88.4 ± 5 0.3952
Catechin6.48 ± 0.45 6.11 ± 0.35 0.3278
Chlorogenic acid333 ± 19 326 ± 15 0.6170
Vanillic acid12.3 ± 0.9 11 ± 0.8 0.1324
Syringic acid9.27 ± 0.43 9.15 ± 0.25 0.6883
Carnosol52.9 ± 1.5 *48.8 ± 1 0.0165
Rutin2.05 ± 0.04 1.92 ± 0.13 0.1922
Quercetin 3-D-galactoside20.7 ± 0.7 *18.1 ± 1.3 0.0397
Quercetin 3-β-D-glucoside3.11 ± 0.12 *2.65 ± 0.19 0.0227
Narirutin1.86 ± 0.07 *1.55 ± 0.07 0.0056
Hesperidin1.17 ± 0.05 1.09 ± 0.04 0.1213
Total identified535 ± 27 514 ± 24 0.3804
Within each row, statistically significant differences (p < 0.05) are denoted with an asterisk (*). TPC, total polyphenol content; FRAP, ferric-reducing antioxidant power; DPPH, antiradical activity; AAC, ascorbic acid content.
Disclaimer/Publisher’s Note: The statements, opinions and data contained in all publications are solely those of the individual author(s) and contributor(s) and not of MDPI and/or the editor(s). MDPI and/or the editor(s) disclaim responsibility for any injury to people or property resulting from any ideas, methods, instructions or products referred to in the content.