Article

Electromagnetic and Modeling of Induction Furnaces Using Finite Element Methods

by
Ghada Mahmoud Ibrahim
,
Asmaa Sobhy Sabik
* and
Adel Saad Nada
Department of Electrical Engineering (Electrical Power and Machines), Faculty of Engineering, Al-Azhar University, Nasr City, Cairo 11765, Egypt
*
Author to whom correspondence should be addressed.
Magnetism 2026, 6(1), 9; https://doi.org/10.3390/magnetism6010009
Submission received: 20 December 2025 / Revised: 21 January 2026 / Accepted: 4 February 2026 / Published: 10 February 2026

Abstract

This paper presents a comparative modeling and analysis of an induction furnace for melting aluminum (Al) and copper (Cu), focusing on their electromagnetic behavior and heating performance. The study employs ANSYS Maxwell software version 16.0 with the finite element method (FEM) to simulate eddy current generation, Joule heating, and current density distribution in the metallic workpieces. The effects of coil geometry, input current, and operating frequency (50–100 kHz) on heating efficiency and skin depth are investigated. Estimated heating times based on ohmic losses are provided, revealing significant differences between aluminum and copper due to their distinct electrical and thermal properties. The results demonstrate that higher frequencies concentrate heating near the surface, reducing skin depth, while copper exhibits more uniform heating than aluminum. These findings offer practical insights for optimizing induction furnace design and operation for different non-ferrous metals.

1. Introduction

Induction furnaces are extensively used in the metal industry for melting a variety of materials, particularly non-ferrous metals such as aluminum (Al) and copper (Cu). These furnaces operate based on the principle of electromagnetic induction, in which alternating magnetic fields induce eddy currents within the metal, generating heat that leads to its melting [1,2,3,4]. This contactless heating method offers several advantages, including faster heating rates, cleaner operation, and improved energy efficiency compared to conventional melting methods [5,6,7,8,9].
The efficiency of induction melting depends on several key parameters, including coil geometry, operating frequency, electromagnetic field distribution, and the thermal and electrical properties of the materials being melted. Properly optimizing these parameters can significantly enhance the performance of the furnace and reduce energy consumption. Therefore, accurate modeling of both electromagnetic and thermal behavior is essential for improving furnace design and ensuring uniform and efficient heating [10].
The finite element method (FEM) is a powerful numerical tool for analyzing the complex interactions between electromagnetic fields and heat transfer phenomena within induction furnaces. Among the various simulation platforms available, ANSYS Maxwell is widely recognized for its ability to perform coupled electromagnetic–thermal simulations. It enables detailed modeling of furnace components, material behavior, and boundary conditions, offering insights into system performance before practical implementation [11]. Several researchers have contributed to advancing the understanding of induction heating systems. In recent years, significant attention has been given to studying induction furnace systems using numerical simulations. Most studies focus on analyzing electromagnetic and thermal fields to improve heating efficiency and temperature distribution. Liang et al. [12] analyzed the effect of furnace conditions on the refractory lining using multi-physics field simulations, showing that coil design and electromagnetic field distribution directly affect heating efficiency.
Jiang and Zhang [13] performed multi-physics numerical simulations of fused magnesia furnaces, emphasizing the interaction between electromagnetic fields and molten metals. They highlighted that accurately defining material properties and boundary conditions improves the prediction of melting efficiency.
Li et al. [14] investigated the effect of operational parameters on heating efficiency using design of experiments methods (Taguchi and Response Surface Method), demonstrating that frequency selection and current distribution significantly influence heating depth and system performance. Garcia-Michelena et al. [15] applied a 3D FEM model to study free surface deformation and melt stirring in induction melting, emphasizing the importance of mesh quality and solver configuration for accurate results. Vishnuram et al. [16] provided a systematic review on induction heating for domestic and industrial applications, discussing modeling approaches, converter topologies, and control schemes relevant to furnace operations. Similarly, Gündoğan and Çelik [17] performed a numerical analysis of various metals under different current conditions using FEM, showing the influence of electromagnetic field intensity on temperature distribution and current density. Their findings further support the significance of current magnitude and material properties in determining heating performance.
Despite these valuable contributions, a clear need remains for more detailed and consistent comparisons between different metals under identical simulation conditions. Such comparisons can provide deeper insights into material-specific behavior and support the optimization of furnace parameters for various industrial applications.
The main contributions of this work can be summarized as follows:
  • A comparative finite element method (FEM)-based analysis is presented for induction melting of two industrially relevant non-ferrous metals, namely aluminum and copper, conducted under identical operating conditions, including the same coil geometry, excitation frequency, and input power.
  • The study systematically highlights the influence of material electromagnetic and thermal properties on key melting characteristics, including electromagnetic penetration depth, heating uniformity, temperature distribution, and melting dynamics, independent of system configuration variations.
  • The proposed modeling framework provides a consistent and fair comparison between different materials by isolating the effect of material properties, thereby offering clearer physical insight than many prior FEM studies that focus on single-material or parameter-varying analyses.
  • The results contribute to improved understanding of material-dependent induction heating behavior, offering practical guidance for material selection and preliminary design of induction melting systems.
The remainder of the paper is structured as follows:
  • Section 1 provides a comprehensive overview of induction heating systems and synthesizes the key findings from previous studies.
  • Section 2 presents the methodology and modeling approach adopted in this study.
  • Section 3 details the simulation procedure using ANSYS Maxwell software.
  • Section 4 describes the simulation setup and specifies the operational parameters.
  • Section 5 analyzes the current density distribution in the scrap.
  • Section 6 investigates the effect of skin depth and estimated heating time on the Melting process for copper and aluminum at different frequencies.
  • Section 7 concludes the paper with final remarks and recommendations.

2. Methodology and Modeling Approach

In this section, we present the detailed methodology used for modeling and analyzing the induction furnace. The approach includes the physical modeling, boundary conditions, material properties, and simulation procedures applied in ANSYS.

2.1. Modeling and Analysis Using ANSYS

The comprehensive modeling of the induction furnace system was performed using ANSYS Maxwell software, a widely recognized engineering simulation platform that enables the analysis of coupled thermal, electromagnetic, and mechanical phenomena in complex systems. This research employed ANSYS to investigate the thermal and electromagnetic behavior of induction furnaces during the melting process of aluminum and copper [18]. The modeling methodology encompasses the following sequential stages:

2.1.1. Electromagnetic Modeling

Induction furnaces consist of three primary components: A high-frequency power source (generator), the metallic workpiece (scrap), and an induction coil. The electromagnetic modeling phase characterizes the magnetic field produced by the coil and its interaction with the metal workpiece. The induced eddy currents in the metal generate heat through Joule heating, which depends on the material’s electrical resistivity and the coil design [19]. The electromagnetic field distribution is obtained by specifying the coil geometry, current magnitude, and operating frequency. The FEM solver in ANSYS Maxwell calculates the field distribution accurately, providing insight into the mechanisms governing energy transfer.

2.1.2. Maxwell’s Equations

The multiphysics problems, involving both electromagnetic and thermal interactions, are solved using the ANSYS Maxwell software, which employs the FEM. FEM solves Maxwell’s equations within a defined region and under appropriate initial conditions, ensuring accurate and reliable results. The relevant equations are as follows [20]:
Faraday’s Law of Electromagnetic Induction:
× E = B t
Ampère’s Circuital Law:
× H = J + D t
Gauss’s Law for Electric Fields:
· D = ρ charge
Gauss’s Law for Magnetic Fields:
· B = 0
where
E is the electric field intensity, in V/m,
H is the magnetic field intensity, in A/m.
B is the magnetic flux density, in T or Weber/m2.
D is the electric flux density, in C/m2.
J is the electric current density, in A/m2.
ρ charge is the volume charge density, in C/m3.
The electric flux density and the magnetic flux density are:
D = ϵ o ϵ r E
B = μ o μ r H
where ϵ o is the permittivity of the vacuum, and ϵ o = 8.854 × 10 12 Farad/m.
The numerical solution of these equations using FEM in ANSYS Maxwell yields a precise representation of the electromagnetic field distribution within the induction furnace. The operational principle is based on Faraday’s Law of Electromagnetic Induction, where time-varying magnetic fields induce eddy currents that generate heat through Joule heating mechanisms. This heat generation constitutes the fundamental principle underlying the induction melting process.

2.1.3. Thermal Modeling

The heat generated by eddy currents raises the temperature of the metallic workpieces. The thermal model solves the transient heat transfer equation, accounting for conduction, convection, and radiation [21]. Material properties, such as thermal conductivity, specific heat capacity, and density, are applied for both aluminum and copper. The resulting temperature distribution is analyzed to determine the time required for the metal to reach its melting point and to avoid overheating or material degradation.

2.1.4. Multiphysics Simulation

In practical applications, electromagnetic and thermal phenomena occur simultaneously and exhibit mutual coupling effects. For instance, the heat generated by eddy currents influences the electrical conductivity and magnetic permeability of the metal, which subsequently affects the induced current distribution and electromagnetic field pattern. ANSYS facilitates coupled multiphysics simulations where electromagnetic and thermal models are simultaneously solved with appropriate coupling mechanisms. This integrated computational approach provides a more accurate representation of the physical processes and enables optimization of furnace design and operational parameters for enhanced performance [22].

2.1.5. Material Characterization: Aluminum and Copper Analysis

The melting process of different metals requires consideration of their unique properties. Aluminum and copper have different thermal conductivities, melting points, and electrical resistivity, all of which influence the heating and melting process. In the simulations, the properties of both metals are input into the ANSYS model to predict the heat distribution under different operational conditions.

3. Detailed Procedure for Modeling and Simulation of an Induction Furnace Using ANSYS Maxwell

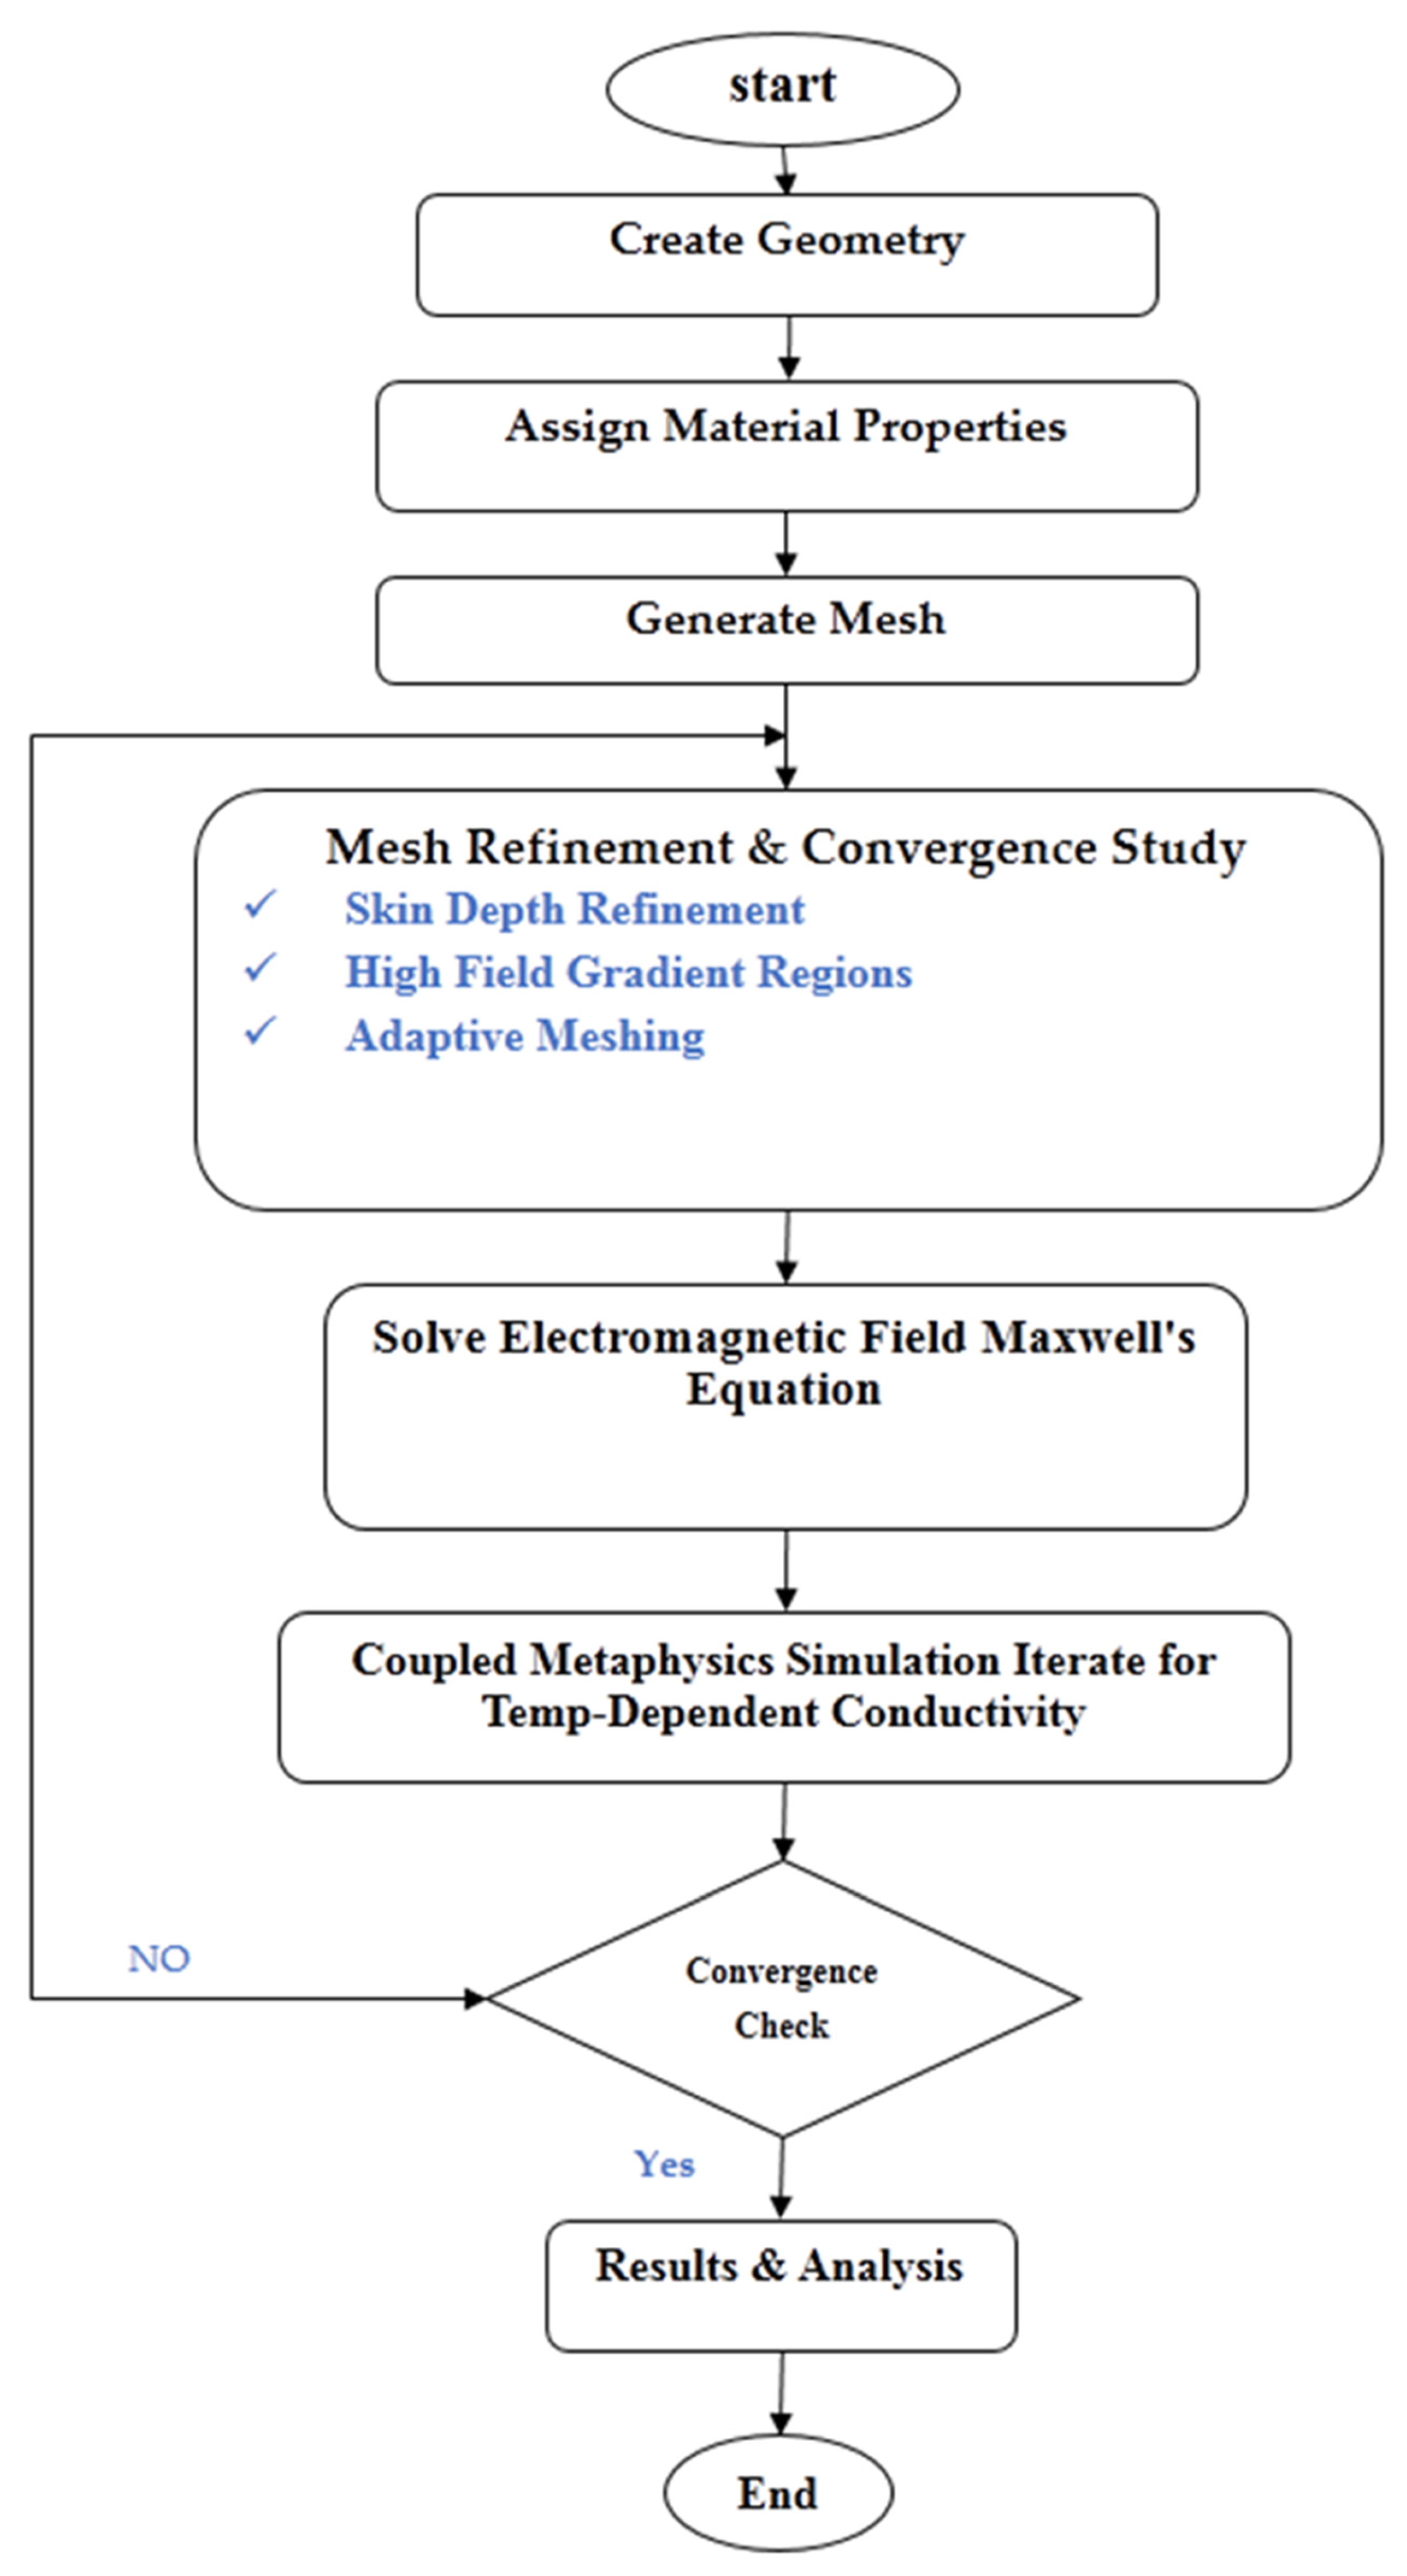
The simulation methodology used in this study is summarized in Figure 1. The flowchart in Figure 1 illustrates the step-by-step workflow followed in this research for modeling and simulating the induction furnace using ANSYS Maxwell. It includes geometry creation, material assignment, meshing, electromagnetic and thermal analysis, and multiphysics coupling with iterative convergence checks [23].

Modeling Assumptions and Limitations

The finite element model developed in this study incorporates several simplifying assumptions to reduce computational complexity. An axisymmetric geometry is assumed for the induction furnace, which is a common approach in FEM-based induction heating studies. Electromagnetic and thermal fields are coupled; however, the phase-change process is approximated without a fully transient latent heat formulation.
Convective and radiative heat losses are treated in a simplified manner, and material properties are considered temperature-dependent only within the available data range. These assumptions may affect the absolute accuracy of the predicted melting times; however, they do not compromise the comparative analysis between aluminum and copper under identical operating conditions.

4. Simulation Parameters

The simulation study was conducted using ANSYS Maxwell, employing the finite element method (FEM) to analyze the coupled electromagnetic and thermal behavior of an induction furnace. A 13-turn copper induction coil surrounds a cylindrical metallic scrap (aluminum or copper), modeled under axisymmetric conditions to reduce computational cost while maintaining sufficient accuracy. Temperature-dependent material properties, including electrical conductivity, thermal conductivity, specific heat capacity, and magnetic permeability, were applied to capture realistic behavior across the entire temperature range, particularly during phase change. Non-linear magnetic properties, especially near the Curie point, were considered. The mesh resolution was refined near surfaces with high current densities to accurately capture the skin effect at different operating frequencies. Simulations were performed with an input current of 300 A RMS at three frequencies: 50 kHz, 75 kHz, and 100 kHz, selected based on typical industrial practices for melting aluminum and copper. The induction coil has a height of 11 cm and a diameter of 6 cm, with an outer pipe diameter of 0.6 cm and an inner diameter of 0.4 cm, while the metallic workpiece has a height of 4 cm and a diameter of 1.68 cm; the scrap is placed entirely inside the coil, resulting in a radial clearance of 2.16 cm.

Numerical Uncertainty and Solution Reliability

Numerical uncertainty is a critical aspect in FEM-based simulations, as it can affect the accuracy and robustness of the results. In this study, appropriate mesh refinement and convergence checks were performed to ensure the stability and reliability of the simulations. Mesh resolution was carefully selected to provide a balance between computational cost and solution accuracy, and the simulation procedure was monitored to guarantee convergence of both electromagnetic and thermal fields. These measures ensure that the results are robust, reproducible, and largely independent of the chosen mesh and numerical parameters. While detailed quantitative data are not provided, the procedures followed are consistent with standard FEM best practices.
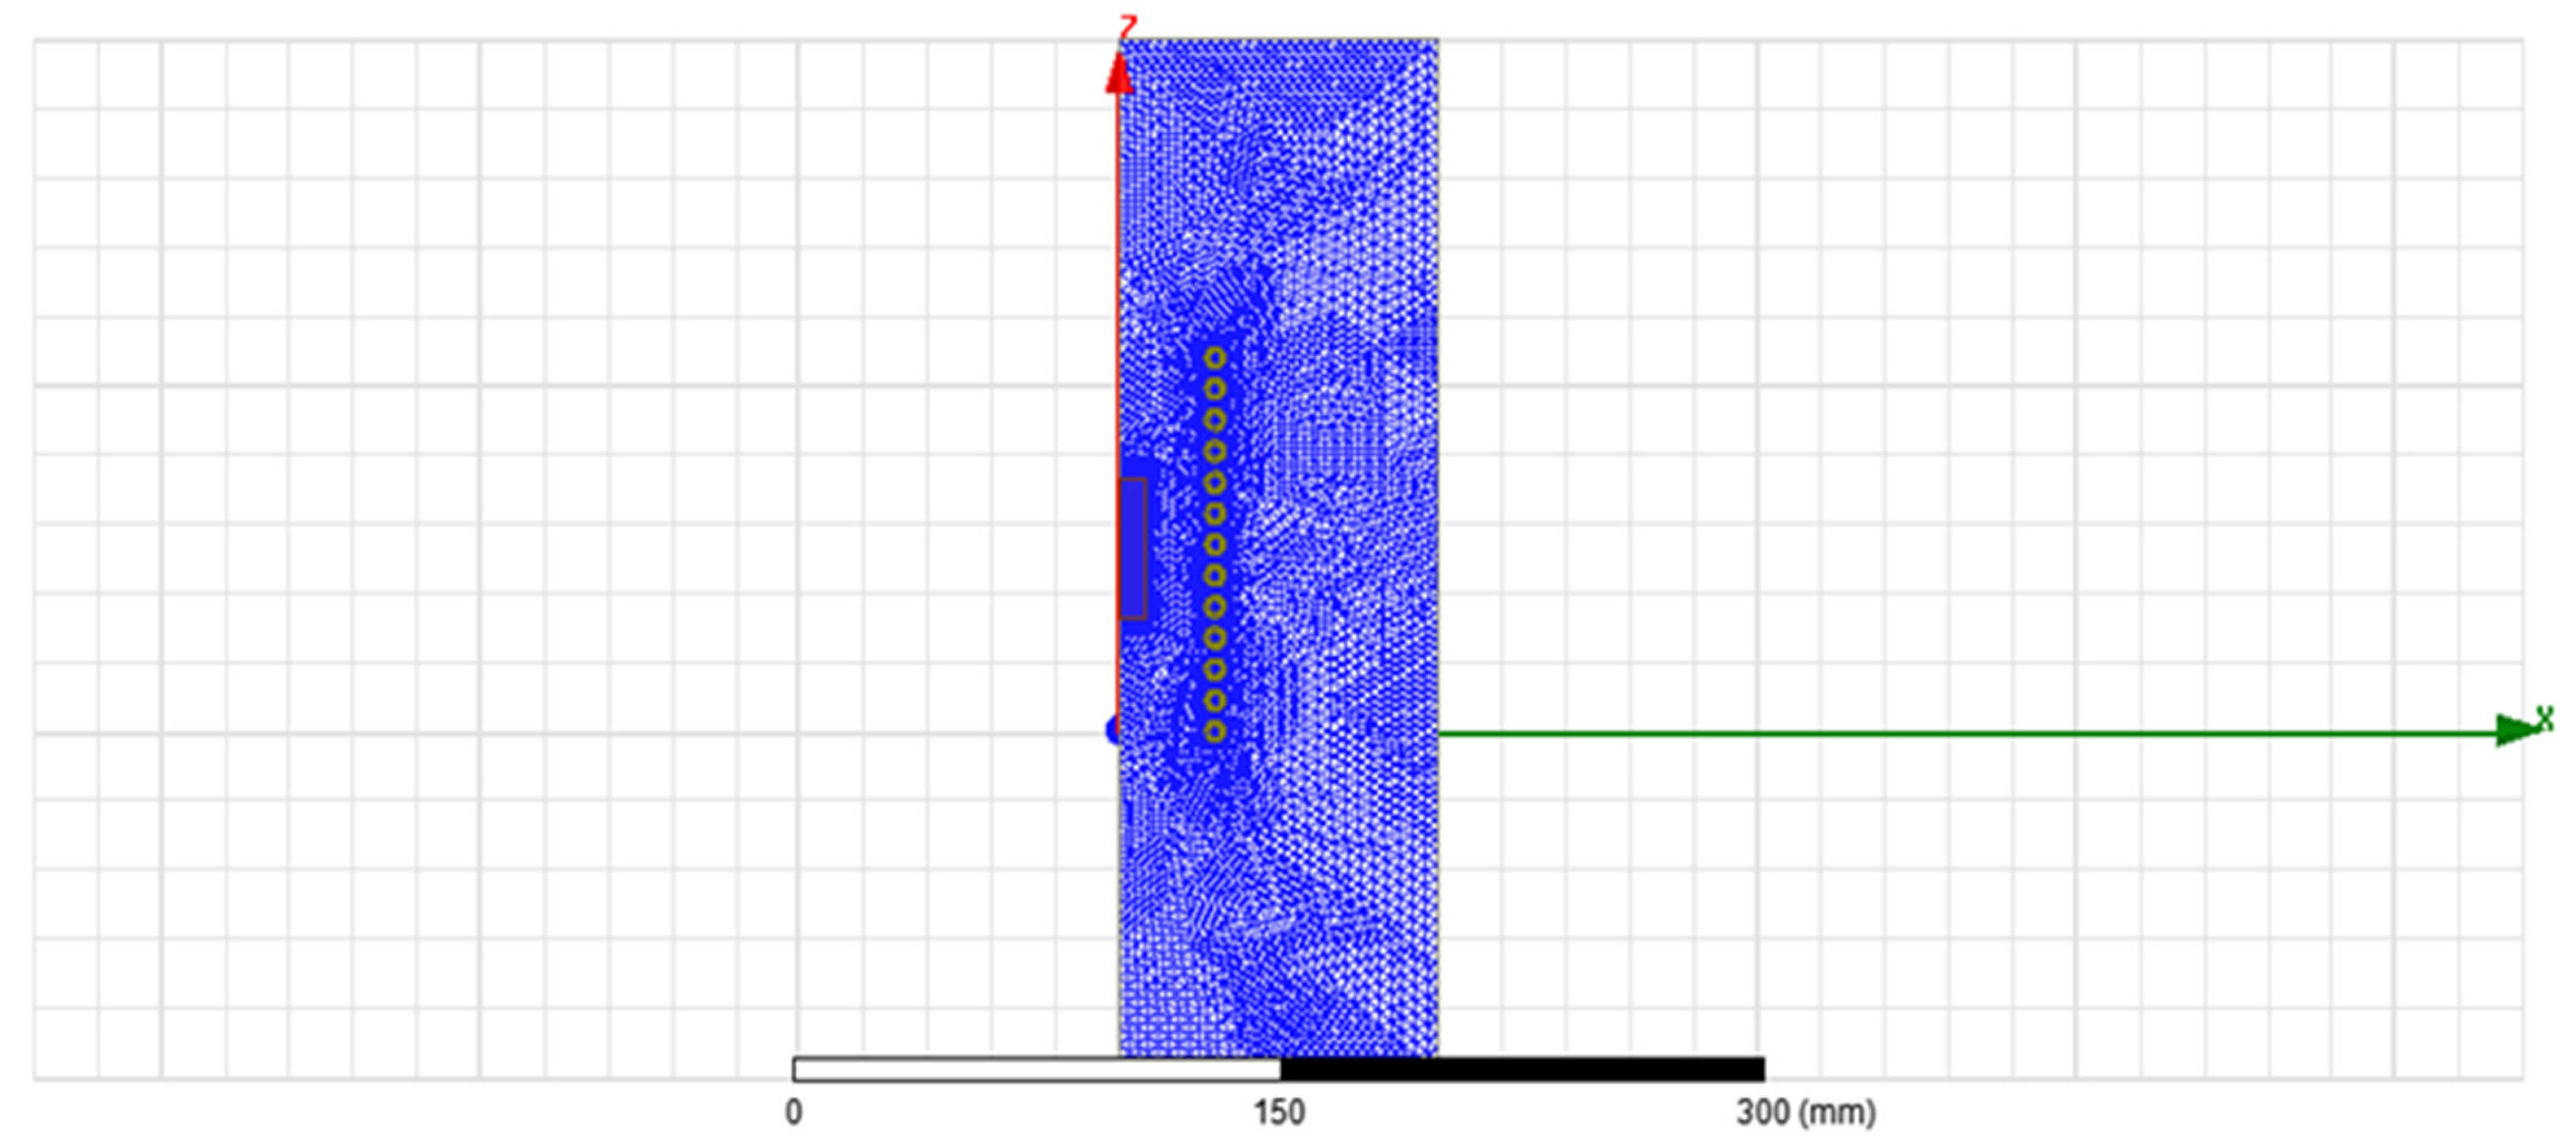
In this multiphysics simulation, the alternating magnetic field induces eddy currents in the metallic workpiece, which generate heat through Joule heating. The resulting temperature rise affects the electrical conductivity and magnetic permeability of the material, which in turn modifies the current distribution and electromagnetic field pattern. Boundary conditions were applied to simulate realistic confinement of the electromagnetic field, and a sinusoidal excitation current was applied to the coil. This setup allowed accurate prediction of energy absorption, temperature distribution and skin depth for both aluminum and copper. The geometry and mesh network are illustrated in Figure 2. Limitations of the model include assumptions due to axisymmetric simplification for non-symmetrical geometries, potential deviations from real furnace behavior, and neglect of minor hysteresis effects during phase transitions.
In order to ensure the reliability of the FEM simulations, appropriate mesh refinement and convergence checks were conducted. These measures confirm that the solutions are stable and largely independent of the chosen mesh resolution, providing confidence in the reported electromagnetic and thermal results. Although detailed numerical data are not presented, the procedures followed align with standard FEM practices and ensure that the observed trends and comparative analyses are robust. Further, future work may include more comprehensive parametric mesh studies to fully quantify numerical uncertainties across all simulation scenarios.

5. Current Density Distribution in the Scrap

One of the most important factors affecting the applications of the induction furnace is the current density distribution in the scrap. The current concentration determines the ohmic loss that dissipated in the scrap. The increased current density at the edges accelerates the time to rise up their temperature. An eddy current field solver was used in this stage. An impedance matrix and ohmic loss are computed from the computed field solution. Skin effects are presented in the scrap and work coil since there are eddy currents flowing in both. The current density distributions inside the scrap and the induction coil are measured by using Ansoft Maxwell software these current density distributions at scrap produce power losses (ohmic loss). This loss will be transform to heat later [24].

6. Effect of Skin Depth and Estimated Heating Time on the Melting Process for Copper and Aluminum at Different Frequencies

The skin depth phenomenon significantly affects induction melting processes of metals like copper and aluminum. At high frequencies (50 kHz, 75 kHz, and 100 kHz), the skin effect concentrates the induced current near the surface of the metal, which impacts melting efficiency and temperature distribution. The skin depth (δ) can be calculated as [25]
δ = √(ρ/πfμ)
where
δ: Skin depth (in meters)
ρ = resistivity of the material (Ohm·meters)
f = frequency (Hertz)
μ = magnetic permeability (Henries/meter)
Although the theoretical skin depth values are in the sub-millimeter range, the effective electromagnetic energy penetration extends deeper into the metal due to field diffusion, geometry effects, and volumetric heat conduction. Therefore, the penetration region observed in the electromagnetic field distributions represents an effective heating zone rather than the analytical skin depth alone.
At higher frequencies, energy concentrates near the surface due to reduced skin depth, resulting in faster surface heating. Lower frequencies allow deeper energy penetration but slower melting. Copper, with higher thermal conductivity, experiences more uniform heating, whereas aluminum exhibits more pronounced temperature gradients between surface and core.
It is worth noting that the frequency-dependent interaction between electromagnetic fields and conductive or lossy materials in induction heating shares strong conceptual similarities with microwave-based sensing systems used for material and liquid property characterization. In both cases, key parameters such as skin depth and penetration depth, operating frequency optimization, and material electromagnetic properties (e.g., electrical conductivity and permittivity) govern field distribution and energy absorption mechanisms. These principles have been successfully exploited in the design of microwave sensors for material characterization, as reported in [26,27] thereby supporting the generality and broader applicability of the electromagnetic concepts discussed in this work across different application domains.
The estimated heating time of metallic scraps under an RMS current of 300 A is calculated based on Joule (ohmic) power loss, which is converted to heat [28,29,30], using
t = m   c   Δ T P Ohmic    
where
t is the heating time, in s,
m is the mass of the scrap, in g.
c is the specific heat capacity, in J/(kg·K).
Δ T is the temperature difference between the initial temperature and the melting point, in °C.
P Ohmic   is the electric current density, in W.
It should be noted that the estimated heating time represents a first-order approximation based on an energy balance approach using the ohmic loss obtained from electromagnetic simulation. A fully coupled transient thermal–phase change analysis was not considered in this study and will be addressed in future work.
Table 1 summarizes the skin depth, estimated ohmic power, and heating time for aluminum and copper at different frequencies. This table highlights the combined effect of frequency, material properties, and ohmic power on melting behavior, helping to select optimal parameters for practical induction heating.
Table 1 shows that increasing frequency leads to decreased skin depth for both metals. This has important implications for the melting process:
At a lower frequency of 50 kHz, larger skin depth allows better heat distribution within the metal, which makes it suitable for larger-sized pieces at a higher frequency (100 kHz), with greater concentration of heat near the surface, higher efficiency for surface melting and smaller pieces.
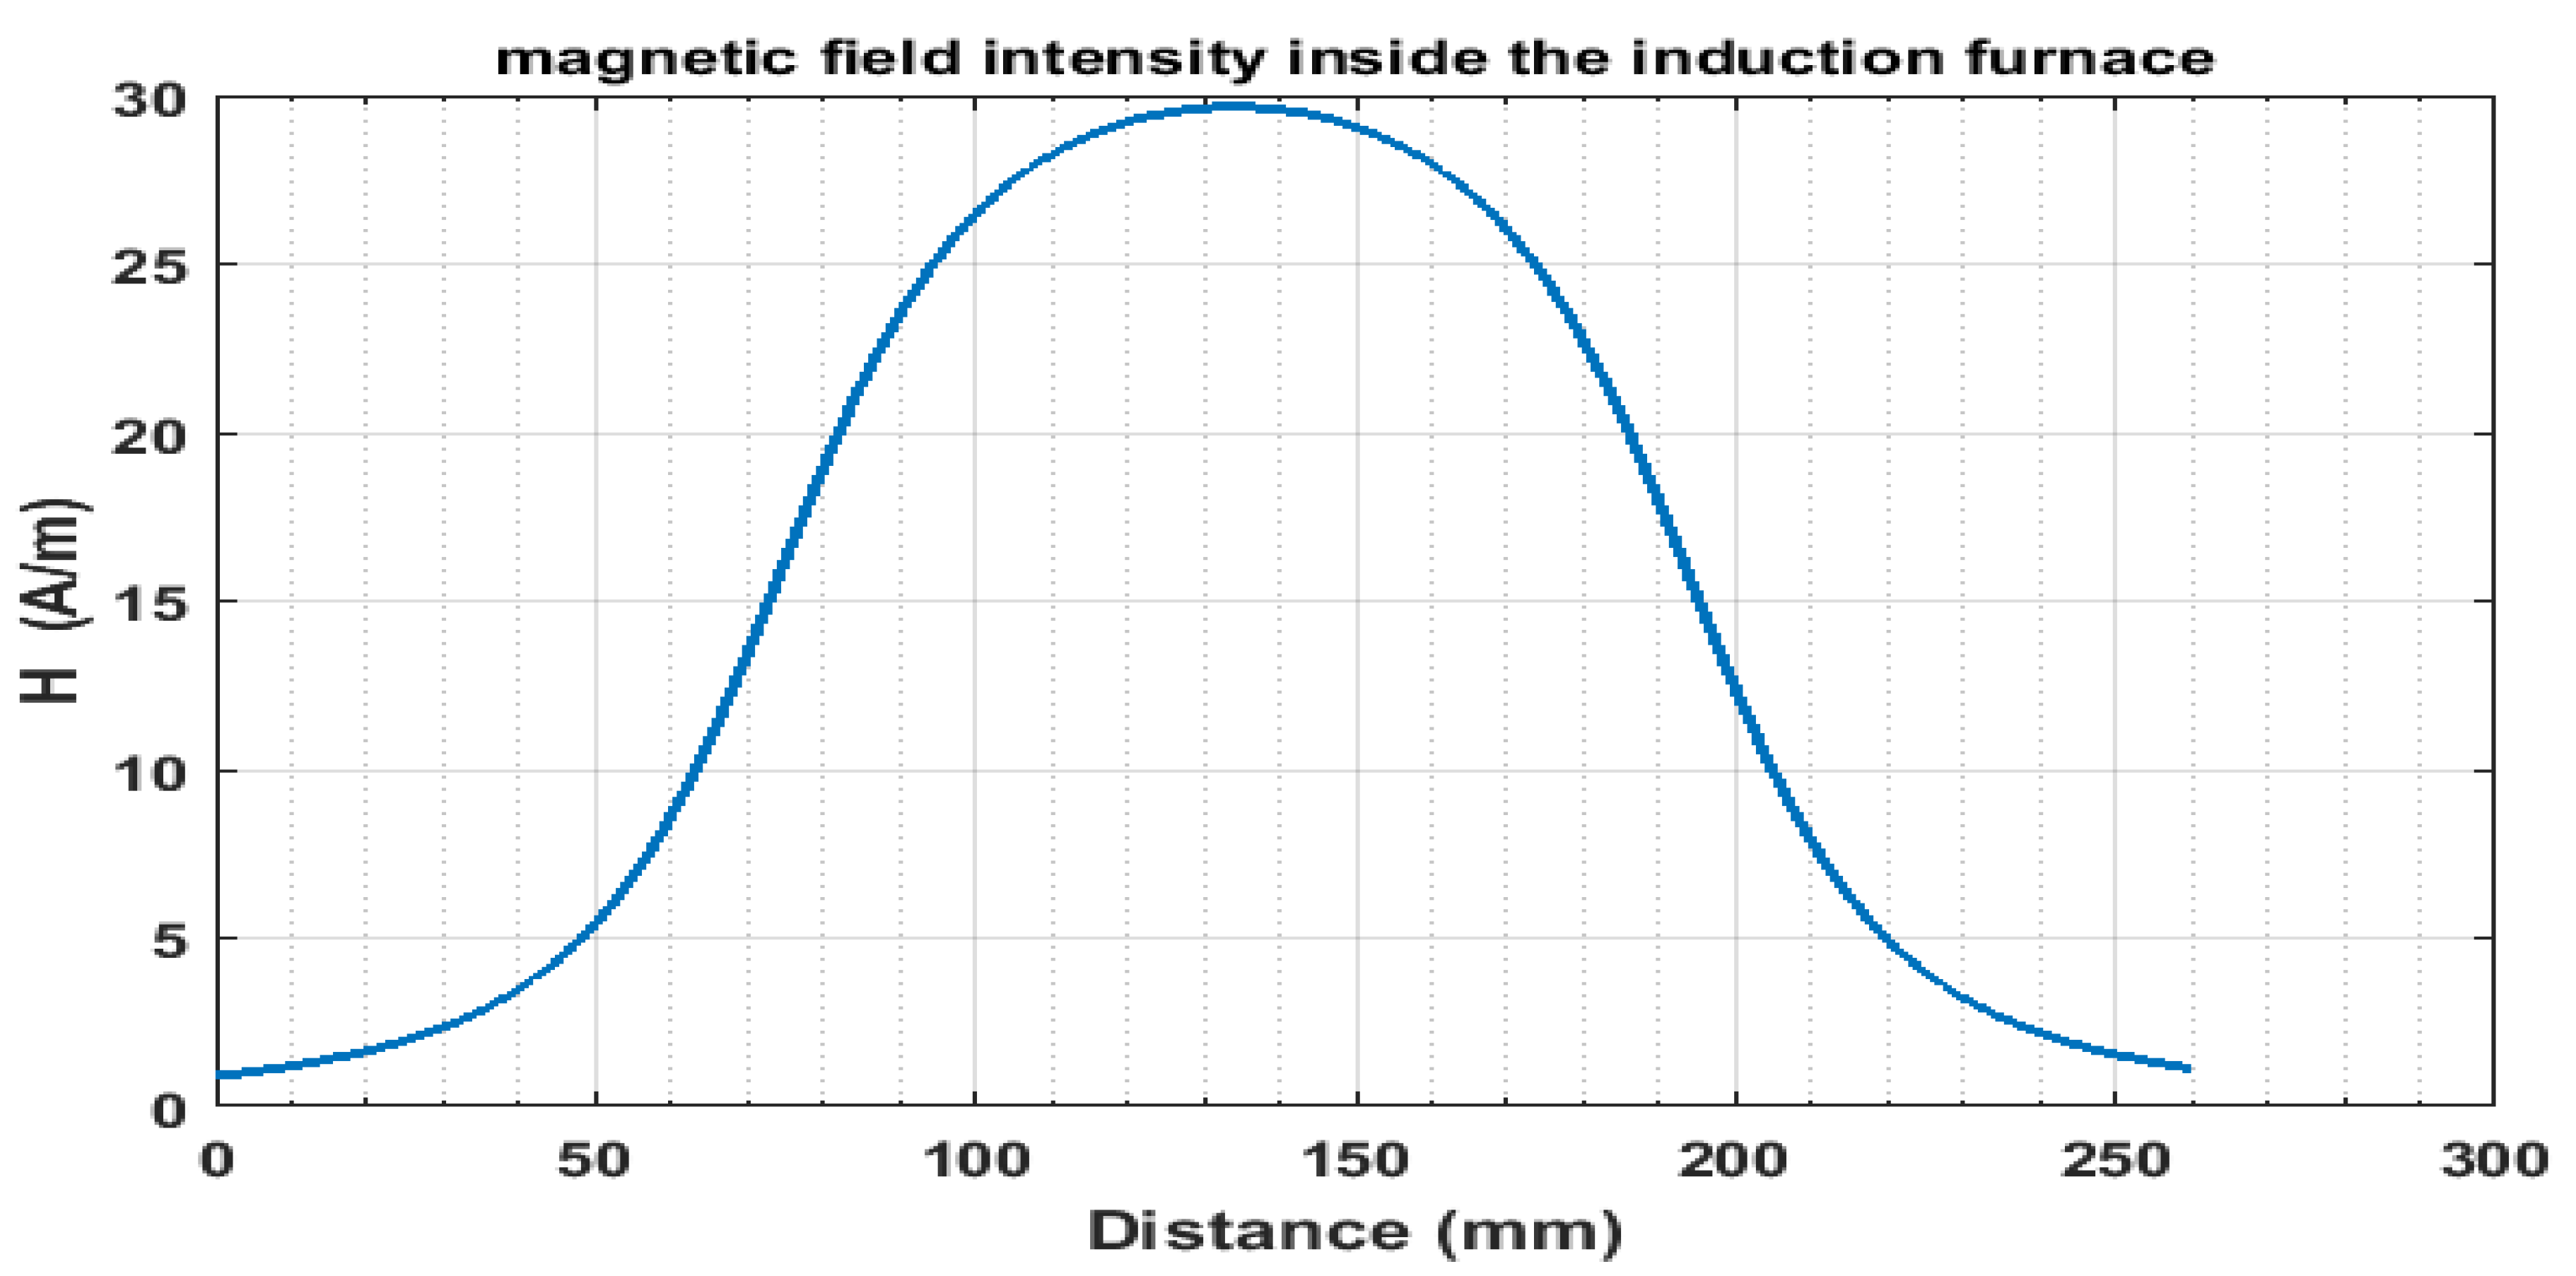
Figure 3 shows the magnetic field strength ( H ) is high at the middle of the 13 turns induction furnace (IF) and decreases when moving away from the middle.
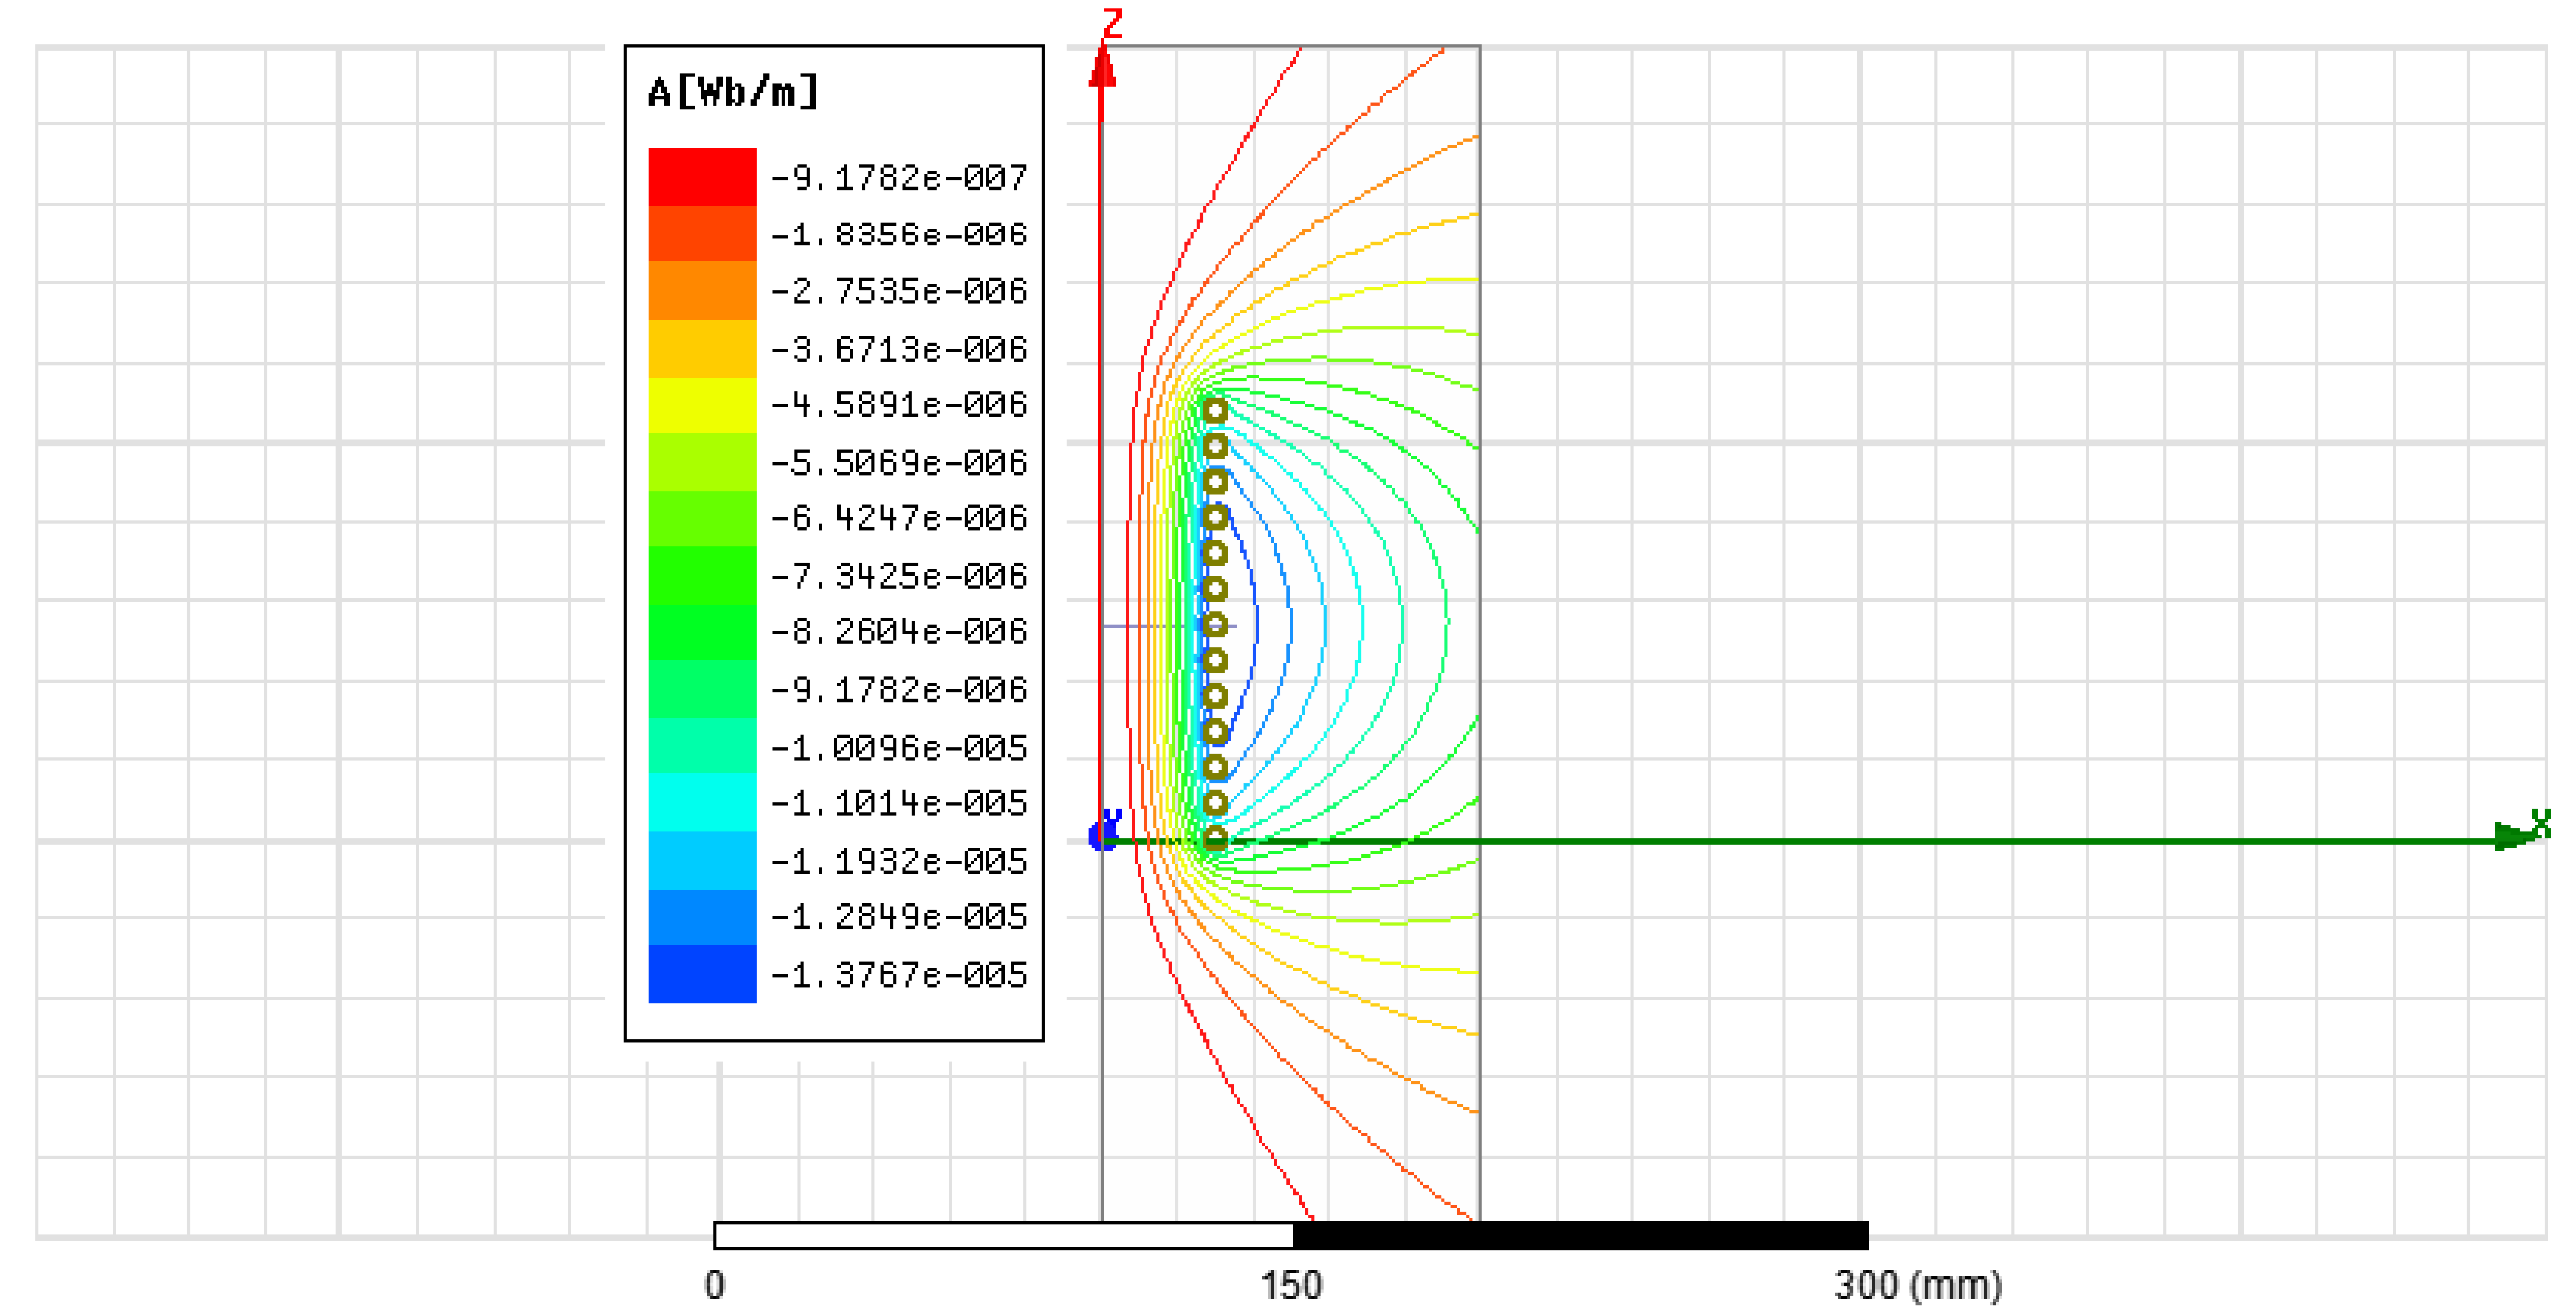
Figure 4 shows the magnetic field distributions in space without a workpiece while the work coil has a peak excitation current equal to 300 A with a frequency of 75 kHz. Magnetic line patterns are absolutely necessary for analysis of the results.
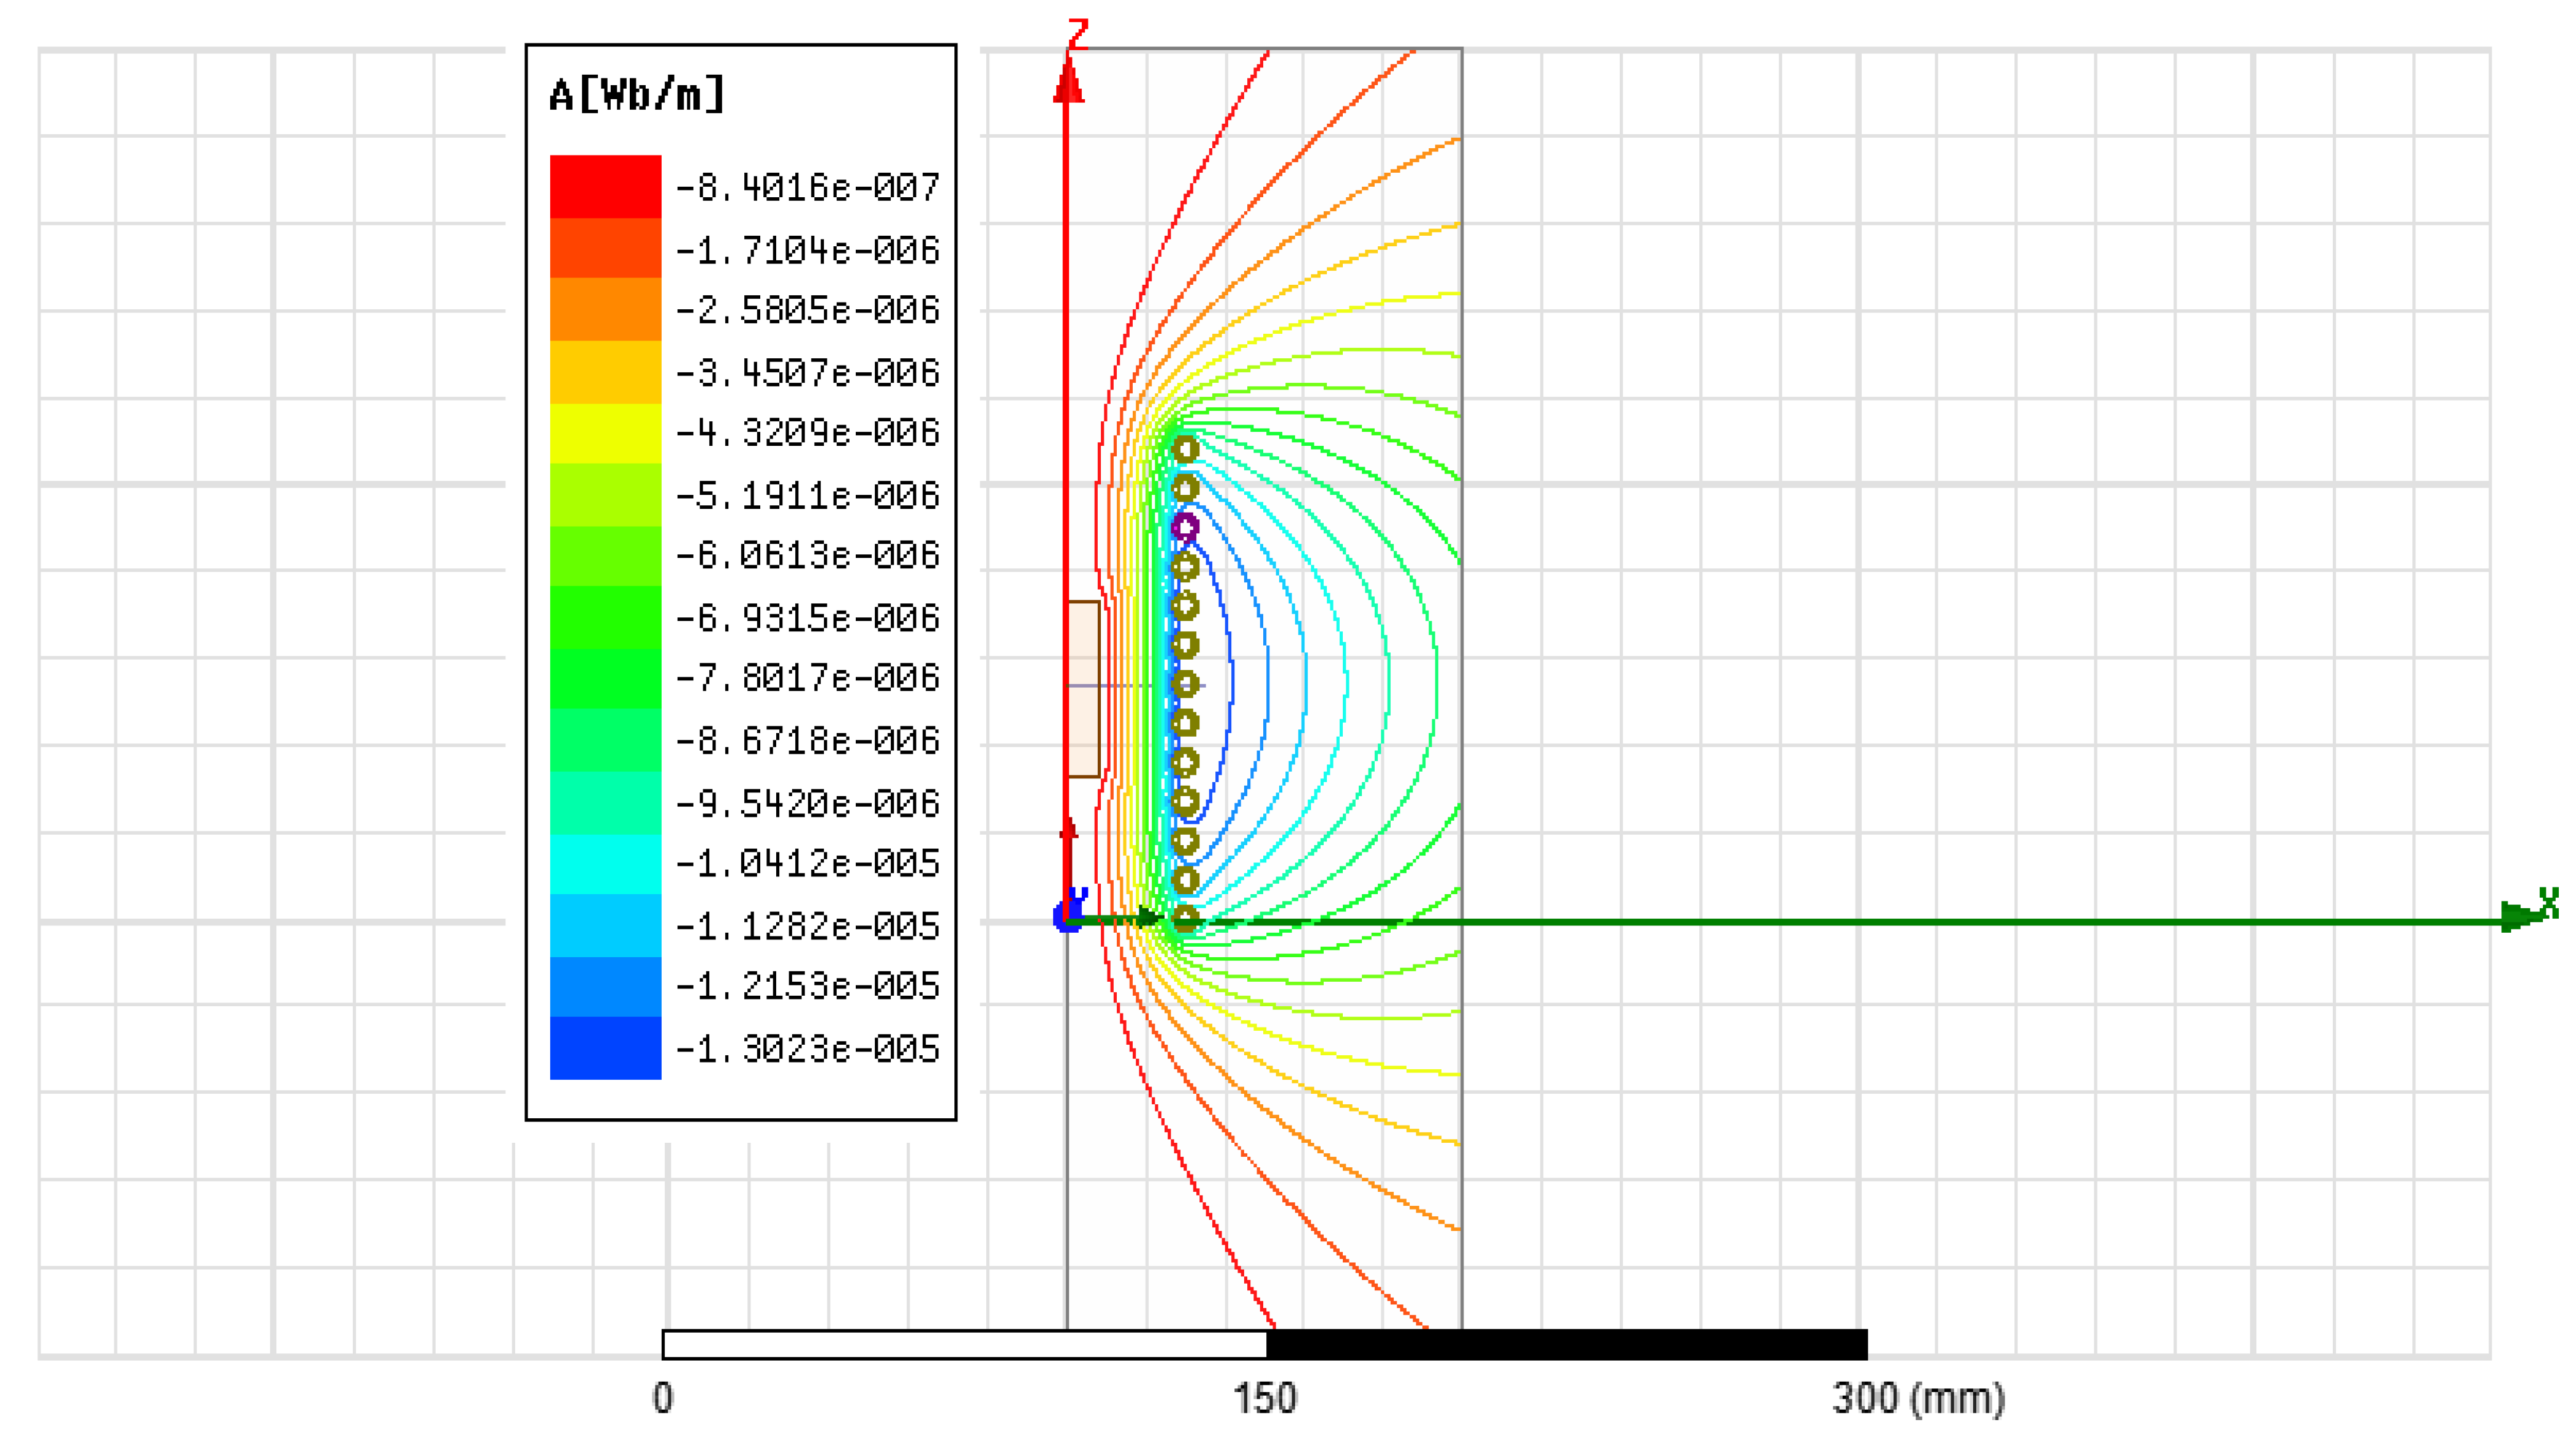
Figure 5 shows flux line distributions in space with a copper scrap while the IF has a peak excitation current equal to 300 A with a frequency of 75 kHz. The magnetic flux concentrates at the surface of the scrap, producing ohmic loss.
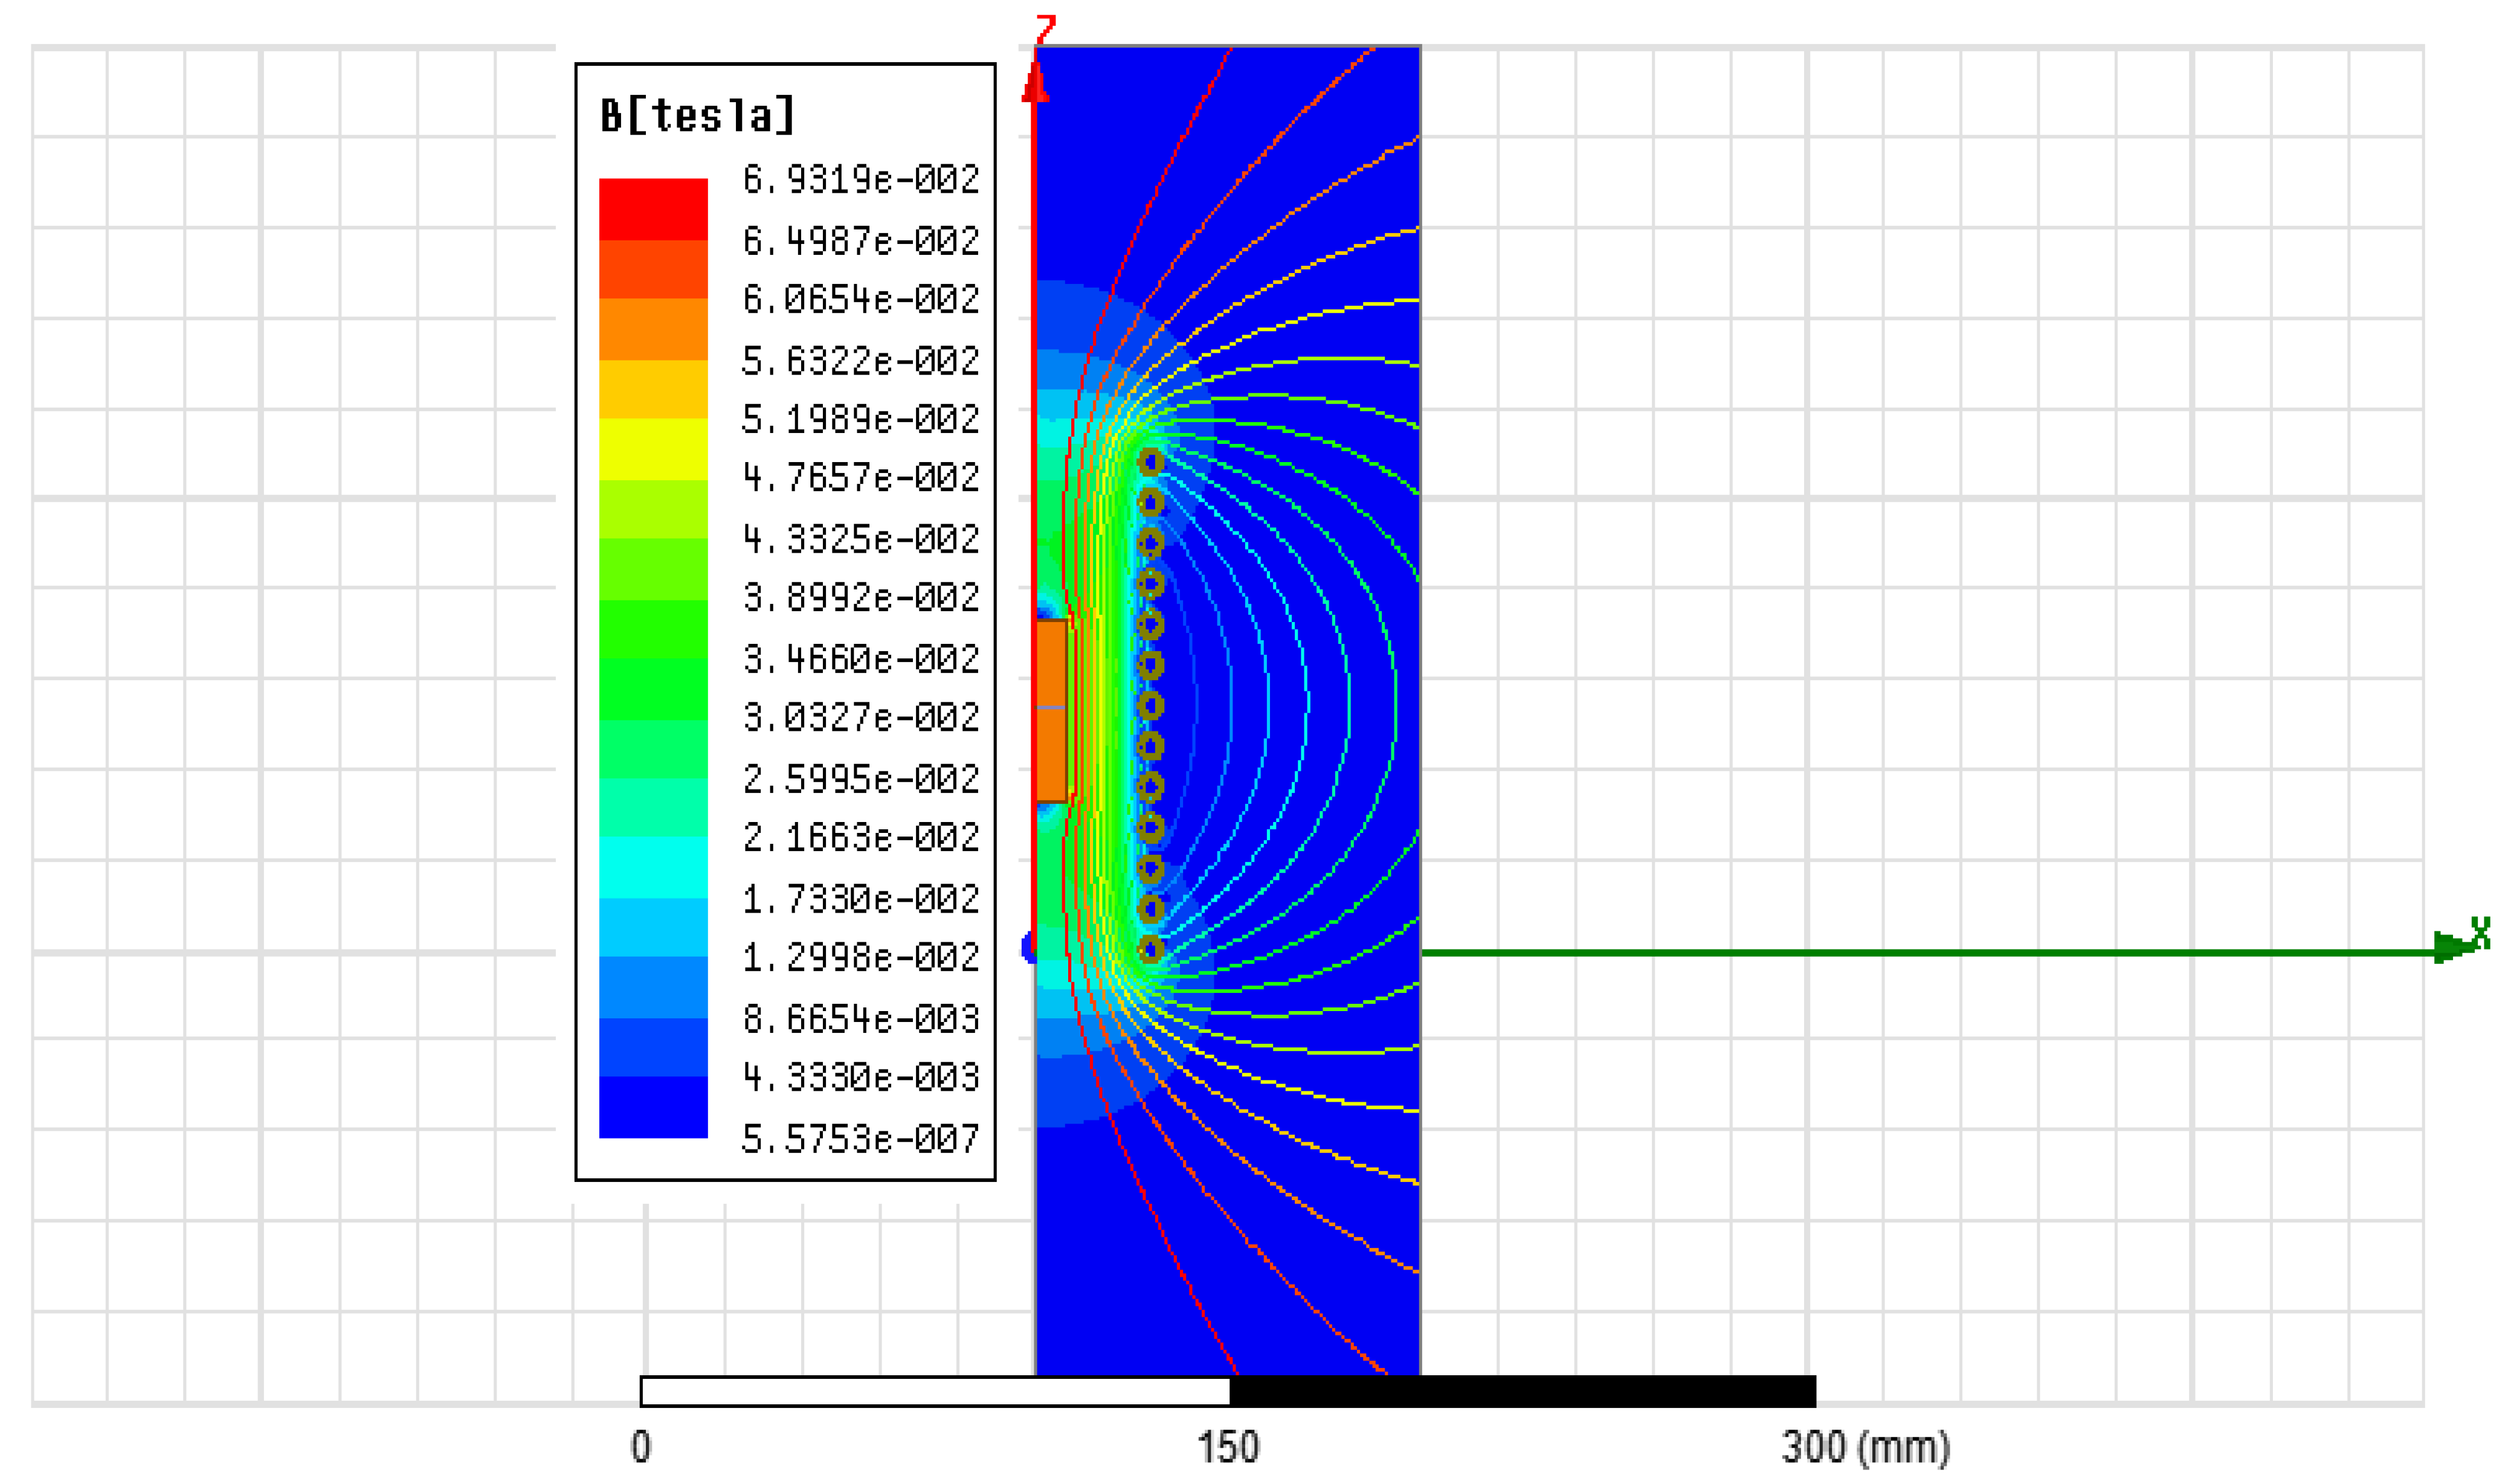
Figure 6 presents the FEM-simulated magnetic flux density distribution in the induction heating system. The high-intensity region (69.3 mT, red) at the coil inner radius indicates strong electromagnetic coupling, while the exponential decay pattern validates the theoretical skin effect model with an effective heating depth of 30–45 mm.
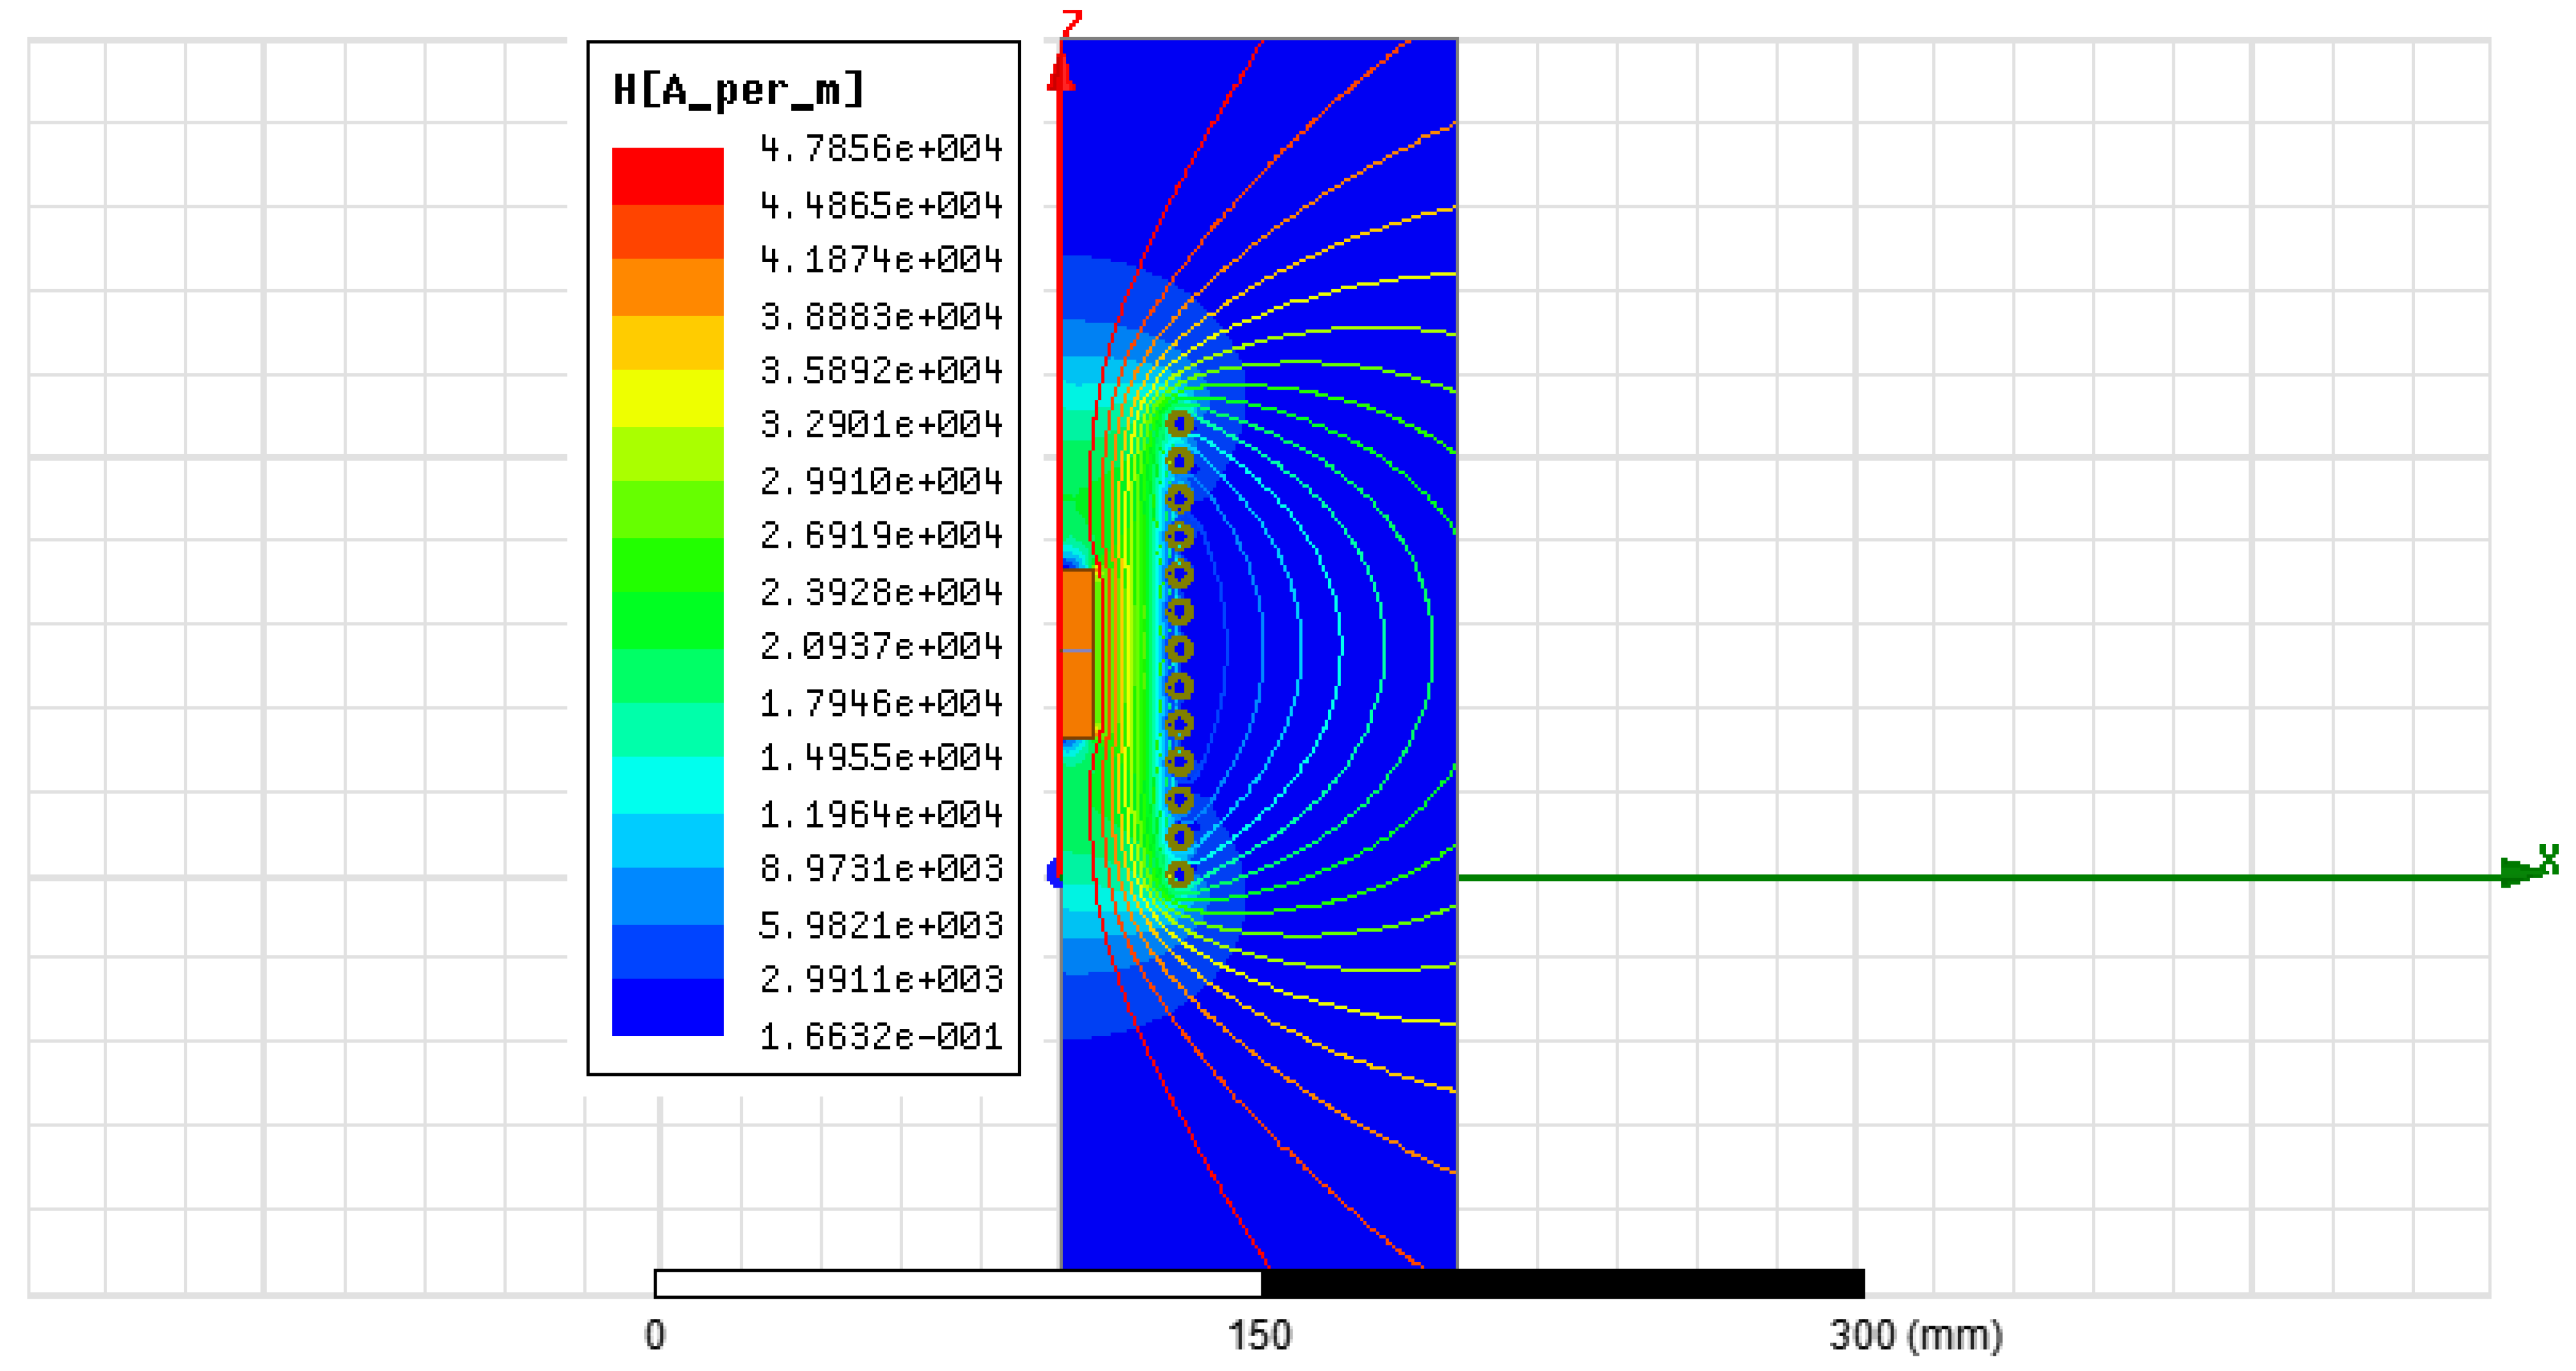
Figure 7 shows the magnetic field strength distribution with a maximum value of 47.9 kA/m at the coil surface (red). The field decays exponentially outward, reaching negligible values (<300 A/m) in the outer region, confirming efficient field concentration and minimal stray losses.
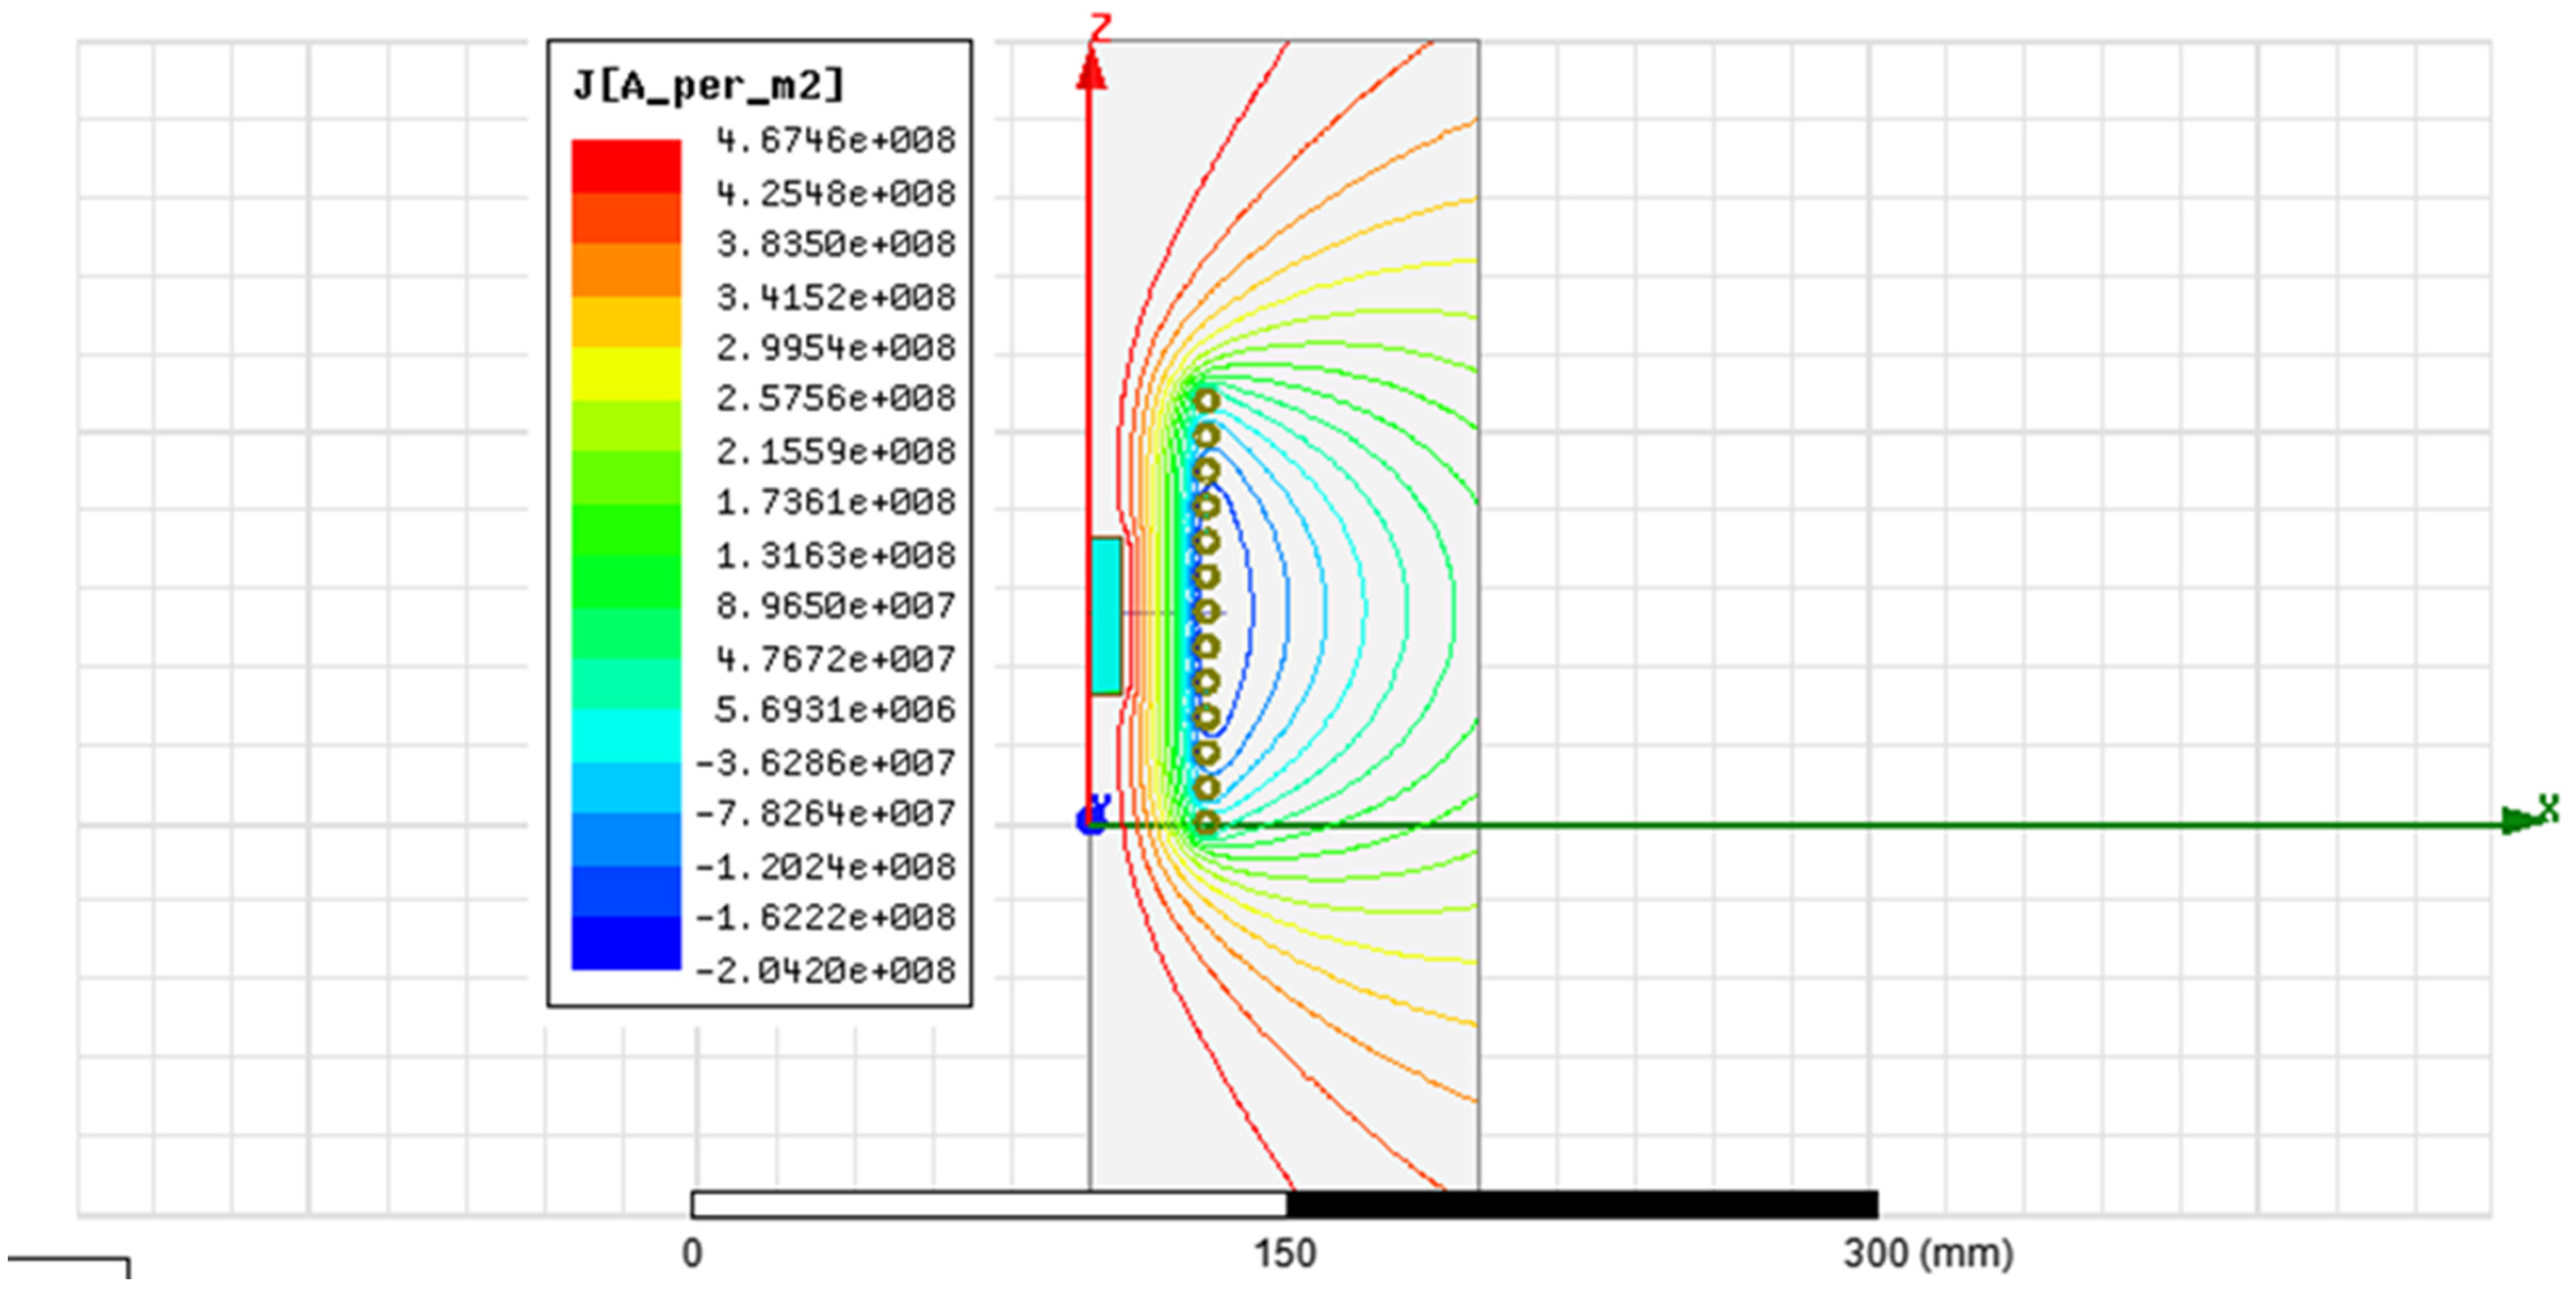
Figure 8 illustrates the current density distribution with copper scrap. Clearly showing the skin effect. High current density regions (red/orange) are concentrated near the surface, reaching peak values, while lower density areas (blue/green) decrease exponentially toward the interior, consistent with electromagnetic theory. The smooth color transition from surface to interior confirms the calculated skin depth and indicates proper mesh refinement in the FEM model. Additionally, current density is strongly influenced by operating frequency and material properties, with higher frequencies causing greater surface concentration.
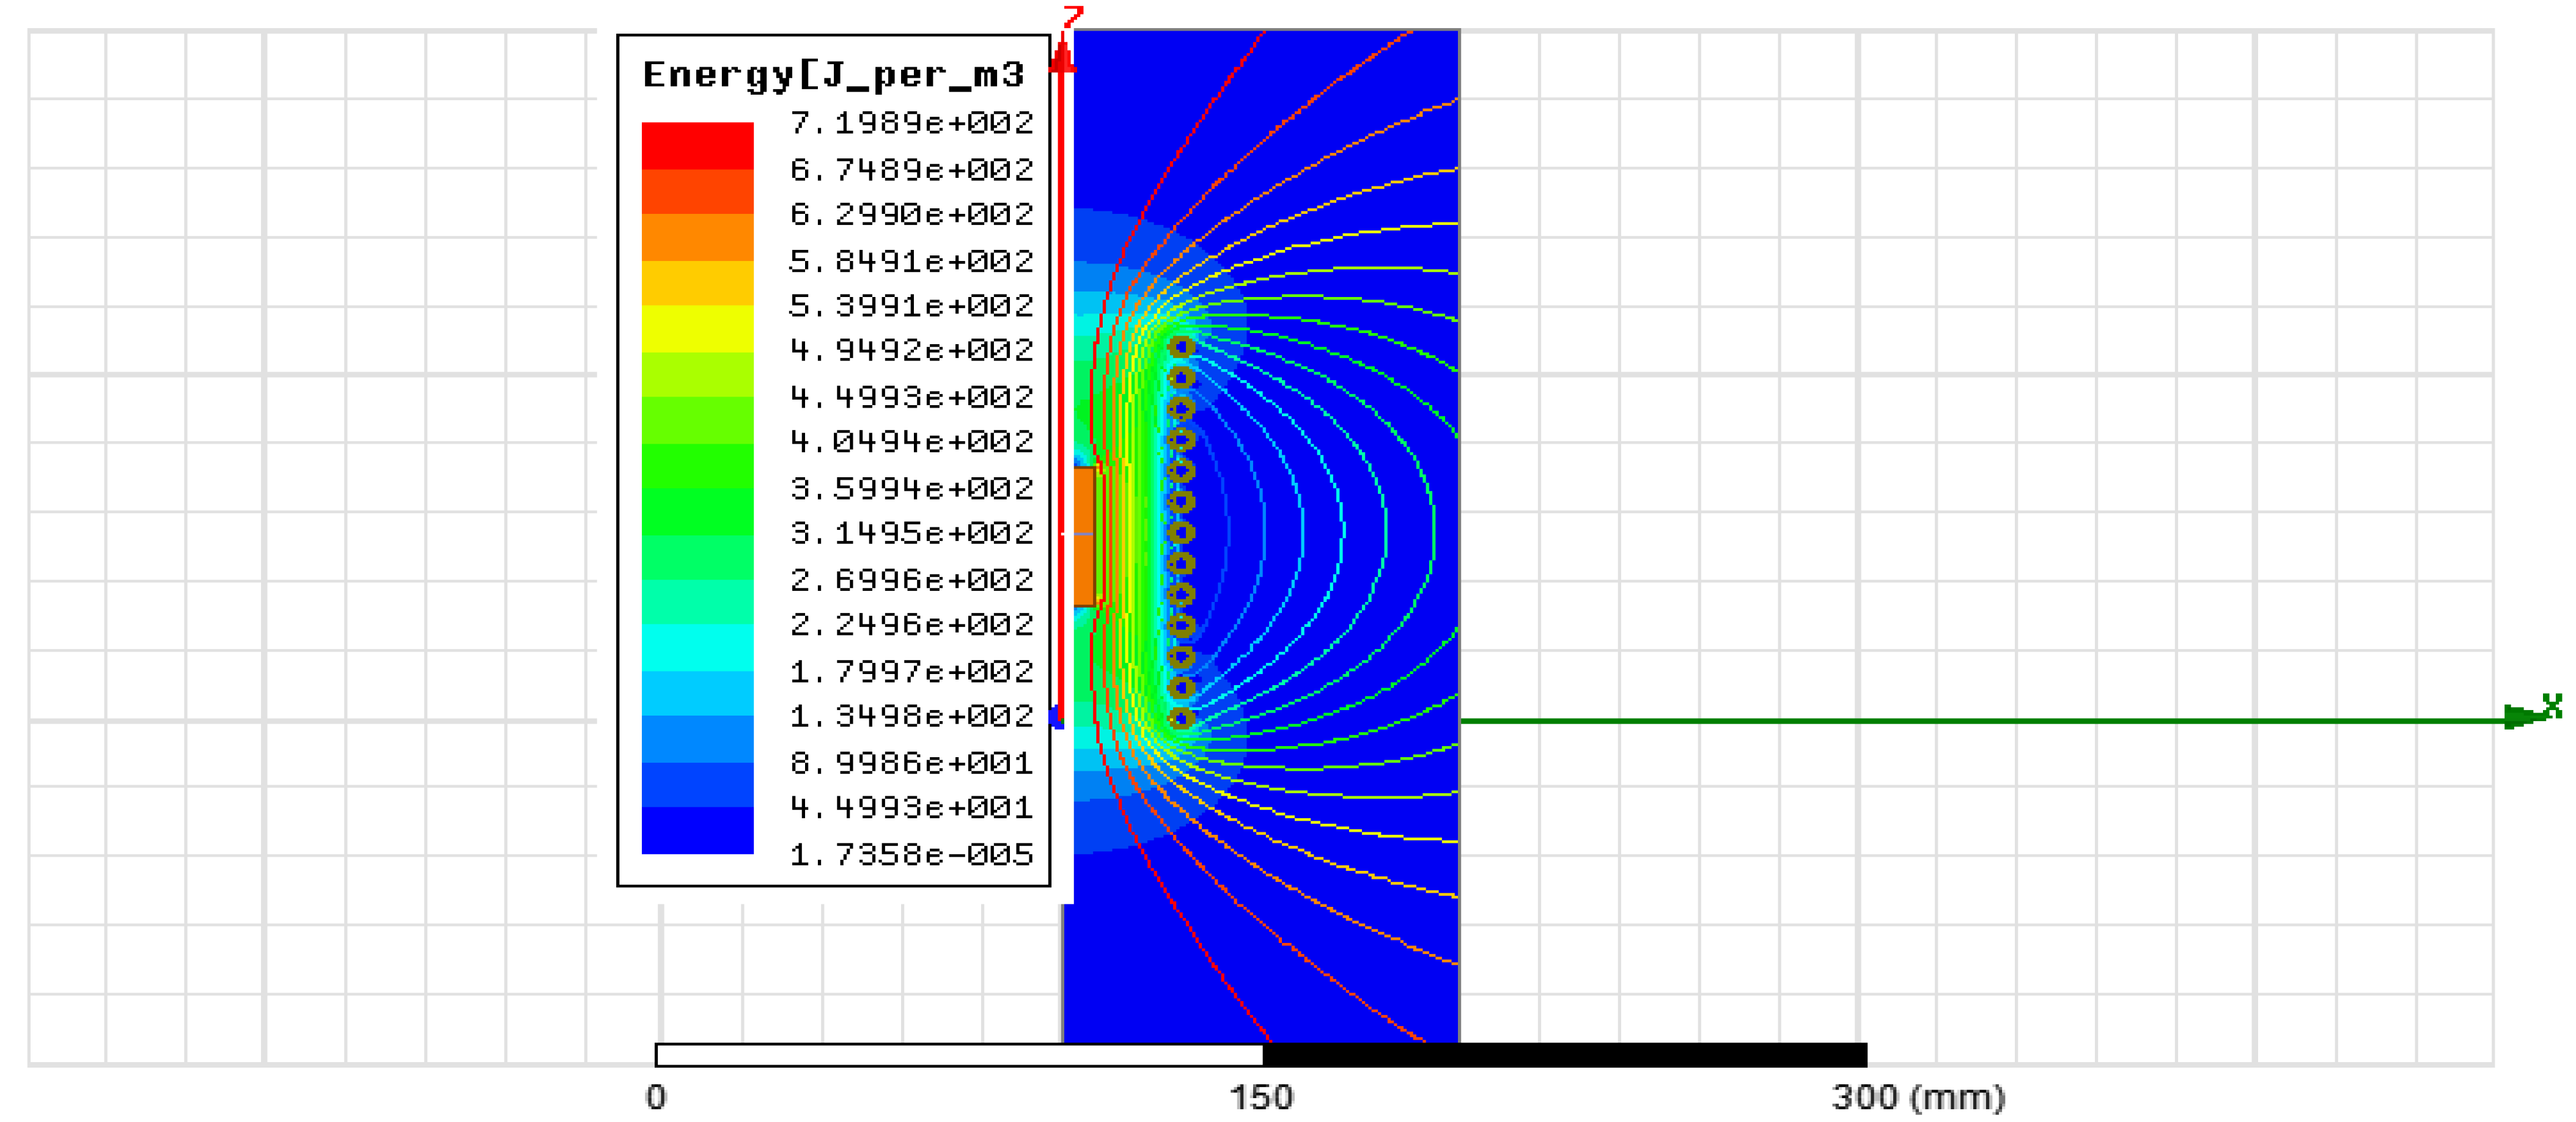
Figure 9 shows the energy density distribution with a maximum value of 719 J/m3 at the coil surface (red). The concentrated energy region (red-green zones) extends 30–45 mm into the workpiece, indicating efficient heat generation. The rapid decay to <50 J/m3 in outer regions minimizes energy losses.
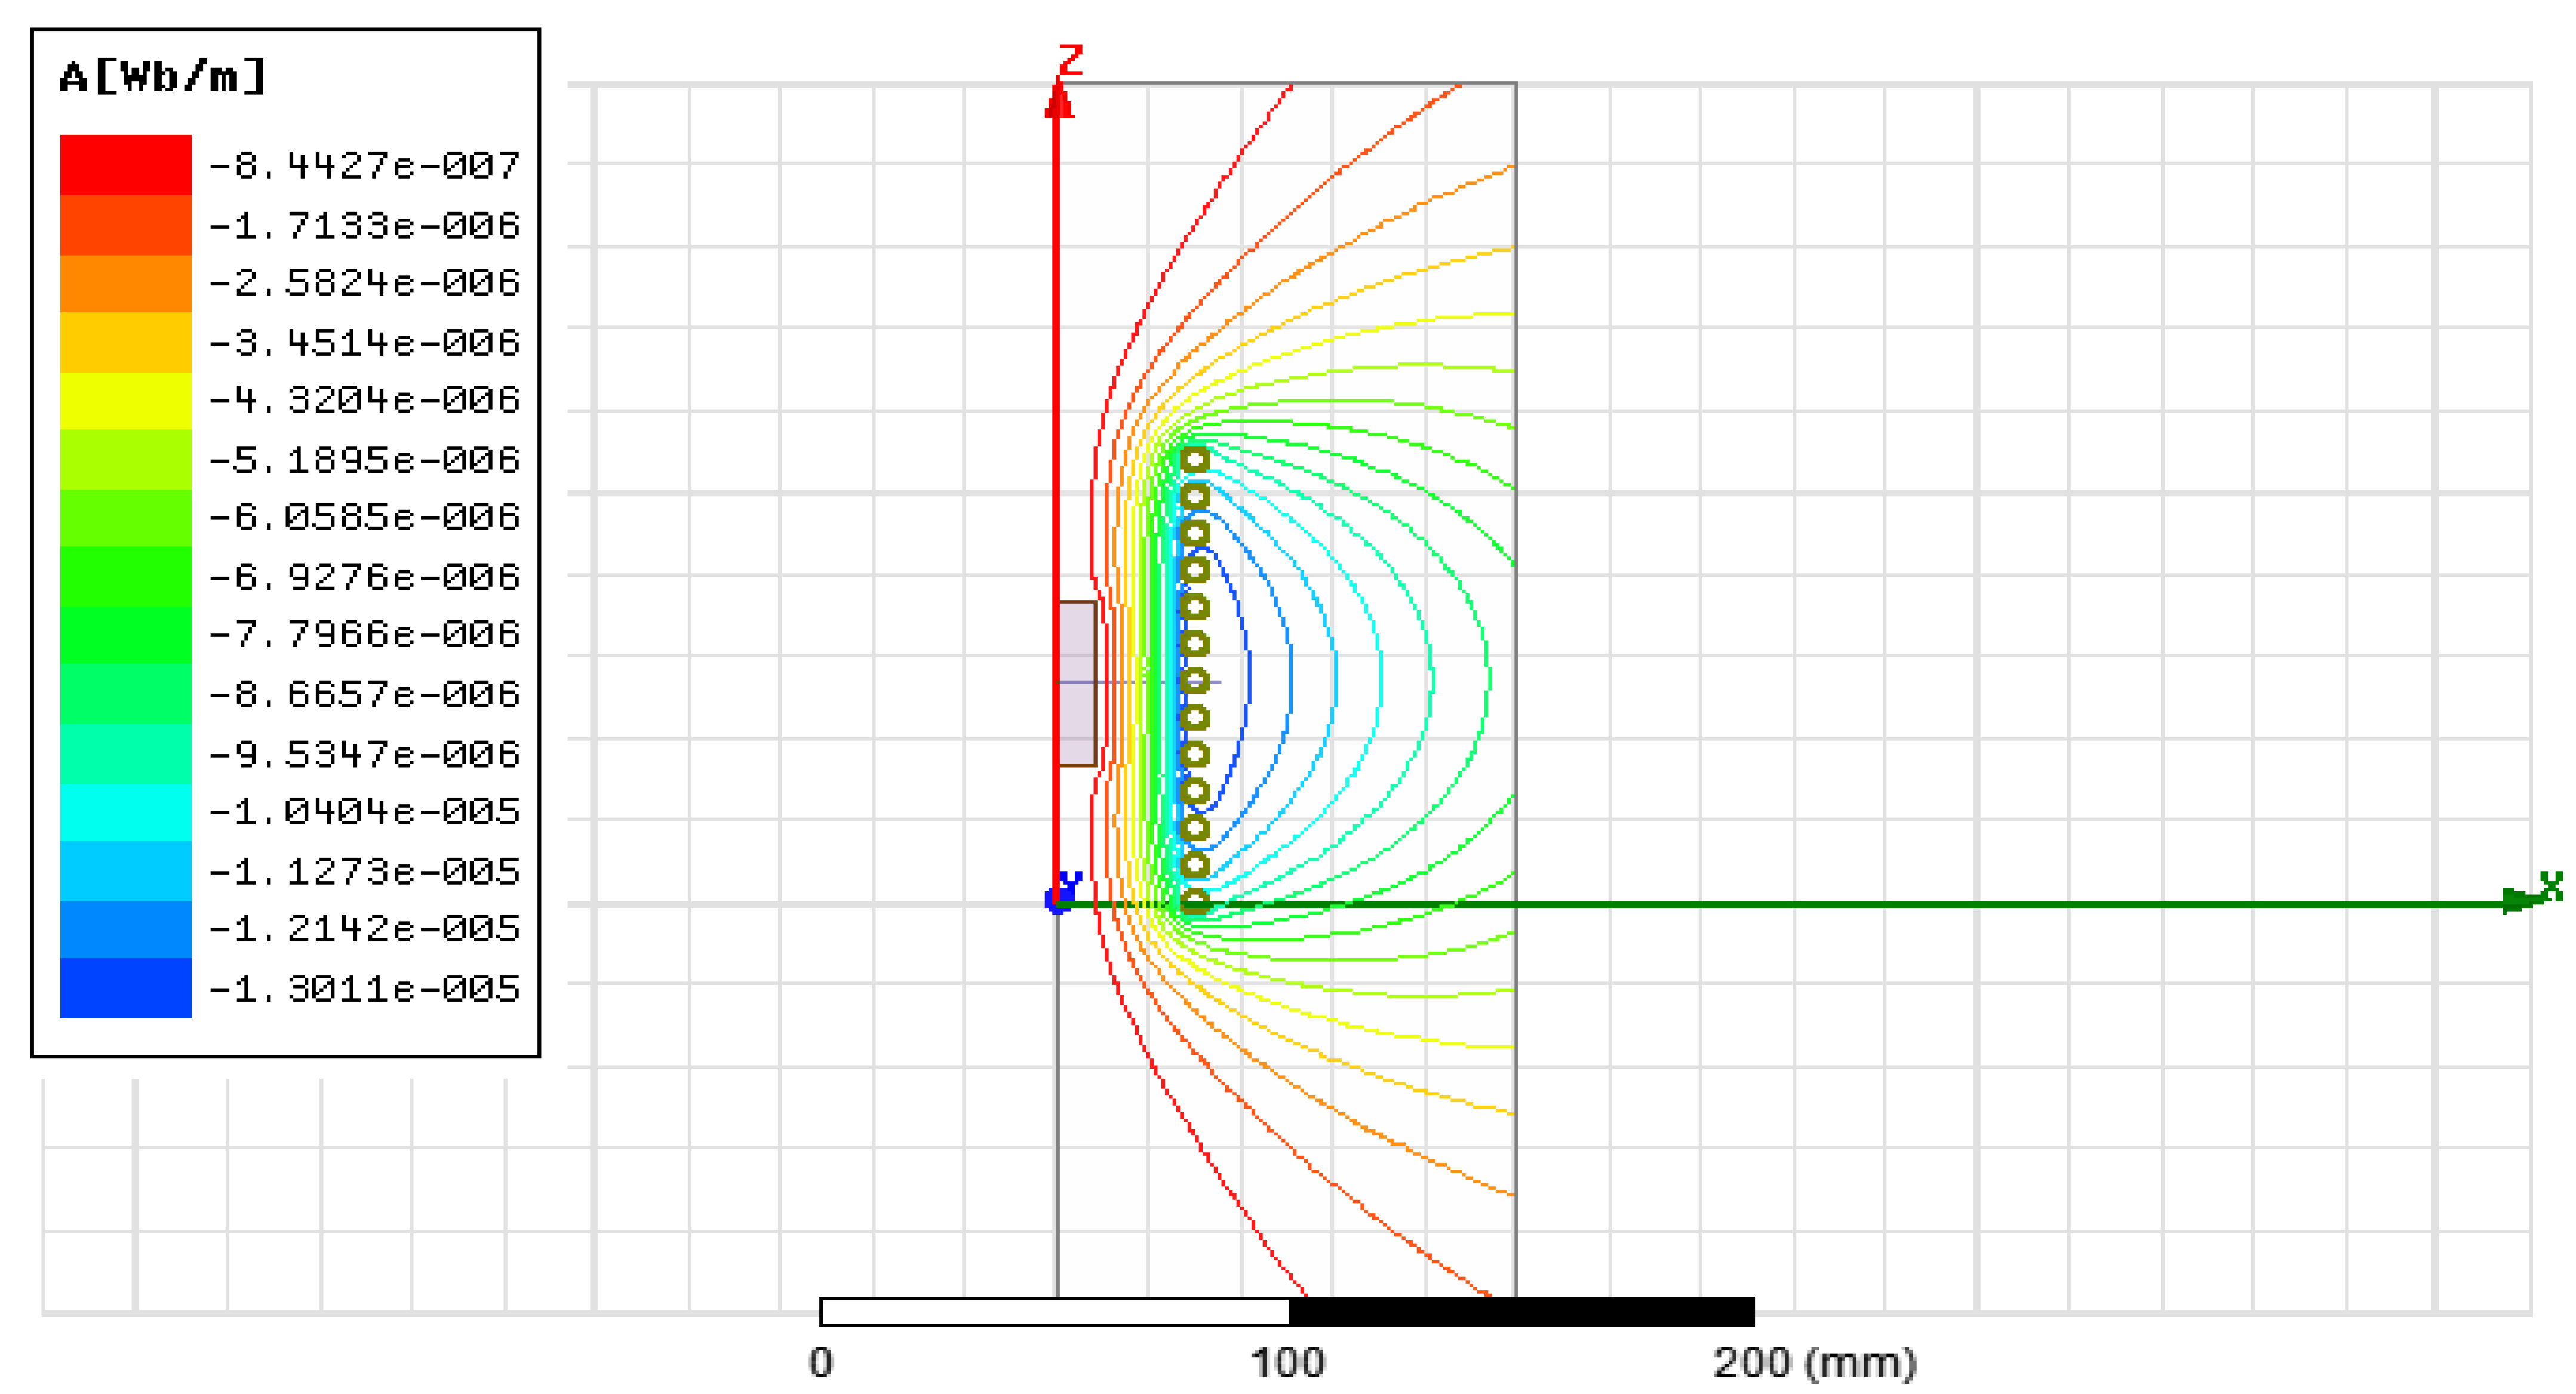
Figure 10 illustrates flux lines distribution for aluminum scrap with a peak magnitude of 0.844 µWb/m. While nearly identical to copper (0.840 µWb/m) in peak value, aluminum exhibits wider contour spacing due to its larger skin depth (δ ≈ 12 mm vs. 9 mm for copper), resulting in deeper field penetration (50–70 mm) and a more distributed heating pattern ideal for uniform scrap melting.
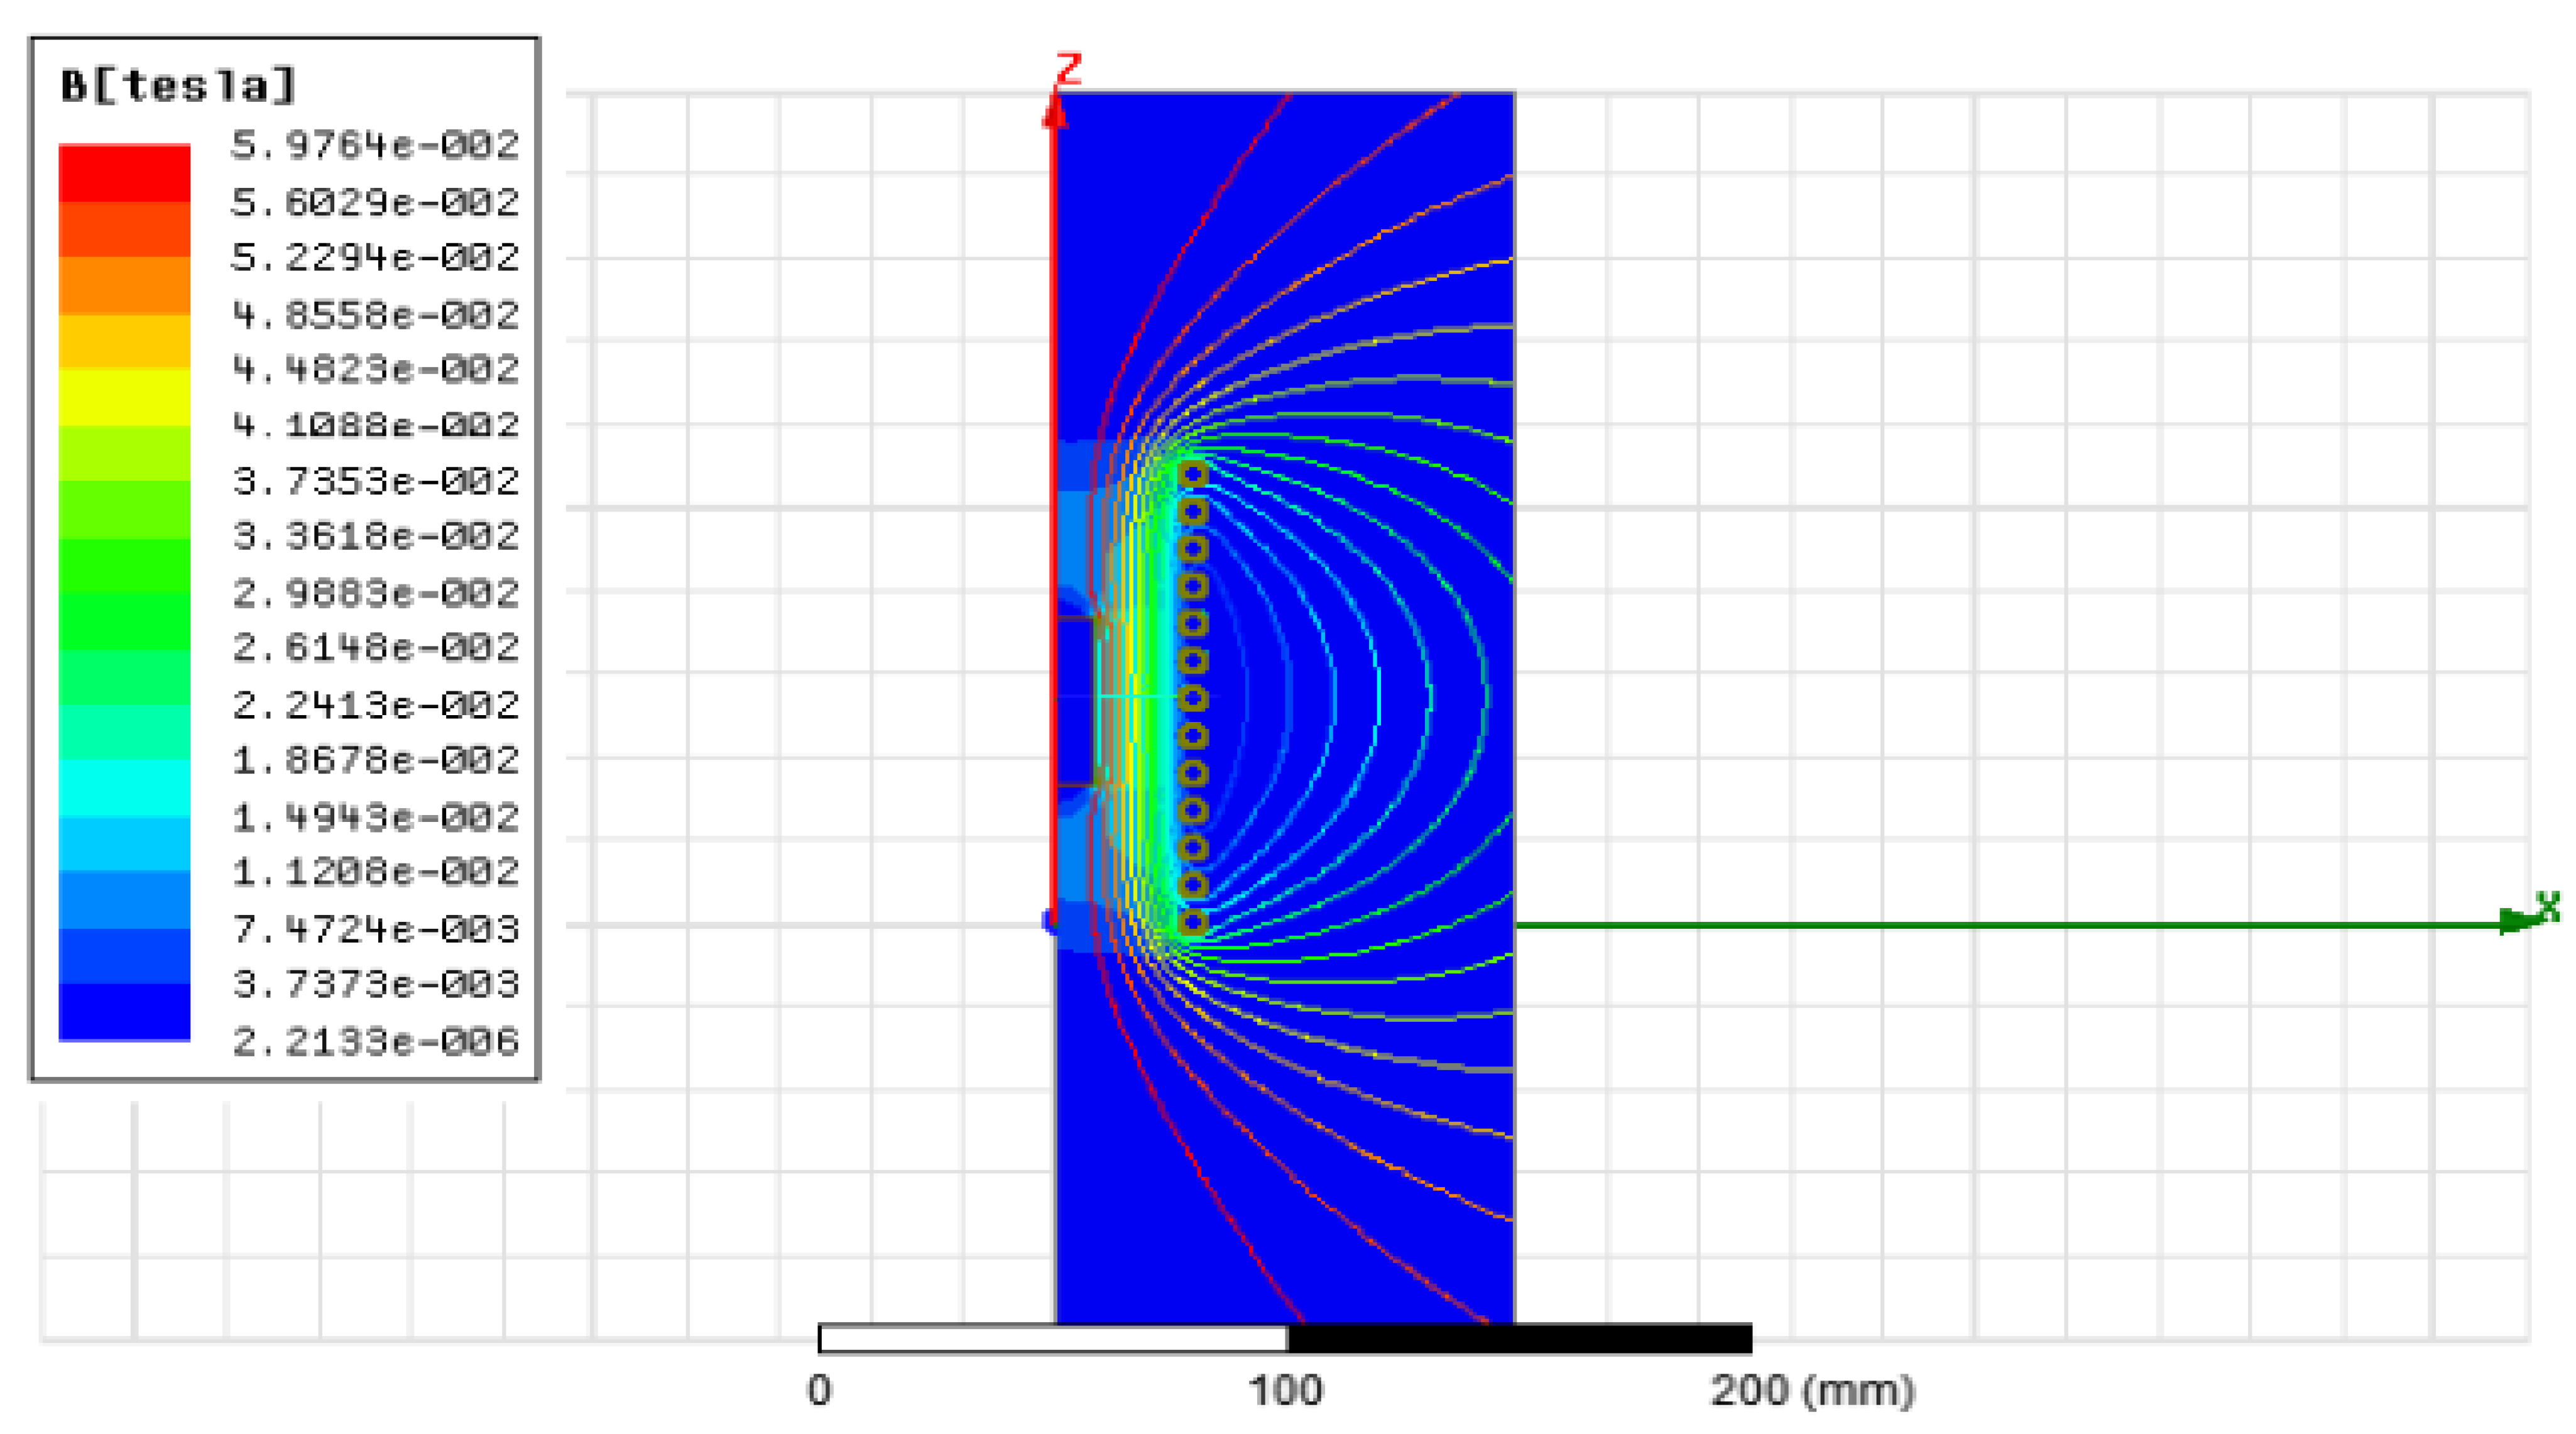
Figure 11 presents the magnetic flux density distribution for aluminum scrap, showing a peak value of 59.8 mT, approximately 14% lower than copper due to reduced electrical conductivity. The extended penetration depth (50–70 mm vs. 30–45 mm for copper) results from aluminum’s lower conductivity and larger skin depth, providing more uniform heating for bulk scrap melting applications.
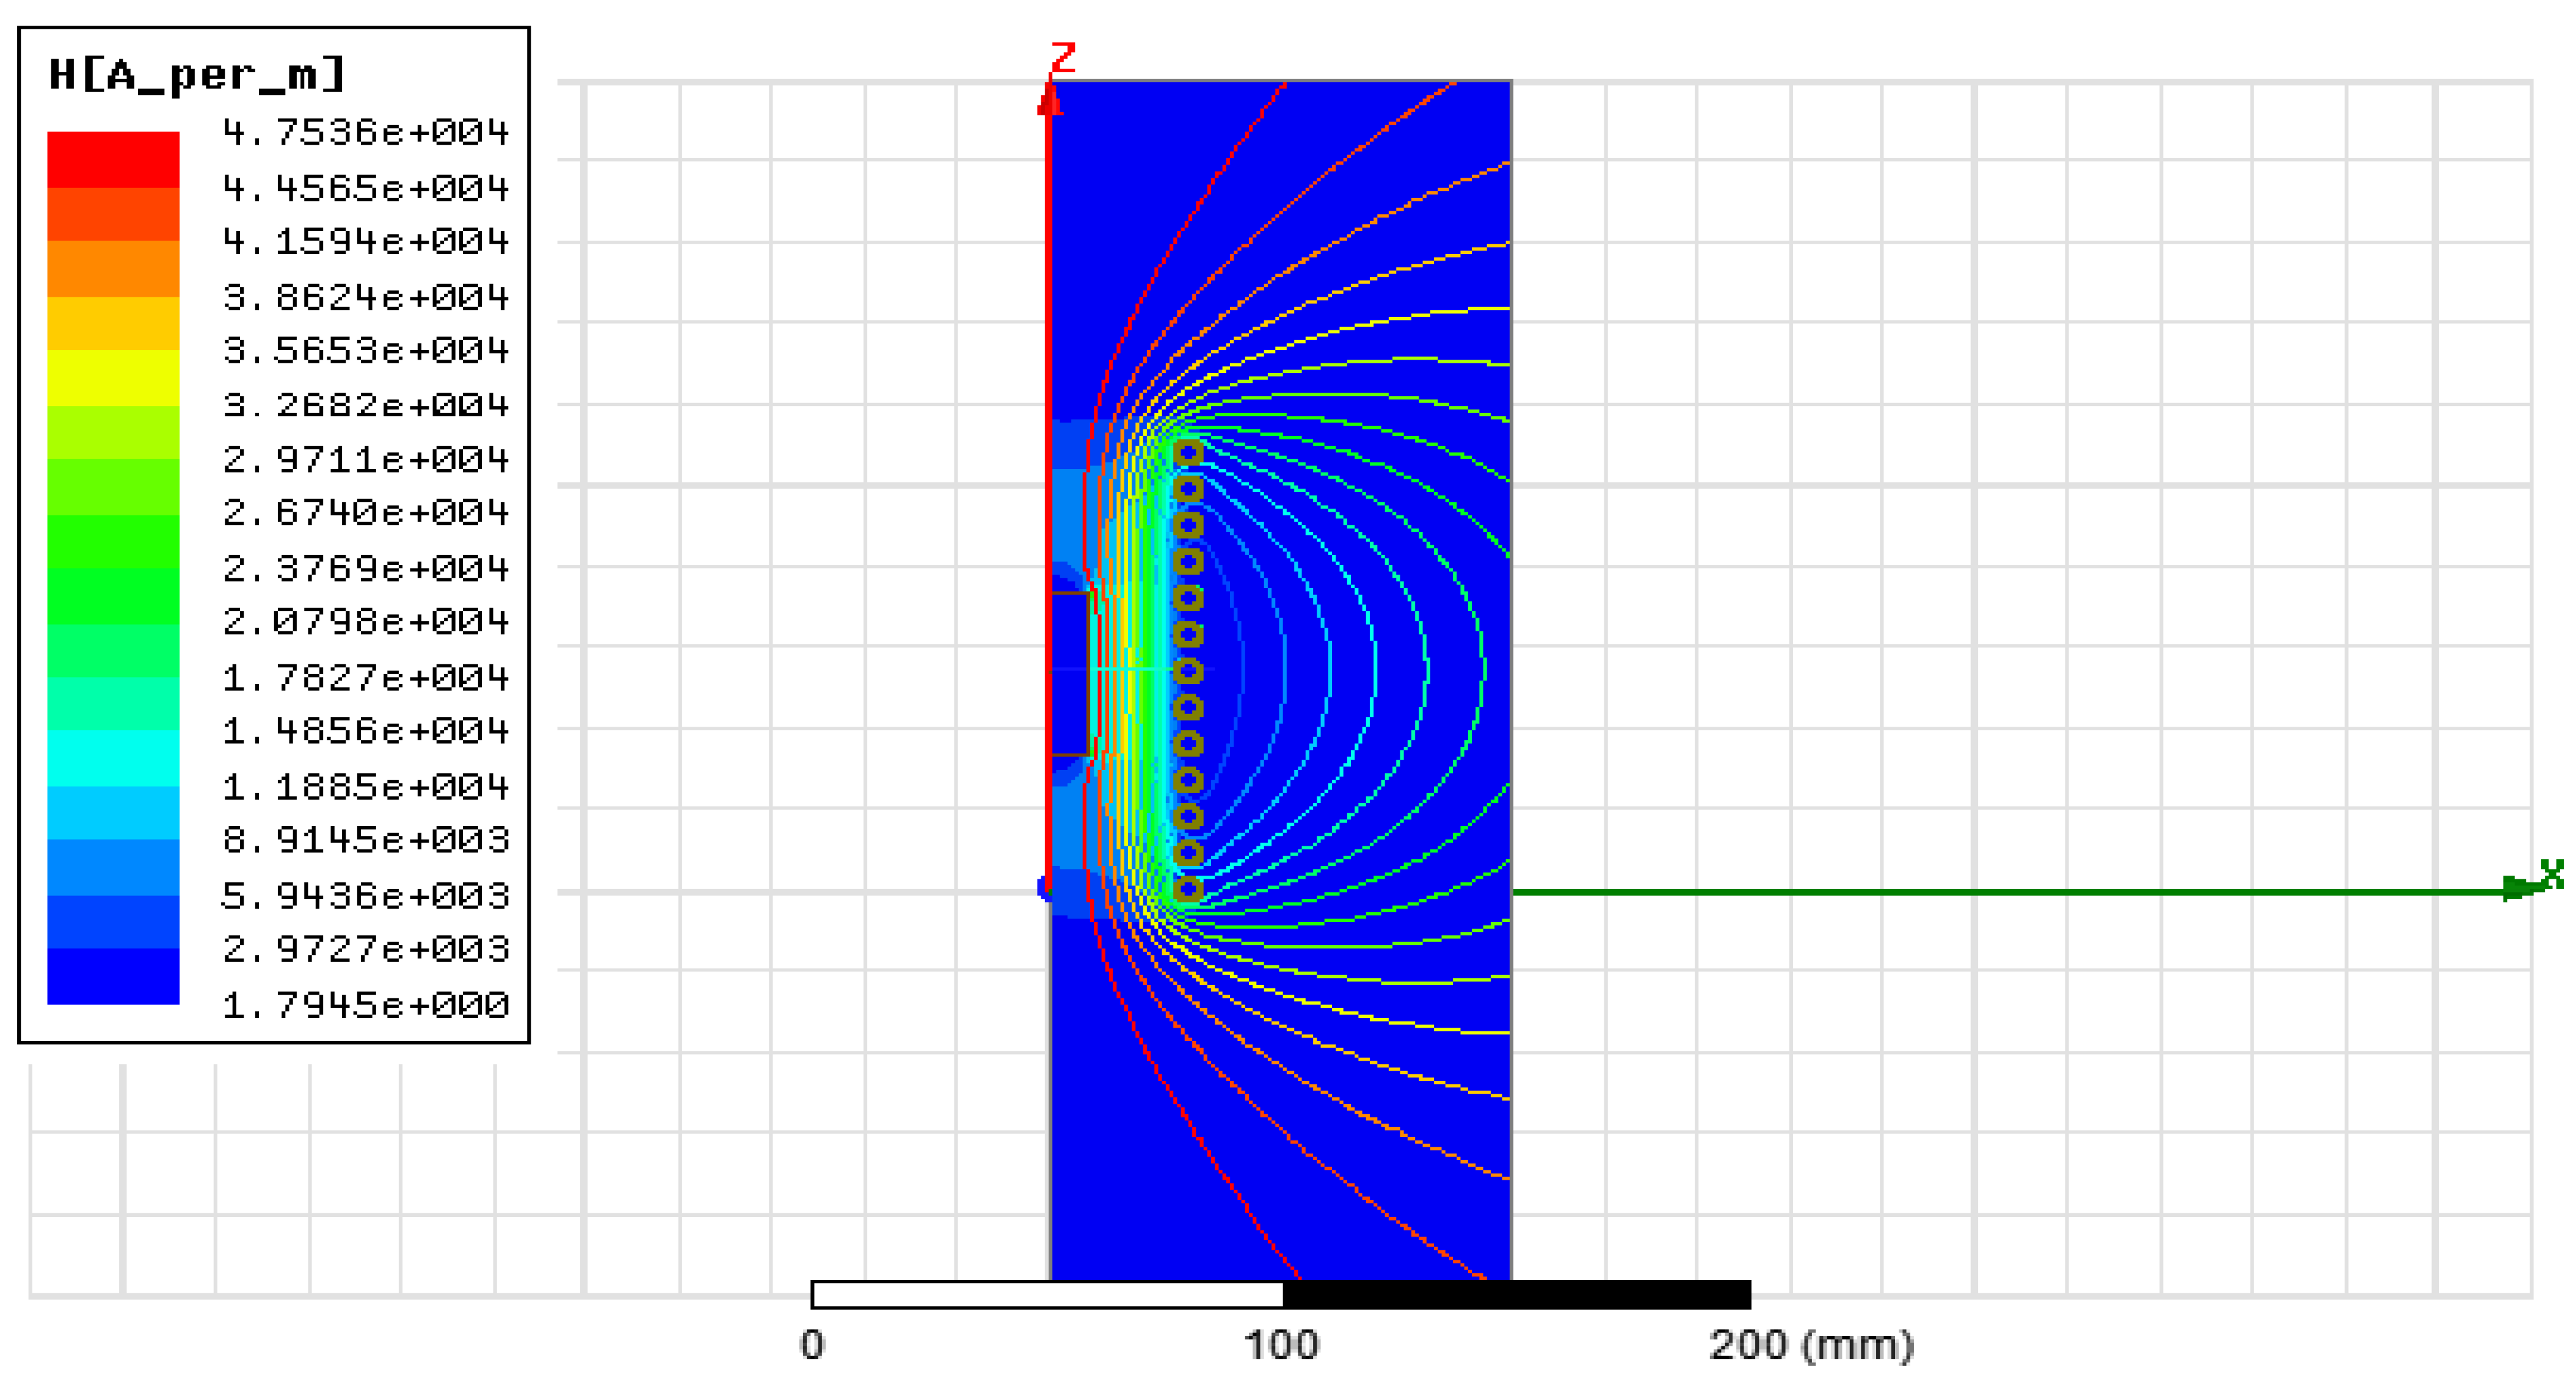
Figure 12 presents the magnetic field intensity distribution for aluminum scrap, showing a maximum H-field of 47.5 kA/m at the coil surface (red). The field decay pattern is slightly more gradual than copper due to aluminum’s lower conductivity (3.5 × 10⁷ S/m), resulting in deeper penetration (50–70 mm) suitable for uniform volumetric heating.
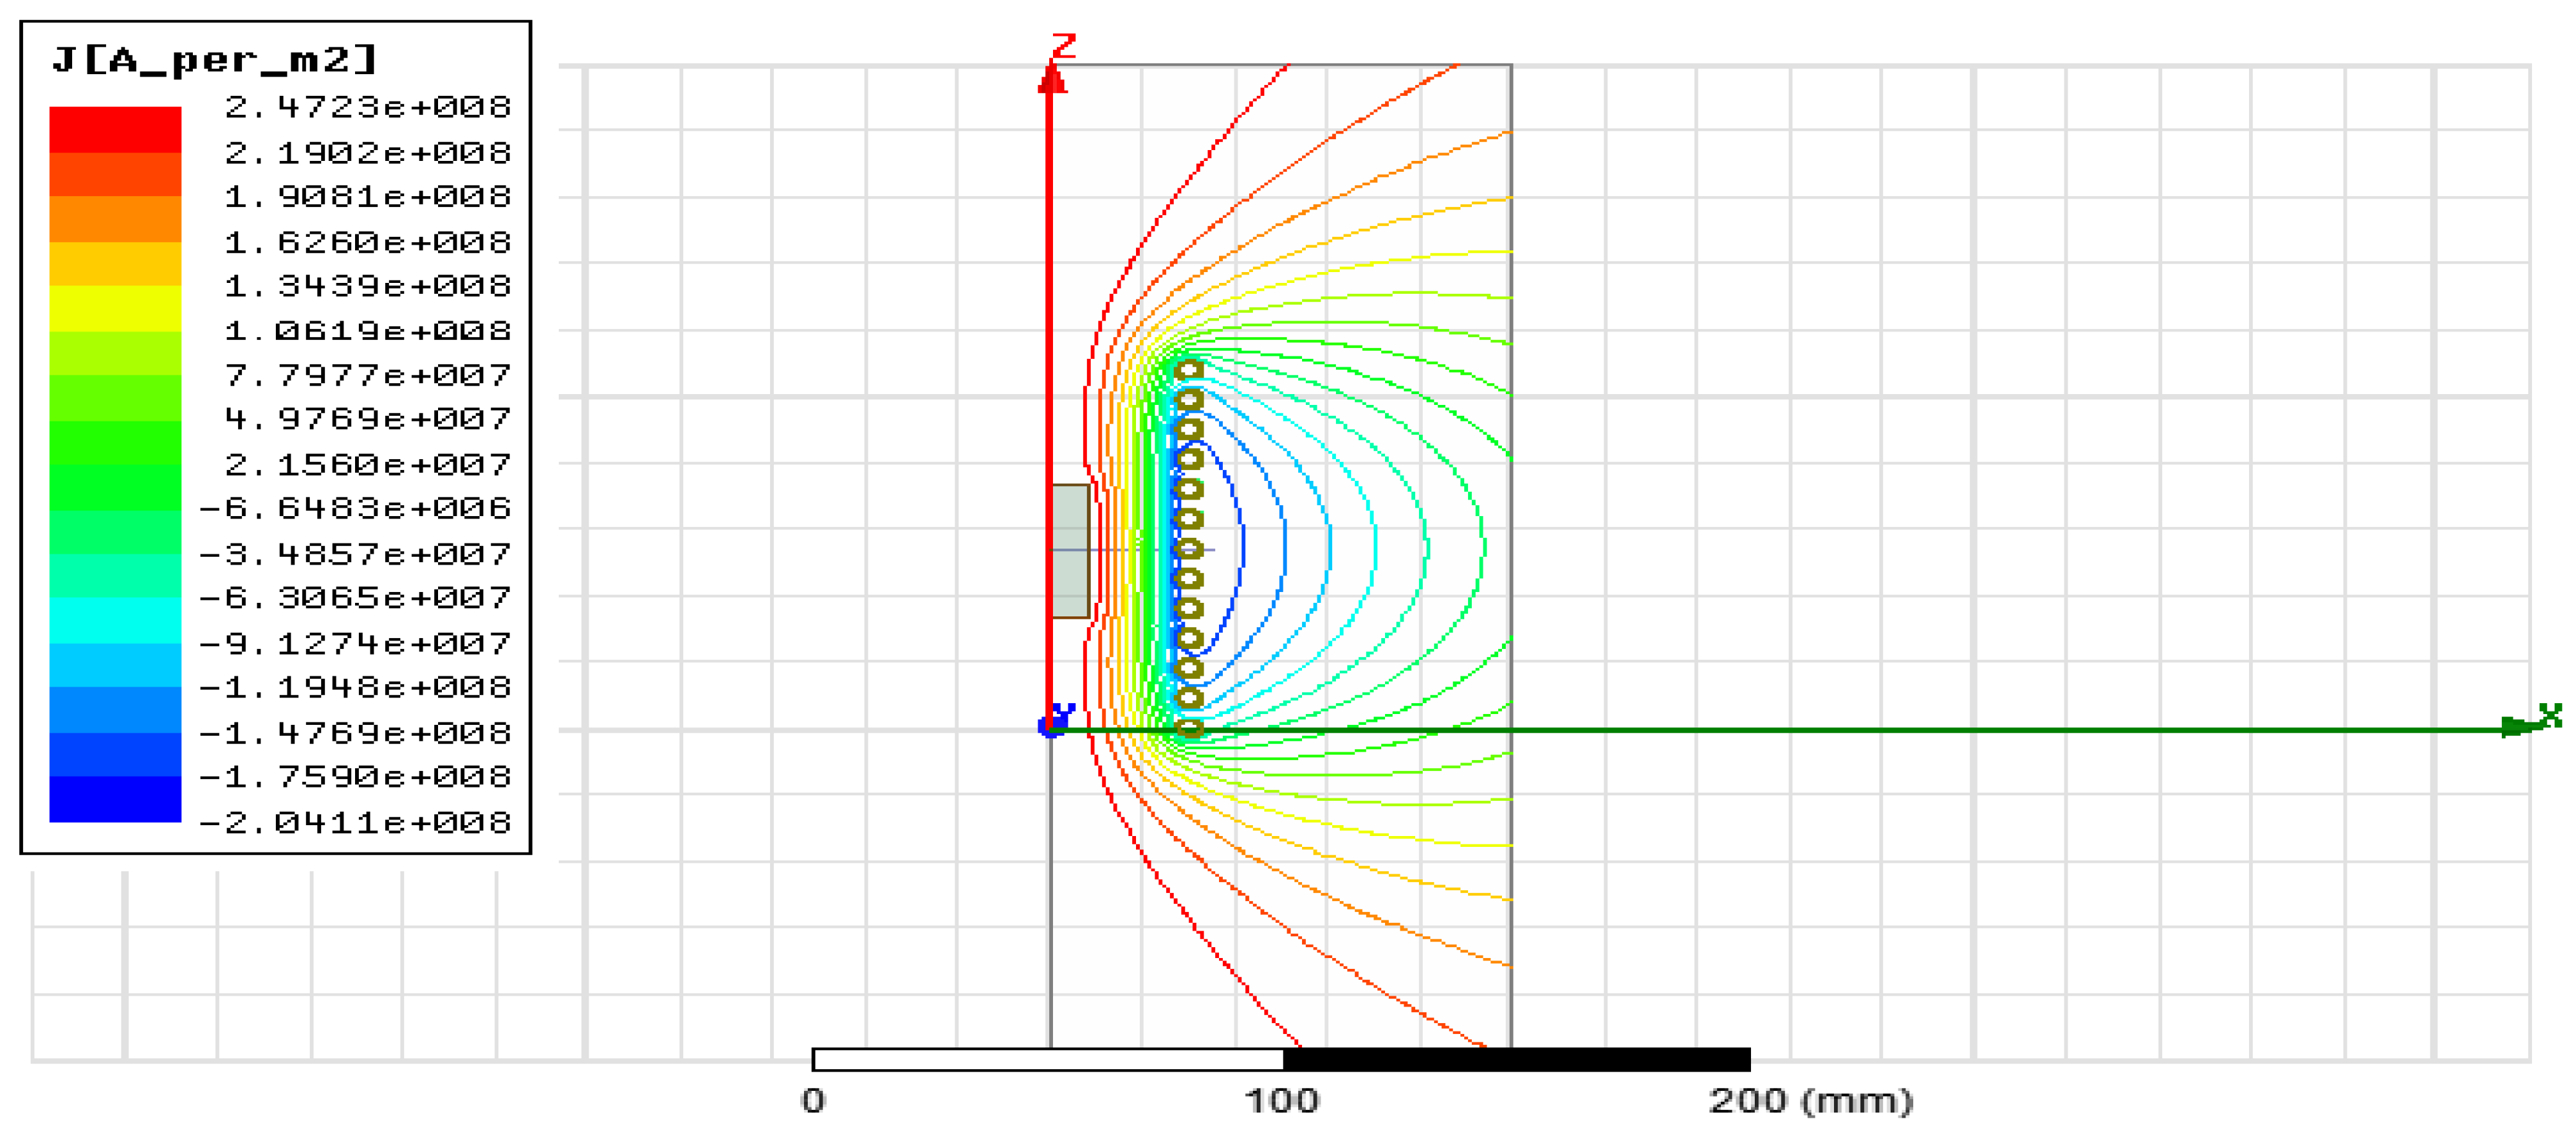
Figure 13 presents the induced eddy current density distribution for aluminum scrap with a maximum value of 247 MA/m2 concentrated at the workpiece surface (red). The asymmetric pattern reflects current flow direction, with the skin effect limiting penetration to 30–45 mm. The high current density (>100 MA/m2) in the red–orange zones directly correlates to the heat generation rate via P = J2ρ.
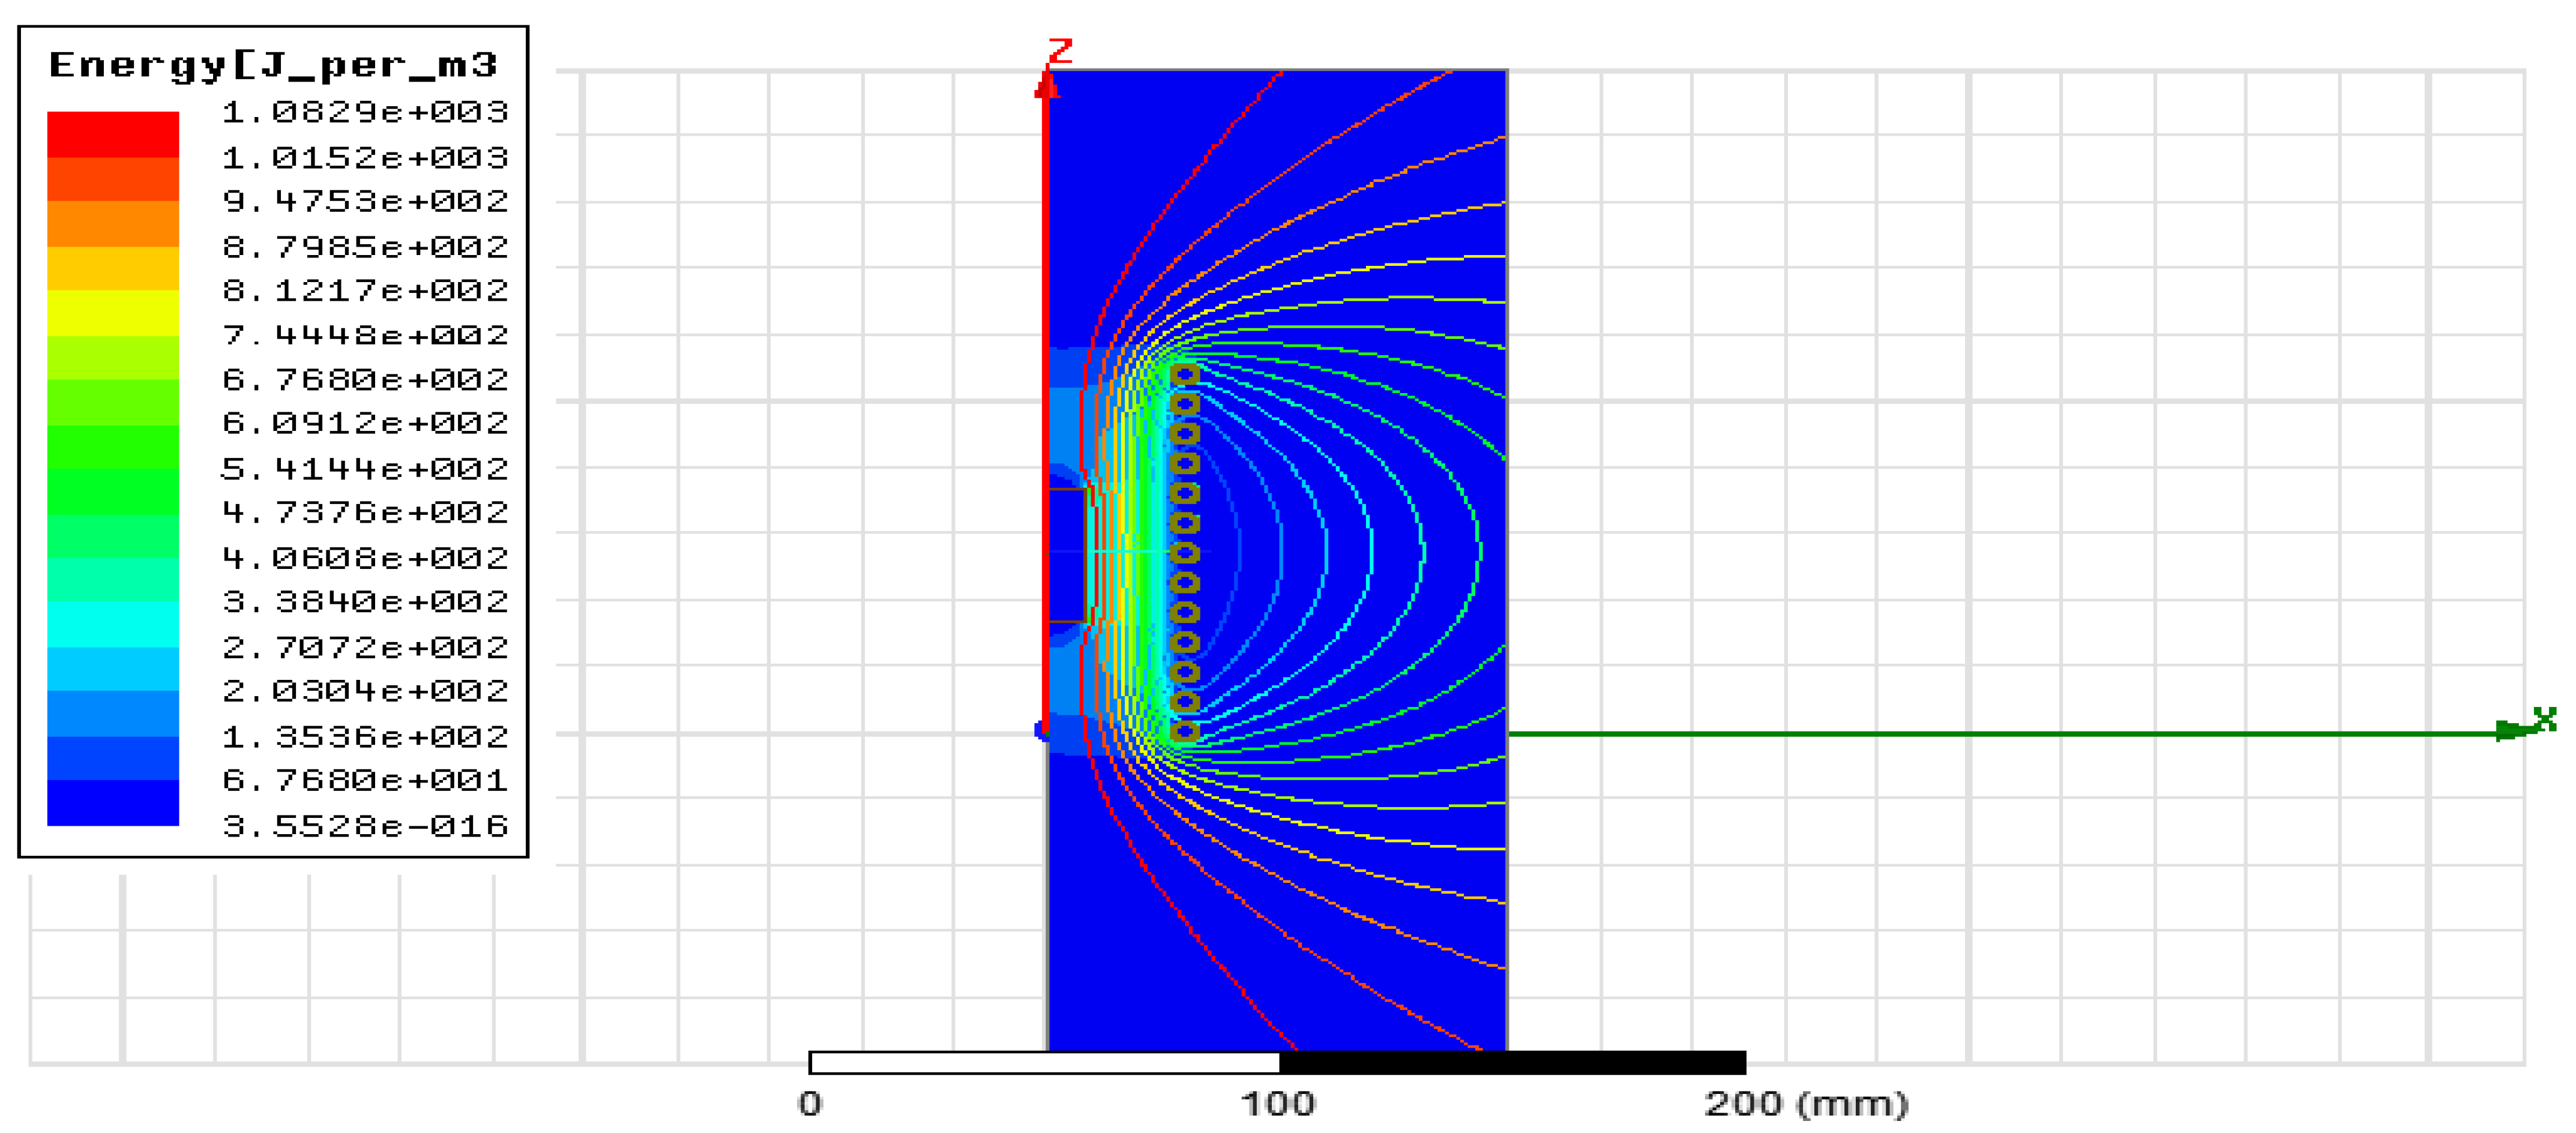
Figure 14 presents the electromagnetic energy density distribution for aluminum scrap, showing a maximum value of 1.08 kJ/m3. Despite a lower peak magnetic field compared to copper, the total energy deposition is higher due to deeper penetration (50–70 mm), resulting in more uniform volumetric heating ideal for large-scale aluminum recycling applications.
Figure 15 confirms that the direction of the current density in the copper scrap is opposite to the direction of the IF current, as well as that the current density of the IF facing the copper scrap is much greater than that of the IF far from the copper scrap. The current density at the copper scrap is concentrated near the surface with a penetration depth ( δ w ) equal to 0.241 mm at 75 kHZ; the skin effect causes higher current density on the surface facing the work coil. On the work coil, current density is higher in the inner surface of the coil turns, which is near the copper scrap. This figure states that, for a specified temperature, when frequency is increasing, the current density is increasing and penetration depth is decreasing; these current densities produce ohmic loss, which is shown in Figure 16.
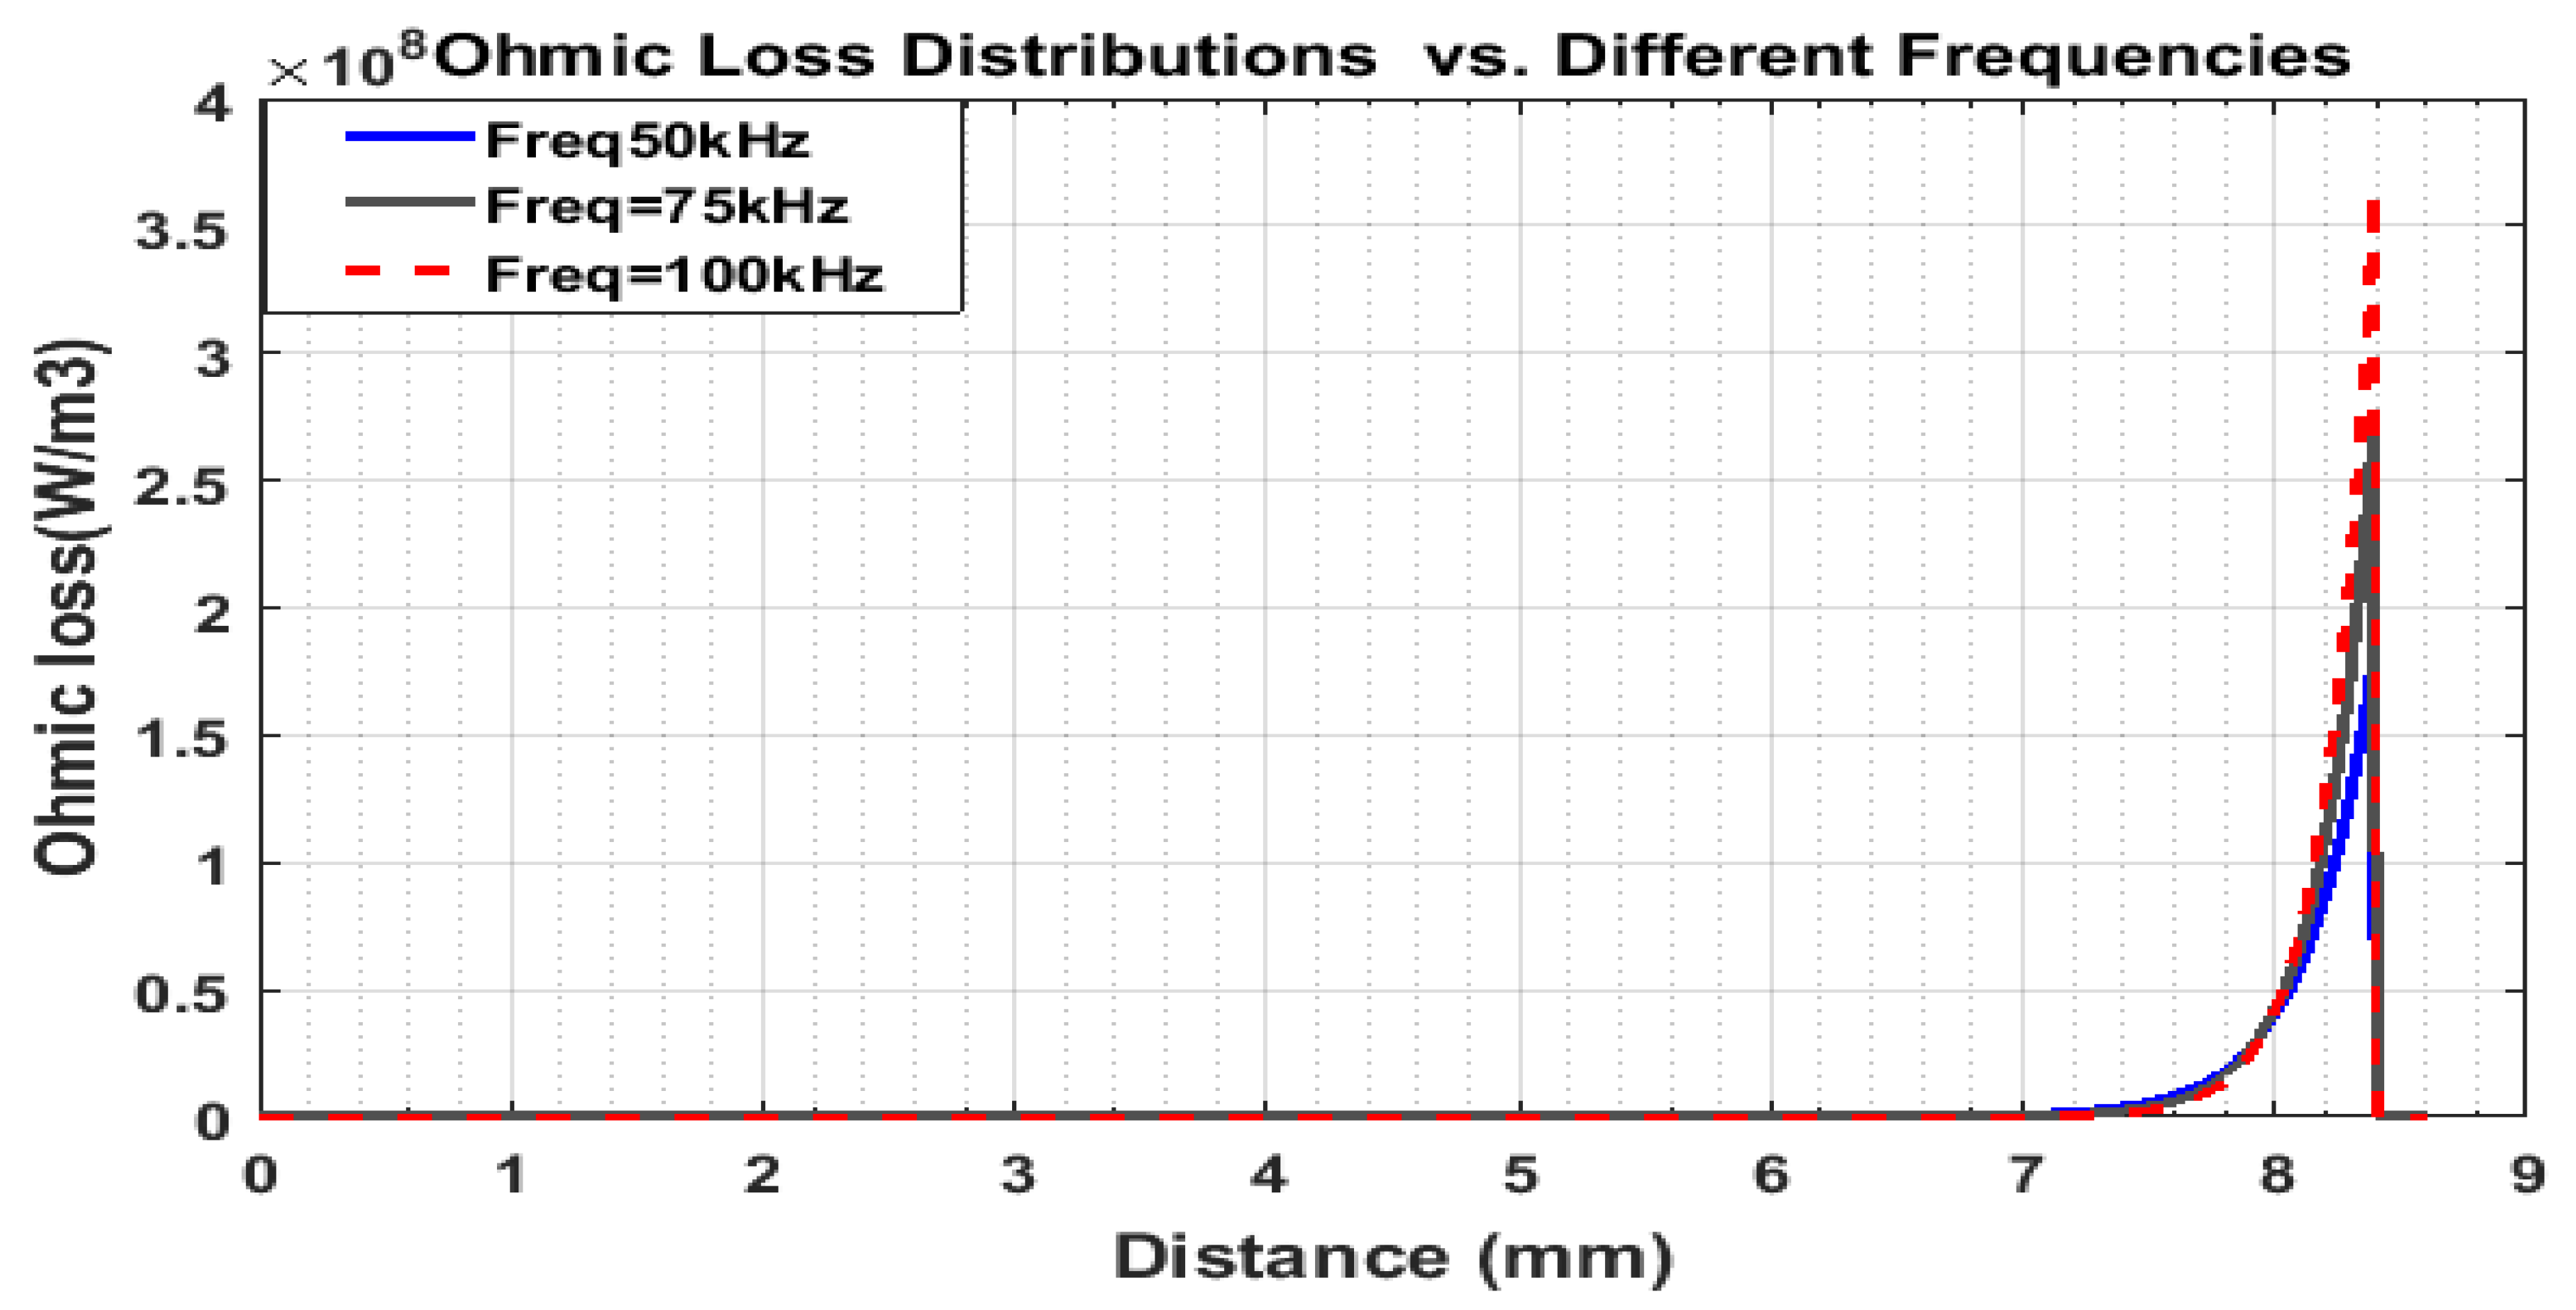
The corresponding ohmic losses at the copper scrap are shown in Figure 17; this loss will be transformed to heat later on the copper scrap.
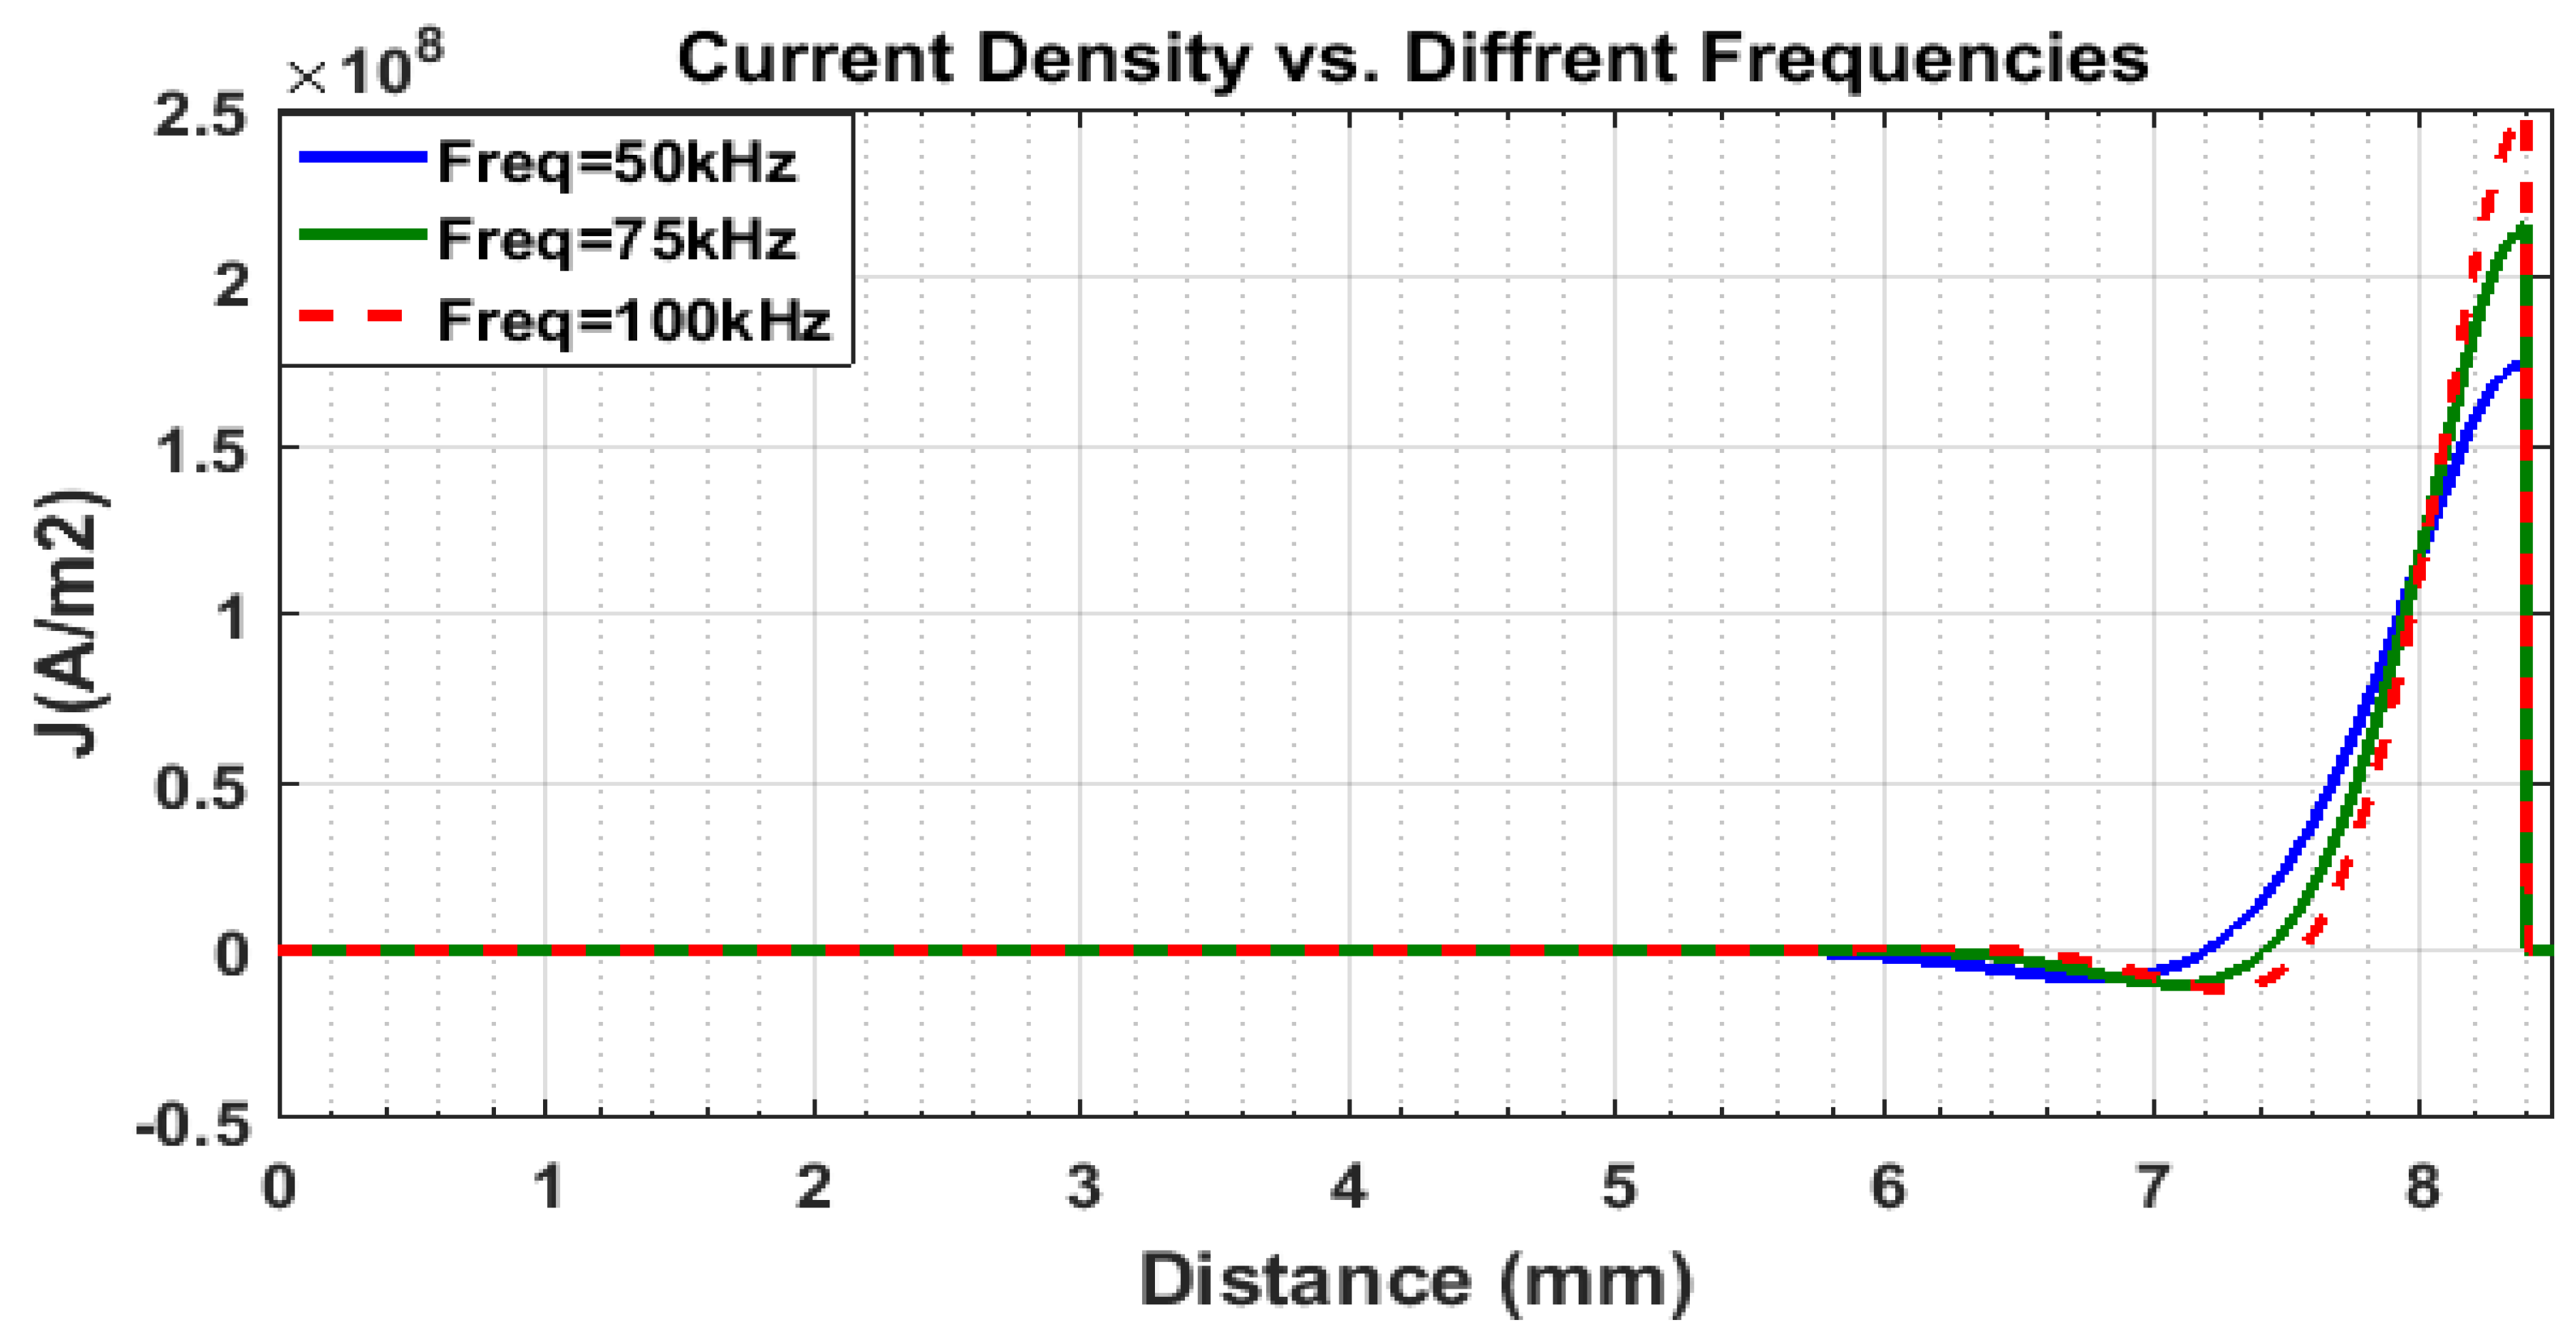
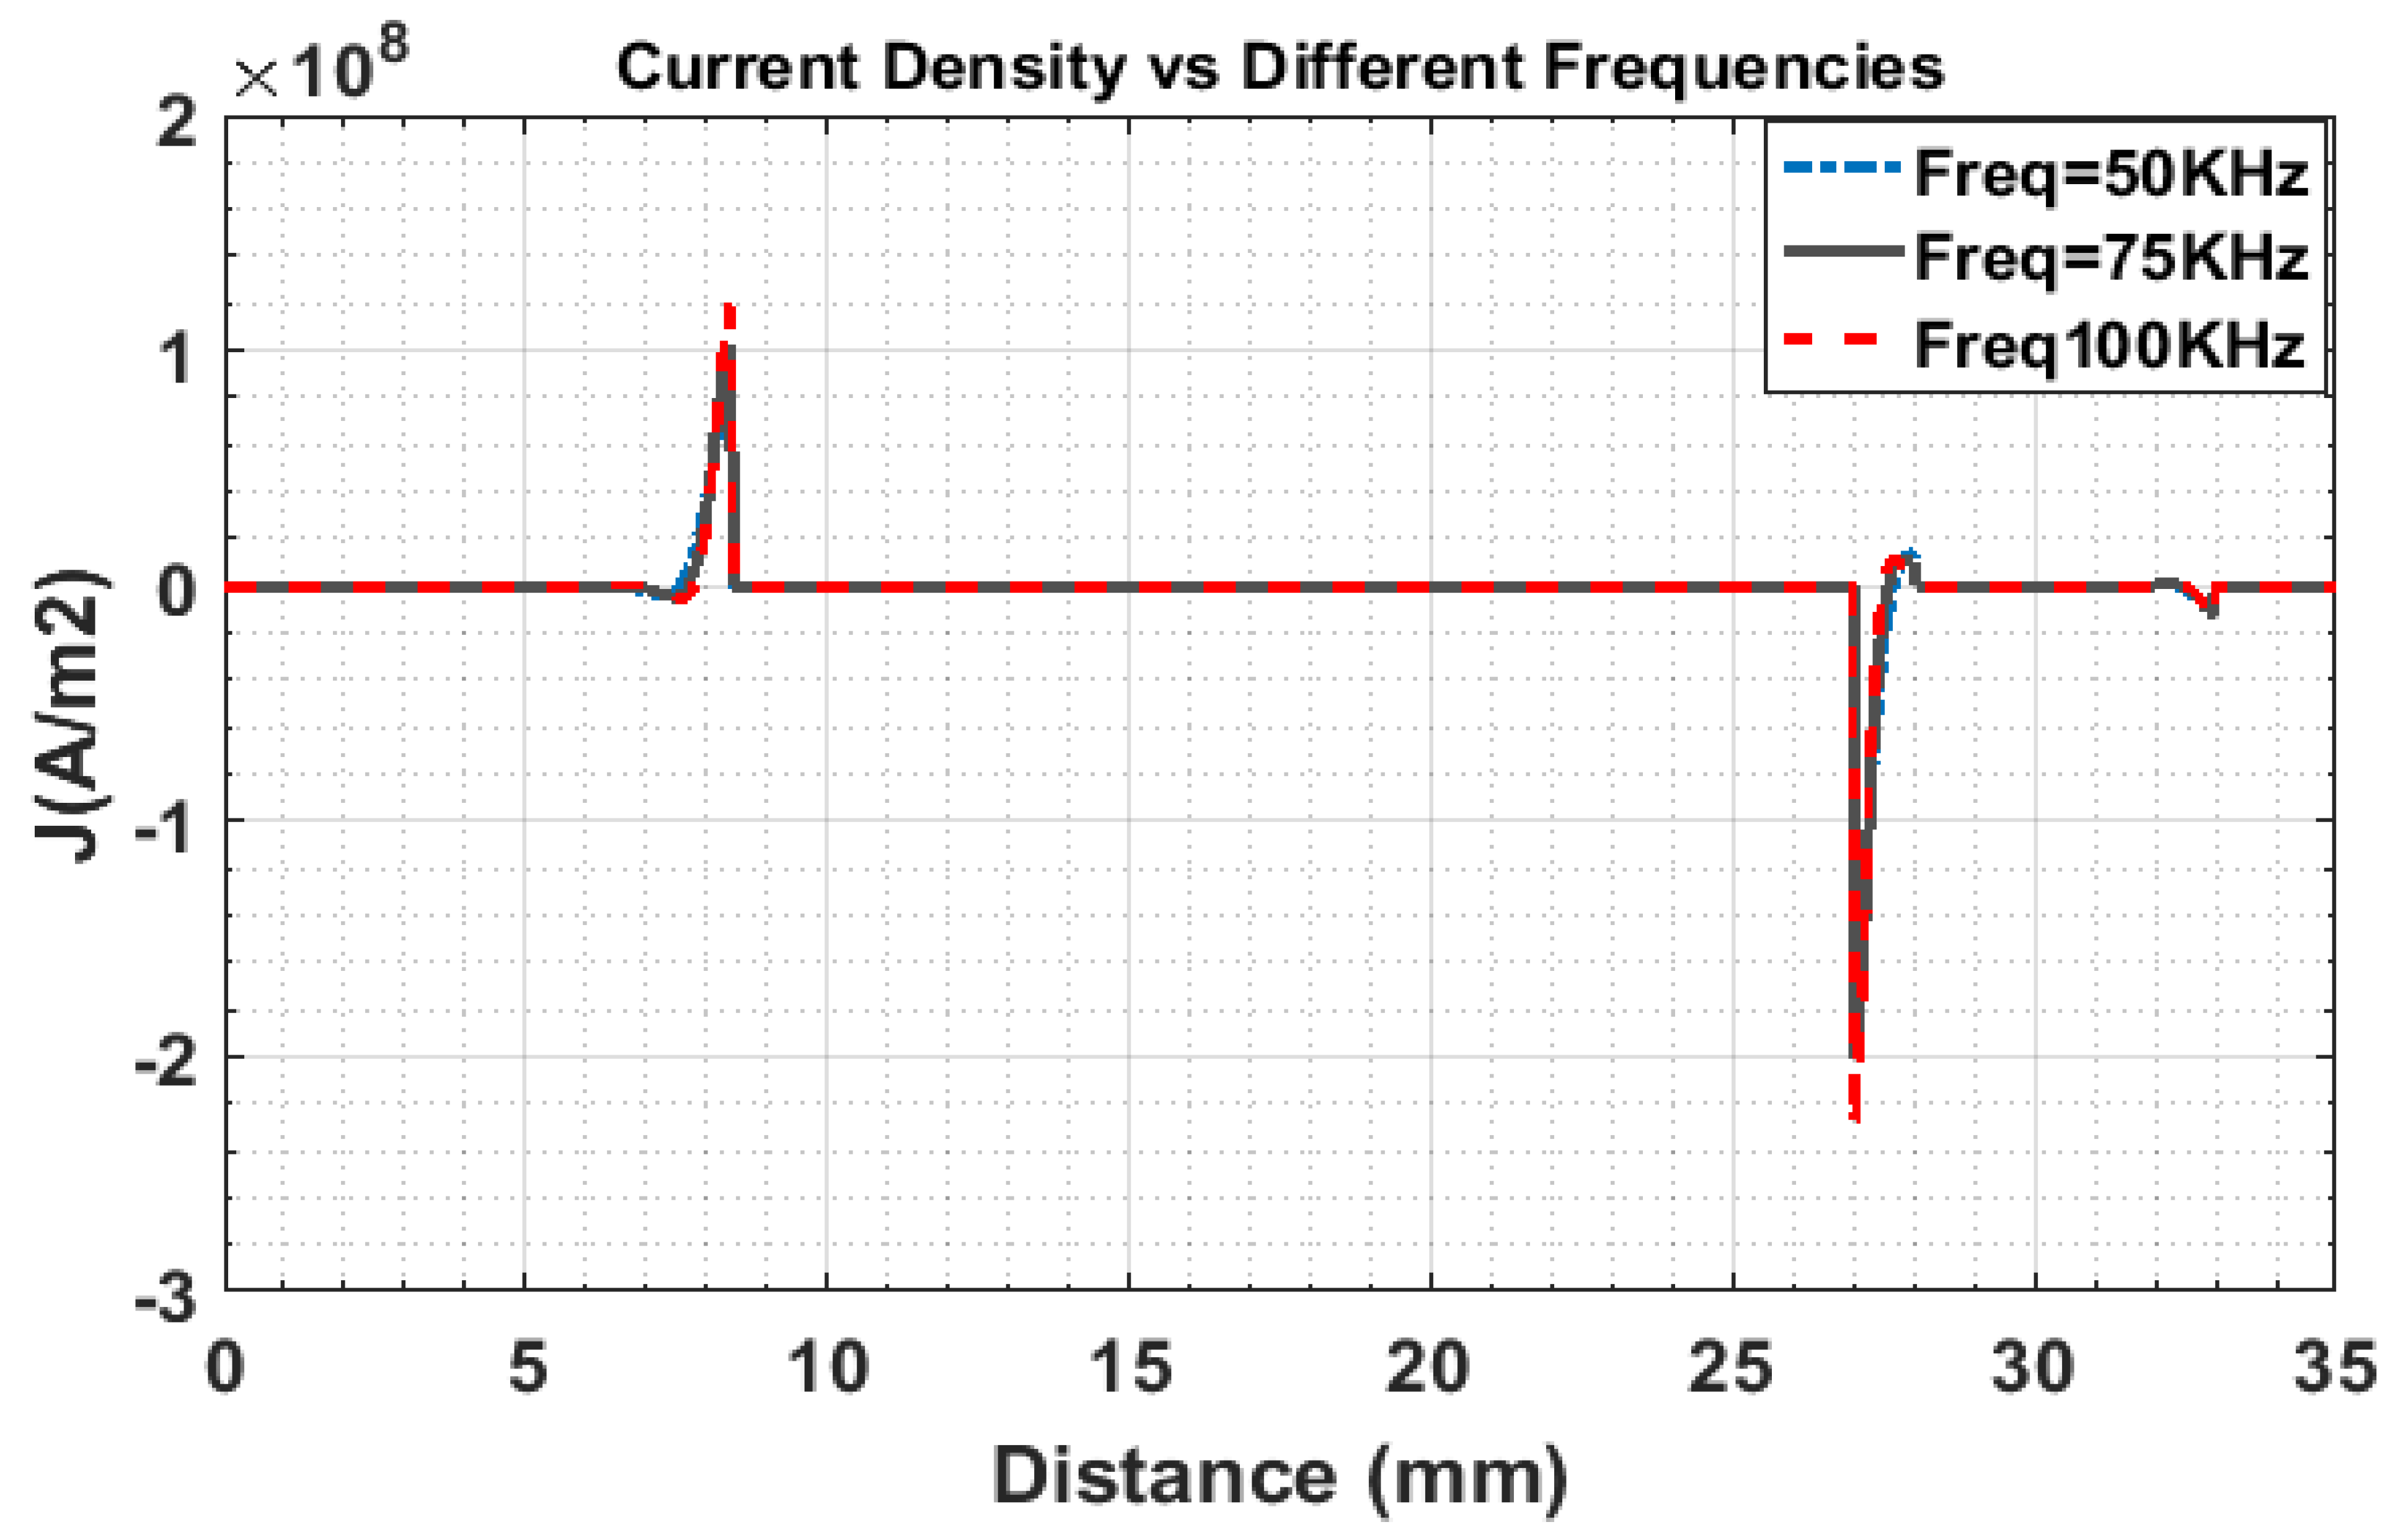
Figure 18 shows the current density distributions along the interface demonstrate a clear frequency-dependent behavior. At 50 kHz, the current penetrates deeper into the copper scrap, resulting in a broader distribution. At 75 kHz, the current begins to concentrate closer to the surface, while at 100 kHz, a strong surface concentration is observed due to the pronounced skin effect. This highlights the influence of excitation frequency on the depth and intensity of current flow within the material.
As copper approaches its melting point of 1084 °C, its resistivity increases gradually; during the phase transition from solid to liquid, there is a sharp jump in resistivity, as shown in Figure 19.
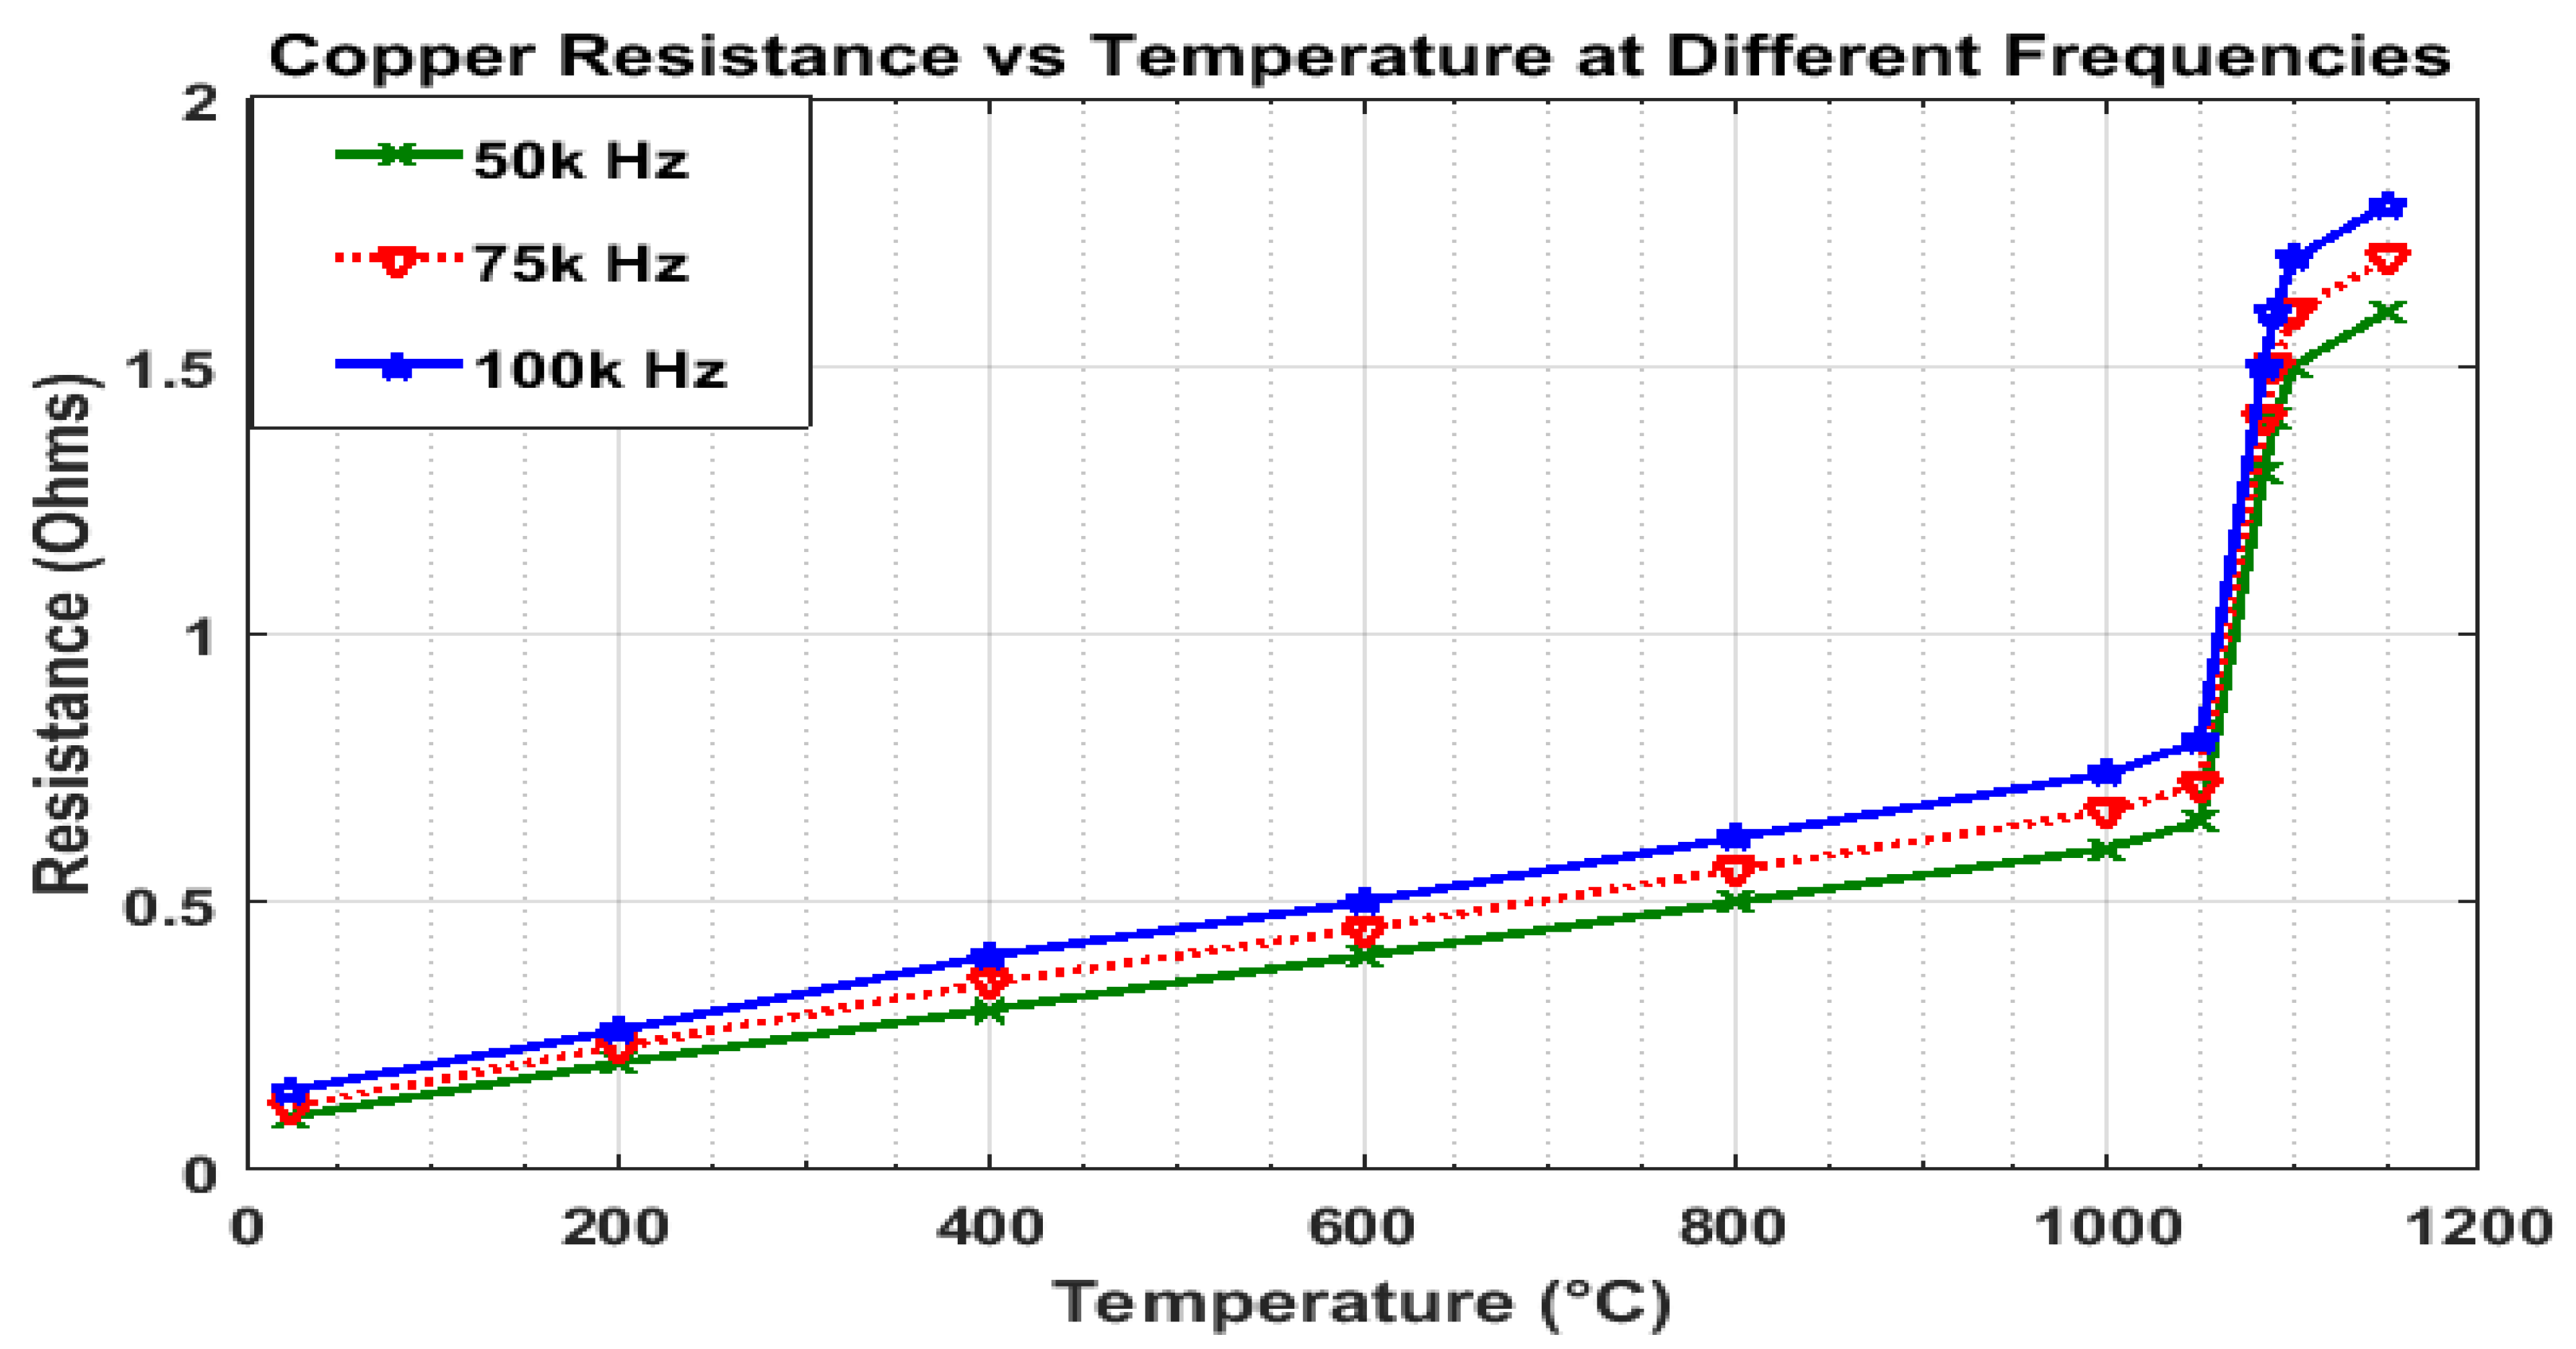
Figure 20 shows the relationship between copper resistivity and temperature during the melting process under a current of 300 A at three different frequencies (50 kHz, 75 kHz, and 100 kHz); the curves demonstrate the significant resistivity increase that occurs at the melting point (1085 °C), where resistivity approximately doubles as copper transitions from solid to liquid state. The frequency dependence is clearly visible, with higher frequencies (100 kHz) exhibiting greater effective resistivity throughout the temperature range due to enhanced skin effect. This effect becomes more pronounced in the liquid phase, where electron scattering mechanisms differ from the solid state. The pre-melting region shows a near-linear relationship between resistivity and temperature for all frequencies, while the post-melting region displays a different slope, highlighting the fundamental changes in electron transport properties between phases.
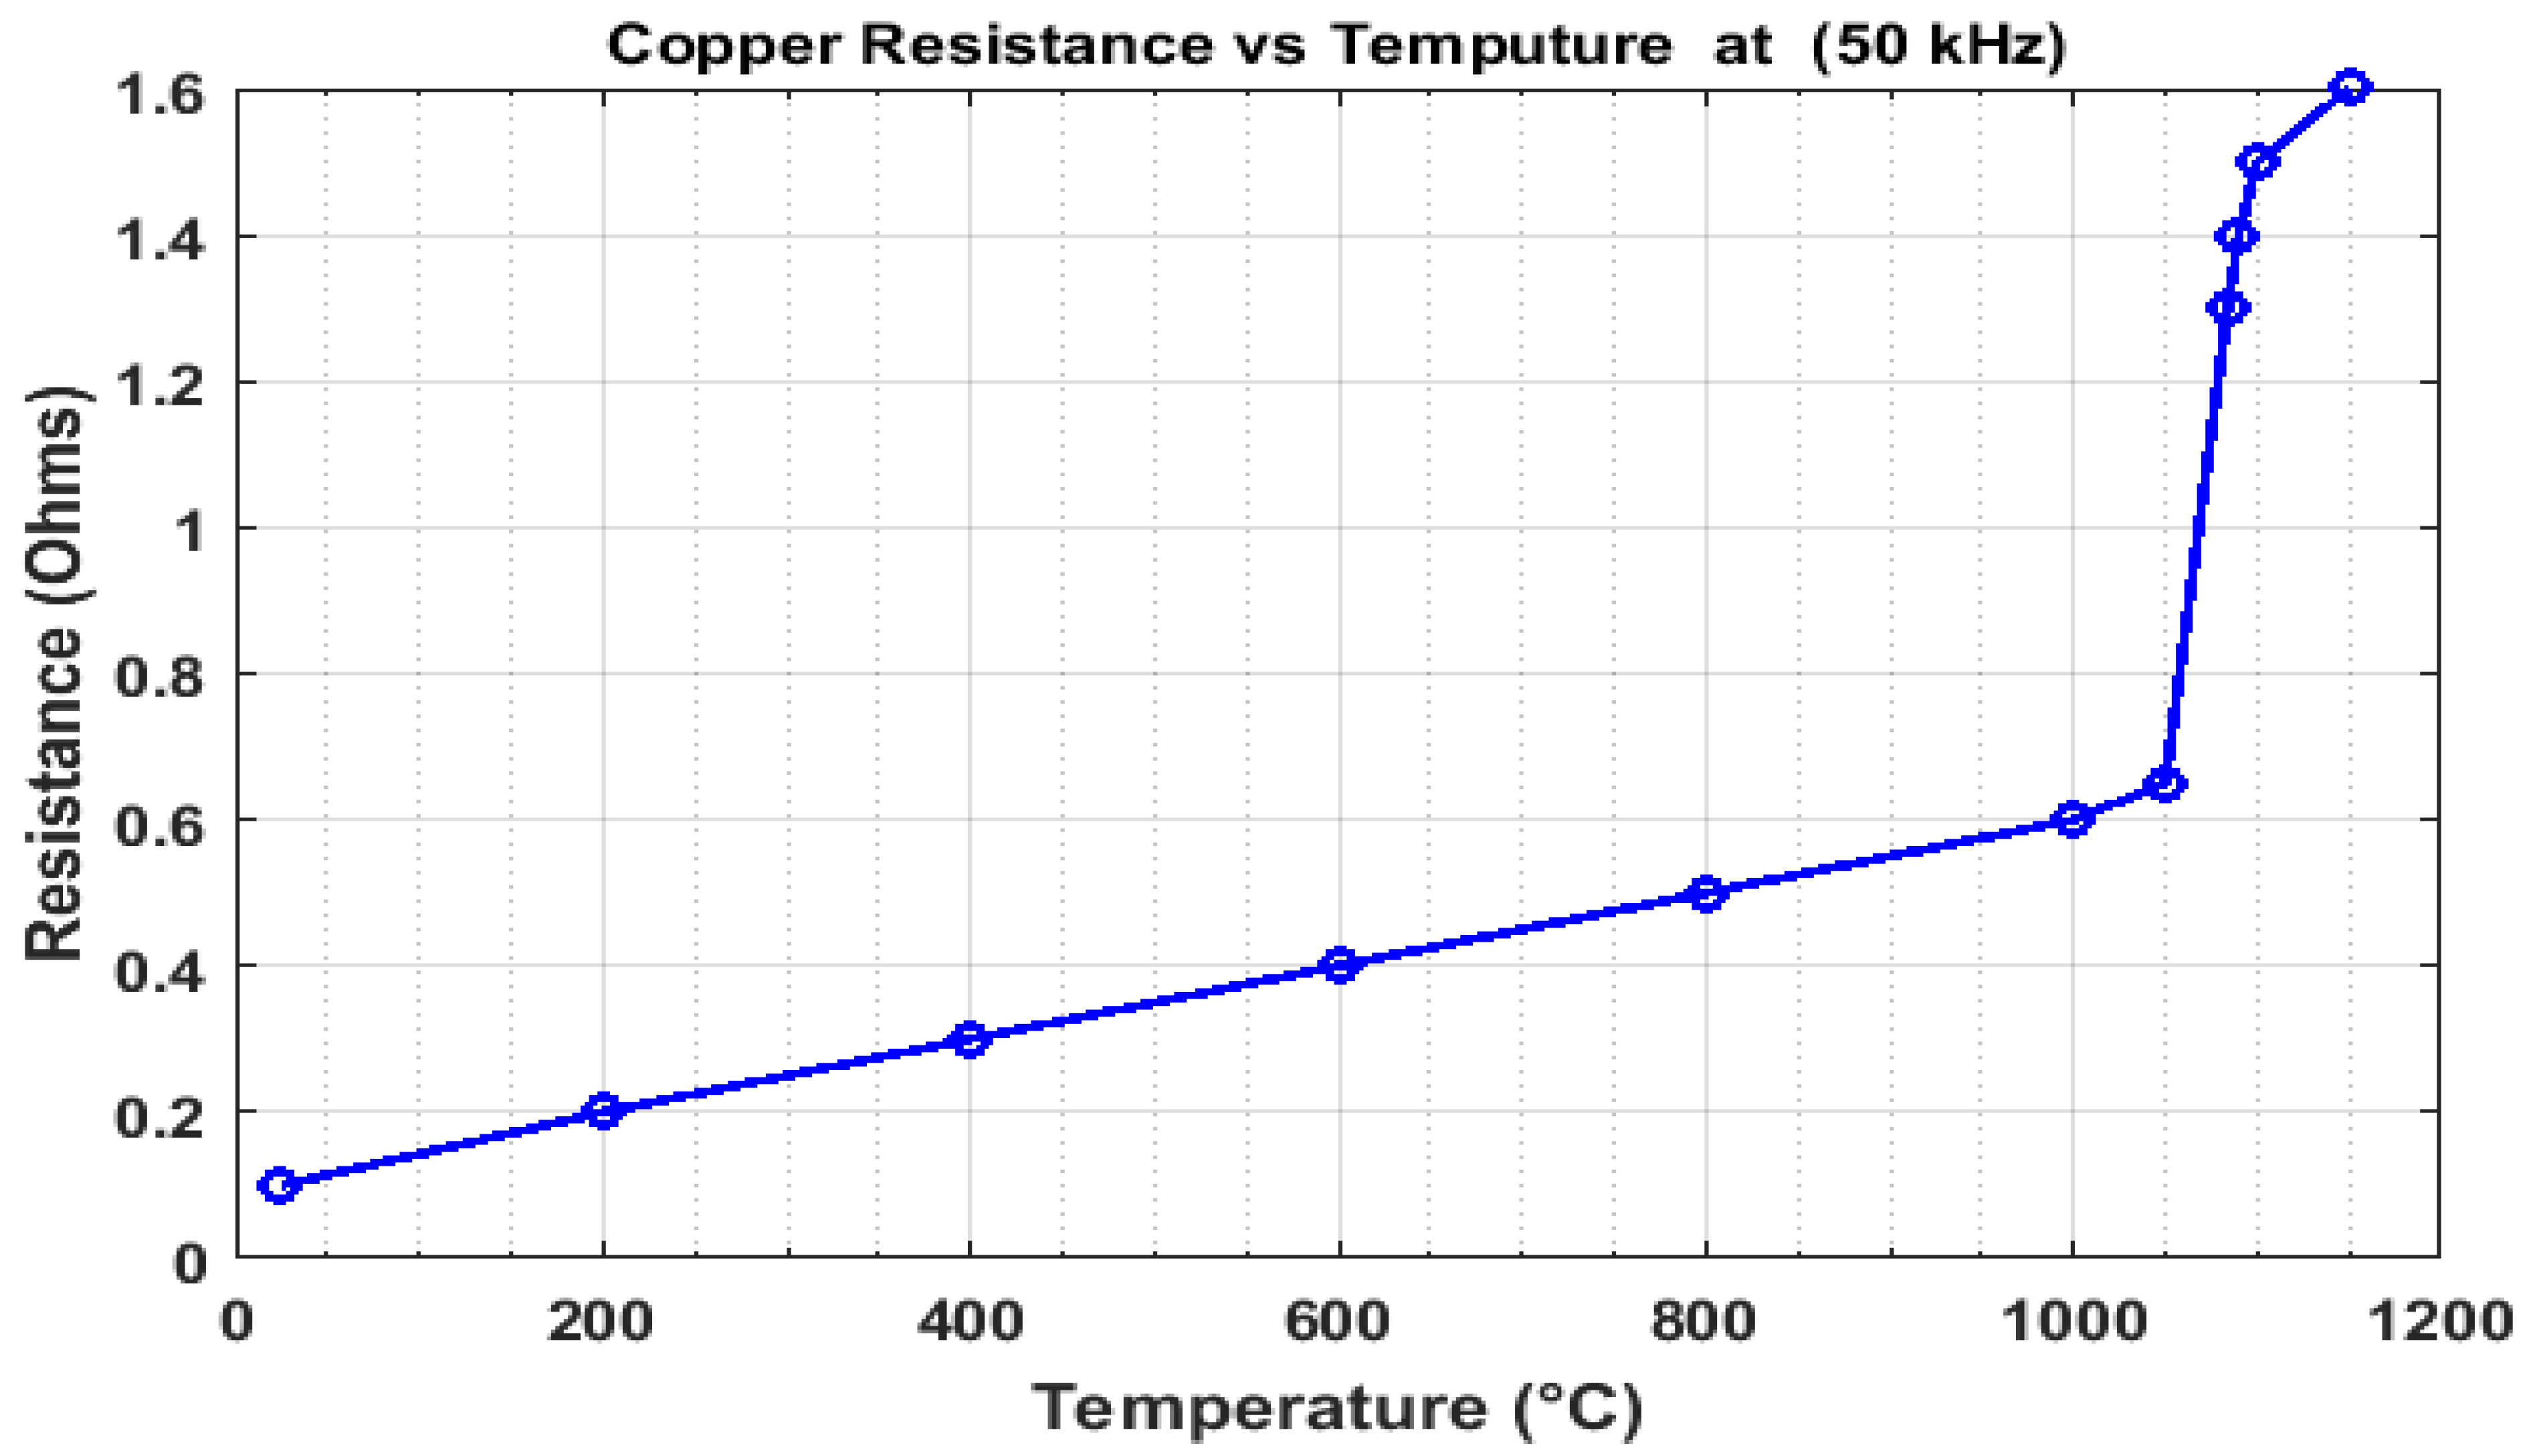
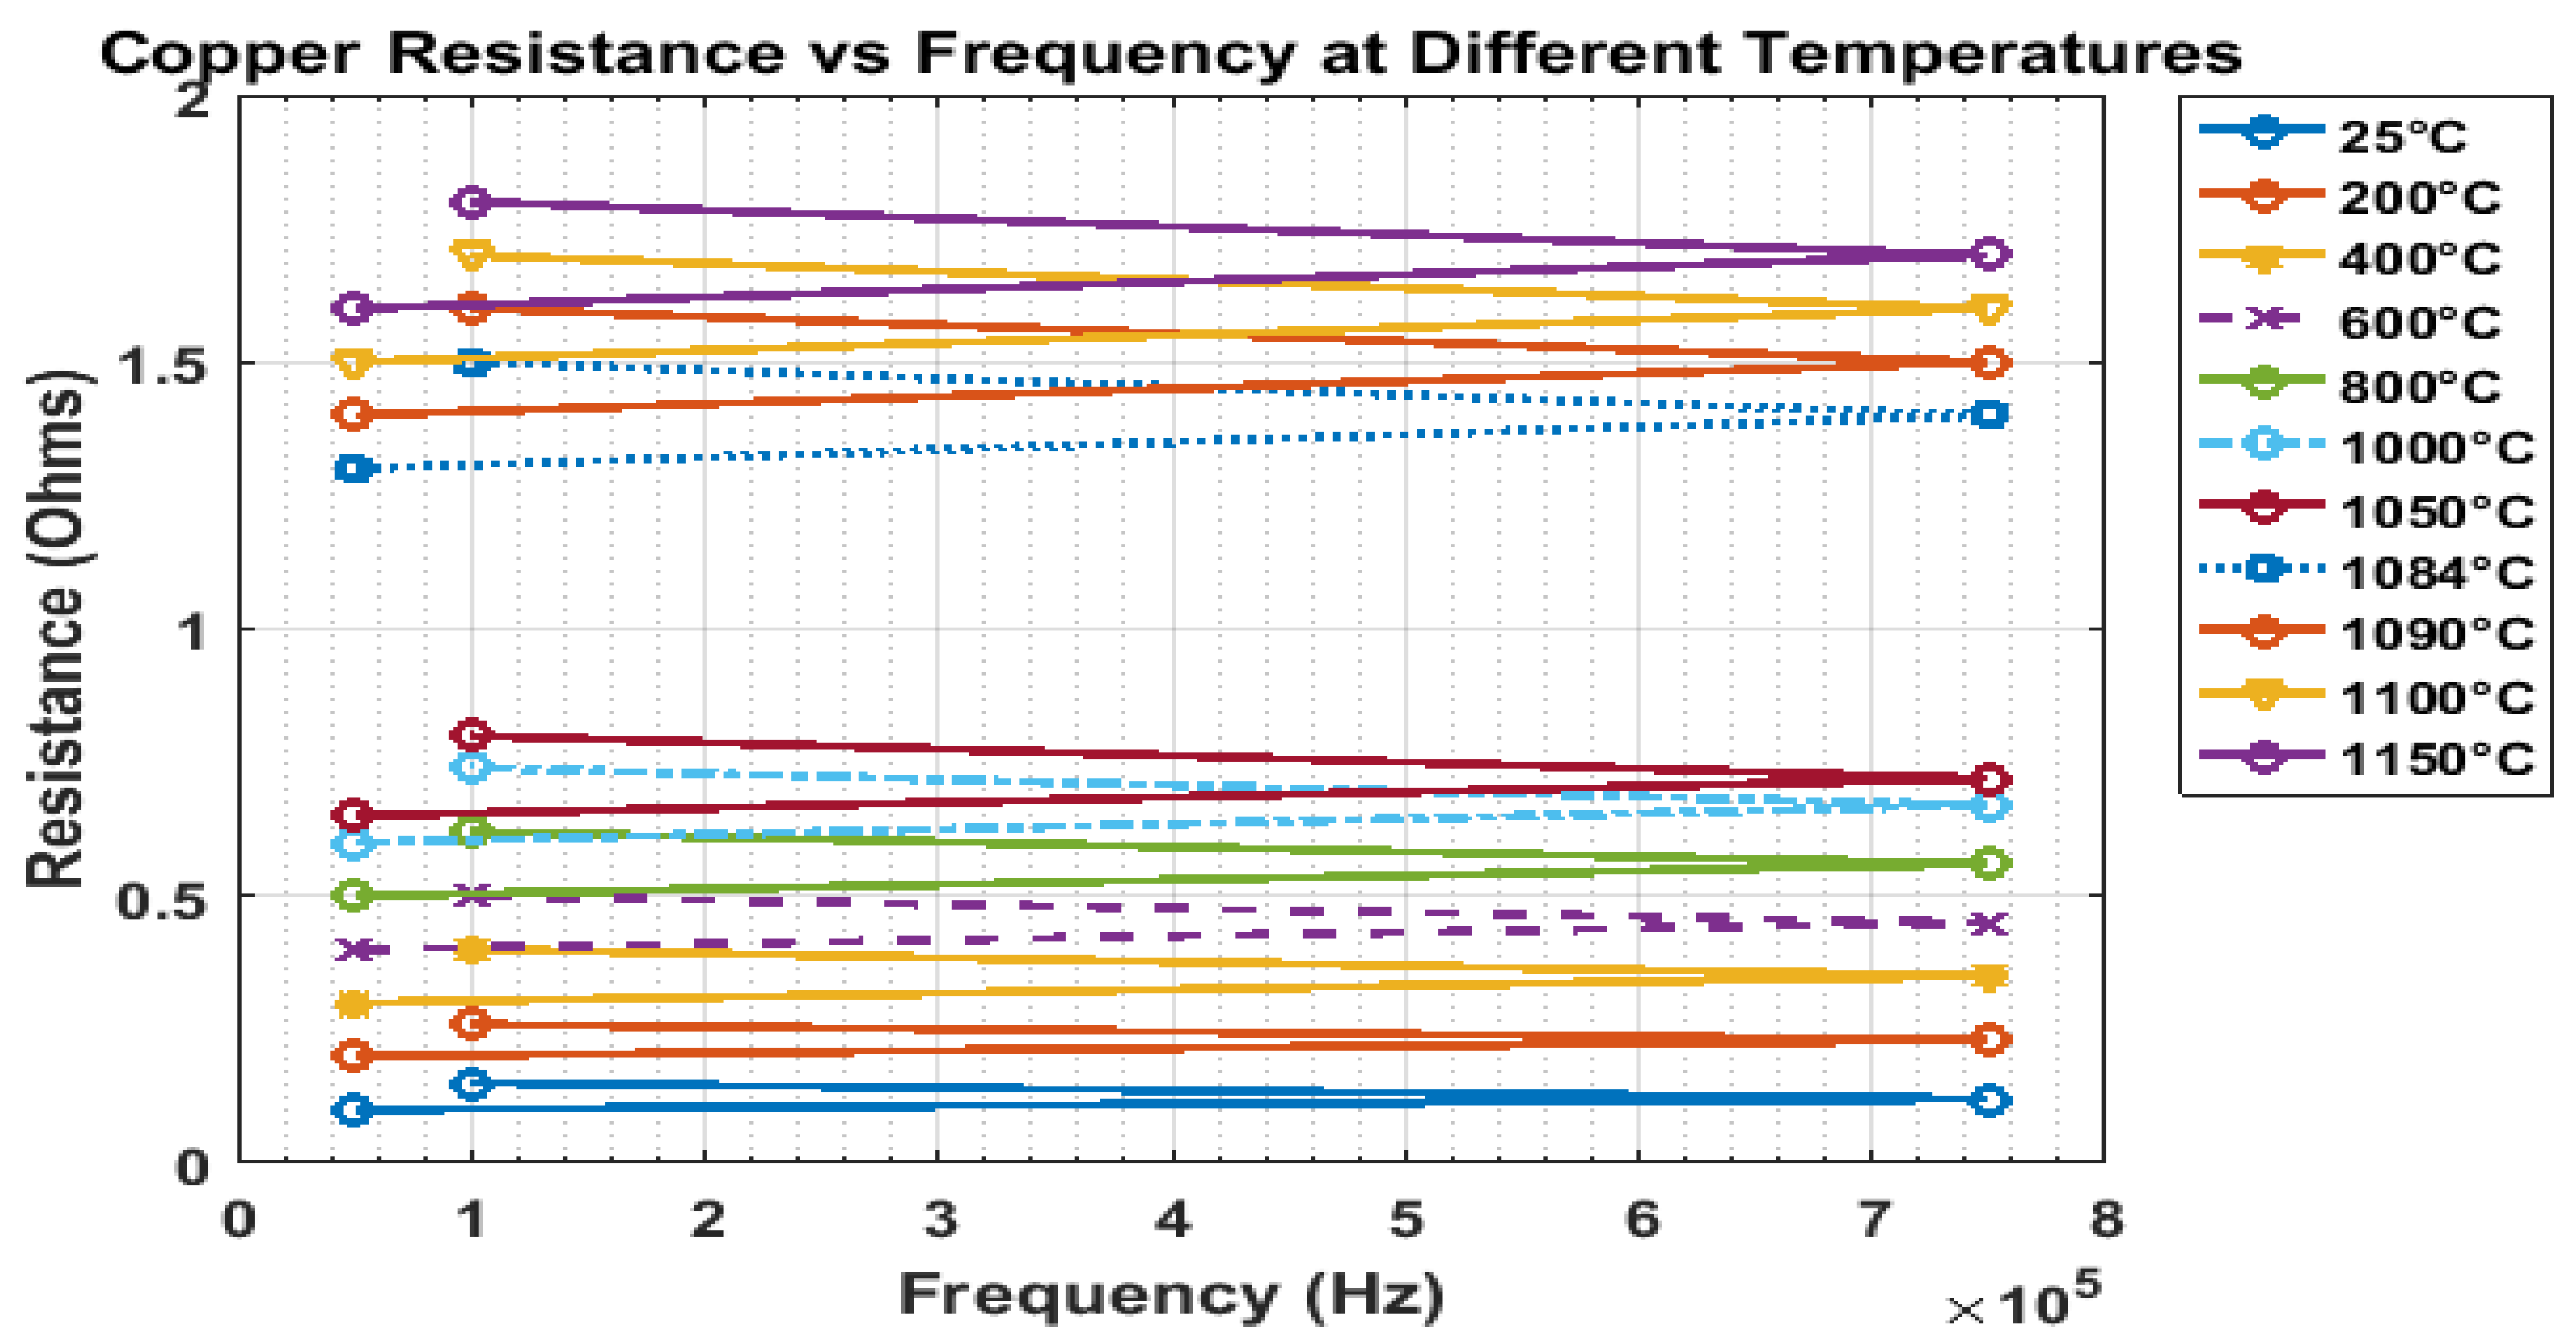
Figure 21 demonstrates the relationship between copper resistance and frequency at various temperatures. It is evident that temperature has a significant influence on copper’s electrical resistance, with resistance values increasing as temperature rises. At 25 °C, the resistance starts at approximately 0.2 ohms and gradually increases to nearly 1.8 ohms at 1150 °C. Despite the wide range of frequencies analyzed (up to 800 kHz), the resistance curves remain relatively flat, indicating minimal frequency dependence. Notably, a sharp increase in resistance is observed around and beyond the melting point of copper (1084 °C), reflecting enhanced electron scattering due to thermal agitation.
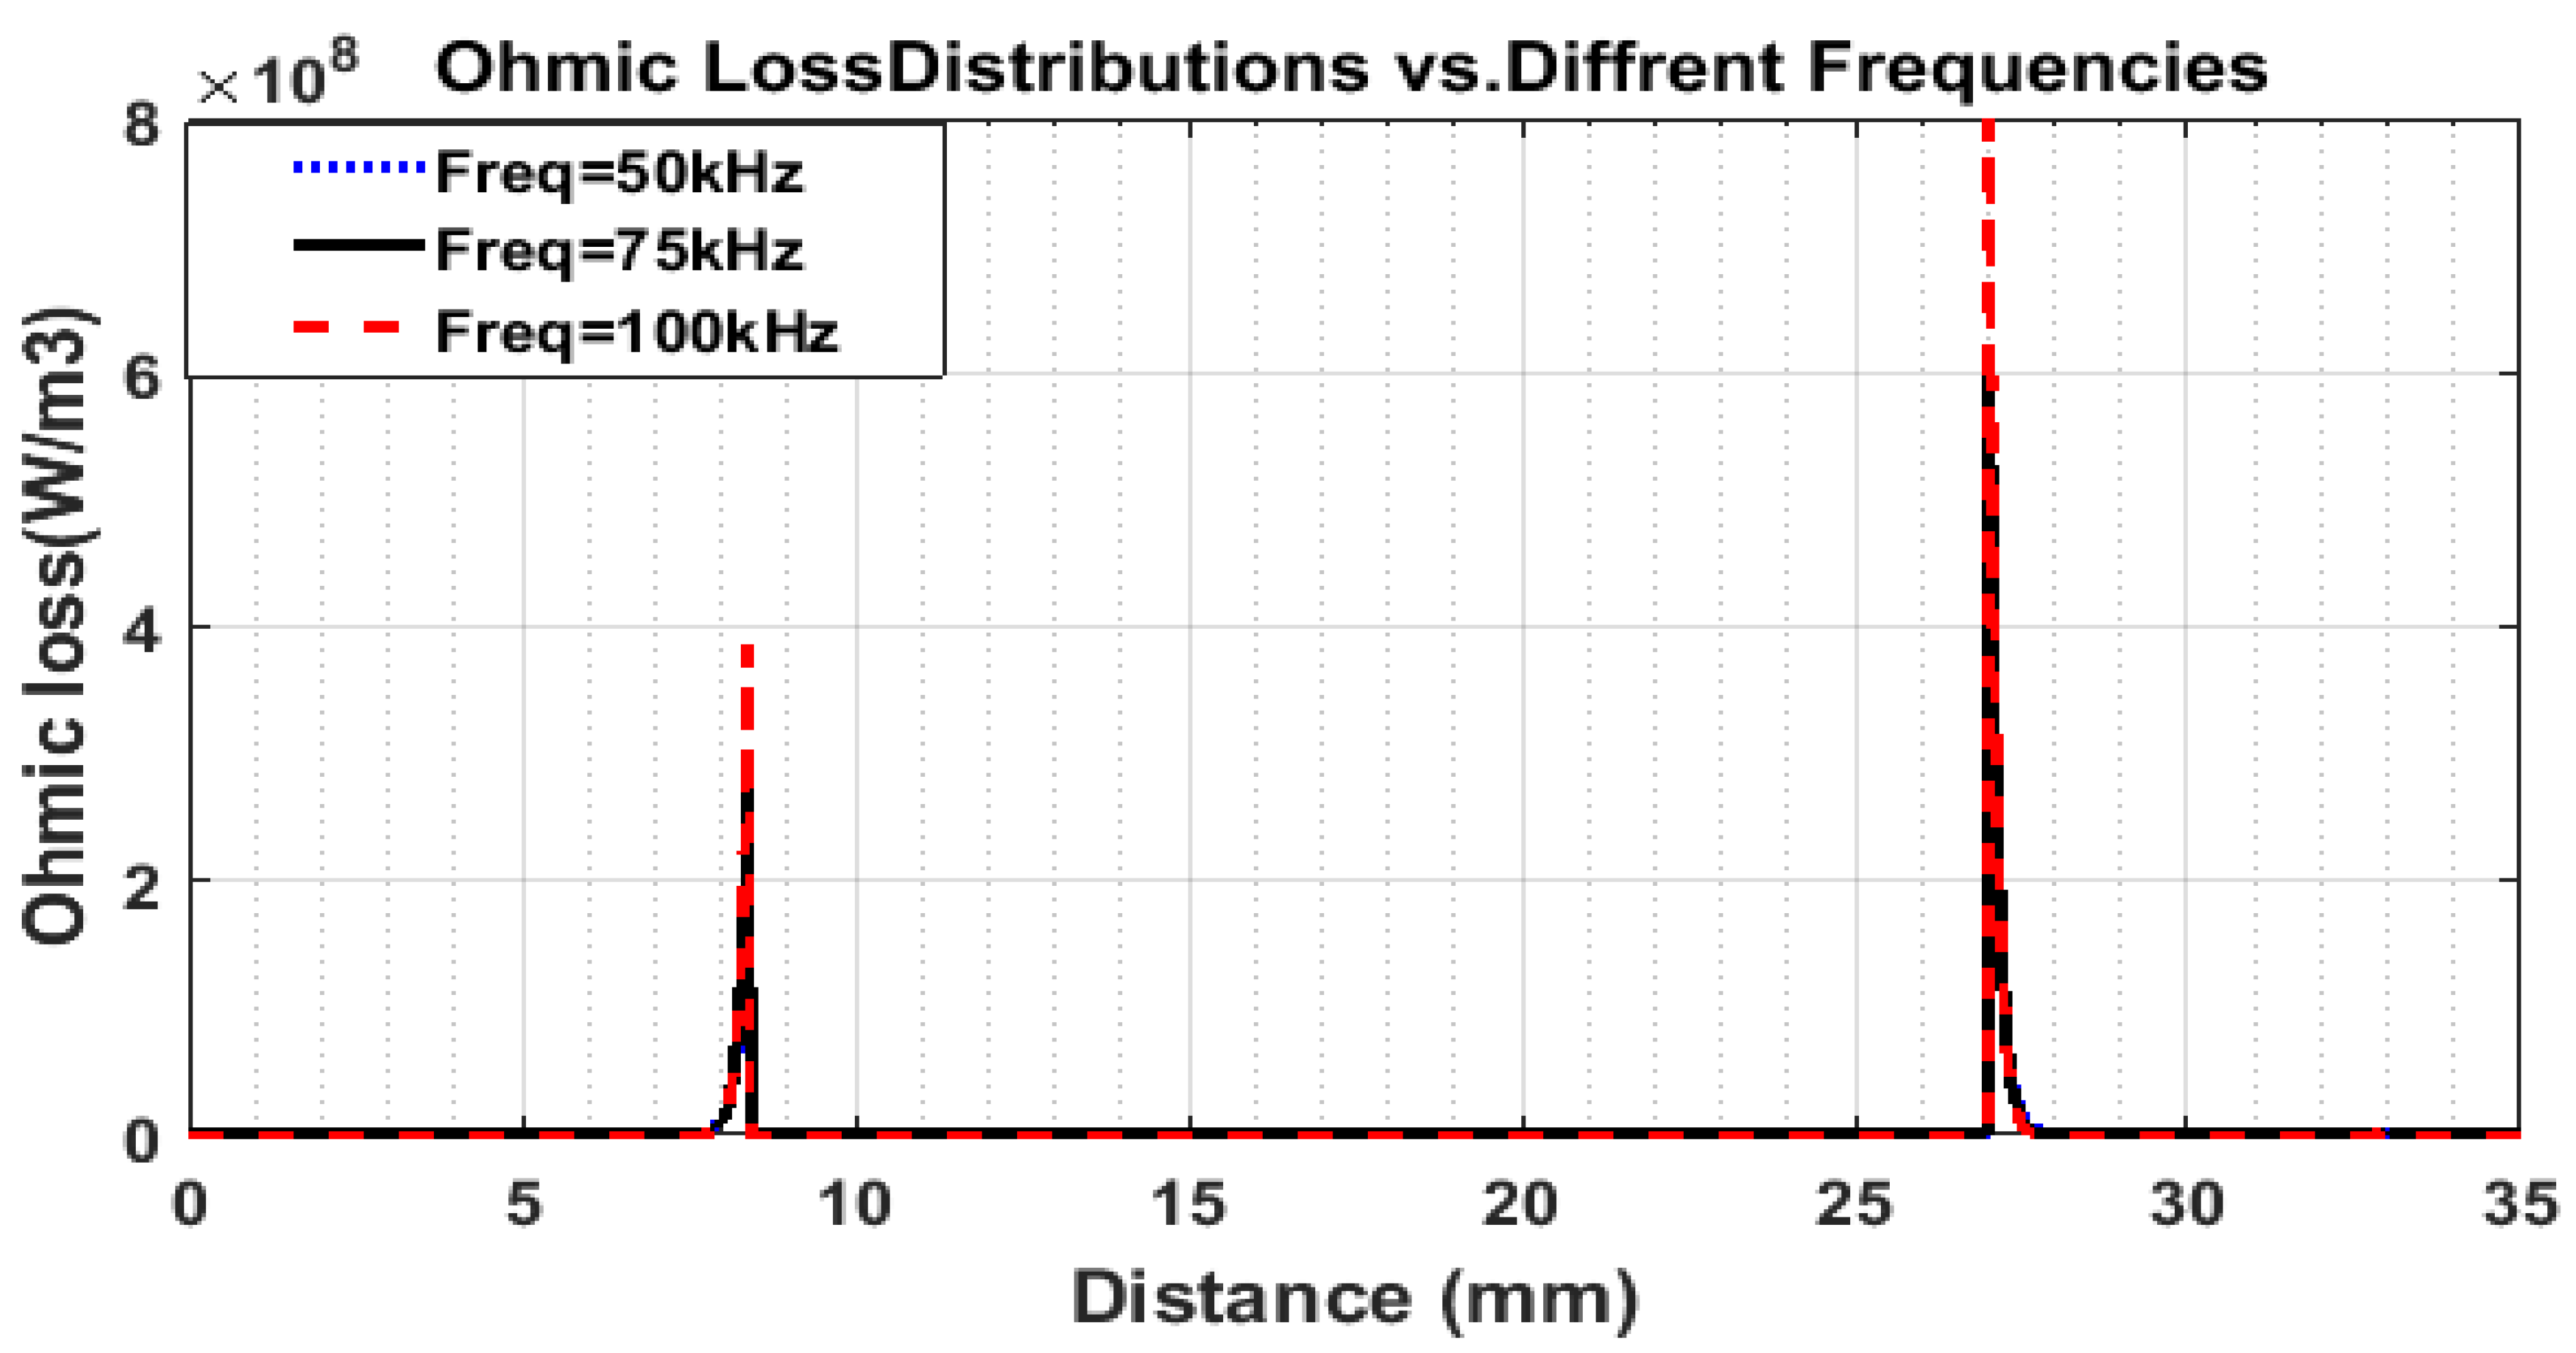
Figure 22 confirms that the direction of the current density in the aluminum scrap is opposite to the direction of the IF current, as well as that the current density of the IF facing the aluminum scrap is much greater than that of the IF far from the aluminum scrap. The current density at the aluminum scrap is concentrated near the surface with a penetration depth ( δ w ) equal to 0.309 mm at 75 KHZ. These current densities produce ohmic loss shown in Figure 22 and Figure 23.
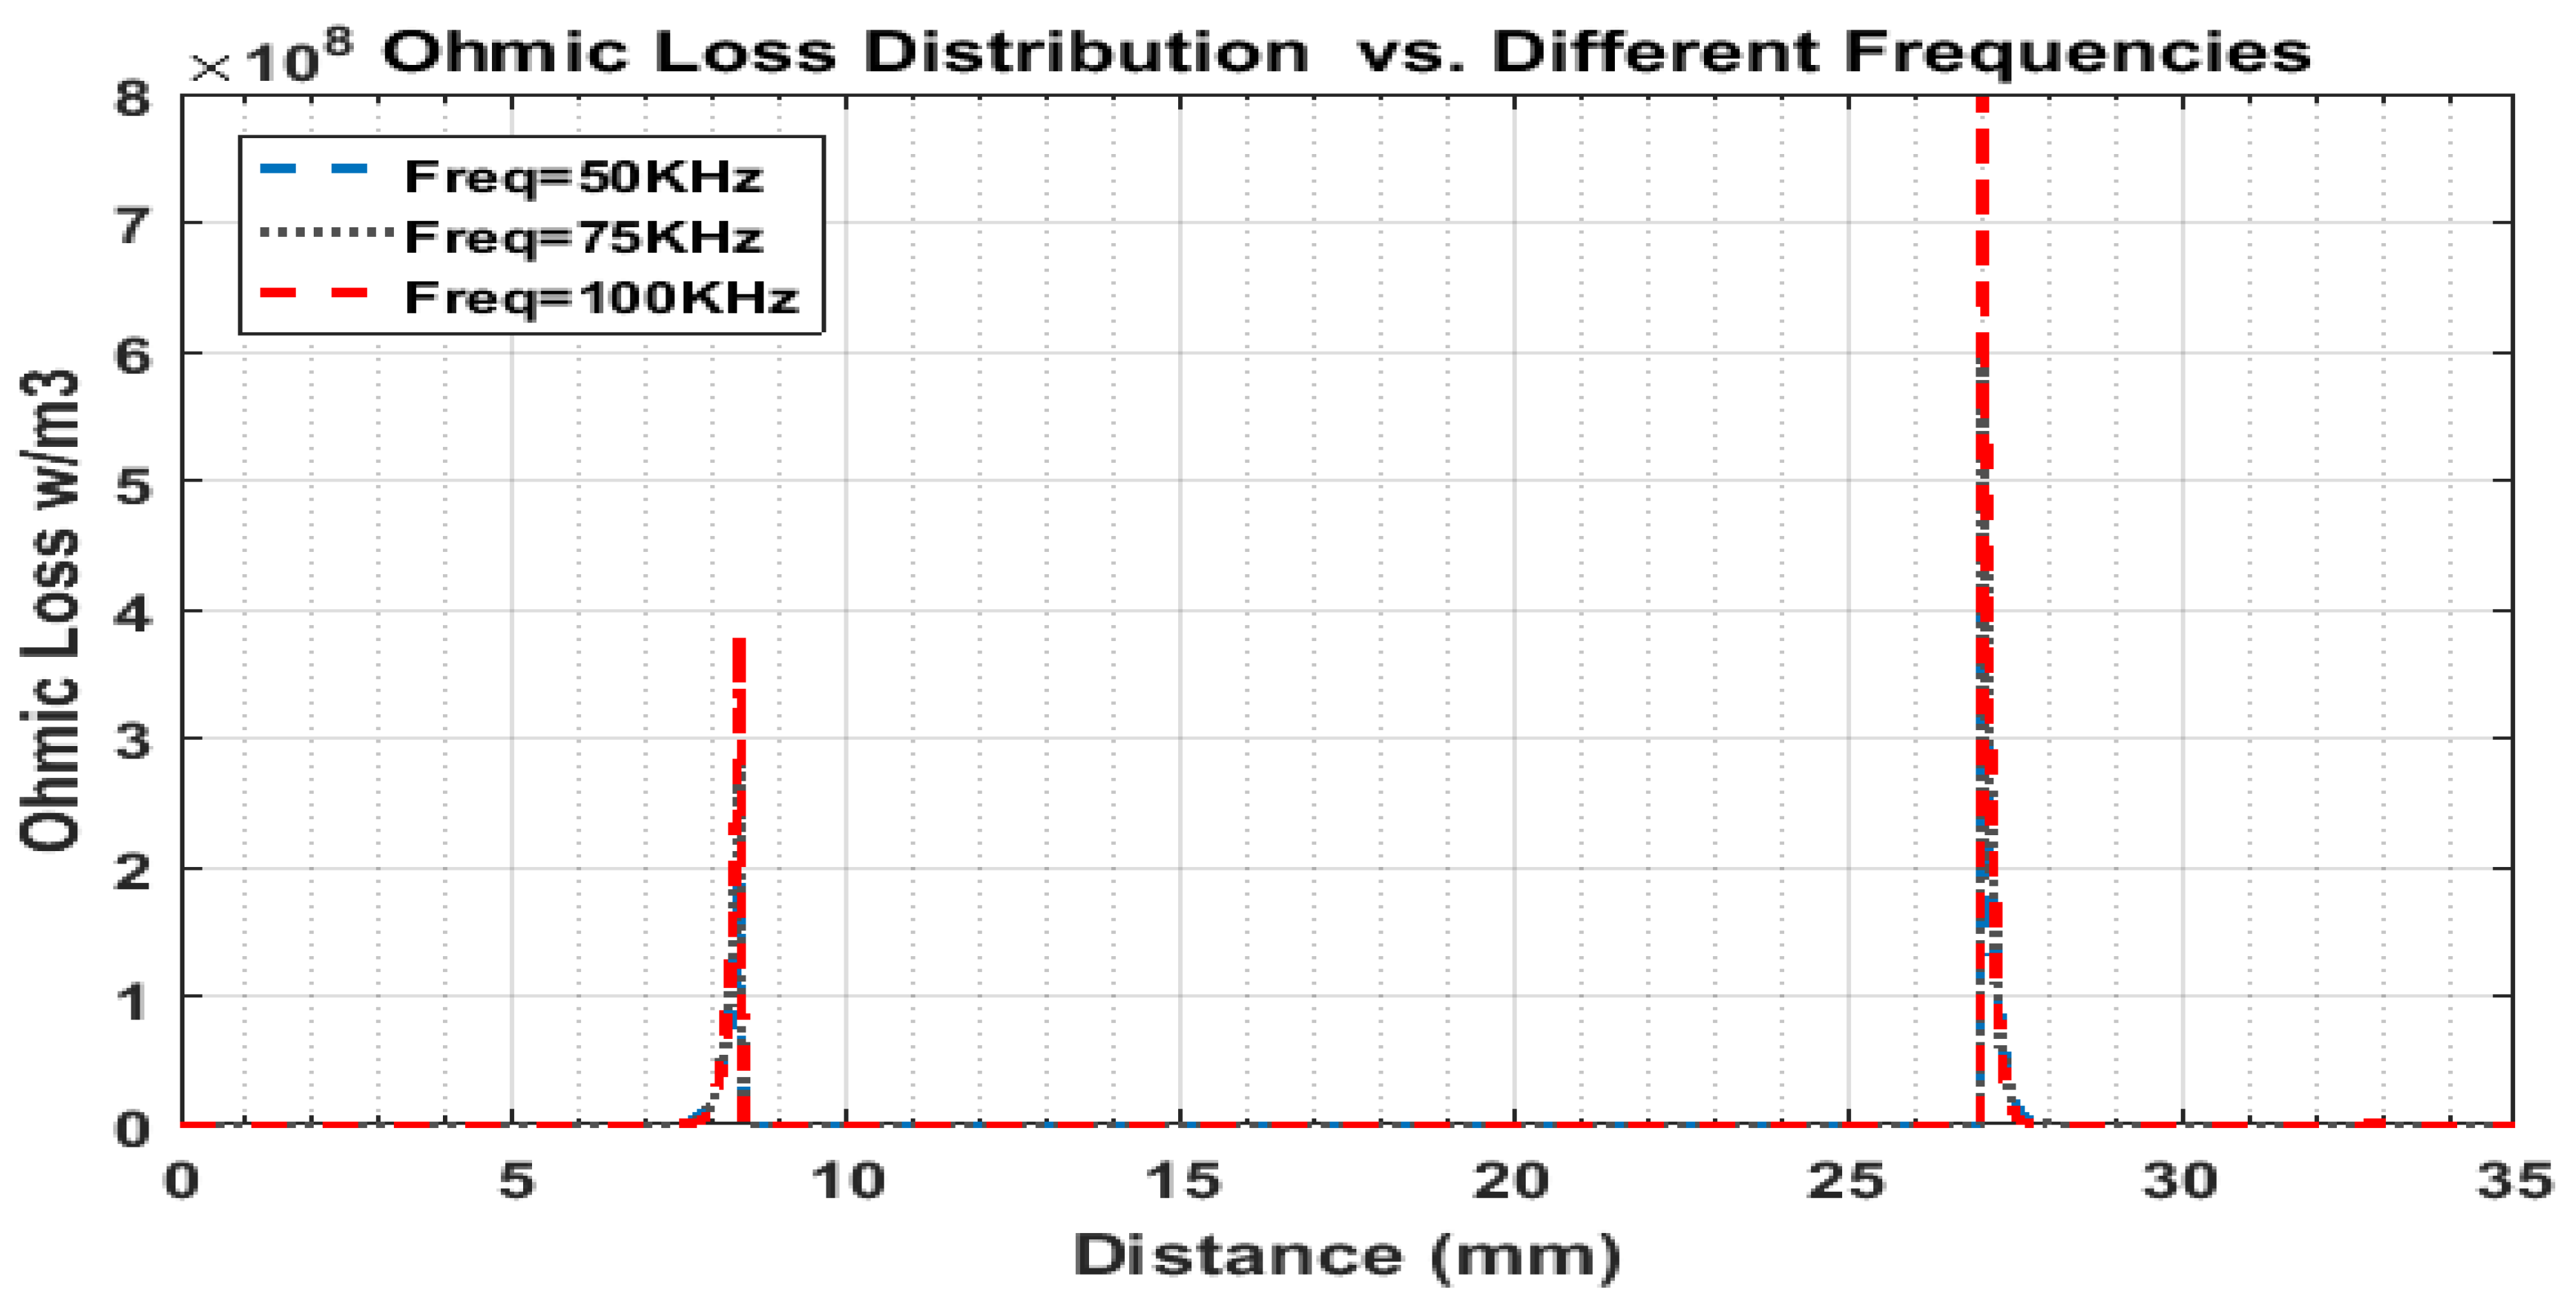
Figure 23 demonstrates the plotted distribution of ohmic losses along IF; aluminum scrap at varying excitation frequencies (50, 75, and 100 kHz) highlights the significant influence of frequency on loss concentration. Peaks around 10 mm and 28–29 mm reveal localized current paths likely governed by conductive boundaries. As frequency increases, loss intensity escalates sharply due to enhanced skin and proximity effects, reaching over 8 × 10⁸ W/m3 at 100 kHz. This behavior underscores the need for optimized conductor geometry and effective thermal management in high-frequency electromagnetic systems.
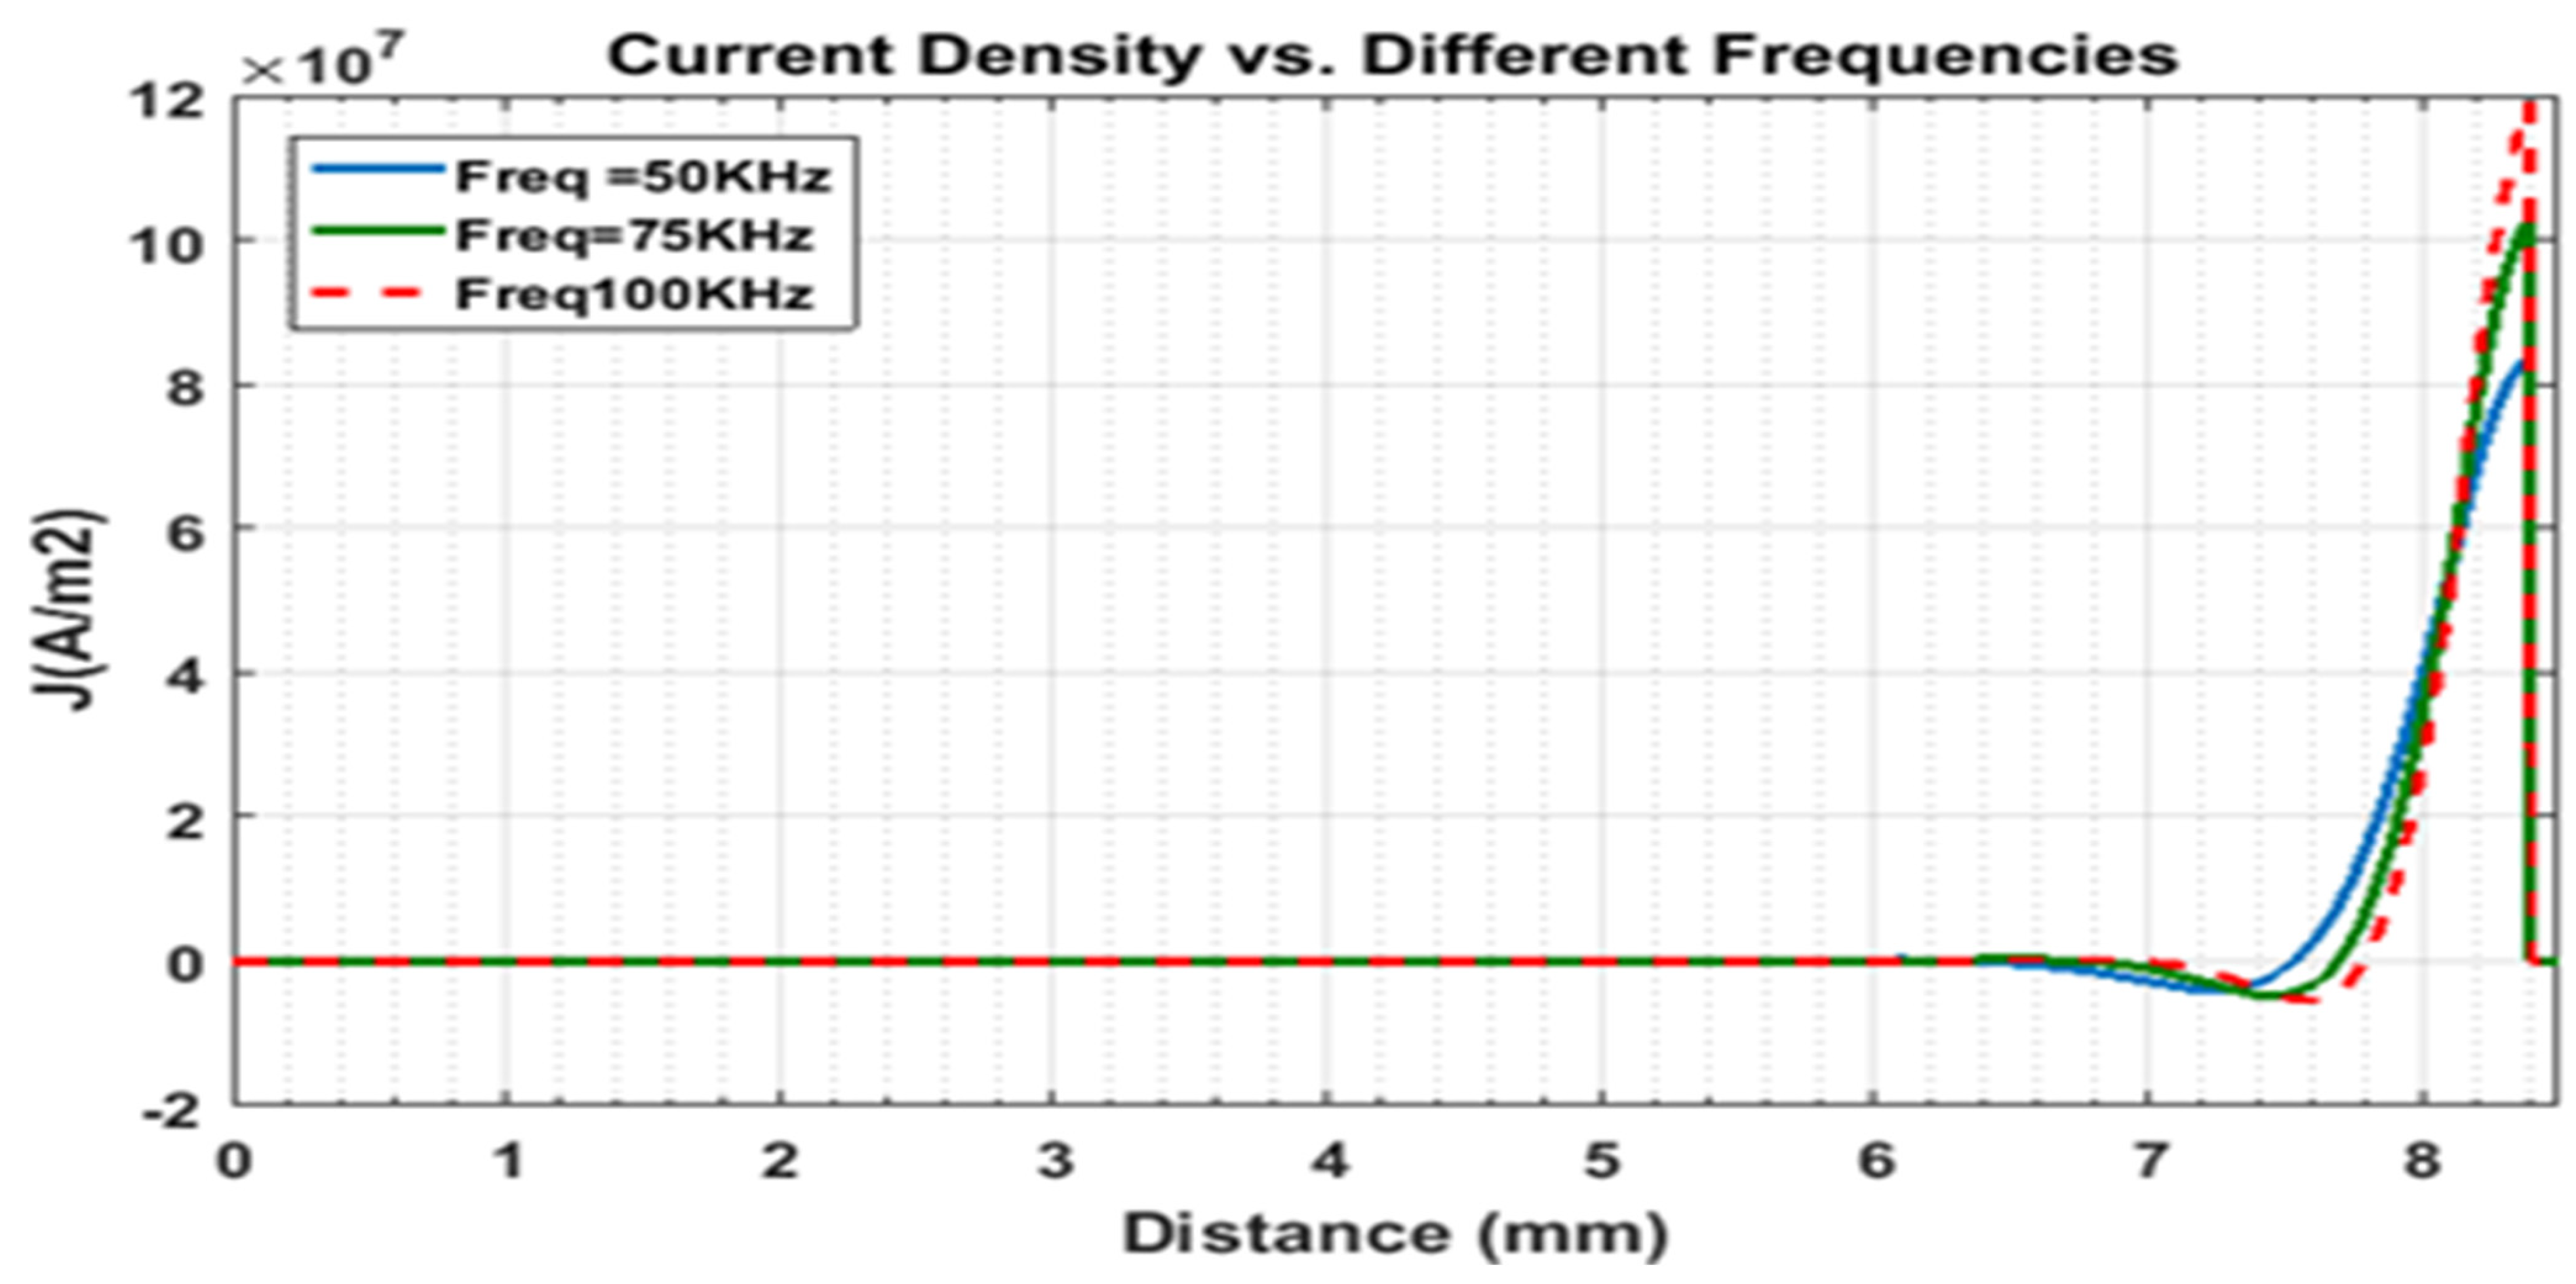
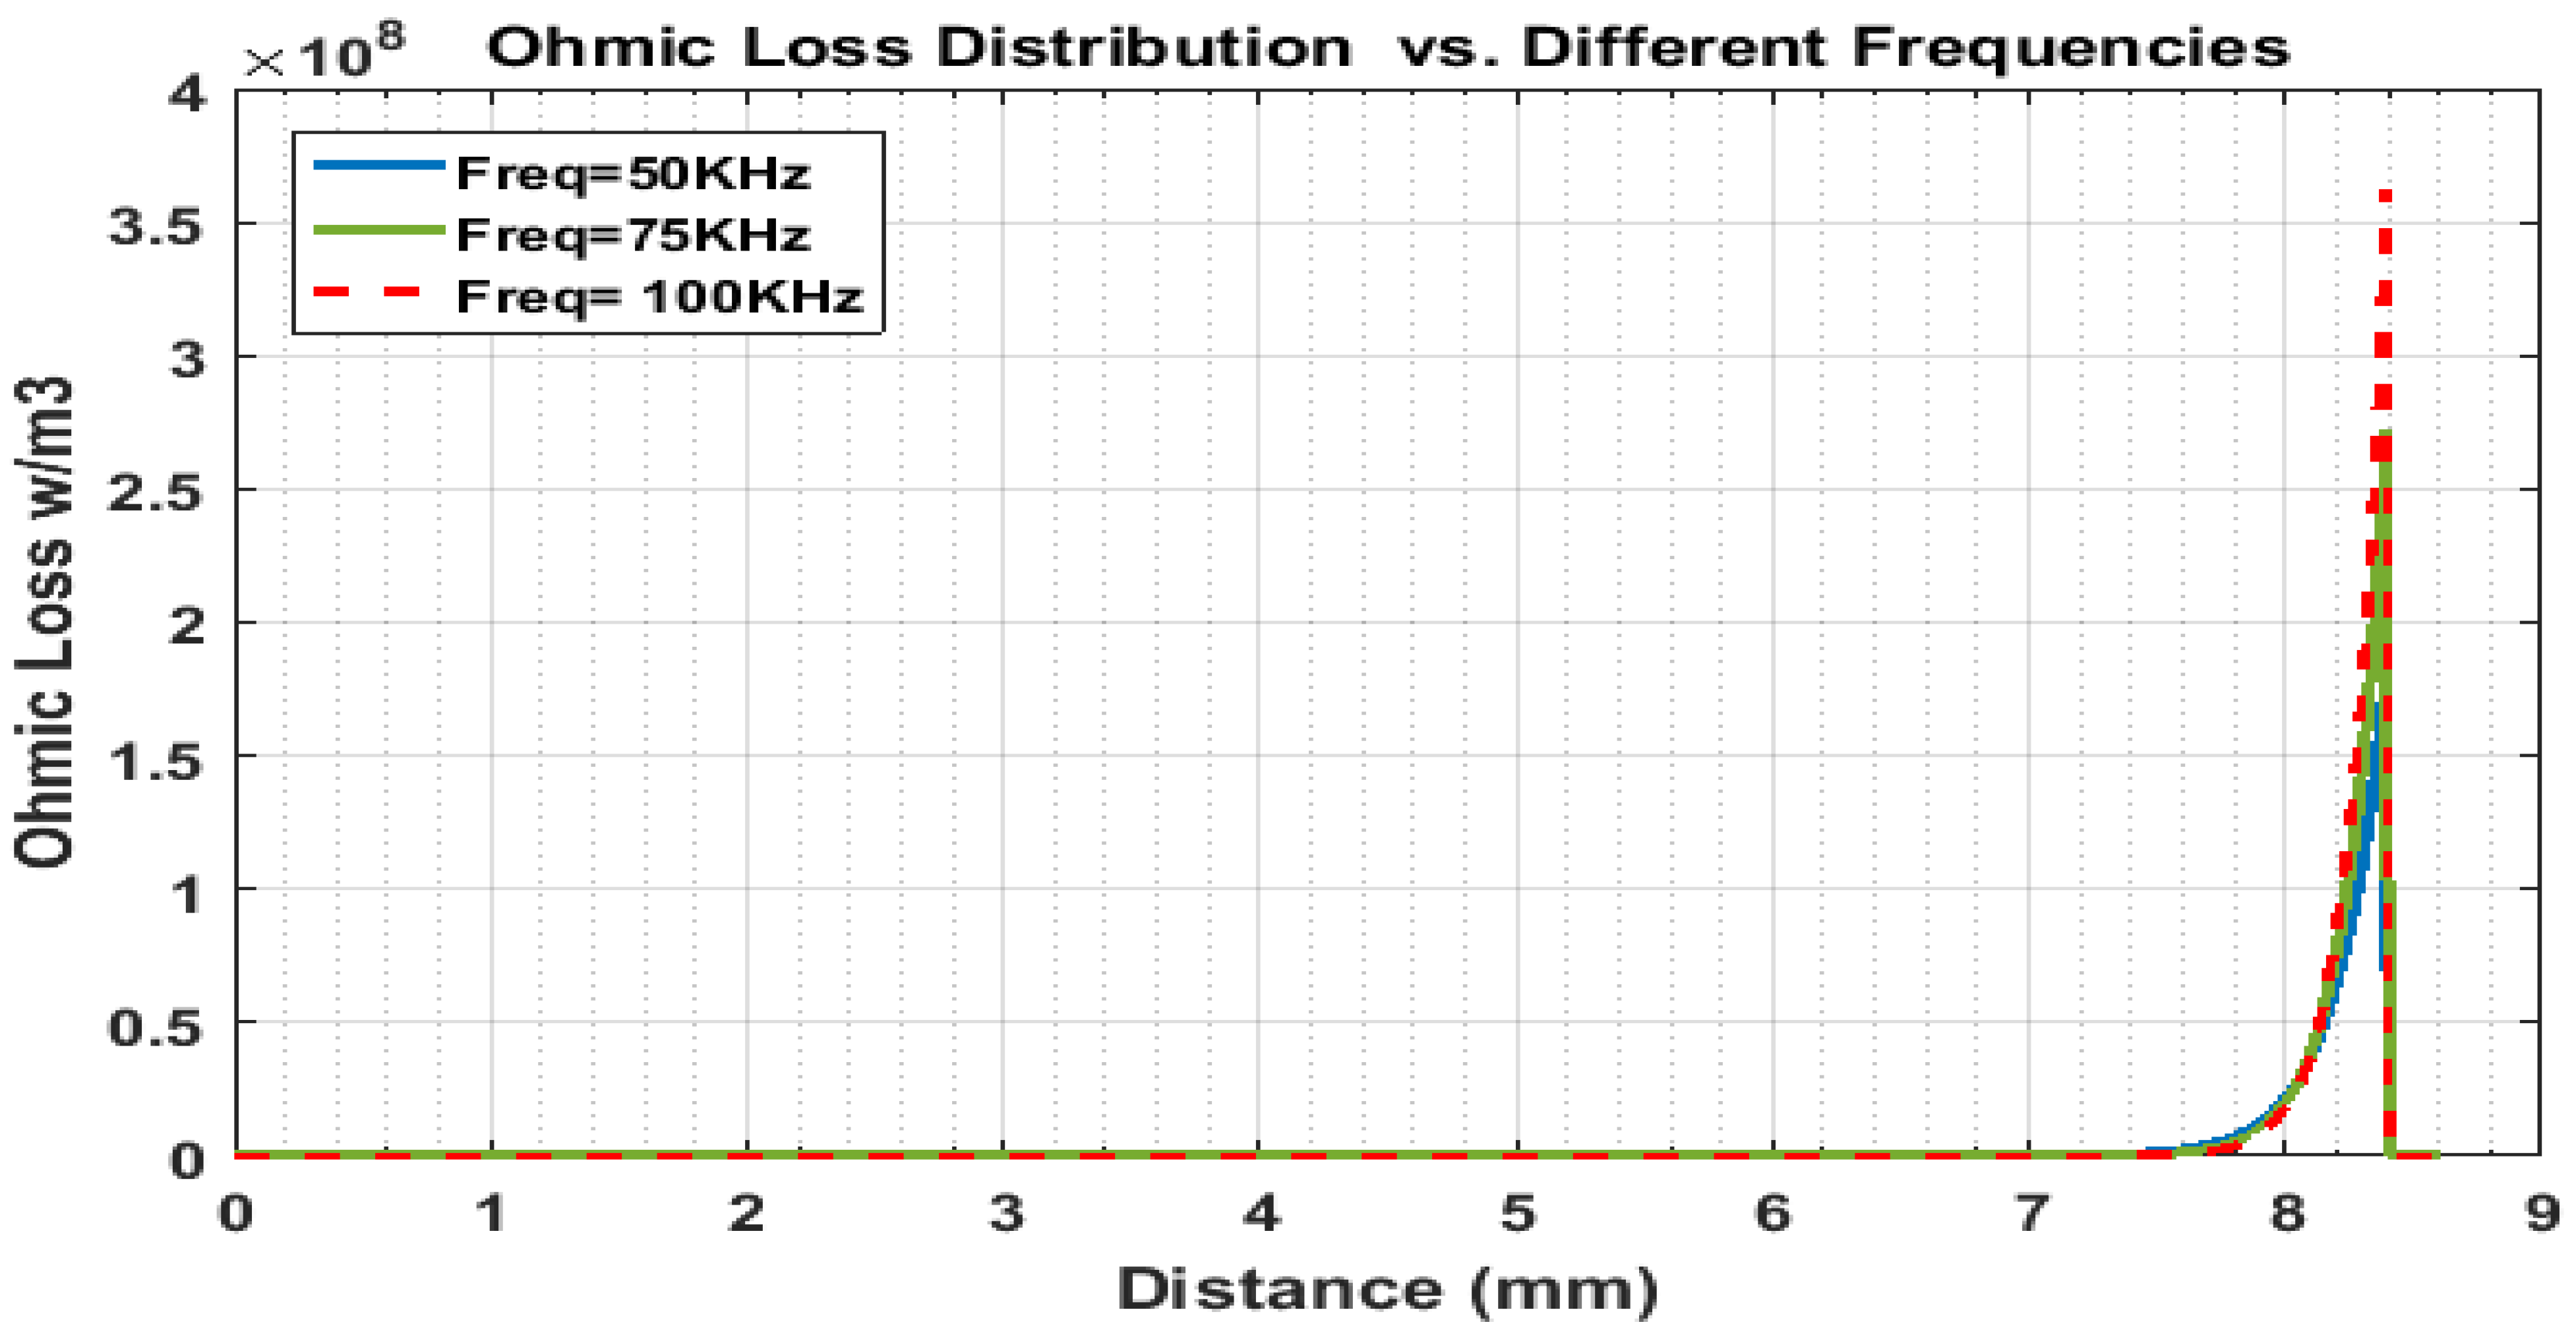
Figure 24 demonstrates the ohmic loss distribution with aluminum scrap exhibiting a single, sharply concentrated peak at approximately 8.5 mm, reaching a maximum of 4 × 10⁸ W/m3 at 100 kHz. This intense localization, confined within less than 1 mm, indicates a highly concentrated current density, likely occurring at a critical conductive boundary or interface. As the frequency increases from 50 kHz to 100 kHz, the peak loss escalates significantly while the spatial pattern remains nearly unchanged. This trend confirms that the current distribution mechanism is frequency-independent in position but strongly dependent in magnitude, due to enhanced skin effect and eddy current formation. The steep gradient over such a narrow spatial range poses substantial thermal management challenges and underscores the critical role of precise conductor alignment in high-frequency electromagnetic system design.
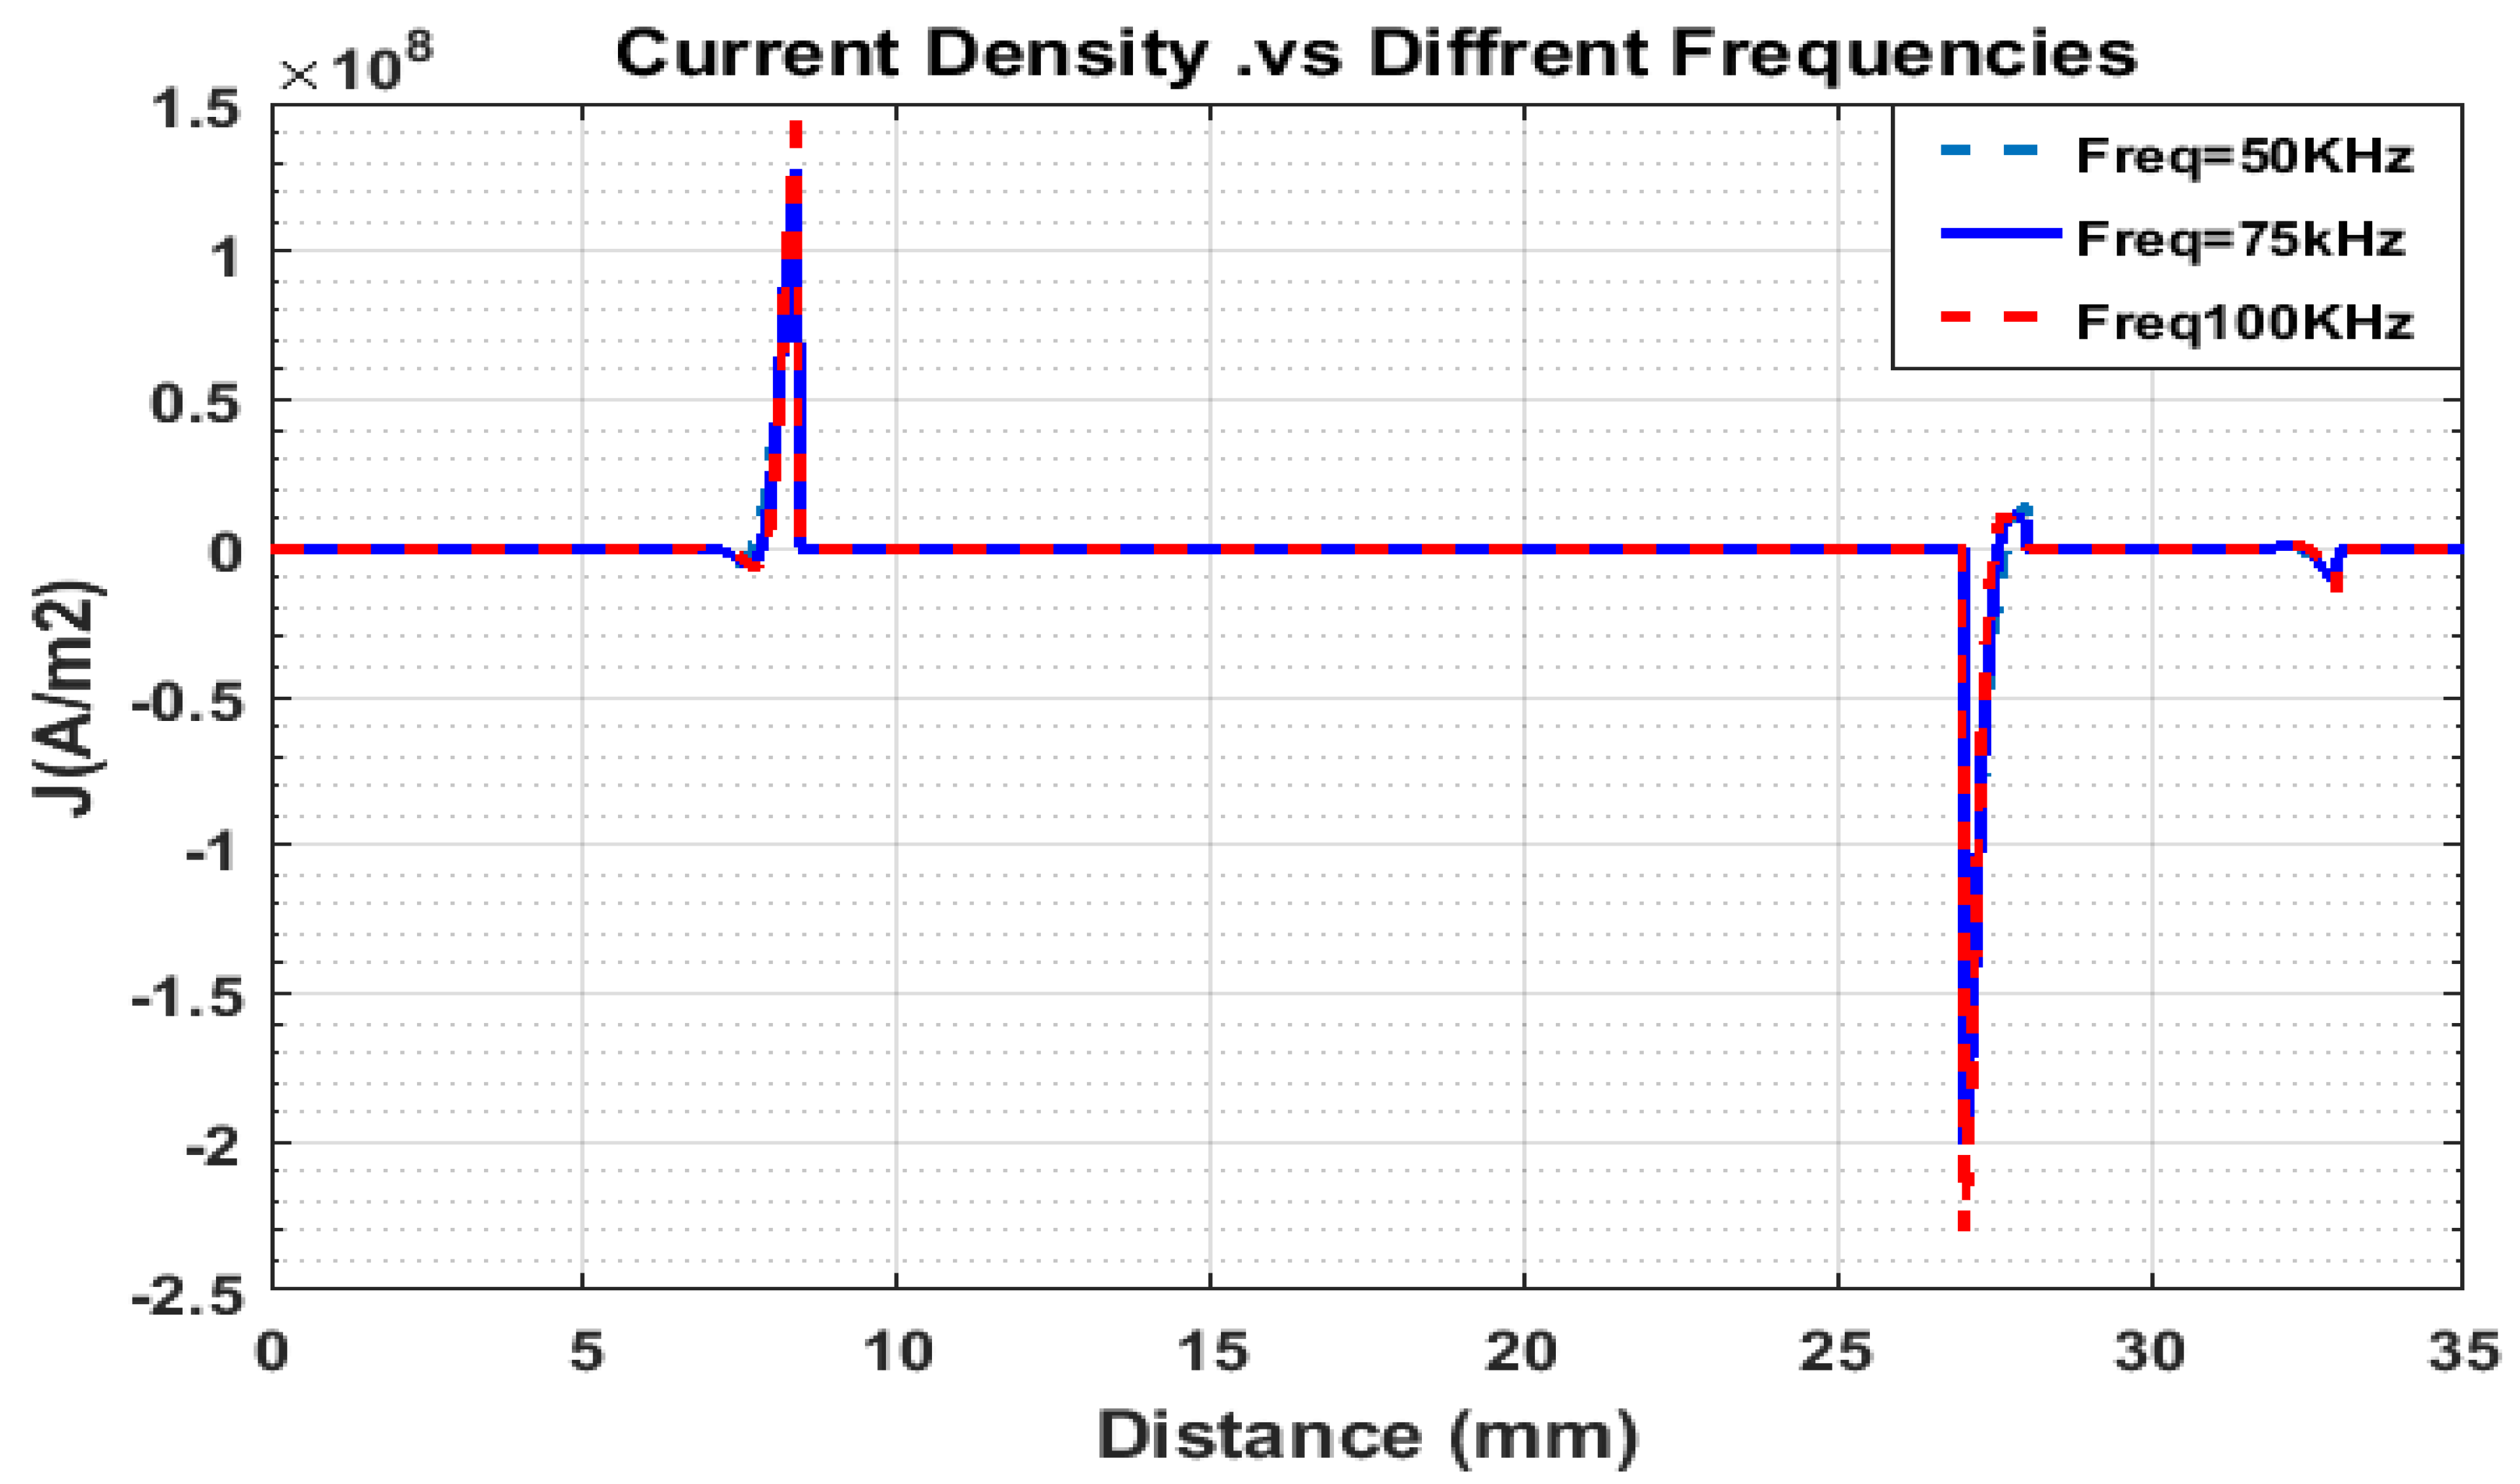
Figure 25 demonstrates the current density distributions along the interface in aluminum at excitation frequencies of 50 kHz, 75 kHz, and 100 kHz. The figure illustrates a clear frequency-dependent behavior: at 50 kHz, the current penetrates more deeply due to aluminum’s moderate conductivity and relatively high skin depth. As the frequency increases, the current progressively shifts toward the surface, with a noticeable concentration at 100 kHz, reflecting the influence of the skin effect in aluminum.
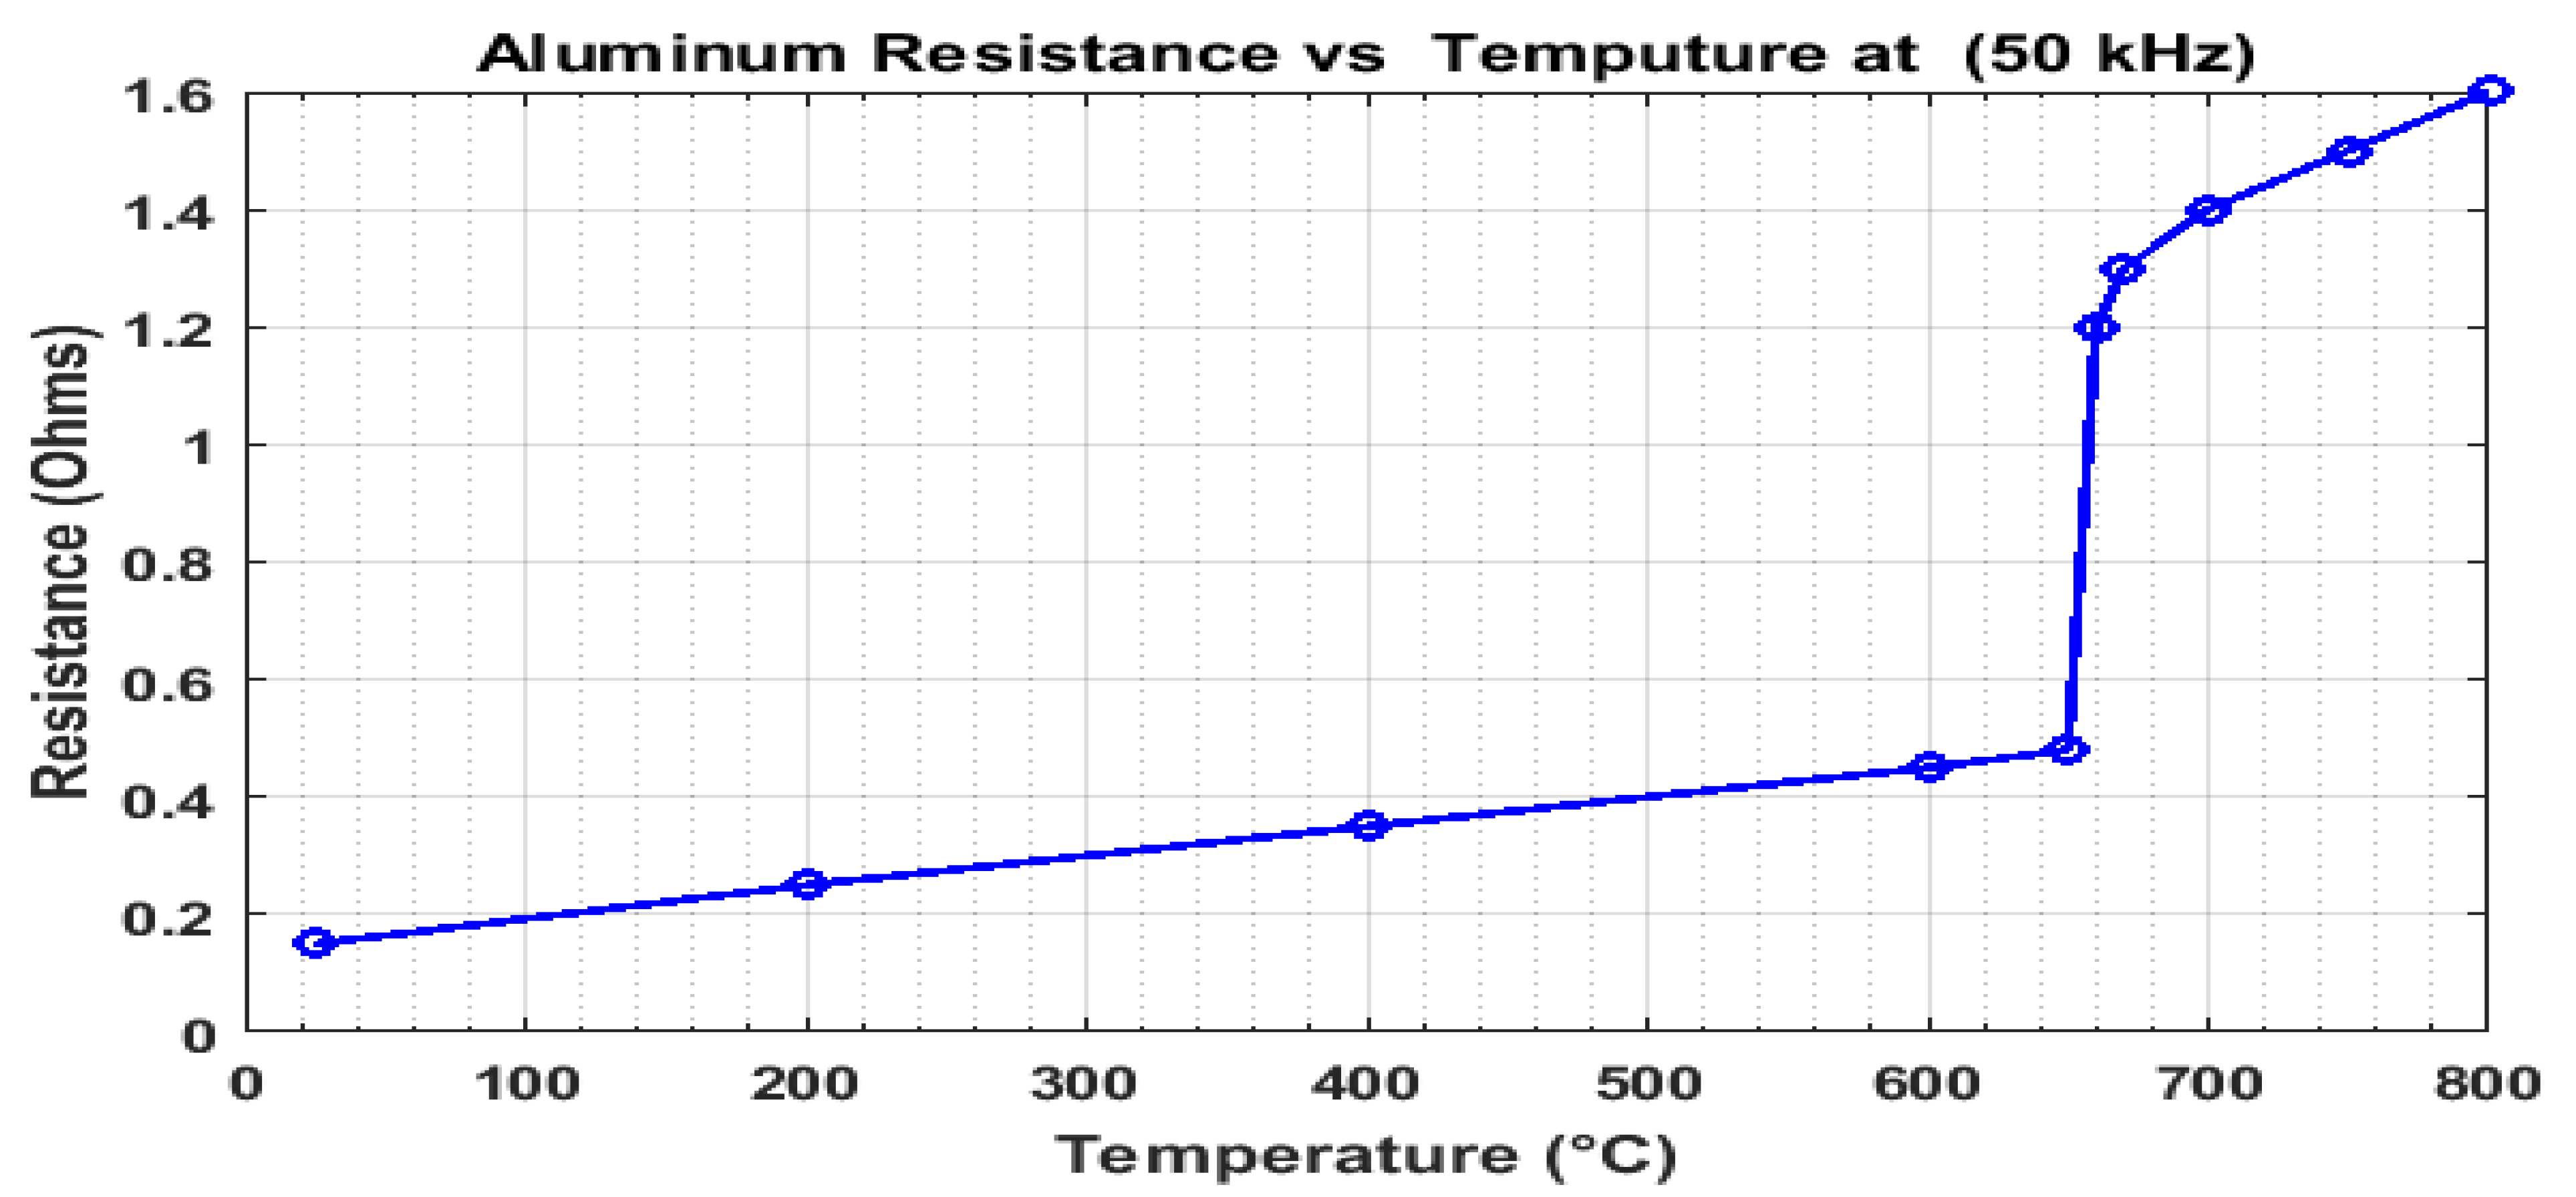
As aluminum approaches its melting point of 660 °C, its resistivity increases gradually; during the phase transition from solid to liquid, there is a sharp jump in resistivity. Liquid aluminum has significantly higher resistivity than solid aluminum, as shown in Figure 26.
Figure 27 shows the relationship between aluminum resistivity and temperature during the melting process under a current of 300 A at three different frequencies (50 kHz, 75 kHz, and 100 kHz). The curves demonstrate the significant resistivity increase that occurs at the melting point (660 °C), where resistivity approximately doubles as aluminum transitions from solid to liquid state. The frequency dependence is clearly visible, with higher frequencies (100 kHz) exhibiting greater effective resistivity throughout the temperature range due to enhanced skin effect. This effect becomes more pronounced in the liquid phase, where electron scattering mechanisms differ from the solid state. The pre-melting region shows a near-linear relationship between resistivity and temperature for all frequencies, while the post-melting region displays a different slope, highlighting the fundamental changes in electron transport properties between phases.
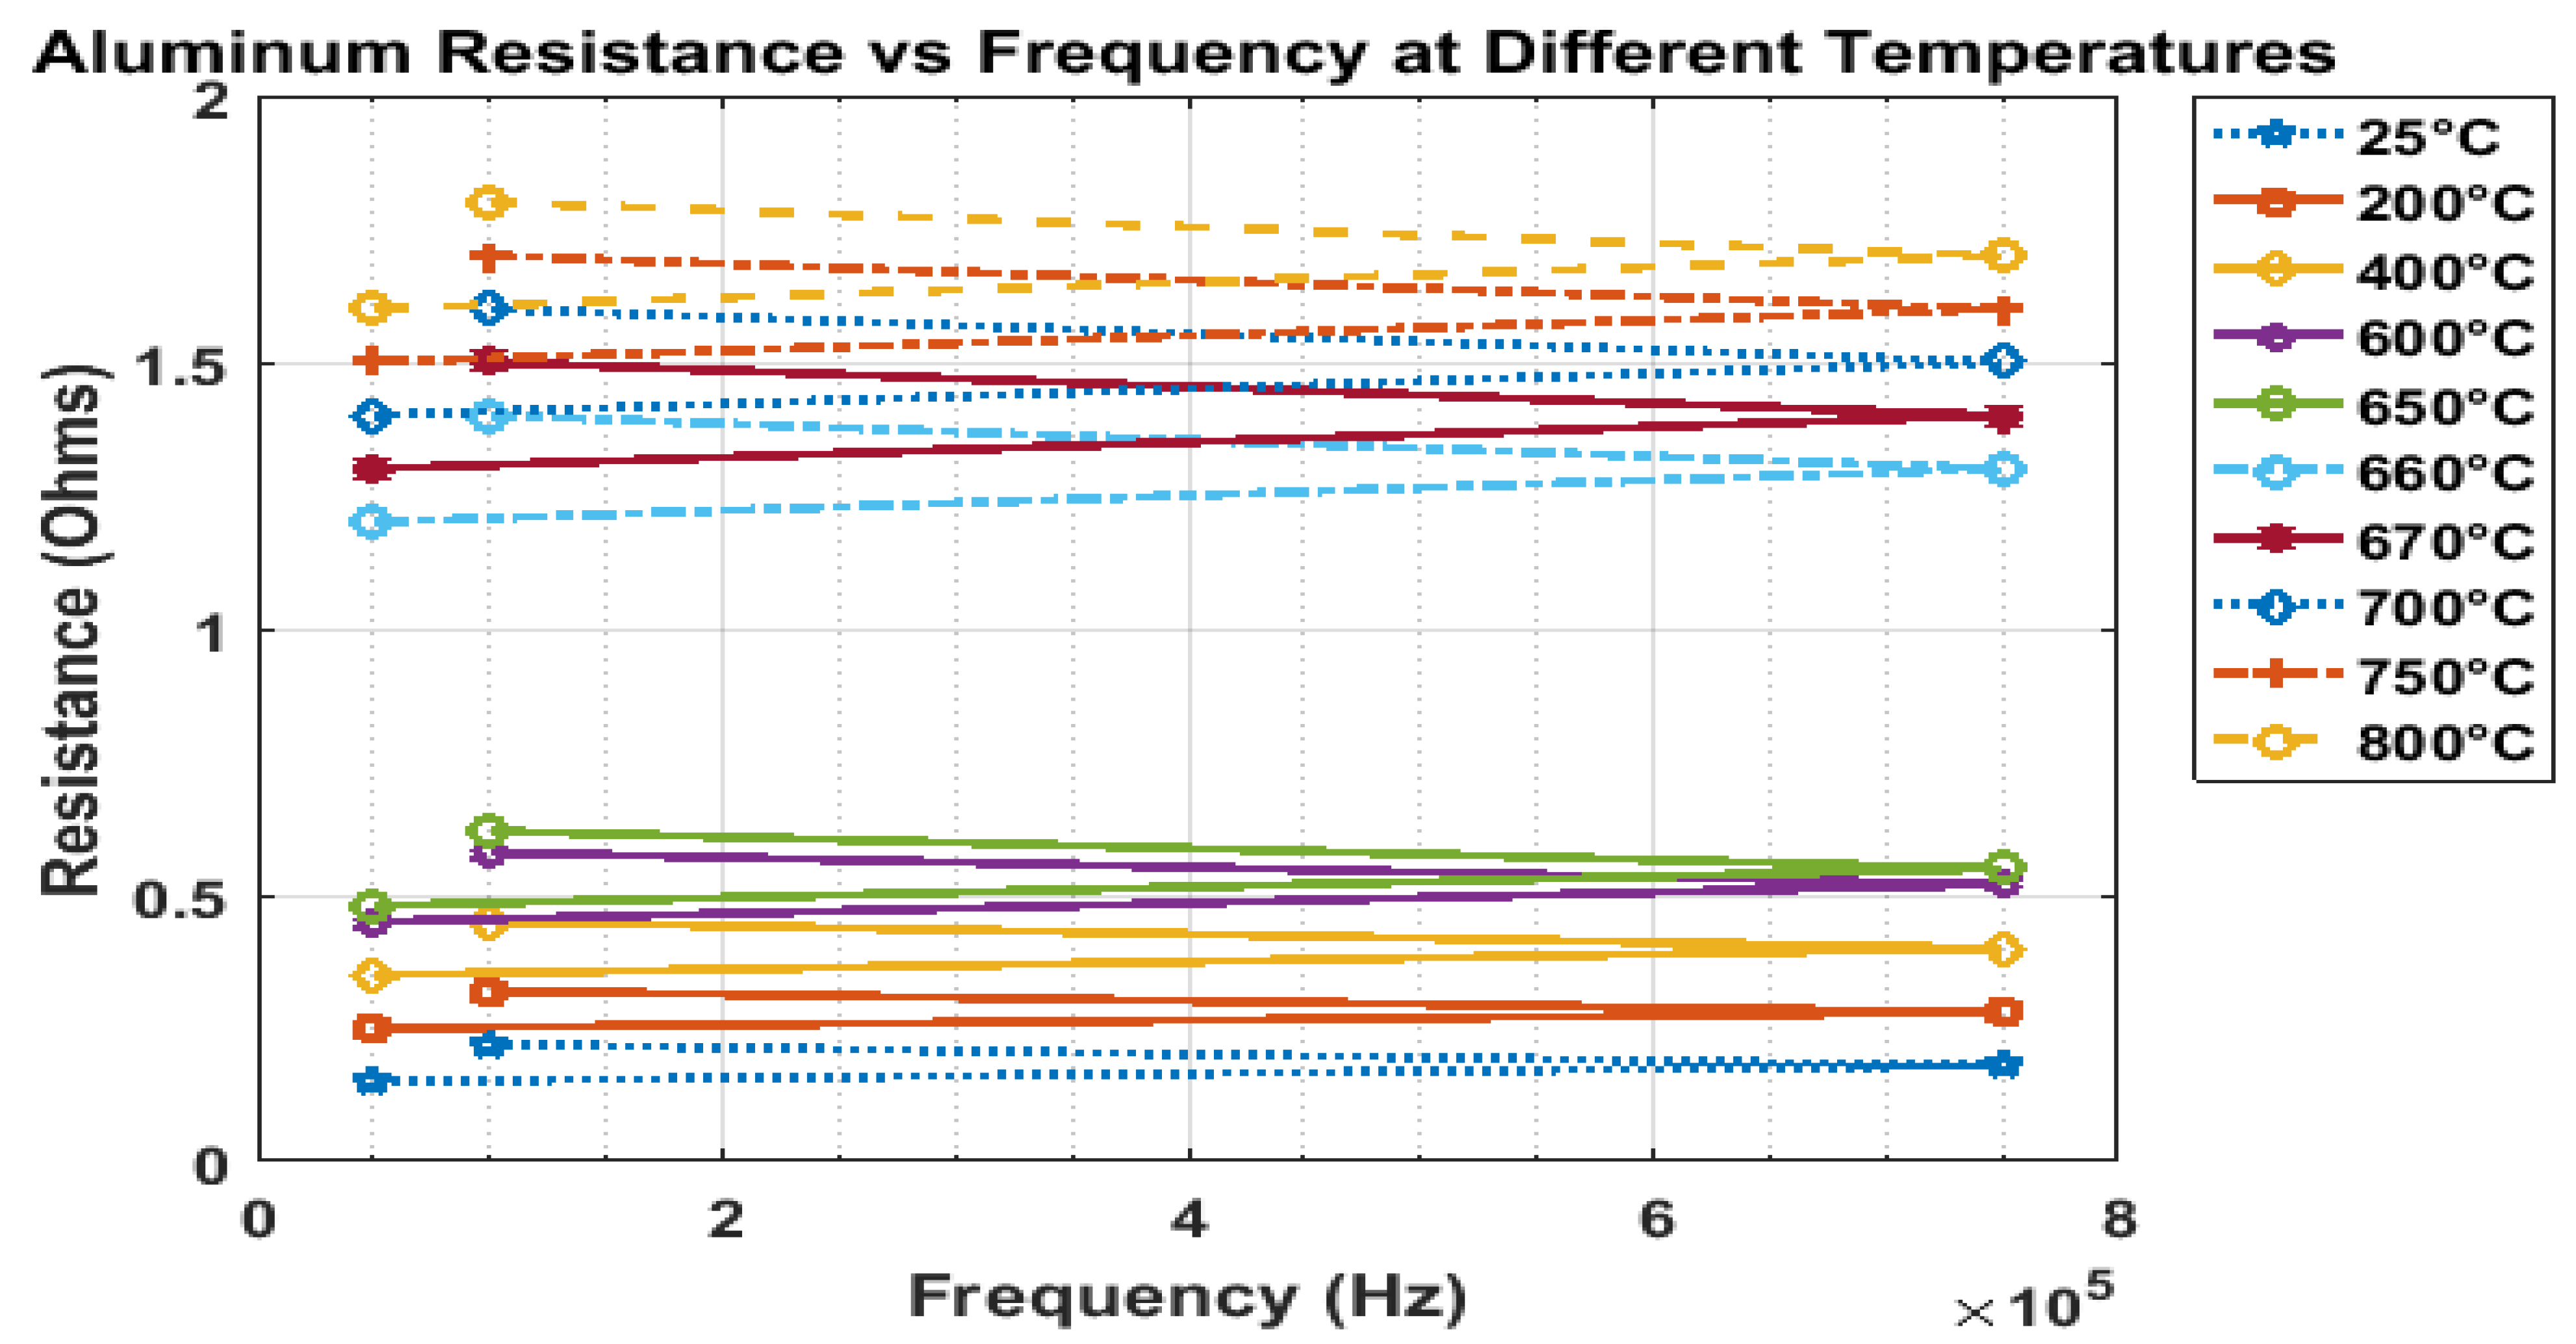
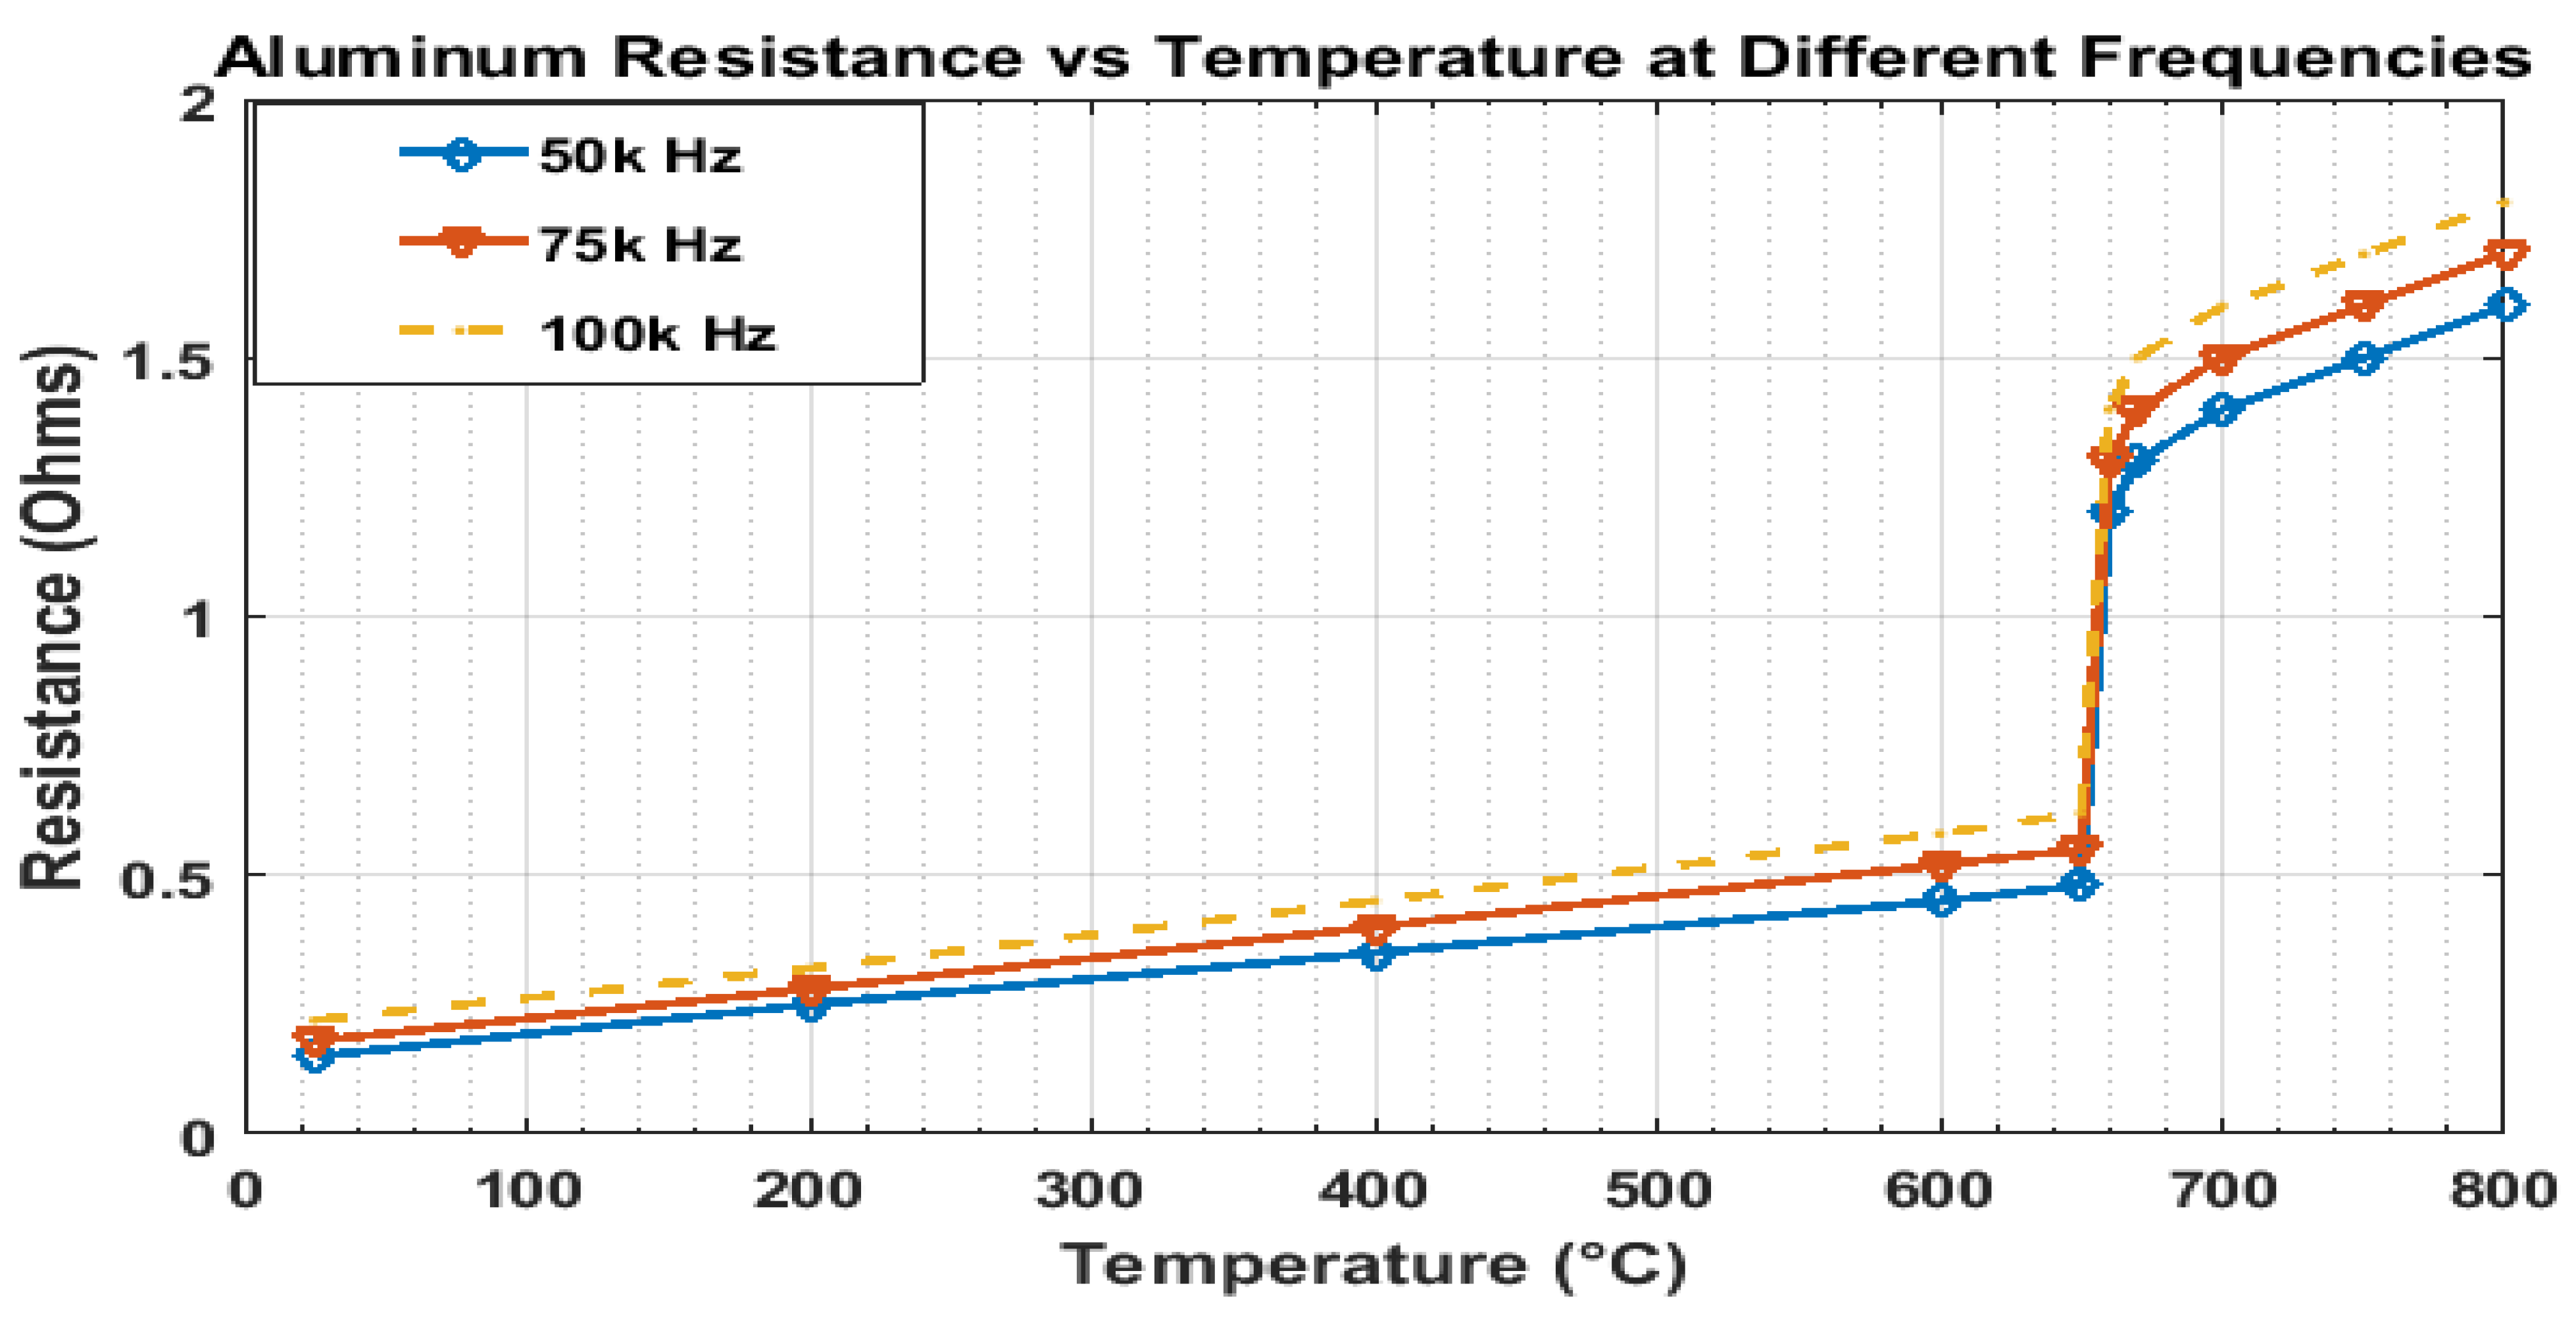
Figure 28 demonstrates the variation in aluminum electrical resistance as a function of frequency at temperatures ranging from 25 °C to 800 °C. The data reveal that resistance is largely independent of frequency across the evaluated range, while exhibiting a strong and progressive dependence on temperature. Specifically, resistance remains below 0.5 Ω at room temperature but increases significantly to approximately 1.7–1.8 Ω at 800 °C. A noticeable inflection in the resistance profile is observed near 600 °C, becoming more pronounced beyond 700 °C, approaching the material’s melting point (~660 °C). This behavior aligns with the well-established trend in metallic conductors, where elevated temperatures enhance atomic lattice vibrations, thereby impeding electron mobility and increasing resistivity. These observations are particularly relevant for high-temperature induction heating applications, where accurate modeling of temperature-dependent electrical properties is essential for precise electromagnetic–thermal analysis. Based on the results, the following Table 2 shows a comparison between copper and aluminum in terms of their different properties.
Although a full quantitative sensitivity analysis was not performed, a qualitative assessment of the main governing parameters provides important insight into the robustness of the thermal response. Variations in excitation frequency directly affect electromagnetic penetration depth and heating distribution, where higher frequencies enhance surface heating while lower frequencies promote volumetric energy deposition. Changes in coil geometry, particularly coil diameter and turn spacing, influence magnetic field distribution and heating uniformity, potentially altering melting efficiency. Moreover, temperature-dependent electrical and thermal material properties significantly affect energy absorption and heat diffusion. These qualitative trends, supported by well-established electromagnetic and heat transfer theory, indicate that the conclusions of the present study remain physically consistent within reasonable parameter variations and provide a foundation for future quantitative parametric investigations.

7. Conclusions and Recommendations

This study demonstrates the effectiveness of using ANSYS Maxwell based on the finite element method (FEM) to simulate the coupled electromagnetic and thermal behavior of induction melting processes for aluminum and copper. The simulation results provide clear insights into the material-dependent melting mechanisms and offer practical guidance for the optimized design and operation of induction furnaces. The findings reveal that aluminum melts faster than copper under identical operating conditions, primarily due to its lower melting temperature and electromagnetic characteristics that allow greater field penetration and more uniformly distributed volumetric heating. In contrast, copper exhibits a smaller skin depth at the same frequency, leading to heat concentration near the surface. The influence of operating frequency is also significant; higher frequencies promote surface heating, making them suitable for small workpieces or surface treatment applications, whereas lower frequencies enable deeper electromagnetic penetration and more uniform heating for larger components. Furthermore, the results highlight the importance of temperature-dependent material properties, particularly electrical resistivity and thermal conductivity, in determining melting efficiency. Adaptive control of operating parameters such as current amplitude and excitation frequency is therefore essential to achieve optimal thermal performance. While copper demonstrates more stable electrical behavior over a wide frequency range, contributing to uniform heating and enhanced thermal stability, aluminum benefits from its favorable melting characteristics, making it more responsive to volumetric heating.
Overall, this study confirms that FEM-based multiphysics simulation is a powerful tool for understanding induction melting phenomena and supports the development of energy-efficient and material-specific induction furnace designs.
Practical Recommendations for Industrial Applications:
  • Metal Selection: Use aluminum for short-cycle, energy-efficient melting; use copper for applications requiring uniform heating and high thermal stability.
  • Frequency Selection: Adjust operating frequency based on workpiece size and desired heating uniformity:
    Low frequencies (50 kHz) for large pieces or volumetric heating.
    High frequencies (100 kHz) for small pieces or surface-focused heating.
  • Current Optimization: Control RMS current to ensure sufficient heat generation while preventing overheating or material degradation.
  • Furnace Design: Consider coil geometry and placement to achieve uniform current distribution and minimize localized overheating.
  • Adaptive Control: Implement feedback mechanisms to adjust frequency or current in real-time based on temperature-dependent material properties, especially near melting points.
Future Work
Extend the study to different coil configurations, alternative metals, and experimental validation to further enhance design guidelines.
In future studies, artificial intelligence techniques will be investigated as a complementary tool to FEM modeling for analyzing non-linear thermal behavior and improving prediction and control of induction melting processes.
A structured parametric optimization approach will be investigated in future studies to identify optimal operating conditions for induction melting systems.
Future work will extend the proposed FEM framework to biomedical applications by incorporating bioheat transfer models, tissue-specific electromagnetic properties, and physiological safety constraints.
Future work could include more extensive parametric mesh studies to fully quantify numerical uncertainty across all simulation scenarios.


Author Contributions

G.M.I. collected the data and prepared the initial draft, developed the simulation models and performed data analysis. A.S.S. contributed to the methodology and interpreted the results. A.S.N. supervised the work, revised the manuscript, and approved the final version. All authors have read and agreed to the published version of the manuscript.
Funding

This research received no external funding.

Institutional Review Board Statement

Not applicable.

Informed Consent Statement

Not applicable.

Data Availability Statement

The data that support the findings of this study were generated using ANSYS Maxwell software. The data are available from the corresponding author upon reasonable request.

Acknowledgments

The authors acknowledge the use of a generative artificial intelligence tool for language editing and rephrasing purposes only. The AI tool was not used for data generation, data analysis, modeling, interpretation of results, or scientific decision-making, and all technical content and conclusions remain the full responsibility of the authors.

Conflicts of Interest

The authors declare no potential conflicts of interest regarding the publication of this work. In addition, the ethical issues, including plagiarism, informed consent, misconduct, data fabrication and/or falsification, double publication and/or submission, and redundancy, have been completely witnessed by the authors.

References

  1. Citroni, R.; Di Paolo, F.; Di Carlo, A. Replacing noble metals with alternative metals in MID-IR frequency: A theoreticalapproach. AIP Conf. Proc. 2018, 1990, 020004. [Google Scholar] [CrossRef]
  2. Al-Shafai, A.A.; Abdel-Hadi, E.A.; Taher, S.H.; Salem, M.R.; Elmohlawy, A.E. Numerical analysis of enhancing latent heat storage using fins and conductive barriers. J. Al-Azhar Univ. Eng. Sect. 2025, 20, 450–465. [Google Scholar] [CrossRef]
  3. Hatem, S. Simulation and Implementation of an Induction Heating System for Heating Brittle Thin Metal Sheets by Various Excitation Current Frequencies. Int. J. Eng. Res. Dev. 2024, 16, 896–909. [Google Scholar] [CrossRef]
  4. Buliński, P.; Smolka, J.; Golak, S.; Przyłucki, R.; Palacz, M.; Siwiec, G.; Lipart, J.; Białecki, R.; Blacha, L. Numerical and experimental investigation of heat transfer process in electromagnetically driven flow within a vacuum induction furnace. Appl. Therm. Eng. 2017, 124, 1003–1013. [Google Scholar] [CrossRef]
  5. Ahmed, R.A.; Elwany, M.A.; Kotb, A.B. Field Analysis and Equivalent Circuit Parameters of Linear Induction Motor with Eddy Current Secondary, Taking End Effect into Consideration. Int. J. Electr. Electron. Res. 2024, 12, 889–895. [Google Scholar] [CrossRef]
  6. Ghonamy, M.B.; Mouris, E.; Aziz, A.A. Review on enhancing technologies of heat transfer through phase change materials. J. Al-Azhar Univ. Eng. Sect. 2018, 13, 1240–1258. [Google Scholar] [CrossRef]
  7. Wang, K.F.; Chandrasekar, S.; Yang, H.T.Y. Finite-element simulation of induction heat treatment. J. Mater. Eng. Perform. 1992, 1, 97–112. [Google Scholar] [CrossRef]
  8. AbouTahoon, M.A.; Elkady, R.M.; Elrefaei, M.; Nasreldeen, T. Nonlinear Coupling Factor Maximization for A New Configuration of Electromagnetic Energy Harvester Numerical Studies And Simulation. J. Al-Azhar Univ. Eng. Sect. 2024, 19, 1239–1250. [Google Scholar] [CrossRef]
  9. Bermúdez, A.; Crego, O.; Ferrín, J.; García, B.; Gómez, D.; Martínez, I.; Pérez-Pérez, L.; Salgado, P. Multiphysics simulation of slag melting in an induction furnace for sustainable silicon production. Appl. Math. Model. 2025, 145, 116107. [Google Scholar] [CrossRef]
  10. Bermúdez, A.; Gómez, D.; Muñiz, M.; Salgado, P.; Vázquez, R. Numerical simulation of a thermo-electromagneto-hydrodynamic problem in an induction heating furnace. Appl. Numer. Math. 2009, 59, 2082–2104. [Google Scholar] [CrossRef]
  11. Garcia-Michelena, P.; Ruiz-Reina, E.; Herrero-Dorca, N.; Chamorro, X. Multiphysics modeling and experimental validation of heat and mass transfer for the vacuum induction melting process. Appl. Therm. Eng. 2024, 243, 122562. [Google Scholar] [CrossRef]
  12. Liang, X.; Li, M.; Cheng, B.; Wu, F.; Luo, X. Effects of induction furnace conditions on lining refractory via multi-physics field simulation. Appl. Phys. A 2023, 129, 542. [Google Scholar] [CrossRef]
  13. Jiang, T.; Zhang, W. Numerical Simulation of Multi-Physics Fields in Fused Magnesia Furnace. Metals 2023, 13, 39. [Google Scholar] [CrossRef]
  14. Li, J.; Zhang, P.; Hu, J.; Zhang, Y. Study of the Synergistic Effect of Induction Heating Parameters on Heating Efficiency Using Taguchi Method and Response Surface Method. Appl. Sci. 2023, 13, 555. [Google Scholar] [CrossRef]
  15. Garcia-Michelena, P.; Ruiz-Reina, E.; Gordo-Burgoa, O.; Herrero-Dorca, N.; Chamorro, X. Numerical Simulation of Free Surface Deformation and Melt Stirring in Induction Melting Using ALE and Level Set Methods. Materials 2025, 18, 199. [Google Scholar] [CrossRef]
  16. Vishnuram, P.; Ramachandiran, G.; Babu, T.S.; Nastasi, B. Induction Heating in Domestic Cooking and Industrial Melting Applications: A Systematic Review on Modelling, Converter Topologies and Control Schemes. Energies 2021, 14, 6634. [Google Scholar] [CrossRef]
  17. Gündoğan, K.; Çelik, V. Numerical Analysis of Metals Under The Influence of Electromagnetic Field at Different Current Values. Manuf. Technol. Appl. İmalat Teknol. Ve Uygulamaları 2023, 4, 111–119. [Google Scholar] [CrossRef]
  18. Khazaal, M.H.; Abdulbaqi, I.M.; Thejel, R.H. Modeling, design and analysis of an induction heating coil for brazing process using FEM. In Proceedings of the 2016 Al-Sadeq International Conference on Multidisciplinary in IT and Communication Science and Applications (AIC-MITCSA), Baghdad, Iraq, 9–10 May 2016; pp. 1–6. [Google Scholar]
  19. Elsaady, W.; Moughton, C.; Nasser, A.; Lacovides, H. Coupled numerical modelling and experimental analysis of domestic induction heating systems. Appl. Therm. Eng. 2023, 227, 120170. [Google Scholar] [CrossRef]
  20. Al-Jrew, A.H.; Mahmood, J.R.; Ali, R.S. Analysis and design of the induction heating load using finite element method. AIP Conf. Proc. 2024, 3229, 020020. [Google Scholar] [CrossRef]
  21. Rudnev, V.; Loveless, D.; Cook, R.L. Handbook of Induction Heating, 2nd ed.; CRC Press: Boca Raton, FL, USA, 2017; Available online: https://www.routledge.com/Handbook-of-Induction-Heating/Rudnev-Loveless-Cook/p/book/9781138748743 (accessed on 13 November 2024).
  22. Chen, X.; Wang, J.; Ma, B.; Duan, Z.; Wang, H. Research Status and Applications of Dual-Frequency Induction Heating Power Supply. Electronics 2024, 13, 4913. [Google Scholar] [CrossRef]
  23. Li, F.; Liu, W.; Ding, C.; Wang, S.; Meng, X. The Microstructures and Properties of Cu-Ni-Co-Si Alloys: A Critical Review. Metals 2025, 15, 564. [Google Scholar] [CrossRef]
  24. Chen, X.; Ben Saada, M.; Lavisse, B.; Ammar, A. Recent advances in the remelting process for recycling aluminium alloy chips: A critical review. Int. J. Mater. Form. 2025, 18, 42. [Google Scholar] [CrossRef]
  25. Netzelmann, U. Theoretical and Experimental Analysis of the Thermal Response in Induction Thermography in the Frequency Range of 2.5 Hz to 20 kHz. Appl. Sci. 2023, 13, 3565. [Google Scholar] [CrossRef]
  26. Wang, S.; Wang, W.; Zheng, Y. Reconfigurable Multimode Microwave Sensor with Resonance and Transmission Sensing Capabilities for Noninvasive Glucose Monitoring. IEEE Trans. Microw. Theory Tech. 2024, 72, 3102–3117. [Google Scholar] [CrossRef]
  27. Wang, S.; Wan, C.; Chung, K.L.; Zheng, Y. Investigation of Compact Near-Equidistant Multimode Resonator Integrating Skyrmionic Metamaterial with SIW Cavity and Its Application in Dielectric Material Detection. IEEE Trans. Microw. Theory Tech. 2025, 73, 3565–3580. [Google Scholar] [CrossRef]
  28. Adetunji, O.; Ojo, S.S.; Oyetunji, A.; Itua, N. Melting Time Prediction Model for Induction Furnace Melting Using Specific Thermal Consumption from Material Charge Approach. J. Miner. Mater. Charact. Eng. 2021, 9, 61–74. [Google Scholar] [CrossRef]
  29. Daif, O.S.; Raouf, M.H.A.; Kotb, A.B. Field Analysis, Distribution and Performance of Sleeve Rotor Induction Motor Taking the Sleeve Rings into Consideration. Int. J. Recent Technol. Eng. 2020, 9, 838–842. [Google Scholar] [CrossRef]
  30. Kheder, A.S.; Elwany, M.A.; Kotb, A.B. Analysis of Disc Motor with Asymmetrical Conducting Rotor. Int. J. Electr. Electron. Res. 2024, 12, 487–492. [Google Scholar] [CrossRef]
Figure 1. Modeling and simulation procedure of the induction furnace using ANSYS Maxwell.
Magnetism 06 00009 g001
Figure 2. Mesh generation of the induction furnace 13 turns and 300 A peak excitation current.
Magnetism 06 00009 g002
Figure 3. Magnitude of the magnetic field strength ( H ) along Z-axis for 13 turns and 300 A peak excitation current.
Magnetism 06 00009 g003
Figure 4. Flux lines distribution for IF without copper scrap for 300 A peak excitation current with 75 kHz with (ohmic loss = 0).
Magnetism 06 00009 g004
Figure 5. Flux lines distribution for IF with copper scrap for 300 A peak excitation current with 75 kHz with ohmic loss.
Magnetism 06 00009 g005
Figure 6. Flux density distribution for IF with copper scrap.
Magnetism 06 00009 g006
Figure 7. Magnetic field strength distribution for IF with copper scrap.
Magnetism 06 00009 g007
Figure 8. Current density distribuation at the IF using 300 A peak excitation current with 75 kHz with copper scrap.
Magnetism 06 00009 g008
Figure 9. Energy distribution for IF with copper scrap.
Magnetism 06 00009 g009
Figure 10. Flux lines distribution for IF with aluminum scrap for 300 A peak excitation current with 75 kHz.
Magnetism 06 00009 g010
Figure 11. Magnetic flux density distribution for IF with aluminum scrap.
Magnetism 06 00009 g011
Figure 12. Magnetic field strength distribution for IF with aluminum scrap.
Magnetism 06 00009 g012
Figure 13. Current density distributions at the IF using 300 A peak excitation current with 75 kHz with aluminum scrap.
Magnetism 06 00009 g013
Figure 14. Energy distribution for IF with aluminum scrap.
Magnetism 06 00009 g014
Figure 15. The current density distributions along IF with copper scrap and three different frequencies.
Magnetism 06 00009 g015
Figure 16. Ohmic loss distributions along IF, copper scrap peak excitation current 300 A for three different frequencies.
Magnetism 06 00009 g016
Figure 17. Ohmic losses distributions along (copper scrap) for 300 A and three different frequencies.
Magnetism 06 00009 g017
Figure 18. Current density distributions (at the copper scrap) for 300 A and three different frequencies.
Magnetism 06 00009 g018
Figure 19. Copper resistivity changes during melting process.
Magnetism 06 00009 g019
Figure 20. Copper resistivity changes during melting process 300 A and three different frequencies.
Magnetism 06 00009 g020
Figure 21. Copper resistance versus temperature rise at three different frequencies using 300 A peak excitation current.
Magnetism 06 00009 g021
Figure 22. The current density distributions along IF with aluminum scrap and three different frequencies.
Magnetism 06 00009 g022
Figure 23. The ohmic loss distributions along IF, aluminum scrap, 300 A and three different frequencies.
Magnetism 06 00009 g023
Figure 24. Ohmic loss distributions (at the aluminum scrap) for 300 A and three different frequencies.
Magnetism 06 00009 g024
Figure 25. Current density distributions (at the aluminum scrap) for 300 A and three different frequencies.
Magnetism 06 00009 g025
Figure 26. Aluminum resistivity changes during melting process at frequency 50 kHz.
Magnetism 06 00009 g026
Figure 27. Aluminum resistivity changes during melting process.
Magnetism 06 00009 g027
Figure 28. Aluminum resistance versus temperature rise at three different frequencies using 300 A peak excitation current.
Magnetism 06 00009 g028
Table 1. Comparison of skin depth, ohmic power, and estimated heating time for aluminum and copper at different frequencies.
MaterialFreq (khz)Estimated Ohmic Power (W) Skin   Depth   ( δ w ) (mm)Heating Time t (s)
Aluminum5018000.3797.9
Aluminum7520000.3097.1
Aluminum10022000.2686.5
Copper5015000.29222.1
Copper7516500.2420.1
Copper10018000.20718.5
Table 2. Comparison between copper and aluminum at different frequencies.
PropertyCopperAluminum
Melting Point1084 °C660 °C
Initial Resistance (25 °C, 50 kHz)0.1 Ω0.15 Ω
Resistance Jump at Melting~115%~150%
Frequency ResponseLowHigh
Temperature SensitivityLowHigh
Pre-Melting BehaviorSlightly non-linearNearly linear until melting
Disclaimer/Publisher’s Note: The statements, opinions and data contained in all publications are solely those of the individual author(s) and contributor(s) and not of MDPI and/or the editor(s). MDPI and/or the editor(s) disclaim responsibility for any injury to people or property resulting from any ideas, methods, instructions or products referred to in the content.