Entry

The Misery Index: A Monograph with Illustrative Examples of the USMCA Region

by
Fernando Sánchez
Facultad de Estudios Superiores Acatlán, Universidad Nacional Autónoma de México, Naucalpan de Juárez 53150, Mexico
Encyclopedia 2026, 6(7), 149; https://doi.org/10.3390/encyclopedia6070149
Submission received: 17 May 2026 / Revised: 30 June 2026 / Accepted: 3 July 2026 / Published: 5 July 2026
(This article belongs to the Section Social Sciences)

Definition

The Misery Index (MI), also known as the Economic Discomfort Index, is a macroeconomic gauge originally proposed by Arthur M. Okun. It is defined as the unweighted sum of inflation and unemployment rates. This indicator attempts to synthesize the main factors generating economic malaise and collective discomfort, although it has been criticized for being an oversimplification of the economic problems faced by average citizens. Consequently, researchers have modified this index by incorporating variables associated with informality, interest rates, and economic growth, among others. Despite its simplicity, the MI has been utilized to describe the behavior of numerous social phenomena, such as suicide, the inclination to gamble, and tourism. However, the index has also been criticized for the inherent difficulty of associating its behavior with specific policy actions. This paper presents the main criticisms that this index has received, as well as its main applications and the various modifications it has undergone over time.

1. Introduction

The Economic Discomfort Index, better known as the Misery Index (MI), is attributed to former Brookings Institution scholar Arthur M. Okun, who proposed such an indicator in the 1970s when the United States (U.S.) was undergoing high rates of both inflation and unemployment, a situation that was mainly caused by the Organization of the Petroleum Exporting Countries’ (OPEC) boycott of Middle East oil deliveries to the U.S. [1].
Okun’s index represents an effort to describe the economic situation based solely on two macroeconomic indicators: unemployment and inflation rates [2]. In fact, by definition, Okun’s Misery Index (OMI) is simply computed by adding together the unemployment U and inflation π rates [3,4,5,6,7]. Regardless of its simplicity, OMI probably represents “[…] the first attempt to summarise a range of macroeconomic indicators into a single statistic in order to track the state of health of the macroeconomy during the business cycle” [3] (p. 2).
Inflation and unemployment are perceived as two of the most palpable costs for any society [6]. Accordingly, a low OMI value is preferred over a high value as it reflects superior economic performance [8]. People dislike inflation as it is related to “[…] decreasing living standards, loss of national prestige, political instability, and exploitation” [9] (p. 4).
Additionally, people typically associate high prices with failed policies on the part of governmental institutions; in particular, inflation is perceived as the result of unsuccessful policies applied by central banks [9]. Meanwhile, unemployment may cause both pecuniary and non-pecuniary costs. Such “[…] costs arise primarily since employment is not only a source of income, but also a provider of social relationships, identity in society and individual self-esteem” [10] (p. 1). In this sense, the non-monetary costs inflicted by unemployment on average individuals manifest themselves in the form of well-being reductions—that is, marital instability, high mortality rates, and increased suicide risk, among other factors [10].
The objective of this paper is to present the main characteristics, applications, and specifications that Okun’s index has had over time. The paper has been organized as follows: In Section 2, the definition and the main criticisms of Okun’s Index are presented. In Section 3, the many modifications applied to OMI over time are presented. Section 4, which considers the different applications that OMI has had, has been divided into three subsections: In Section 4.1, the political utilization of Okun’s Index is discussed. Section 4.2 analyzes the literature that has considered OMI to be a type of poverty index. Section 4.3 examines the interdisciplinary applications of OMI. Section 5 is divided into two subsections: Section 5.1 presents estimations of OMI for the countries in the United States–Mexico–Canada Agreement (USMCA); Section 5.2 discusses the behavior of the so-called Compensated Misery Index. A summary is presented in Section 6.

2. Definition and Main Criticisms of the Misery Index

Using the notation introduced in the previous section, OMI’s conventional definition is presented in Equation (1):
O M I = U + π
The implicit assumption behind Equation (1) is that people dislike inflation as much as they dislike unemployment, implying that the “(dis)utility function” in (1) has a marginal rate of substitution (MRS) equal to −1 [11]. In fact, this characteristic corresponds to the simplest case of perfect substitutes, and such an MRS implies that the indifference curves associated with (1) are merely parallel straight lines [12]. The simplicity of Okun’s MI has provoked criticisms of this macroeconomic gauge, as exemplified in the following quote:
“Another limitation of the Misery Index is that it simply adds together the unemployment and inflation rates unweighted. While there is no doubt that unemployment and inflation both contribute to misery in the economy, the relative contribution of each is a matter of conjecture. Different trends in the Misery Index can be obtained by assigning alternative sets of unequal weights to unemployment and inflation […]. In the 1960s, a relatively high weight on unemployment results in a decrease in the Misery Index, while a relatively high weight on inflation results in a rise in the index”.
([13] p. 59)
Some of the evidence suggests that people are more tolerant of price rises than they are of increases in unemployment. For example, Di Tella et al. [14], using life satisfaction as a dependent variable of the inflation and unemployment rates, found that the MI underweights the effect of unemployment on well-being. Meanwhile, Blanchflower et al. [15] (p. 117) point out that “[…] a 1 percentage point increase in the unemployment rate lowers well-being by more than five times as much as a 1 percentage point increase in the inflation rate.” Similar results were found by Arge [16], who also suggests that the poorest people worry more about employment than they do about inflation.
Okun’s index, despite the imprecisions that may arise from it, may be considered informative as it illustrates two of the main issues affecting the general public, namely, whether they have a job or not and how much they will be charged for goods and services. In this context, OMI is an easy-to-understand indicator of the economic difficulties faced by society and how people feel about the economic environment [17].
However, the criticisms that OMI has received extend farther than its simplicity. It has been noted that OMI’s components, and the index itself, are related to economic policy; however, Okun’s index, as a macroeconomic indicator, has many shortcomings that make it a poor tool with which to assess the results of economic policy [13].
“Macroeconomic policy changes mainly affect the “demand side” of the economy—the total amount of desired spending. Swings in spending, in turn, have offsetting effects on unemployment and inflation, though not necessarily point for point. Using standard economic analysis, stimulative policy—for example, a big increase in government spending would cause both lower unemployment and higher inflation. These opposite effects would limit the magnitude of the change in the Misery Index.”
([13] p. 59)
In fact, it has been noted that OMI, as well as fluctuating with the business cycle, varies with fiscal and monetary policies, particularly when the main objective is to maintain both unemployment and inflation under a preconceived threshold [18]. However, the particular set of policies inducing changes in OMI is unclear; given a particular policy action, it is not possible to determine the direction, or the magnitude, of the change in the index, which is further confounded by the numerous non-policy actions that may affect Okun’s index. It is therefore not possible to judge the failure or success of a policy based merely on the behavior of the Misery Index [13].
Many studies have utilized different variables to explain OMI’s changes, such as tourism [19,20], the bilateral real exchange rate [21], and the multilateral real exchange rate [22]. However, once again, the effects of these variables on the Misery Index depend on different macroeconomic factors. For example, while a depreciation of the national currency may increase import prices, causing inflation [23], a depreciation may also boost economic growth, as consumers could start buying national goods as a substitute for high-cost imports [24], and, according to Okun’s Law, economic growth palliates unemployment [25]. Conversely, the Latin American structuralists consider that a depreciation may, in the context of semi-industrialized countries, cause economic downturns [26]. In the same vein, it has been proven that tourism can alleviate unemployment [27,28], but it can also generate inflation, particularly at the local level [29].
As remarked upon above, the primary critiques of Okun’s index revolve around its simplicity. To tackle this issue, as will be discussed in the following section, researchers have added variables to the index to make it a more coherent and comprehensive indicator of the level of misery that plagues a society.

3. Evolution of the Misery Index

Most of the criticisms of Okun’s index have focused on its simplicity, namely, the unweighted nature of its variables, and its oversimplified view of the macroeconomic variables afflicting societal well-being. Other criticisms have addressed its deficiency in not including income distribution among its main indicators.
Table 1 illustrates how numerous researchers have modified Okun’s index to transform it into a more accurate tool with which to monitor the economic discomfort caused by the growth of “undesired” macroeconomic indicators in a society.
In the opinion of Grabia [43] (p. 107), “[…] considering the positive consequences of low inflation, an alternative macroeconomic misery index should be proposed in the form of the sum of the unemployment rate and inflation rate deviations (both upward and downward) as compared with the target rate of inflation set at, e.g., 2%.” In this context, both the benefits of having an inflation rate beneath the targeted rate and the malaise caused by having an inflation rate that surpasses inflation objectives are taken into account.
Finally, “Okun’s creation became a tool for understanding how the public felt about the economy” [17]. However, M I 18 , in Table 1, fully modified the components of the original OMI precisely because it seems to no longer explain how people feel about the economic environment [40]. However, it is important to take into consideration that “Since no index of aggregate well-being can be meaningful in other than an ordinal sense, it is worth noting that the number attached to such an index serves only to rank levels of welfare in different time periods, but not to determine the amount or degree of such welfare differences” [30] (p. 85). Consequently, it is important to consider that OMI is an index developed to respond to President Lyndon Johnson’s request for an easy-to-understand indicator with which “to take the economy’s temperature” [41].

4. Applications of the Misery Index

4.1. Okun’s Misery Index in Politics

Although OMI is not among the official government economic indicators [17], politicians have extensively used this indicator, probably due to its simplicity and its assumed relationship with well-being, as stated in the following extract:
“No doubt it’s better to be ‘happy’ than ‘miserable.’ As Arthur Okun anticipated over 50 years ago, the Misery Index provides politicians with a useful, easy-to-understand metric of well-being as viewed through the lens of official economics statistics.”
([39])
Politicians have frequently utilized Okun’s MI not only to highlight their results but also to discredit their competitors’ achievements:
“This index has been found useful, particularly by politicians. McGovern used the Economic Discomfort Index in deriding Nixon during the 1972 campaign. Then Carter used it in deriding Ford in 1976. Reagan renamed it the ‘Economic Misery Index’ in deriding Carter in 1980. Mondale invoked the index in deriding Reagan in 1984 and Clinton in deriding Bush in 1992. The Economic Report of the President for 1997 displayed the Misery Index on its first chart”.
([11] p. 2)
Furthermore, in one of its versions, the Political Business Cycle (PBC) theory recognizes the Misery Index as a determinant reversely related to the electoral results of the incumbent political party; that is, the higher the Misery Index, the fewer votes the incumbent party receives [4]. Effectively, in the PBC model, it is assumed that both unemployment and inflation cause disutility in voters. Actually, the traditional version of the PBC states the following:
“[…] governments can directly control unemployment and inflation is simply a residual change from movement along the short-run Phillips Curve. Thus, the traditional PBC model predicts lower unemployment and higher inflation. This choice, though, depends on the slope of the Phillips Curve and voter utility functions.”
([44] p. 997)
Okun’s index, however, by assigning the same weight to unemployment and inflation, also assumes that such variables have the same weight in voter utility functions [44]. The Barro Misery Index, for its part, has allowed for many modifications to be made to OMI, accounting for the fact that GDP allows for the loss of well-being caused by unemployment and inflation to be compensated (see Table 1). Additionally, Barro’s index has been utilized to evaluate the mandates of different American presidents as it is considered to have great capacity to evaluate the PBC [2].
Okun’s index components have been shown to be related to electoral outcomes; for example, in a study following 365 elections in 18 highly developed economies since 1948, it was found that inflation surprises usually increase the number of votes received by parties considered to be extremists, anti-system, and populists, being particularly noticeable when real wages decrease, whereas such an effect becomes harder to identify when real wages remain stable [45].
In 2024, however, during the quarter previous to the U.S. presidential elections, Okun’s index achieved 6.8 points—only a little below the 6.9 points that, on average, the MI achieved during Trump’s first presidential term. Nonetheless, the Democrat Party lost the presidential elections of that year. A probable explanation is that the Misery Index, in its original version, no longer captures what currently makes average citizens miserable [40]. Moreover, during 2023, it was observed that although Okun’s index attempts to capture consumer well-being, it fails to capture consumer misery; although Okun’s index was decreasing, the University of Michigan’s consumer sentiment index did not recover its pre-pandemic values [46]. It is necessary to clarify that it is not possible to attribute the electoral result to the Misery Index, but this exemplifies the limits of OMI as a predictor of voter sentiment.
It is important to note that when Okun proposed the Misery Index, the Consumer Price Index (CPI) considered measures related to interest costs, but this changed after 1983 when the CPI was redesigned. More precisely, prior to its reformulation, the CPI considered “[…] homeownership variables, including housing prices and mortgage rates.” Therefore, the disconnection between the current cost of living and official inflation may explain these discrepancies [46].

4.2. Okun’s Misery Index as a Poverty Index

From a macroeconomic perspective, Okun’s index has also been considered an interesting alternative tool with which to measure poverty [43]. More precisely, OMI has been proposed to be not only a different poverty index, but also a pioneering approach to measuring poverty via the loss in general economic welfare, as stated in the following paragraph:
“Completely different, a kind of pioneering, approach to poverty problem measurement has been presented by A. Okun. […]. In its first, original and remarkably simple version, the index specified the ‘loss in general welfare’ and level of objective economic malaise, as the unweighted sum of the annual inflation and unemployment rate. It is so simple that it seems to be tempting to reject Okun’s idea of Economic Discomfort Index as a gross oversimplification.”
([47] p. 2)
Grabia [43] comments that OMI’s simplicity is its main advantage in measuring poverty, but recognizes that this is also a significant drawback, as OMI is frequently criticized on the basis of its excessive simplification. In this context, Barro [34] amended Okun’s index by including the long-term interest rate and the economic growth rate (Table 1). Although the new variables included by Barro reflect both economic and social welfare [47], long-term interest rates can have different effects on an economy: they may foster savings but induce financial stress in debtors [2], in addition to being closely related to inflation [47].
On the other hand, as a poverty measure, OMI should be classified as an objective indicator as its value does not depend on citizens’ perceptions of their own socioeconomic situation. OMI should also be considered an objective monetary indicator of poverty, as such indicators are completely related to the capacity of income to allow individuals to achieve the minimum living conditions [6].
Economic misery undoubtedly diminishes all dimensions of human development. Such an influence has proven to be relatively stronger in highly developed nations than in those with medium and low human development. The negative effects are particularly noticeable in areas such as education, health, and standard of living, whereas it seems not to have a significant impact on life expectancy [48]. The importance of measuring misery, independently of the value achieved by the Misery Index, lies in its evolution over time. In this context, it is assumed that when measuring a society’s loss of well-being, increases in misery will be associated with increases in poverty [49].
In Latin America, however, using a correlation matrix that considers 18 countries, it has been found that during the periods 1980–1989 and 1990–1999, neither the Okun nor the Barro indices were found to be associated with poverty. However, during the period 2000–2010, OMI showed a weak and positive association, using a poverty line of 1.99 USD Purchasing Power Parity (PPP). However, there was no association when the poverty threshold moved to 6.85 USD PPP, although there was weak association with Barro’s MI. Finally, in the period 2011–2021, OMI did not show any association with poverty, while lack of income was associated with Barro’s index [49].
A significant issue when measuring Okun’s index in Latin America is that the informal labor sector employs an elevated percentage of the labor force [49]. Informality hides the actual unemployment rates, making it difficult to obtain an adequate measure of economic misery. Consequently, efforts to include the rate of informal occupation as another macroeconomic indicator with which to estimate the Misery Index have been carried out (see Table 1). It is necessary, however, to consider that informality often originates in economic necessity; but over time, it can become a strategy for evading taxes and bureaucratic obstacles [36].
According to empirical estimations performed by Hanke’s [41] for the year 2024, the ten most miserable countries in the world were Sudan, Argentina, Syria, Yemen, Turkey, Venezuela, Zimbabwe, Lebanon, Malawi, and Eswatini. Hanke’s estimation highlights nations such as Sudan, Argentina, and Zimbabwe, which captures severe macroeconomic instability caused by civil unrest, high unemployment, and rapid currency depreciation. It is important to note that the most miserable country of 2024 was Sudan, which was attributed to the destruction caused by the war.
In European countries, poverty has usually been measured by poverty lines, i.e., a poverty threshold utilized to determine the minimum amount of disposable income required to attain a standard of living. Empirical approaches to obtain correlation coefficients of both OMI and Barro’s index with poverty in Europe have led to the conclusion of low correlation [47].

4.3. Interdisciplinary Applications of the Misery Index

Despite being extensively criticized due to its simplicity, OMI, with its numerous modifications, has had a number of interdisciplinary applications. For instance, it has been shown that the number of suicides is related to OMI [50]. However, it has also been empirically proven that unemployment explains the incidence of suicides as much as Okun’s index does [51].
Even more, it has been found that “[…] emission abatement and climate risk mitigation programs can reduce economic misery by moderating climate change effects” [52] (p. 648). Equally, it has been suggested that the higher the MI, the greater the number of people who gamble in lottery games [53]. In fact, in the case of Türkiye, it has been noted regarding the middle social classes: “To mitigate future uncertainty, they engage in speculative ventures, such as games of chance and entrepreneurial pursuits and act beyond what has been considered safe, rational, or secure economic activities” [54] (p. 46).
The Misery Index has been proven to reduce consumer confidence. In the case of Mexico, Percastre [55], using a short-run structural vector autoregressive model, showed that Okun’s index diminishes the consumer confidence index. In the same vein, Sánchez and Arias Guzmán [56], using an ARDL model, showed that OMI negatively impacts the consumer confidence indicator in the long-run, but they did not find evidence of the Okun’s index impacting consumer confidence in the short-run.
However, throughout 2023, the MI decreased while consumer sentiment remained low. This fact poses a challenge to the commonly assumed relationships between inflation, unemployment, and consumer confidence. Explanations of this economic phenomenon have revolved around the following issues:
“[…] home prices remain at historic highs despite higher interest rates, the interest payment on a new 30-year mortgage for the average house has increased more than threefold since 2021 […]. The interest payment on a new car loan has increased more than 80 percent […] since the start of the pandemic. It is not surprising that this would affect how consumers feel about the economy”.
([46] p. 2)
The discrepancies in the MI and consumer sentiment in the U.S. may be explained by the differences between official measures of inflation and the actual cost of living.
Numerous studies have shown that economic growth is related to economic misery in both the long and the short run. In the case of Mexico, it has been shown that in the short-run, the MI reduces economic growth when measured as the growth rate of real GDP, and vice versa [55]. Similar results have been obtained using monthly data, but this time, the approach to economic growth was carried out by the Global Indicator of Economic Activity [57]. It was also found that in the case of Pakistan, OMI is among the main determinants of GDP [58].
Using the CMI, it was found that in the case of Mexico, tourism plays a significant role in reducing economic misery. In the short-run, the arrival of international visitors diminishes the CMI, but there is no statistical effect the other way around [19]. Also in the short-run, increases in the CMI diminish outbound tourism, but outbound tourism does not have any effect on the CMI [22]. Meanwhile, in the long-run, international tourists arrivals help to reduce OMI [20].
More importantly, Okun’s index has been used as a measure of macroeconomic distress to assess deposit dollarization in Türkiye. The study found that, over time, the Misery Index explains dollarization, and that dollarization strengthens inflationary pressures and induces distortions in the labor market [59].

5. Estimations of Okun’s Misery Index

5.1. Okun’s Misery Index in the USMCA Countries

This section, aiming to estimate Okun’s index of all three nations in the USMCA, utilizes the “Inflation rate, average consumer prices (annual percent change),” provided by the International Monetary Fund [60], and the “Unemployment, total (% of total labor force) (modeled ILO estimate),” provided by the World Bank [61]. The results are summarized in Figure 1.
In Canada, Okun’s index achieved its maximum value during 1991. In fact, Canada suffered from relatively high inflation rates until 1992. From 1992 to 2020, inflation was brought under control and started to oscillate near 0 and under 3 points, causing Okun’s index to reduce. Meanwhile, the unemployment rate also decreased since 2017, but this was due to demographics and the aging population. Nonetheless, the rise in OMI in 2020 is attributed to the unemployment created by the COVID-19 pandemic [62].
It was in 2021 when inflation started to rise, causing concern among Canadians. In fact, Clemens et al. [62] (p. 1) mentioned that “Canadians are now rightly concerned with inflation, our Misery Index, and our comparative performance with other industrialized countries.” In addition, in Figure 1, we can see that Canada’s OMI started to decrease after 2022; however, it remained above the value achieved in 2019.
In Mexico, Lustig [63] describes how in December 1994, under conditions of doubt concerning Mexican peso parity strength and with international reserves plummeting, there was no option other than to devalue the Mexican peso. Moreover, given the excessive reduction in international reserves, plus the capital flight of 5 billion dollars, the devaluation became uncontrollable, forcing the implementation of a free-floating exchange regime. The loss of well-being generated by the devaluation was reflected in OMI, which reached its highest values in 1995 and 1996 (Figure 1).
During the international financial crisis, Okun’s index in the U.S. reached its highest values of the study period. Even though the North American Free Trade Agreement (NAFTA) increased trade among its three members to unprecedented levels, it was not sufficient to protect such nations from an also unprecedented economic crisis [64]. As expected, all three nations in the NAFTA achieved higher OMI values compared to the previous years. In particular, during 2008, the US achieved an OMI of 9.58 points, but the country would attain its highest OMI values during 2010 (11.23 points) and 2011 (12.04 points), only comparable to those achieved during the COVID-19 outbreak (Figure 1).
A remarkable point to note is that in recent years, Mexico has had a similar OMI to those of its trade partners. Such results seem contradictory in light of the difficulties that Latin American and Caribbean labor markets face in generating formal employment. In these economies, however, many people look to informal labor in order to earn a living and to ameliorate precarious living conditions [65]; consequently, actual unemployment rates are obscured [36].

5.2. A Comment on the Compensated Misery Index

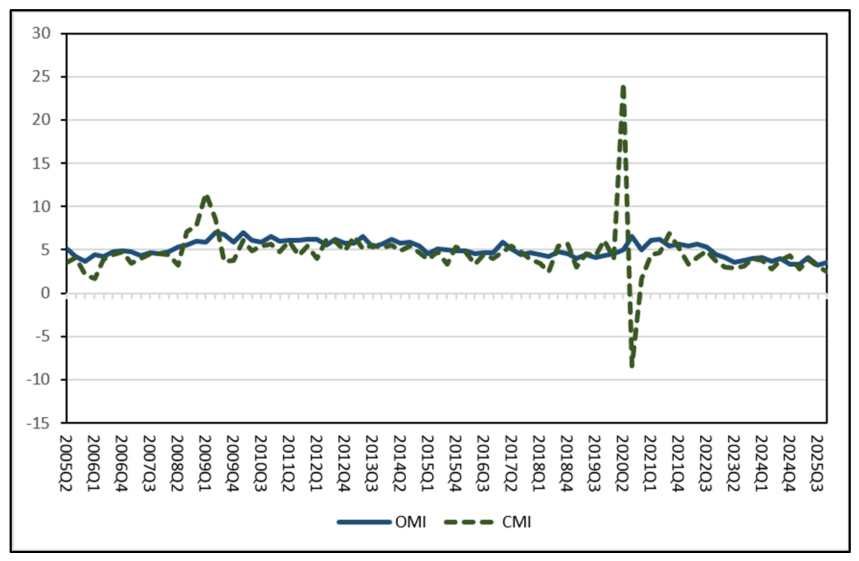
Using data retrieved from the National Institute of Statistics and Geography [66], OMI and M I 10 , which is also known as the Compensated Misery Index (CMI), were estimated for Mexico during the period 2005Q2–2025Q4 (Figure 2). All the data necessary to calculate both OMI and the CMI were seasonally adjusted using the Census-X12 filter.
In 2020, Mexico went through one of its deepest crises following the lockdown initiated in response to the COVID-19 outbreak. During that year, between April and June 2020, Mexican GDP underwent its sharpest registered fall [67], causing the CMI to achieve its highest value in the period during 2020Q2. However, in 2020Q3, the economic recovery led to the CMI becoming negative (Figure 2).
Table 2 reveals that during 2020Q3, the real GDP was below the value obtained during 2020Q1 and considerably higher than that obtained during 2020Q2, implying a significantly large rate of economic growth, which caused the CMI to become negative for 2020Q3, as the real GDP growth rate surpassed the sum of the inflation and unemployment rates.
A negative CMI, such as that obtained in this case, makes it difficult to interpret the results. Effectively, in 2020Q3, despite attaining a high growth rate, real GDP remained below the level achieved in 2020Q1. Here, the results in Figure 2 indicate that during times of economic recovery, it is necessary to be cautious when analyzing CMI results, as very low values might not be indicative of a decrease in economic malaise. It is necessary to analyze the behavior of all three CMI components to obtain accurate conclusions because, given the functional form of the CMI (Table 1), deflation can also induce reduced values.

6. Summary

The Misery Index, as stated in this paper, has not only been criticized for its simplicity but also for the difficulty faced in relating it to specific policy actions, as many variables have different effects on the different components of the index. In the same vein, Okun’s index, in its standard version, overlooks the effects of deflation, which “[…] may be just as painful as inflation itself” [11] (p. 2). Moreover, given the simplicity of Okun’s index, along with its other shortcomings, it is understood to lack a sufficiently robust scientific framework, even though its practical relevance has been recognized [43]. Furthermore, OMI’s capacity to reflect the average citizen’s feelings towards the economic environment has been questioned [40], as well as its pertinence in analyzing consumer misery [46].
The issues mentioned above have caused certain researchers to attempt to modify Okun’s index by including macroeconomic indicators such as the long-term interest rate, the GDP growth rate, and indicators of income distribution. However, as shown in Figure 2, some of these modifications fail, under certain circumstances, to maintain a positive Misery Index value, which makes it hard to analyze the index from a traditional perspective.
The Misery Index has proven to be an adequate explanatory variable for social phenomena such as outbound tourism, electoral results, and individuals’ propensity to gamble. In the same vein, different variables have been utilized to explain variations in Okun’s index, such as inbound tourism, real GDP, and the real exchange rate. However, it has also been observed that certain variables exert opposite effects on the components of this index; for example, government spending would normally reduce unemployment but cause inflation [13].
The above suggests that OMI, despite its shortcomings, is related to various aspects of human activity; therefore, rather than suggesting that we stop using this indicator, it is necessary—following Dolan [40] (see Table 1)—to look for macroeconomic variables capable of pinpointing what makes average people miserable. Future research concerning Okun’s index should, for example, be focused on the different occupancy rates produced by official statistics offices, or on finding more ways to include indicators related to income distribution. The CMI of Mexico illustrates that it is necessary to carefully revise OMI’s components in order to perform accurate analyses.
Finally, further research needs to focus on developing viable Misery Indices that account for indicators of precarious employment, income distribution, and other variables relevant to economic welfare in order to obtain more appropriate conclusions concerning a society’s well-being.

Funding

This study received no external funding.

Institutional Review Board Statement

Not applicable.

Informed Consent Statement

Not applicable.

Data Availability Statement

The data that support the findings of this study are openly available at Mendeley Data (https://doi.org/10.17632/3h5yx4hc7r.1, accessed on 3 July 2026).

Conflicts of Interest

The author declares no conflicts of interest.

Appendix A

Table A1. Summary Table.
IndexPublication YearObjective
Wiseman [30]1992The objective of this index is to take into consideration the effects of deflation on economic misery.
Lovell and Tien [11]2011
Zaleski [31]1990The objective of this index is to be consistent with the behavioral assumption that “[…] the marginal rate of substitution of unemployment for inflation increases as unemployment increases. In other words, society prefers moderate values of these twin evils as opposed to an extremely low value for one at the expense of an extremely high value for the other.”
Yang [33]1992The objective of this index is to present a generalized version of the Misery Index that could explain the high inflation rates in Latin America.
Wiseman [30]1992Wiseman [30] includes the natural rate of unemployment to the existent misery indices.
Asher et al. [13]1993The index proposed by Asher et al. [30] aims to include distribution justice criteria into OMI.
Barro [34]1999This index amends OMI in order to consider elements that also contribute to increasing misery in a society, with its main application being in the Political Business Cycle [2].
Hortalà and Rey [2]
Gaddo [35]
2011The index simplifies Barro’s index by eliminating the interest rate and considering the real GDP growth rate.
Cohen et al. [3]2014The objective of the Misery Index proposed by Cohen et al. [3] is to amend the original index by incorporating the output gap in growth terms and cyclical unemployment. Its dynamic specification allows for distinguishing between the short and the long term. Another feature of this index is that it gives more weight to output and unemployment than it does to inflation.
Błaszczyk [37]2015Błaszczyk [37] proposed three different indices in approaching the so-called “Macroeconomic Condition Index” to evaluate post-crisis conditions in the Eurozone during the 2008–2013 period.
Murphy [38]2016The objective of Murphy’s index is to present a regional approach to OMI.
Hanke [39,41]2021, 2025Hanke [39,41] modifies the Barro Misery Index by including the GDP per capita growth rate.
Dolan [40]2024The objective of Dolan [40] is to propose “[…] a 21st misery index” that captures the factors that make people miserable.
Gakuru and Yang [42]2025This index proposes adding the exchange rate with the objective of reflecting the effect of the local currency value on both trade and investment.

References

  1. Nessen, R. The Brookings Institution’s Arthur Okun—Father of the “Misery Index.” The Brookings Institution. 2008. Available online: https://www.brookings.edu/articles/the-brookings-institutions-arthur-okun-father-of-the-misery-index/ (accessed on 7 December 2025).
  2. Hortalà, J.; Rey, D. Relevancia del índice de malestar económico. Cuad. Econ. 2011, 34, 162–169. [Google Scholar] [CrossRef] [Scilit]
  3. Cohen, I.K.; Ferretti, F.; McIntosh, B. Decomposing the misery index: A dynamic approach. Cogent Econ. Financ. 2014, 2, 991089. [Google Scholar] [CrossRef] [Scilit]
  4. Dornbusch, R.; Fischer, S.; Startz, R. Macroeconomía; McGraw-Hill: Madrid, Spain, 2002. [Google Scholar]
  5. Golden, J.M.; Orescovich, R.; Ostafin, D. Optimality in the short-run Phillips curve: A misery index criterion, a note. Am. Econ. 1987, 31, 72. [Google Scholar] [CrossRef] [Scilit]
  6. Riascos, J.C. El índice de malestar económico o índice de miseria de Okun: Breve análisis de casos, 2001–2008. Tendencias 2009, 10, 92–124. [Google Scholar]
  7. Sánchez, F. Índice de miseria de Okun: Una aproximación para México. In Pobreza y Desigualdades en México: Revisión Teórica y Ejercicios Prácticos; Cruz, J.N., Ed.; Instituto de Investigaciones Económicas—UNAM: Mexico City, Mexico, 2020; pp. 155–181. [Google Scholar] [CrossRef] [Scilit]
  8. Büyüksarıkulak, A.M.; Suluk, S. The misery index: An evaluation on fragile five countries. Abant Sos. Bilim. Derg. 2022, 22, 1108–1123. [Google Scholar] [CrossRef] [Scilit]
  9. Popova, O.; See, S.G.; Nikolova, M.; Otrachshenko, V. The Societal Costs of Inflation and Unemployment; IZA Discussion Paper No. 16541; IZA—Institute of Labor Economics: Bonn, Germany, 2023. [Google Scholar]
  10. Winkelmann, L.; Winkelmann, R. Why are the unemployed so unhappy? Evidence from panel data. Economica 1998, 65, 1–15. [Google Scholar] [CrossRef] [Scilit]
  11. Lovell, M.C.; Tien, P. Economic discomfort and consumer sentiment. East. Econ. J. 2000, 26, 1–8. [Google Scholar]
  12. Varian, H.R. Intermediate Microeconomics: A Modern Approach; W. W. Norton & Company: New York, NY, USA, 2014. [Google Scholar]
  13. Asher, M.A.; Defina, R.H.; Thanawala, K. The Misery Index: Only part of the story. Challenge 1993, 36, 58–62. [Google Scholar] [CrossRef] [Scilit]
  14. Di Tella, R.; MacCulloch, R.J.; Oswald, A.J. Preferences over inflation and unemployment: Evidence from surveys of happiness. Am. Econ. Rev. 2001, 91, 335–341. [Google Scholar] [CrossRef] [Scilit]
  15. Blanchflower, D.G.; Bell, D.N.F.; Montagnoli, A.; Moro, M. The happiness trade-off between unemployment and Inflation. J. Money Credit Bank. 2014, 46, 117–141. [Google Scholar] [CrossRef] [Scilit]
  16. Arge, J.S.P. Inflation, Unemployment, and Happiness: Misery Index Weights in Europe. Master’s Thesis, Lund University, Lund, Sweden, 2022. [Google Scholar]
  17. Wooten, J. Economists Love the Misery Index. Monday Morning Economist. 2024. Available online: https://www.mondayeconomist.com/p/economists-love-the-misery-index (accessed on 14 December 2025).
  18. Wu, P.C.; Liu, S.Y.; Pan, S.C. Does misery index matter for the persistence of health spending? Evidence from OECD countries. Soc. Indic. Res. 2014, 118, 893–910. [Google Scholar] [CrossRef] [Scilit]
  19. Sánchez, F. The effect of international visitors on poverty alleviation in Mexico: An approach from the misery index. J. Appl. Econ. 2022, 25, 839–855. [Google Scholar] [CrossRef] [Scilit]
  20. Sánchez, F. Tourism and economic misery: Theory and empirical evidence from Mexico. Economies 2024, 12, 88. [Google Scholar] [CrossRef] [Scilit]
  21. Sánchez, F.; Arias Guzmán, E.J. Assessing the Impact of the Real Exchange Rate on Okun’s Misery Index in Mexico. Economies 2025, 13, 168. [Google Scholar] [CrossRef] [Scilit]
  22. Sánchez, F. Measuring the effect of the misery index on international tourist departures: Empirical evidence from Mexico. Economies 2022, 10, 81. [Google Scholar] [CrossRef] [Scilit]
  23. Krugman, P.; Obstfeld, M.; Melitz, M.J. International Economics: Theory and Policy; Pearson: London, UK, 2023. [Google Scholar]
  24. Bakhshi, Z.; Ebrahimi, M. The effect of real exchange rate on unemployment. Mark. Brand. Res. 2016, 3, 4–13. [Google Scholar] [CrossRef] [Scilit]
  25. Okun, A.M. Potential GNP: Its Measurement and Significance. In Proceedings of the Business and Economic Statistics Section; Cowles Foundation, Paper 190, Reprinted from 1962; American Statistical Association: Alexandria, VA, USA, 1962. [Google Scholar]
  26. Gaite, P.; Marturet, T.N. Enseñanzas del modelo de Krugman y Taylor (1978). Cuad. De Econ. Crítica 2022, 8, 165–176. [Google Scholar]
  27. Loría, E.; Sánchez, F.; Salas, E. Efectos de la llegada de viajeros internacionales en el desempleo y el crecimiento económico en México, 2000.2–2015.2. El Periplo Sustentable 2017, 32, 1–24. [Google Scholar]
  28. Sánchez, F. Unemployment and growth in the tourism sector in Mexico: Revisiting the growth-rate version of Okun’s Law. Economies 2019, 7, 83. [Google Scholar] [CrossRef] [Scilit]
  29. Acerenza, M.A. Problemas Económicos, Socioculturales y Ambientales del Turismo; Trillas: Mexico City, Mexico, 2006. [Google Scholar]
  30. Wiseman, C. More on misery: How consistent are alternative indices? A comment. Am. Econ. 1992, 36, 85–88. [Google Scholar] [CrossRef] [Scilit]
  31. Zaleski, P.A. On the optimal level of macroeconomic misery: A comment. Am. Econ. 1990, 34, 90–91. [Google Scholar] [CrossRef] [Scilit]
  32. Golden, J. Yet more on misery: Optimization along the short-run Phillips curve revisited, a comment on recent papers. Am. Econ. 1994, 38, 92–94. [Google Scholar] [CrossRef] [Scilit]
  33. Yang, B. Optimality on the short-run Phillips curve revisited. Am. Econ. 1992, 36, 89–91. [Google Scholar] [CrossRef] [Scilit]
  34. Barro, R.J. Reagan vs. Clinton: Who’s the Economic Champ? Business Weak, 22 February 1999. Available online: https://barro.scholars.harvard.edu/sites/g/files/omnuum5936/files/barro/files/bw99_02_22.pdf (accessed on 21 December 2025).
  35. Gaddo, F. An International Analysis of the Misery Index; Fondazione Magna Carta: Rome, Italy, 2011. [Google Scholar]
  36. Ramoni-Perazzi, J.; Orlandoni-Merli, G. El índice de miseria corregido por informalidad: Una aplicación al caso de Venezuela. Ecos De Econ. 2013, 17, 29–49. [Google Scholar] [CrossRef] [Scilit]
  37. Błaszczyk, P. Post-crisis macroeconomic comparative assessment of the Eurozone Member States with the use of an improved Misery Index. J. Bus. Econ. Policy 2015, 2, 135–144. [Google Scholar]
  38. Murphy, R.H. A short empirical note on State Misery Indexes. J. Reg. Anal. Policy 2016, 46, 186–189. [Google Scholar]
  39. Hanke, S.H. Hanke’s 2020 Misery Index: Who’s Miserable and Who’s Happy? Cato Institute: Washington, DC, USA, 2021; Available online: https://www.cato.org/commentary/hankes-2020-misery-index-whos-miserable-whos-happy (accessed on 21 December 2025).
  40. Dolan, E. Could a New Misery Index Help Explain the Election Outcome? Niskanen Center: New York, NY, USA, 2024; Available online: https://www.niskanencenter.org/could-a-new-misery-index-help-explain-the-election-outcome/ (accessed on 7 April 2026).
  41. Hanke, S.H. Hanke’s 2024 Misery Index: An Economic Ranking of Countries; Independent Institute: Oakland, CA, USA, 2025; Available online: https://www.independent.org/article/2025/02/28/hankes-2024-misery-index/ (accessed on 24 December 2025).
  42. Gakuru, E.; Yang, S. Misery Index improvement: A review based on theoretical and empirical evidence. J. Knowl. Econ. 2025, 16, 3970–3995. [Google Scholar] [CrossRef] [Scilit]
  43. Grabia, T. The Okun Misery Index in the European Union Countries from 2000 to 2009. Comp. Econ. Res. Cent. East. Eur. 2011, 14, 97–115. [Google Scholar] [CrossRef] [Scilit]
  44. Heckelman, J.C.; Berument, H. Political business cycles and endogenous elections. South. Econ. J. 1998, 64, 987–1000. [Google Scholar] [CrossRef] [Scilit] [PubMed]
  45. Federle, J.; Mohr, C.; Schularick, M. Inflation Surprises and Election Outcomes; Kiel Working Paper No. 2278; Kiel Institute for the World Economy: Kiel, Germany, 2024. [Google Scholar]
  46. Bolhuis, M.A.; Cramer, J.N.L.; Schulz, K.O.; Summers, L.H. The Cost of Money is part of the Cost of Living: New Evidence on the Consumer Sentiment Anomaly; Working Paper 32163; National Bureau of Economic Research: Cambridge, MA, USA, 2024. [Google Scholar] [CrossRef] [Scilit]
  47. Lechman, E. Okun‘s and Barro‘s Misery Index as an Alternative Poverty Assessment Tool. Recent Estimations for European Countries; MPRA Paper No. 37493; Munich Personal RePEc Archive: Munich, Germany, 2009. [Google Scholar] [CrossRef] [Scilit]
  48. Singh, J. Does economic misery stifle human development? Empirical evidence from Asian countries. GeoJournal 2024, 89, 116. [Google Scholar] [CrossRef] [Scilit]
  49. Medina, F. El índice de Miseria de Okun: Una Aproximación al Malestar Social en América Latina 1970-2021; Serie Documentos de Trabajo 01/2023; Instituto Universitario de Análisis Económico y Social—Universidad de Alcalá: Alcala, Spain, 2023. [Google Scholar]
  50. Yang, B.; Lester, D. The Misery Index and Suicide. Psychol. Rep. 1992, 84, 1086. [Google Scholar] [CrossRef] [Scilit] [PubMed]
  51. Yang, B.; Lester, D. The misery index and an index of misery. Atl. Econ. J. 1992, 20, 98. [Google Scholar] [CrossRef] [Scilit]
  52. Iliyasu, J.; Mamman, S.O. Climate change and human economic misery in West Africa: Evidence from a tail-dependence model. Clim. Dev. 2024, 17, 648–656. [Google Scholar] [CrossRef] [Scilit]
  53. Özcan, S.E.; Açıkalın, S. Relationship between Misery Index and Lottery Games: The Case of Turkey. Int. J. Humanit. Soc. Sci. 2015, 5, 159–164. [Google Scholar]
  54. Hassan, W. The Lottery and the middle class: Navigating the boundaries of risk-taking and class-making in Istanbul. Anthropol. Middle East 2023, 18, 46–68. [Google Scholar] [CrossRef] [Scilit]
  55. Percastre, A.M. Efecto del Índice de Miseria Sobre la Confianza del Consumidor: Un Análisis para México. Bachelor’s Thesis, Facultad de Ciencias-UNAM, Mexico City, Mexico, 2018. [Google Scholar]
  56. Sánchez, F.; Arias Guzmán, E.J. Modeling the relationship between the Misery Index and consumer confidence in Mexico using an ARDL approach. Probl. Desarro. 2026, 57, 123–150. [Google Scholar] [CrossRef] [Scilit]
  57. Cruz Marcelo, J.N.; Sánchez López, F. Efecto del Índice de Miseria de Okun en la Actividad Económica de México: 2005.01–2015.06; 5° Congreso Nacional de Ciencias Sociales “La Agenda Emergente de las Ciencias Sociales: Conocimiento, Crítica e Intervención”; Consejo Mexicano de las Ciencias Sociales—Universidad de Guadalajara: Guadalajara, Mexico, 2016. [Google Scholar]
  58. Wang, N.; Muhammad, M.H.; Ali, K.; Abbas, S.; Ullah, S. Financial structure, misery index, and economic growth: Time series empirics from Pakistan. J. Risk Financ. Manag. 2019, 12, 100. [Google Scholar] [CrossRef] [Scilit]
  59. Özcul, G.; Gök, I.Y. Assessing the link between the Misery Index and dollarization: Regional Evidence from Türkiye. J. Risk Financ. Manag. 2026, 19, 93. [Google Scholar] [CrossRef] [Scilit]
  60. International Monetary Fund. Inflation Rate, Average Consumer Prices: Annual Percent Change. 2026. Available online: https://www.imf.org/external/datamapper/PCPIPCH@WEO/ZWE?zoom=ZWE&highlight=ZWE (accessed on 27 April 2026).
  61. World Bank. Unemployment, Total (% of Total Labor Force) (Modeled ILO Estimate); World Bank Development Indicators: Washington, DC, USA, 2026; Available online: https://data.worldbank.org/indicator/SL.UEM.TOTL.ZS (accessed on 27 April 2026).
  62. Clemens, J.; Palacios, M.; Li, N. The Misery Index Returns; Fraser Institute: Vancouver, Canada, 2022. [Google Scholar]
  63. Lustig, N. México y la crisis del peso: Lo previsible y la sorpresa. Comer. Exter. 1995, 45, 374–382. [Google Scholar]
  64. Díaz-Bautista, A. La crisis económica del 2009, las remesas y el desempleo en el área del TLCAN. Ra Ximhai 2009, 5, 39–48. [Google Scholar] [CrossRef] [Scilit]
  65. Varela, R.; Retamoza, R.R. Informalidad laboral, crecimiento económico y gasto público en México, 2005–2019. Ens. Rev. Econ. 2021, 42, 57–82. [Google Scholar] [CrossRef] [Scilit]
  66. INEGI. Banco de Información Económica. 2026. Available online: https://en.www.inegi.org.mx/app/indicadores/?tm=3 (accessed on 29 March 2026).
  67. Cota, I. La Economía Mexicana se Desploma un 17,3% en el Segundo Trimestre de 2020, la Peor Caída de su Historia. El País, 30 July 2020. Available online: https://elpais.com/mexico/economia/2020-07-30/la-economia-mexicana-se-desploma-un-173-en-el-segundo-trimestre-de-2020-la-peor-caida-de-su-historia.html (accessed on 27 April 2026).
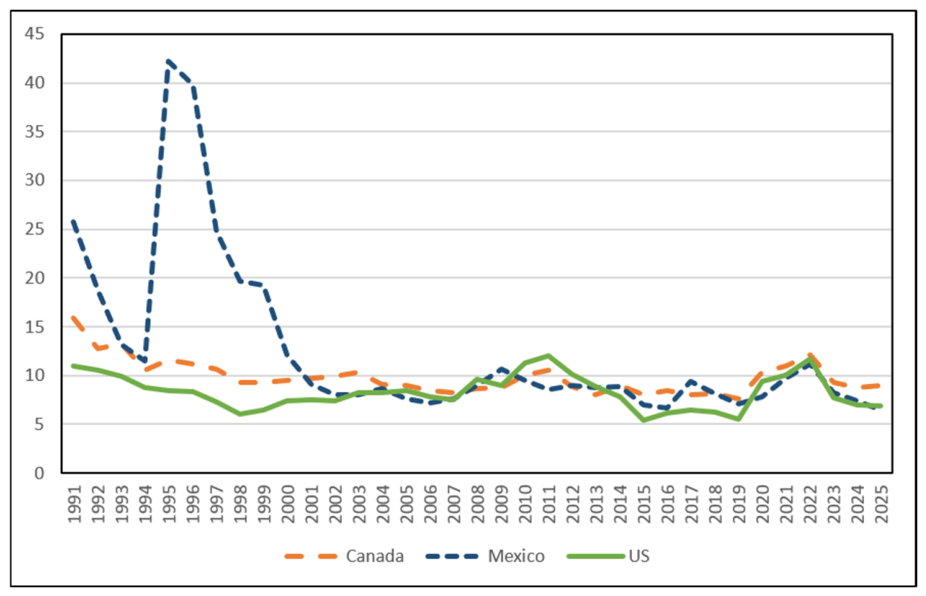
Figure 1. Canada’s Misery Index.
Encyclopedia 06 00149 g001
Figure 2. Mexico’s quarterly Okun’s Misery Index and Compensated Misery Index (2005Q2–2025Q4).
Encyclopedia 06 00149 g002
Table 1. Okun’s Misery Index specifications.
SourceMisery IndexExplanation
Lovell and Tien [11]
Wiseman [30]
M I 1 = U + π M I 1 utilizes the absolute value of the inflation rate to take into consideration the adverse effects of deflation on a society [11]. However, Wiseman [30] (p. 85) mentions that Okun’s index “[…] is the sum of the absolute value of the inflation rate and the aggregate rate of unemployment in the economy”
Zaleski [31] M I 2 = U 2 + π 2 According to Zaleski [31], the assumption of preferences between inflation and unemployment postulated in [5] establishes that people are often more disposed to tolerate unemployment increases to reduce inflation whenever inflation is high relative to unemployment. Conversely, citizens may desire more inflation to reduce unemployment.
However, Zaleski [31] argues that OMI is not consistent with such behavioral assumptions, as they suggest that the MRS of unemployment for inflation increases as unemployment increases; therefore, Zaleski proposes the use of M I 2 .
Nevertheless, M I 2 “[…] also has the property that the optimal unemployment rate […] is larger than the inflation rate” ([32] p. 92).
Yang [33] M I 3 = ϖ π π + ϖ U U In M I 3 , ϖ π and ϖ U , respectively, represent the weights for inflation and unemployment, which are established by the policymaker under the restrictions of ϖ π 1 and ϖ U 1 . Therefore, such weights mirror the preferences of the policymaker, while their absolute size reflects the strength of such preferences [33]. In the M I 3 specification, we have an M R S = ϖ U ϖ π [32].
Wiseman [30] M I 4 = π + U U n According to Wiseman [30], M I 4 recognizes the natural rate of unemployment ( U n ) .
In this index, deviations of unemployment from its natural rate contribute to misery. It is also possible to note that if U = U n , then M I 4 = π .
Wiseman [30] M I 5 = π + U U n i f   U > U n π i f   U U n According to Wiseman [30], economic misery increases when U > U n , whereas if the unemployment rate is below the natural rate, misery remains invariant.
Given that a natural unemployment rate between 2% and 4% is perceived as normal [5], only rates above this range should increase the index [30].
Wiseman [30] M I 6 = π 2 + U U n 2 i f   U > U n π 2 i f   U U n Following Wiseman [30], M I 2 fails to take into consideration the natural rate of unemployment; therefore, M I 6 is a specific modification implemented to correct such an eventuality.
Wiseman [30] M I 7 = π 2 + K U U n 2 i f   U > U n π 2 i f   U U n According to Wiseman [30], there is evidence suggesting that people prefer inflation over high rates of unemployment, and M I 7 introduces this feature. In M I 7 , K is a constant such that K > 1 .
Following Wiseman [30] (p. 86), “This gives indifference curves which are elliptical and symmetrical about i   =   0 and U   =   U n , with foci on U   =   U n . The absolute values of the curves’ i -axis intercepts are equal to K times the excess of their U -axis intercepts over U n .” In this paragraph, i refers to the inflation rate.
Asher et al. [13] M I 8 = P o v e r t y   R a t e + G i n i   I n d e x + O M I = P A I N   i n d e x + O M I In [13], an index of distributive justice is proposed. This index consists of adding together the Gini Index and the poverty rate. It is called the “Poverty and Inequality (PAIN) Index.”
Asher et al. [13] (p. 61) considered that “A more comprehensive assessment of economic trends should include indicators of both macroeconomic performance and economic justice,” so they added together OMI and the PAIN index to create a new economic measure. It is worth noting that the authors apply alternative weighting schemes to both the PAIN index and OMI.
Barro [34] M I 9 = U + π + L o n g t e r m i n t e r e s t   r a t e + G D P S h o r t f a l l Barro [34] mentions that misery increases “[…] if the inflation rate rose, if the unemployment rate went up. If long-term interest rate increased, and if the growth rate of real GDP was below average.”
It is important to note that Barro [34] utilizes changes in the variables during specific moments in presidential terms analyzed to estimate M I 9 .
Hortalà and Rey [2]
Gaddo [35]
M I 10 = U + π y ˙ M I 10 is a modification of Okun’s index which considers the GDP growth rate y ˙ . In this index, y ˙ takes a negative sign for the index to illustrate that economic growth has positive effects on economic welfare; i.e., it reduces the index. Conversely, a negative GDP growth rate increases the index.
This index is known as the Compensated Misery Index (CMI) [2].
Ramoni-Perazzi and Orlandoni-Merli [36] M I 11 = U + I E + π In many nations, and particularly in the case of Latin America, it has been noted that the true unemployment level is masked by high rates of informality.
In this context, M I 11 is designed to capture the misery caused by informality, as, many times, the informal sector provides the only avenue to employment for those excluded from the labor market [36]. In M I 11 , I E represents informal employment.
Cohen et al. [3] M I 12 = U t 1 β g t g * + π t 1 α U t U n This index is a dynamic approach to OMI, which is based on the expectations-augmented Phillips curve and a version of Okun’s “trial gaps” model (see [25]). M I 12 considers lagged values for both unemployment and inflation. It also considers the potential g * and observed GDP growth g .
Owing to its specification, “[…] the level of the population’s economic malaise, or discomfort, now depends explicitly on those underlying forces that drive the behaviour of unemployment and inflation during the course of the business cycle” [3] (p. 4).
Błaszczyk [37] M I 13 = ω 1 π + ω 2 U + ω 3 D E F ω 4 R D G D P 4 The so-called “Macroeconomic Condition Index” (MCI) mentioned by Błaszczyk [37] is approached by three different Misery Indices.
In this index, ω i ,   i = 1 , . . , 4 , represents the weights given to the MCI components. DEF is the “[…] surplus/deficit in the sector of public finance in relation to the GDP,” while RDGDP is the real GDP dynamics. The rest of the variables have the same meaning [37].
Błaszczyk [37] M I 14 = ω 1 π + ω 2 U + ω 3 D E F ω 4 R D G D P 4 In this second approach to the MCI, the variables are defined as follows:
π = π π * ;
D E F = D E F D E F * ;
= U U * ;
R D G D P = R D G D P R D G D P * .
The asterisk represents optimal values. In this index, deviations from the optimum are undesired.
Błaszczyk [37] M I 15 = ω 1   | π | + ω 2   U + ω 3   D E F ω 4   R D G D P 4 This index, which corresponds to the third approach to the MCI, considers only deviations in the inflation rate; the remaining variables do not change because, in practice, it is usually the price dynamic that is taken into account. In this case, π * may be the target inflation [37].
Murphy [38] M I 16 = C P I t C P I t 1 R P P t , i R P P t 1 , i 1 + U t , i This index was named the “State Misery Index.” In this index, C P I denotes the “Consumer Price Index,” while R P P t , i signifies “Regional Price Parity in year t and state i ” [38].
Unemployment is symbolized via the usual notation, and it is important to note that it is also defined for year t and state i .
Hanke [39] M I 17 = U + π + r y ˙ p c In M I 17 , r is the bank-lending rate, whereas y ˙ p c is the growth rate of the real GDP per capita.
Hanke [39] considered that the first three elements of this index cause people to perceive a bad economic environment, while real GDP per capita growth can be seen as a good.
Dolan [40] M I 18 = π ¯ + H P W   I n d e x + Y H + R D C C D 4 To formulate this indicator, Dolan [40] proposed converting the four M I 18 components into z-scores and then calculating their average. In M I 18 , π ¯ refers to the “Weighted average of annual inflation rates over the past four years.” The inflation rate is weighted using decreasing values: 1, 0.5, 0.25, and 0.125, respectively.
The HPW Index of the labor market refers to an indicator proposed by Sebastian Heise, Jeremy Pearce, and Jacob P. Weber. Given that such an indicator decreases as finding a job becomes harder, Dolan [40] inverted it to obtain the counter effect.
Y H symbolizes the “average years of work at average wage to buy a median-priced house.” Finally, R D C C D refers to the “Rate of Delinquency on Credit Cards Debt.”
Hanke [41] M I 19 = 2 U + π + r y ˙ p c The intuition behind M I 19 is that unemployment has a larger negative effect on average people than inflation [41]. In this index, y ˙ p c represents the growth of GDP per capita.
Gakuru and Yang [42] M I 20 = U + π + r + E X y ˙ p c Gakuru and Yang [42] added the exchange rate E X to the Misery Index. This was done to reflect the effect of the local currency value on both trade and investment.
In this index, y ˙ p c represents the real GDP per capita, and r is the bank-lending rate.
Note: The indices in this table were ordered according to the publication year of the cited source, with the exception of M I 1 , as this index has been used to modify many subsequent indices, and Wiseman [30] mentions that this specification represents Okun’s index. For a detailed visualization of M I 7 , see [30] (p. 87). Table A1 (Appendix A) summarizes the objectives and publication years for each index.
Table 2. Mexico’s real GDP (2020Q1–2020Q4).
PeriodReal GDPReal GDP Growth Rate
2020Q123,891,712.880.64
2020Q219,298,735.07−19.22
2020Q322,179,675.7714.92
2020Q422,920,479.333.34
Note: The Census-X12 filter was used to seasonally adjust the real GDP data. The real GDP growth rate was estimated with respect to the previous quarter.
Disclaimer/Publisher’s Note: The statements, opinions and data contained in all publications are solely those of the individual author(s) and contributor(s) and not of MDPI and/or the editor(s). MDPI and/or the editor(s) disclaim responsibility for any injury to people or property resulting from any ideas, methods, instructions or products referred to in the content.