1. Introduction
The rapid development of data mining and text analytics, especially in the fields of communications, linguistics, sociology, and psychology, has significantly contributed to the evolution of various families of textual analysis techniques in social science research [
1,
2,
3,
4,
5,
6]. In its early stages, a generic form of communication content analysis was used in academic works [
7,
8] that focused on the comparative or controversial narratives of historical incidents [
9], the expressions of nationalism in children’s books [
10], inaugural presidential speeches [
11,
12], the topic discovery of published academic articles [
13,
14,
15,
16], and more recently the analysis of textbooks via natural language processing [
17]. Quantitative textual analysis was often identified as the most prominent content analysis technique in testing empirical hypotheses using textual data to evaluate social theories [
5,
18,
19,
20,
21].
The main function of textual content analysis is to systematically analyze the content of different types of communication [
22,
23]. The conceptual and operational challenges of the technique have been explicitly discussed in the methodological literature. Indicatively, Shapiro and Markoff [
24] outlined the framework of definitional peculiarities of content analysis classifying them based on (a) the scientific purpose (descriptive vs. inferential vs. taxonomic), (b) the methodological orientations (quantitative vs. qualitative), (c) the extraction of contextual meaning (manifest vs. latent), (d) the unit of analysis (words, sentences, etc.), and (e) measurement quality (issues of validity and reliability).
Content analysis is a family of formal methodological techniques that systematically convert textual materials into numeric representations of manifest and latent meanings. In the last few decades, despite the obstacles to the social context of digital texts and the reliability issues of computer-assisted coding schemes, there has been an increasing interest in examining the applicability of text mining in sociological studies [
25,
26,
27,
28]. The need for hybridization of content analysis techniques was extensively discussed by Roberts [
19] who recognized the need for a methodological synthesis ascribing cultural meanings derived from textual data and validating coding schemes suitable for statistical analysis.
The scope of this paper is to trace the historical origins of traditional content analysis and exemplify the importance of epistemological and methodological syntheses consisting of traditional text analytics and mainstream multivariate techniques that have significantly contributed to the analysis of socio-cognitive and socio-cultural studies. Explicitly, I conceptually streamline the operations of the foundational models of latent semantic analysis (LSA), Entity–Aspect Sentiment Analysis (EASA), and Correspondence Analysis (CA) and conceptually assert that such operational synthesis not only detects topics, describes sentiments, and classifies sentiments within the context of topic domains, but also assesses the degree of dependence of sentiments across topic domains. Overall, this paper provides insightful information about the origins and evolution of content analysis and, grounded in socio-cognitive frameworks, presents the operational structure of a streamlined integrating model.
2. Origins of Content Analysis
Text analysis was developed as an integrated formal methodological technique in the early 1950s. It was defined as “a research technique for the objective, systematic, and quantitative description of the manifest content of communication” [
23]. Several social researchers and methodologists have argued over time that the origins of content analysis are linked to the philosophical foundations of logic, cognition, conscious understanding [
3], and rhetoric [
4]. Krippendorff [
3] pointed out the distinctions between the philosophical and empirical notions of communication content analysis. He stated that content analysis is not just a postulate but has an empirical orientation designed to explore, describe, and predict social phenomena.
Content analysis’ origins can be traced back to the philosophical postulates of communication content, semiotics, and rhetorical practices [
4]. Aristotle explained the art of communication as a conscious sensory process of objectification and interpretation of signs (semiology). More advanced postulates describing the communication process included morphemes and symbols to the content of communication analysis [
29]. Aristotle conceptualized signs as products of reflexive awareness of the environment. Signs take the form of words, images, and human artifacts shaping cognitive schemas. Such schemas ascribe manifest and covert meanings of observations, thoughts, feelings, opinions, sentiments, and aspirations [
29]. Aristotle’s postulate on communication content was based on the study of signs, the first known type of
semiotic analysis.Succeeding Aristotle’s philosophical claims on the interpretative understanding of signs, Augustine classified signs into two unique categories: the natural and the conventional. Natural signs do not intentionally signify something beyond their occurrence, but they naturally indicate an underlying condition (latency). On the other hand, conventional signs are linked to living entities that use words to comprehend and express sensory conceptions (manifestation). Many centuries had passed until the theoretical postulates on communication content were used in empirical inquiries.
In the late 1600s, the first known empirical inquiry of communication content was developed to respond to the Church’s’ concerns about the extent of non-religious content of newspaper articles. Technological advancements that occurred during the Industrial Revolution in the eighteenth and nineteenth centuries had a major impact on the intellectual growth of content analysis. The large volumes of textual data available in the press drew the attention of journalists and academicians who utilized them to analyze topics appearing in the newspapers.
The first officially recorded empirical study using quantitative textual analysis occurred at the end of the 19th century [
30], when Speed [
31] conducted a quantitative newspaper text analysis demonstrating the reluctance of New York newspapers to cover news associated with religious, scientific, and literary topics. Instead, they favored topics related to sports and gossip for extended periods [
3,
31,
32]. The first sociological study using quantitative newspaper content analysis was conducted by an African American journalist, Ida B. Wells, who analyzed several newspaper articles reporting incidents of rape of white women by African American men [
33]. For the most part, early forms of textual content analysis were utilized to analyze the content of the newspapers’ articles [
3].
A more sophisticated technique was developed during the Great War called predictive textual analysis. Predictive textual analysis was widely used as a tool of propaganda analysis during World War I, World War II, and the Korean War. One of the first reported applications of the technique took place in the United States in 1916. According to Chomsky [
34], in 1916, Woodrow Wilson’s victorious campaign was affiliated with the slogan “Peace without Victory”. The message of this slogan was meticulously adopted by millions of American pacifists who consistently stated their opposition to America’s involvement in World War I. Wilson’s administration, the Creel Commission, and the John Dewey Circle strategically propagated by employing media content to turn pacifists into pro-war fanatics. Experts on propaganda analysis introduced a very sophisticated and innovative technique, known to this day as
content analysis. Content analysis rapidly grew to be one of the prominent analytical styles of political discourse, media, and propaganda.
Without a doubt, textual content analysis was recognized by numerous scholars as a distinct methodology sharing identical properties with other popular quantitative methodologies of the time. It has been approximately 75 years since textual content analysis penetrated the traditional modules of scientific design. With the employment of sophisticated sampling techniques, well-established metrics, and cautiously constructed reliability and validity tests, content analysis appealed to a variety of academic disciplines [
5,
35]. After all, quantitative textual analysis constituted the most prominent methodological technique in formulating empirical hypotheses using solely non-numeric data. However, its variant applications across different academic disciplines have generated long-lasting debates regarding its definitional and operational structure forming two distinct camps: quantitative and qualitative text analysis.
3. Qualitative vs. Quantitative Text Analysis
Textual content analysis aims to systematically describe the manifest content of communication [
5,
19]. The conceptual and operational challenges of the technique have been explicitly discussed in methodological literature by a large group of social researchers. Most experts in the field have agreed that it constitutes a designated method for the analysis of texts, symbols, images, linguistics, semantics, syntax, and pragmatics [
24]. Textbook definitions of content analysis extensively cover the deterministic and interpretive significance of the technique. The definitional peculiarities of content analysis are based on (a) the scientific purpose (descriptive vs. inferential vs. taxonomic), (b) the methodological orientations (quantitative vs. qualitative), (c) the extraction of contextual meaning (manifest vs. latent), (d) the unit of analysis (words, texts, individuals, etc.), and (e) its measurement quality (validity and reliability).
The rise of the symbolic interactionist perspective impacted the interpretation of words, symbols, and mental images, treating such artifacts as a reliable data source suitable for analyzing socio-cognitive schemas. Textual content analysis became the foundation of qualitative methodologies such as critical analysis, interpretative analysis, ethical analysis, and more. It was not until the late 1960s that more social scientists started analyzing social realities informed by cultural aspirations. Structural perspectives—complemented by cultural explanations of social issues—penetrated the traditional sociological theoretical lens. Cultural theorists such as Michelle Lamont and Fournier [
36], Pierre Bourdieu [
37], and Jeffrey Alexander [
38] illuminated the importance of cultural interpretations in making sense of social reality. Since the mid-1990s, qualitative content analysis has been consolidated as a suitable methodology for exploring and describing socio-cultural phenomena.
Qualitative text analysis prompts analytical induction and theory formulation. In the early 1970s, content analysis entered the qualitative methodological domains and was established in the fields of ethnomethodology [
39], grounded theory [
40], critical social research [
36], historical research [
37], ethical research [
38], and phenomenological research [
39]. There are seven broad categories of qualitative content analysis, classified as follows: (a) rhetorical narrative analysis, which emphasizes the way a textual or symbolic message is presented, (b) narrative analysis, which describes characteristics of the main actors presented in the text, (c) discourse analysis, which focuses on the manifest meaning of the words and the themes created by the segments of the words (terms) appearing in texts, (d) semiotic analysis, which focuses on the meaning of textual and symbolic material, (e) interpretive analysis, which involves theory formulation via observation, conceptualization, and coding of texts, (f) conversational analysis, which is part of ethnomethodology analyzing conversation content from a naturalistic perspective, and (g) critical analysis, which examines how the characters within a given context are presented [
41].
However, the shortfall in the applicability of qualitative methodologies in theory-driven studies was recognized by McCroskey [
42]. The strength and depth of qualitative text analysis techniques on the cultural interpretations of social phenomena remain undisputable in the circles of social scientists. However, from an epistemological standpoint, there has been a strain between qualitative and quantitative text analysis experts. Various methodologists strongly assert that content analysis primarily belongs to the quantitative methodological families [
5,
21,
23,
43].
Quantitative text analysis uncovers the co-occurrence of words (or word frequencies) in the process of identifying thematic entities (topics) in large unstructured textual corpora [
24,
44]. Two vanguard approaches dominated the field of quantitative textual analysis: (1) representational text analysis and (2) instrumental text analysis. Representational text analysis occurs when researchers aim to analyze the meaning of textual corpora, while instrumental textual analysis is used when the researchers apply theories to explain the content of the text itself. Should the research objective be to classify and interpret the textual content itself based on a theoretical framework, an instrumental text analysis technique is most suited (see
Figure 1. Generic types of textual content analysis styles).
Further, quantitative and qualitative approaches to text analysis can be classified into two analytical domains: thematic and semantic [
19,
45]. With thematic text analysis, the researcher aims to identify and categorize the group of words under a theme or topic, while semantic analysis purports to exemplify the relationships and interpret the contextual meaning of themes within texts [
44]. Broad text analysis is applied in explanatory, theory-driven studies, while specific text analysis serves an exploratory research purpose. When the focus of a study is what a participant is saying, then thematic analysis is ideal, yet when the intent is to inquire about the participants’ expressions, then the focus lies on language styles or semantics [
44]. Sociologists often use text analysis methods to extract and assign meanings to the textual content, while psychologists focus more on investigating the underlying messages of texts.
4. Computational Text Analytics
Social researchers recognize the potential of computational text analysis specifically in the identification and interpretation of cognitive schemas, texts, and symbols in the process of developing conceptual frameworks that shape institutional meanings [
35]. The expansion of text analytics facilitates textual information retrieval and maximizes the hermeneutic utility of web archival data. Text analytics is based on the execution of a series of algorithms, which automatically mine, collect, and analyze textual data. Sebeok and Zeps [
46] performed a computer-based information retrieval and text analysis of 4000 Cheremis’ folktales. A few years later, Hays [
47] with his paper,
Automatic Content Analysis, proposed a semi-automatic computational model with which he analyzed political documents relying on the raw frequency distributions (counts) of words drawn from populations or samples of texts. By the late 1960s, a group of researchers in linguistics, psychology, social sciences, and the humanities, known as “computational stylists”, worked on developing computer programs to manage, process, and analyze texts from historical archives and other domains. Computer-aided textual analysis appears advantageous compared to manual text analysis [
48,
49,
50]. That is, computational text analysis can analyze large collections of textual data quickly, easily, and at a lower cost, while it can develop explicit conceptual coding schemes avoiding ambiguities and bias. It also facilitates lexicon construction based on empirical, rather than interpretive measures that contribute to higher content validity. One of the greatest uses of computational analysis is to mine large volumes of textual content.
Text mining involves information retrieval (e.g., document matching, search optimization, etc.), information extraction (e.g., entity extraction, co-reference of words, relationship extraction), concept extraction (e.g., colocation, word association, etc.), natural language processing, web mining (web content mining, web analytics, and web structure analysis), web classification (e.g., websites, blogs, social media, etc.), document classification (document ranking and categorization), and clustering (document similarity).
Depending on research objectives, text mining techniques provide efficient, automated, or semi-automated topic modeling techniques for encoding and analyzing textual data. The rapid evolution of topic modeling has led to the development of more nuanced models widely known as Language Models (LMs) grounded in the traditional topic modeling techniques, which will be discussed in a subsequent section of this paper, set the foundations for the development and swift advancements of transformer-based large language models (LLMs) such as the generative pre-trained transformer (GPT) model, bidirectional encoder representations from transformers (BERT) model [
51], text-to-text transfer transformer (T5) [
52], bidirectional, auto-regressive transformer (BART) [
53], prompt topic [
54], and Robustly Optimized BERT Pretraining Approach RoBERTa [
55]. In brief, LLMs are artificial intelligence (AI) models that identify the patterns and relationships of words in large corpora. They involve the processes of tokenization (where words are reduced to tokens), embedment (where tokens are transformed into numerical values ascribing the meaning of the words), network (layer) transformation (which identifies and weighs the importance of words and detects the context), and prediction (which predicts the sequence of tokens and generate sentences based on the relationship between words and constructs). The choice of modern LLMs strongly depends on the study’s purpose or task to be performed.
The technical description and discussion of automated LLMs are beyond the scope of this paper. However, below I outline some of the key features and functions of the mainstream LLMs: (1) GPT is an autoregressive generative text that is particularly useful for creative writing and language modeling; (2) BERT focuses on the understanding of the meaning of the text based on text classification and answering specific questions about the text content; (3) T5 is widely used for text-to-text tasks showing great versatility across various natural language processing duties; (4) BART performs both text generation and text interpretation, and it is widely used in text summarization and translation; (5) the prompt topic technique is widely used for tuning the text; (6) and RoBERTa is essentially an improved version of the BERT model that focuses on text classification and understanding.
Traditional Topic Models
LLMs are grounded in the operational framework of traditional text analysis techniques. Traditional topic models generate unique dictionaries and coding categories that detect the underlying themes of large unstructured textual datasets. This operation increases the text’s accuracy and substantive interpretability [
56]. Several traditional topic modeling techniques are widely used in social science research, such as Probabilistic LSA (PLSA) [
57], Latent Dirichlet Allocation (LDA) [
58], and non-negative matrix factorization (NGMF) [
59].
PLSA employs the maximum likelihood estimation to minimize the perplexity of words solving the problem of
polysemy. It also employs statistical techniques to identify the best-fitting model for the distribution of terms across large volumes of documents. PLSA was the first probabilistic text analysis technique and the predecessor of Latent Dirichlet Allocation [
58], which is based on estimated topic parameters through Markov chain Monte-Carlo simulations. LDA assumes that the distribution of document
D is not dependent on the distribution of words
W. Finally, NGMF employs factor analysis representing the terms and the documents in the latent space following the assumption that the results must be centered on factor analysis [
59]. This technique dismisses the different scales of textual information, increasing the term selection bias [
60]. This paper focuses on the foundation of topic models and gives a detailed overview of LSA that constitutes the origins of topic models that subsequently set the foundations of LLMs.
5. LSA
LSA was developed as an information retrieval technique aiming to improve the organization and indexing of libraries’ archives, analyze sociocultural phenomena, and assess public opinion [
60,
61,
62,
63,
64,
65]. It is a linear algebra-based methodology and is classified as a descriptive rather than a probabilistic text analysis technique widely employed in a wide range of disciplines such as psychology [
44], theory of learning and meaning [
61], operations management [
66], business [
67], and sociology [
25,
26,
27,
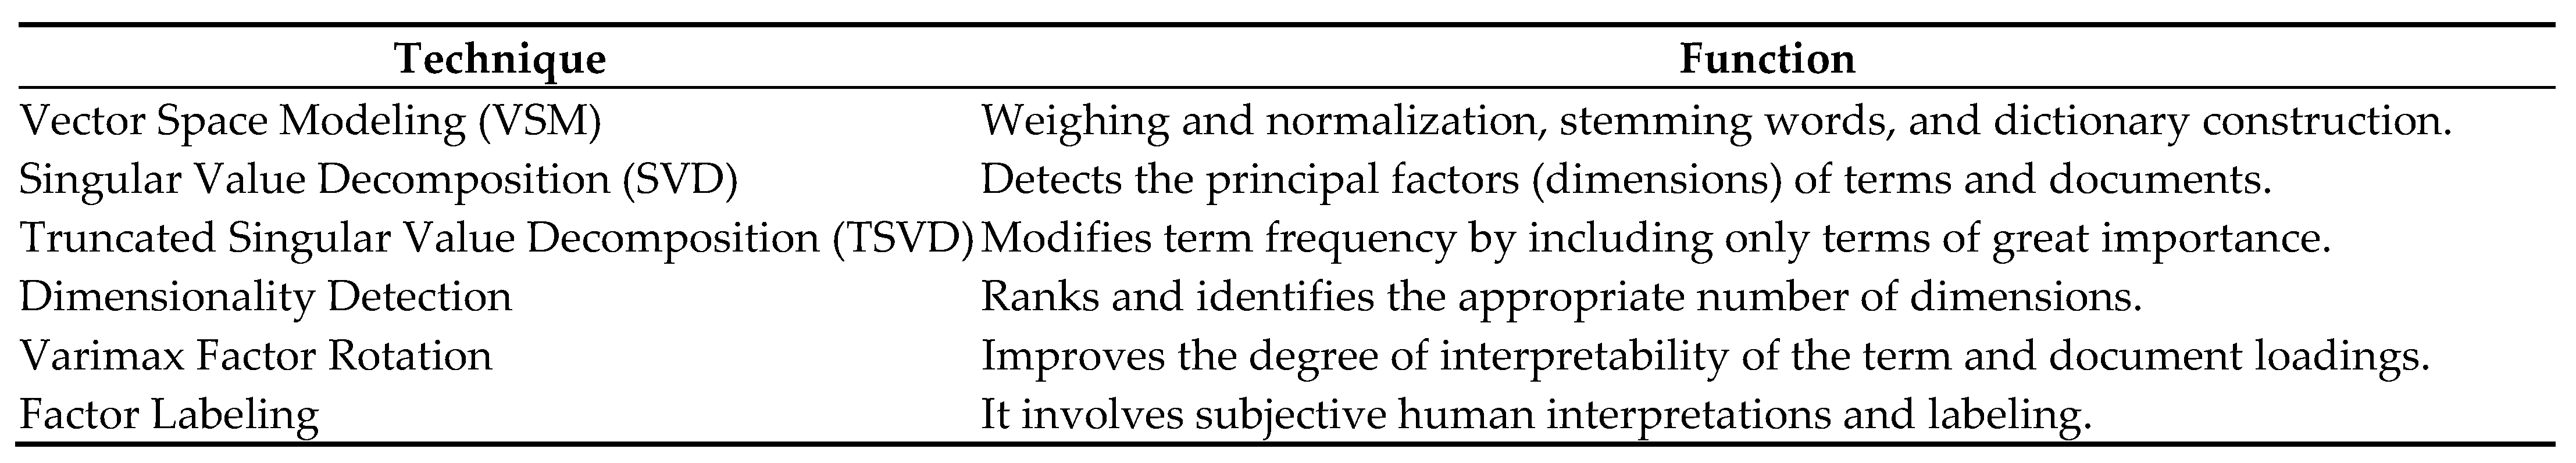
28]. LSA involves operations of developing automated dictionaries, knowledge bases, semantic networks, grammar, syntactic parsers, or morphologies. It transforms unstructured textual content into meaningful clusters of words, sentences, or paragraphs that reveal the semantic structure of a corpus. To that end, grounded in a least-squares approach, LSA classifies textual data in a document, and based on term-by-term simulations and document-to-term lexical priming data, it detects the topic structure of large corpora [
57,
68,
69]. The computational process of LSA involves reducing unstructured textual content into a meaningful number of underlying dimensions (factors) aiming to identify and classify documents into thematic entities (topics). The operations of LSA are summarized in
Figure 2.
The generalized model can be expressed as
where X is the collection of documents, ΛF denotes the linear combination of topics in large volumes of text data, and ε is the error term.
The LSA first delivers normalized weighted terms by utilizing a technique known as vector space modeling (VSM), an information retrieval technique that presents terms and documents as vectors [
70] and ranks individual documents against a query [
71,
72,
73]. The terms (words) and documents form matrix X where the counts of terms and documents appear in the rows and columns of a matrix. An important function of vector space modeling is that it weighs the term frequency (words), representing the documents in terms’ space. The weighting method is accomplished by a series of iterations involving the calculation of term frequencies (tf) and inverse document frequencies (idf). Inverse document frequency transformation (tf-idf transformation) is suitable for the pre-processing of unstructured textual content with complex latent structures [
69,
74]. Briefly, tf-idf devalues the significance of common terms appearing across large corpora, while increasing the importance of terms corresponding to a smaller group of documents [
72]. Overall, VSM can be described as a classification and weighting method involving term filtering, stemming, lemmatization, and term weighting; however, it does not involve any data normalization procedure. Normalization of documents is very important because every document must have equal significance within the textual content. The weighted terms across documents can be denoted as
where
refers to weighted terms value for each term–document combination.
Upon the completion of VSM, the procedures of SVD are initiated to reduce the dimensionality of the textual content. Technically, SVD decomposes the term by document matrix
into the product of three matrices:
,
, and
. The
matrix is a term-by-factor matrix containing the eigenvectors of a
matrix (term-by-term covariance matrix revealing the dimensions of terms). The term loadings (
) represents the dimensions (factors) revealing the latent meanings or simply topics derived from the text.
is a factor-by-document matrix showing the eigenvectors of
which is a document-by-document covariance matrix showing the loading of each document for each factor. Further, the model employs a unique form of truncated singular value decomposition (TSVD) [
75], maintaining only the term frequencies of great significance. TSVD is one of the dimensionality reduction techniques used in LSA procedures to remove dimensions (factors) of low importance. It is based on the principal component analysis (PCA), which involves orthogonal transformation of the correlated factors, converting them into a set of principal components that reveal the lowest possible dimensional space. Simply, TSVD discards the dimensions with smaller singular values and filters out less significant variations. Also, it effectively deals with the problem of polysemy of words and significantly affects inquiry performance. In brief, TSVD reduces the dimensions of the textual content of large corpora [
76].
In mathematical notations, TSVD can be expressed as
where
is the
term by document matrix,
is the truncated version of terms by factors,
is the truncated matrix of factors by documents,
is the truncated factor-by-factor matrix solution, and
denotes the ranking of singular values. Finally, using the property of orthonormality, UTU = I and VTV = I, where I is a
×
identity matrix, we attain the term (
) and document loadings (
) expressed as follows:
where
is a term-by-factor matrix grounded in the association between terms and latent topics, while
is a document-by-term matrix showing the relationship between documents and a cluster of terms that reveal latent topics.
Further, the analysis of textual data involves the identification of the optimal number of dimensions given that humans understand oral or written speech in different layers of abstraction. Selecting a low number of dimensions may dismiss some important information of textual content, while too many dimensions would increase noise and may generate overfitting. Similarly, Deerwester et al. [
60] suggested that 70 to 100 dimensions offer an ideal solution when 5000 terms are extracted from 1000 documents. In most LSA studies, the decisions concerning the number of dimensions—representing the entire textual content—appear to be random, inconsistent, and much dispersed [
69,
77].
Gombay and Horváth [
78] significantly contributed to the change point literature by finding that the null asymptotic distribution is of a double-exponential-extreme-value type, while Zhu and Ghodsi [
79] developed a dimensionality detection design using the Profile Likelihood Function (PLF). PLF detects the point-change of eigenvalues, signifying a cluster of terms dividing the textual content into groups of distinct dimensions. Their method consists of explicitly constructing a model for dimensions dj (j = 1, 2… n) estimating the position of the “gap” or the “elbow” in a scree plot. The model follows the assumption of ordered sequential eigenvalues
1 ≥
2 ≥ … ≥
n, following the normal distribution
testing the following hypothesis
H0. .
H1. There is an unknown 1 ≤ ≤ n − 1 such as .
Rejection of the null hypothesis H0 indicates the optimal candidate multiple dimensions.
Figure 3 abstractly illustrates the locus of the change point in a given distribution.
Once the optimal number of dimensions is detected, and the textual data are condensed (through TSVD), the next step of the LSA is to improve the interpretability of the initial results with the use of varimax rotations [
66]. The function of varimax rotations improves the explanatory ability of the terms and documents’ loadings. Even though many techniques of factor rotations can be performed, varimax rotations significantly increase the interpretability of the results.
The last step of the LSA procedure is to label the factors that underline the high-loaded factors. Factor labeling involves the notion of interpretive understanding of human subjects (i.e., researchers, a panel of experts) that are assigned to label the topics extracted. For instance, the labels of the topics extracted could be based on the development of a Thurstone scale [
33,
80] or the Delphi method [
81,
82]. To develop Thurstone scales, researchers initially assign preliminary labels for each topic based on the cluster of terms highly loaded (precoding), and then a group of experts are surveyed to evaluate the level of their agreement on the initially assigned labels. The aggregated scores assigned by the panelists would determine whether the labels should be retained or dismissed. Similarly, the Delphi method relies on a panel of experts who participate in multiple reiterative rounds of developing and refining the coding schemes (topic labels) based on the cluster of words indicating unique dimensions.
In sum, Landauer and Dumais [
61] illuminated the strengths of the LSA model as a descriptive tool that classifies and thematically attributes textual data with minimal human intervention. It is a technique that increases the analytical velocity of large volumes of textual data, presenting them in low dimensional spaces, enhancing the interpretive understanding of semantic relationships and generating topic structures of unstructured texts. Several limitations appear in the LSA procedures. For instance, LSA does not capture the context where similar words appear; therefore, polysemy may taint the interpretability of similar word occurrences that may not have the same meaning in different contexts. Also, due to a heavy reliance on statistical procedures focusing on the co-occurrence of words, LSA may generate inaccurate results if the sample of words or documents is not representative. Further, the dimensionality reduction process can dismiss important semantic information. Moreover, it does not account for the syntactic structure of the sentences, which again can generate inaccurate interpretations of meanings. The optimization and accuracy of the LSA procedures heavily rely on preprocessing (i.e., tokenization, stemming, stop words) and transformation of textual information into numeric values that are used for the analytical stages of the dimensionality detection (i.e., SVD, TSVD).
Figure 4 summarizes the procedures involved in LSA as described in this section.
6. Sentiment Analysis
Besides their use to detect the themes or topics of large corpora, topic modeling has been extensively used in understanding the themes of online interactions and opinion mining [
83]. Semantic and sentiment analyses have rarely been used as a joint topic–sentiment modeling approach [
84]. Without a doubt, textual content can be seen as organized thematic domains representing facts, sentiments, or a combination of both. They represent mental images, as well as opinions or judgments over factual or emotional realization [
85]. Recognizing the importance of the distinction between the symbolic expressions of the objective and subjective textual expressions, Liu [
86] proposed an analytic instrument scaling textual data of subjective expressions called sentiment analysis (SA).
There are four levels on which scientists perform SA for opinion mining: (1) document-level sentiment classification [
84,
87]; (2) sentence (feature)-based sentiment analysis [
88]; and (3) entity- and aspect-level classification [
89]. Document-level sentiment classification categorizes a set of opinionated documents based on the identification of positive and negative words revealing general sentiments represented in textual contents. The procedure involves the ordering of subjective and objective sentences, and generating scales of positive, negative, or neutral opinions. The sentence- or feature-based sentiment analysis is a model extracting the sentiments over targeted words or clauses within a sentence. Finally, entity- and aspect-level sentiment analysis focuses on counts of words and clauses revealing positive, negative, or neutral opinions.
Overall, SA is an instrumental textual analytic technique designed to assess the manifest opinions expressed in verbal and non-verbal content [
87]. Unlike topic extraction and topic modeling techniques, sentiment analysis focuses on opinion retrieval and sentiment extraction, rather than classifying and reducing the dimensions of the textual content. It is suitable for the analysis of opinionated textual frames [
86,
88,
90], and it can be performed in different levels of analysis given the unit of granulation used to extract information from different domains [
91] that could be detected by a topic extraction or topic modeling technique (i.e., LSA).
EASA
EASA classifies sentiments of predefined topics [
92]. EASA was first known as feature-based opinion mining and summarization [
89]. Lexicon-based sentiment classification is based on dictionaries containing lists of words, idioms, metaphors, and clauses expressing positive or negative sentiments [
93,
94]. The main elements of EASA involve the entity (what is being discussed), the aspect term (words or phrases lined to the aspect), the aspect category (higher-level classification and grouping of words or phrases), opinion term/expression (words conveying a sentiment), and sentiment polarity (positive, negative, and neutral sentiments). It also involves a unique procedure that identifies sentiment shifters within a sentence. Following Ding’s [
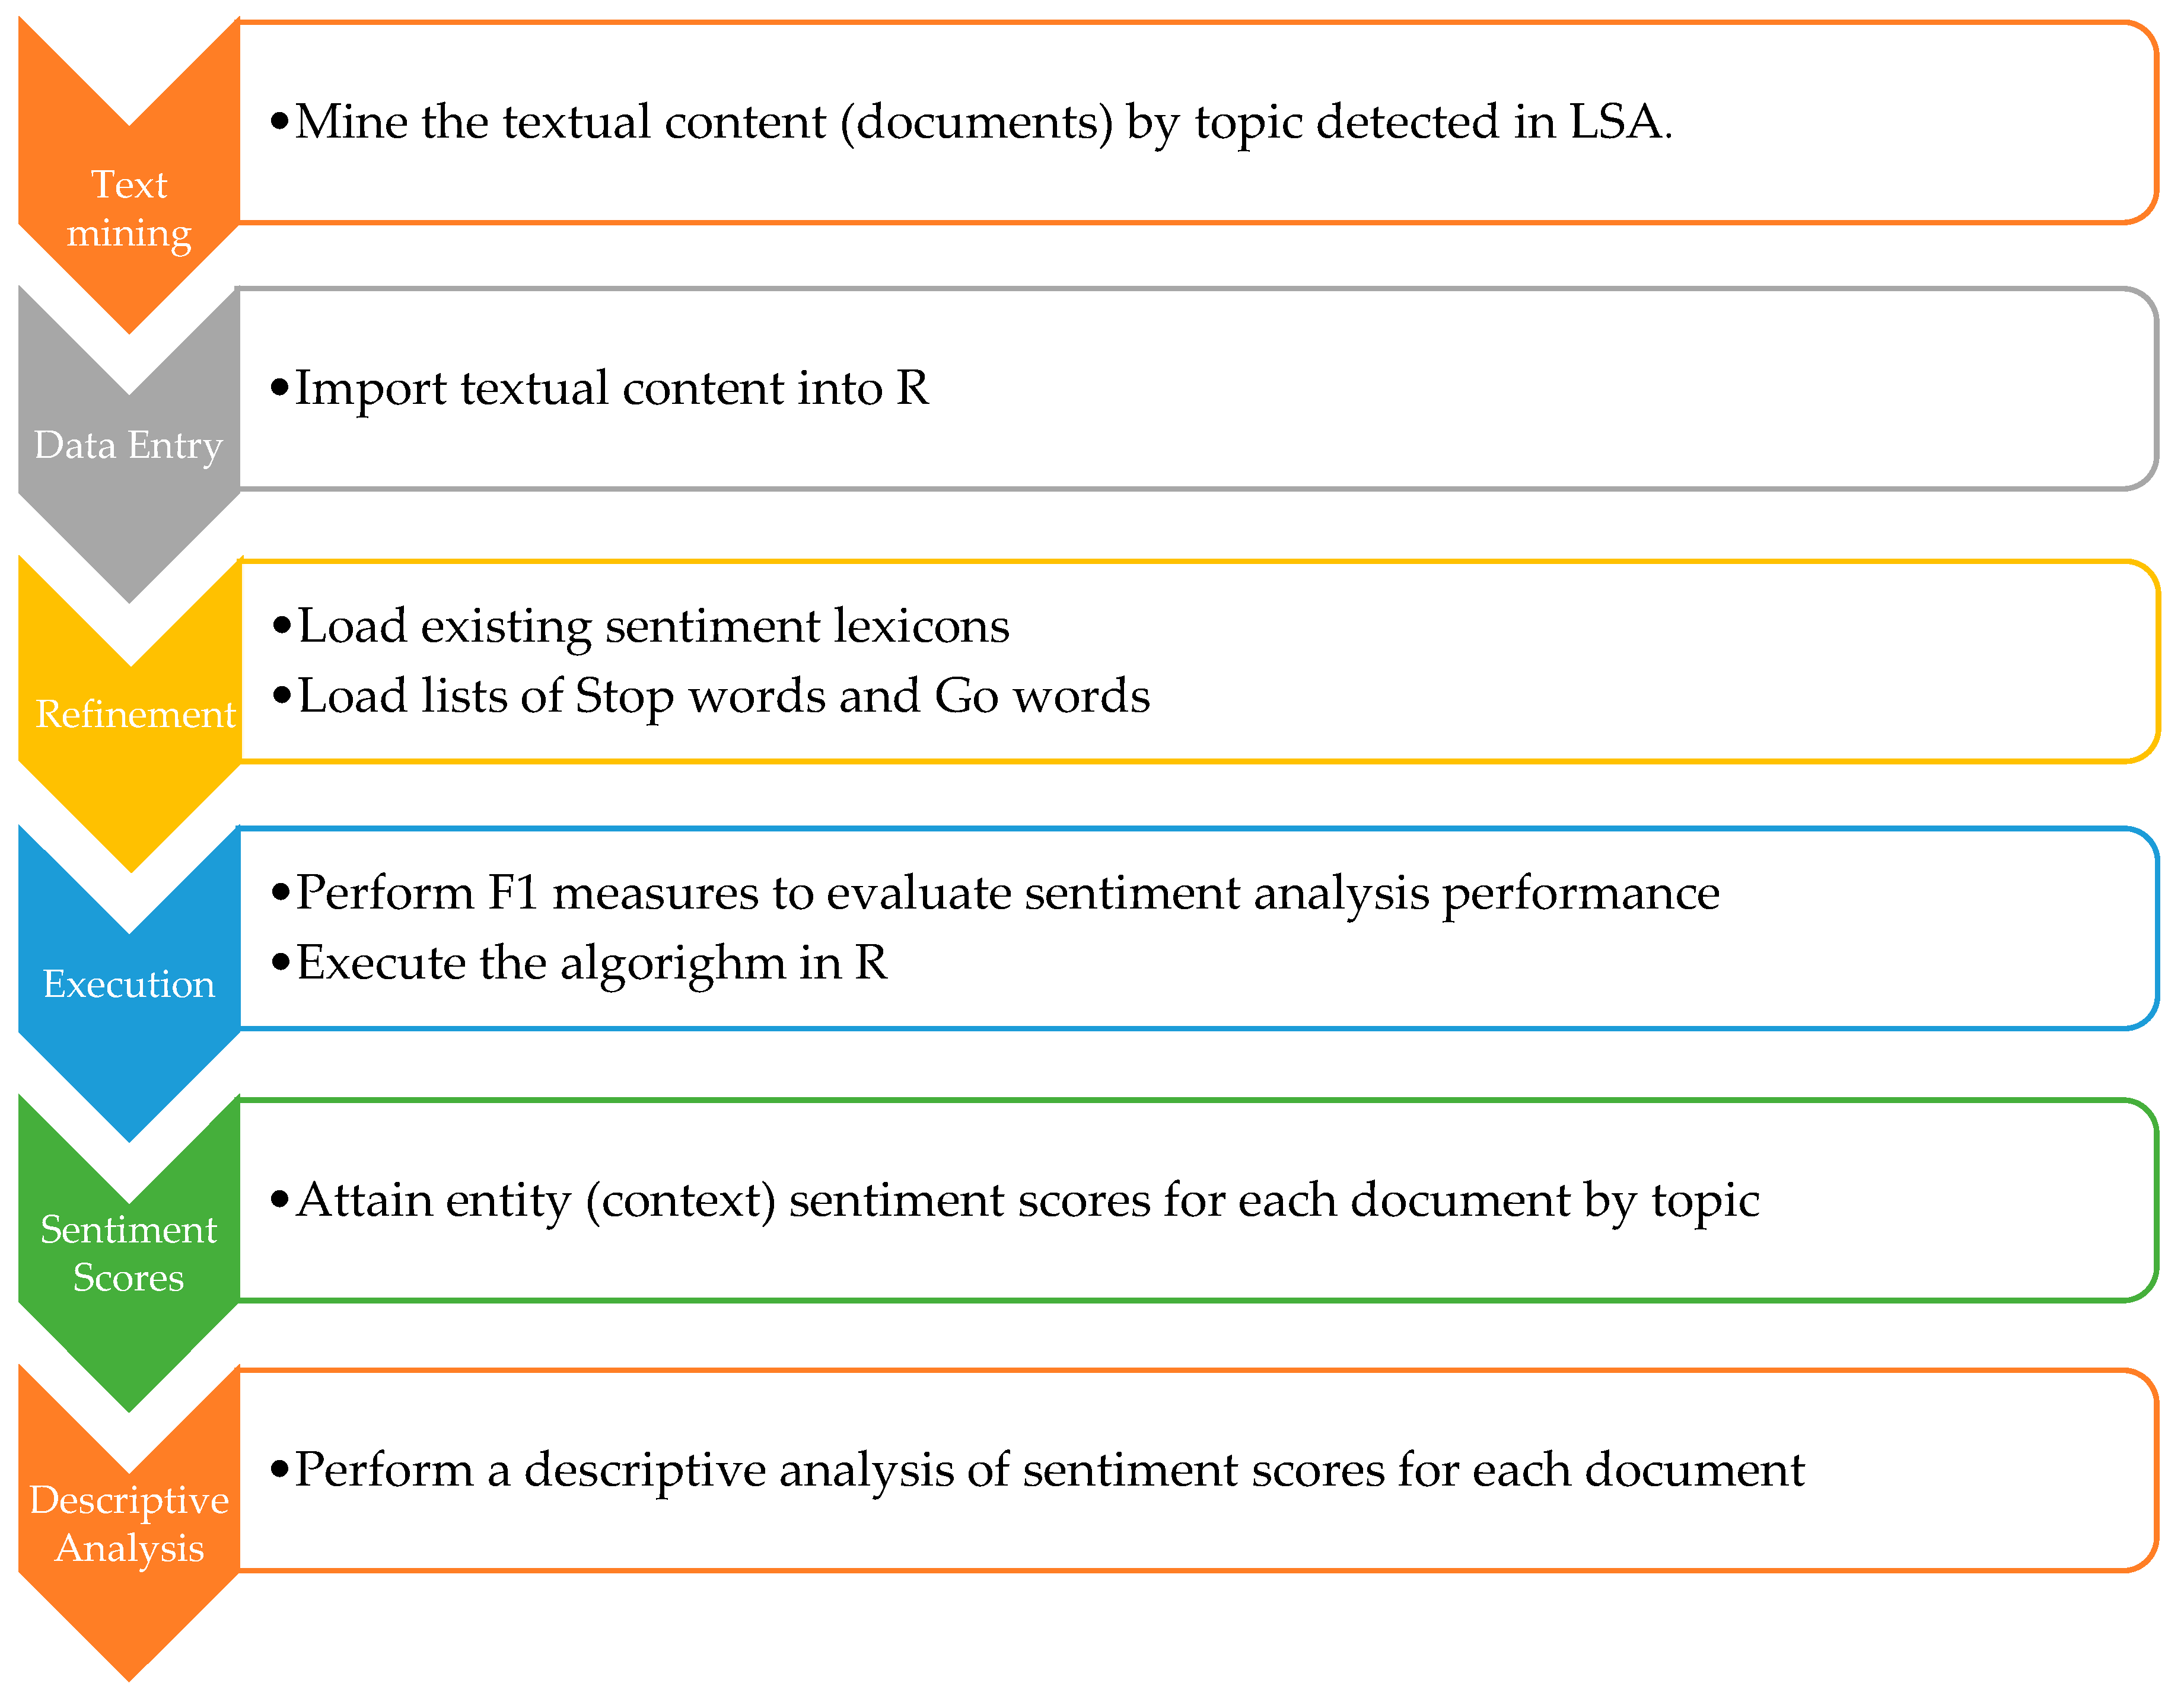
94] lexicon-based approach, EASA consists of four operational steps: (1) mark sentiment words and phrases, (2) apply sentiment shifters, (3) handle but-clauses, and (4) aggregate opinions.
The first step involves assessing words and phrases that express a sentiment; the model assigns scores to words or clauses within a sentence. For each word revealing a positive sentiment, a score above zero (+) is assigned, while each word of negative sentiment is rated below zero (−). Further, for sentences lacking words revealing a sentiment, a zero score is assigned revealing sentiment neutrality. Words of sentiments like “love, like, favor, good and fabulous, etc.” are classified at different scales of positive opinions on a topic. On the other hand, words such as “hate, horrible, dislike, awful, etc.” reveal a scale of negative sentiments. For instance, in simplistic terms, the sentence “I love this movie” signifies a stronger positive sentiment than the sentence “I like this movie”; therefore, the first sentence weighs for a higher sentiment score than the latter. The same applies to sentences revealing negative sentiments; “I hate this movie” accounts for a lower negative sentiment score than the sentence “I dislike this movie”. The second step involves the process of sentiment or valence shifters [
93,
95]. This procedure focuses on words or expressions changing the direction of sentiments within the same sentence. For instance, words such as “not, but, never, neither etc.” are considered sentiment shifters. The third step deals with the but-clauses that appear to boost or contrast the sentiment expressed in a sentence. If there is a conjunction “but” between two sentiment words, the algorithm divides the sentence into two parts of opposing sentiments. Finally, the fourth step accumulates the aggregate opinions found in a sentence.
The simplest way to find the total sentiment score of a sentence is to add up all the scores of the opinion words appearing in the sentence [
89]. A more sophisticated technique calculates the sentiments for each aspect of the textual content. In mathematical notations, Liu’s [
89] model is expressed as
where S is the sentence, A is the aspect, SWj is the word expressing a sentiment, dist (SWj, Ai) is the distance between the sentiment word and aspects in a sentence, and SWj.So is the sentiment score of SWi. The advantage of this technique is that it jointly weighs the sentiment words based on their distance from the aspects presented in the textual content. SA procedures can be summarized in seven steps (see
Figure 5).
As discussed in the previous section, LSA lacks specific contextual understanding as it performs broader classifications and only detects document-level topic domains. Performing EASA on the documents attributed to specific topics—detected by the LSA operations—could provide more guided insights into the text and measure the sentiment for sub-topical domains (entities). This synthesis could reveal evidence of opinion polarization or consensus within the contexts (entities) of larger thematic entities. Such an incorporated semi-automated approach could be beneficial in discourse analysis, and it could be especially beneficial in large texts generated by unstructured interviews or semi-structured focus interviews, conversational analysis, and more.
EASA has various limitations due to the absence of universally accepted reliable metrics. Also, there are challenges to accurately evaluate the sentiments in large texts due to contextuality and bias [
96]. The complexity of differentiating sentiments expressed in different aspects of the text generates several limitations about the accuracy of the results. EASA may produce ambiguous interpretations in texts where sentiments are rather implied than manifested in a given aspect. For instance, in the sentence “
I watched better movies before” there is an implicit negative sentiment attributed to it. Yet, EASA cannot accurately ascribe a negative score due to the absence of a negative word (construct) in the sentence. The accuracy of the lexicon-based EASA is a crucial component that, typically, relies on syntactic dependency parsing (analysis of the structure of the sentence detecting sentiment words) and lexicons tailored for aspect-level analysis. Attributing the correct sentiment scores remains challenging as the summation of sentiment scores in sentences containing multiple contextual domains may be misleading. Also, the lexicon-based approach of EASA is static, offering limited coverage and presenting the issue of bias. Finally, expressions that have a sarcastic or ironic tone in a textual form cannot be fully ascribed accurate sentiment scores using EASA.
The reliability and accuracy of sentiment analysis models are traditionally measured by the F1 score [
97]. The F1 score evaluates the performance of the sentiment analysis models by considering a balanced mean between
precision and
recall.
Precision measures the accuracy of the sentiment model based on the proportion of correct predictions (true positives) over the sum of the entire predicted entity sentiment (true positive + false positives). Simply, precision takes the form of
where TP is the true positive referring to the correct identification of the entity and sentiment, while FP is the false positive referring to the incorrect assignment of the wrong sentiment to a correctly identified entity in the textual content.
On the other hand,
recall apprehends the proportion of correct identification of entities and sentiments (true positives) out of all entities and sentiments that should be identified in the text (sum of true positives and false negatives). In mathematical notation, recall can be stated as follows:
where TP is the true positive referring to the correct identification of the entity and sentiment, while the FN is the false negative referring to the failure of the model to detect the entity and sentiment that exists in a given text.
The F1 score balances the precision and recall metrics. It is derived from the balanced mean of
precision and
recall taking the following form:
F1 score ranges from 0 to 1, where 0 indicates no accuracy in predictions and a lack of inclusiveness of entities and sentiments, while 1 ascribes the highest degree of accuracy and precision of entities and sentiments in a given text. Overall, F1 is a significant evaluation tool that provides a balanced measure to correctly detect the aspects and precisely assign the sentiment scores associated with them.
7. Topic by Sentiment Maps
Topic mapping is the third and final stage of the proposed integrated model. Upon the completion of LSA and EASA, the frequency (count) of positive, negative, and neutral sentiment scores across the topic categories is organized in a contingency table. Followed by the data organization and management process, CA can be employed to graphically display and test for the dependence of sentiment scores across topical domains. In brief, CA is a statistical technique designed to create conceptual maps and reveal associations (dependence) across categorical variables [
98,
99]. The main function of CA is to graphically display categorical data in low-dimensional spaces [
100] and test for statistical dependence. CA relies on the χ
2 statistic to examine whether there is a significant difference (dependence) in frequencies across the attributes of the categorical variables in a contingency table. CA relies heavily on SVD to identify and display categorical data in low-dimensional space (two to three dimensions). CA constitutes an ideal technique to conceptually map textual data and display the disparities of proximities of sentiment categories (positive, negative, neutral) across different clusters of topics displayed in geometrical spaces.
The first step of CA involves the transformation of raw frequency table N into a matrix of proportions (correspondence matrix P). The correspondence matrix is calculated representing the joint probability distribution of the sentiments by the topic contingency table that takes the following form:
Based on the correspondence matrix P, the marginal probabilities (masses) are calculated for topic categories (row masses, r) using = , and sentiment scores (column masses, c) form a column vector = i. These operations of CA produce weights ensuring that sentiments by topic categories with higher frequencies have a proportionately higher impact on the analysis. The following step involves the calculation of row and column profiles as vectors generated by simply dividing the topic (row) elements by the topic mass (row mass) and sentiment (column) elements by sentiment mass (column mass), respectively. Row and column profiles represent the conditional distribution of sentiment categories across topic categories, generating the centroids in the geometric space of the topic by sentiment maps.
Further, in CA, the dimensionality reduction process relies on SVD operations (I described the mathematical operations of SVD in the LSA section of this paper). The appropriate number of dimensions is determined by inertia (φ) that decomposes the aggregate Pearson Chi-Square (
) attributing data in lower dimensions by using only the first two principal components that explain the highest percentage of the total variability of sentiments across topics. In mathematical notations, inertia takes the form of
where φ denotes the inertia,
is the statistic’s obtained value, and N is the total (sum of all row and column frequencies in the contingency table). Typically, dimensions that explain 70% (or higher of inertia) are retained and graphically displayed as a biplot that identifies the patterns and associations between the row variable (detected topics) and column variables (identified sentiments).
Overall, CA is a powerful visualization tool suitable for the graphical representation of categorical data in two- to three-dimensional spaces. Among others, CA discovers patterns of categorical data yet does not require distributional assumptions providing a unified framework of testing for statistical dependence, and it measures the degree of associations between row and column variables. However, the main limitations of CA are the interpretative complexity of the results, data sensitivity issues (i.e., outliers, sparsity of categories, etc.), and its descriptive nature restraining its suitability for explanatory (theory-driven) research.
8. Conclusions
In the last thirty years, interdisciplinary research has contributed to the development of sophisticated techniques performing topic extraction, topic modeling, opinion mining, and more. Collaborative works between social scientists, linguists, computer scientists, and information technology experts have shown great promise in utilizing and making sense of the context of large volumes of textual data. A plethora of data mining techniques have been widely used to attribute textual content that can facilitate both exploratory and theory-driven explanatory studies analyzing social phenomena. Sociologists often analyze cultural frames relying on the basic mechanism of text analysis: “get the text, find the use, and map the meaning” [
25,
27,
35] to analyze historical texts, policies, political discourse, the interaction of digital communities, and more. This paper provided a thorough overview of distinctive as well as intersecting traditional practices of qualitative and quantitative text analysis and conceptualized a streamlined incorporated style consisting of a combination of foundational styles in topic extraction and opinion mining complemented by a multivariate technique for the analysis of categorical data, multivariate analysis LSA, EASA, and CA (see
Figure 6).
The three distinct traditional techniques can be sequentially used to form a cohesive epistemological model generated by a methodological synthesis that detects the structure of large textual corpora, assesses the sentiments corresponding to the context (aspect) of each detected topic, performs tests of dependence, and graphically displays sentiment categories across topic domains. Specifically, in any form of unstructured data, the integrating model first classifies the text in topical domains (the topics discussed) through the LSA operations; then, it assesses the sentiment (opinions) within the subtopics (entities) through the EASA, and upon the generation of contingency tables entailing the distribution of positive and negative sentiments across topical domains, the CA will test for statistical dependence and display a topic by sentiment map revealing evidence of statistical association (difference) or lack thereof (no difference). A synthesis of topic models and multivariate statistical techniques may contribute to increasing the sophistication of developing interpretative coding schemes as it may improve the ascription of elusive socio-cognitive schemas and develop metrics on perception, emotions, and sentiments that are occasionally delimited by issues such as discerning bias. Discerning bias is often attributed to hermeneutic discrepancies and operational pitfalls subject to structural and cultural influences in societal settings.
Overall, the ongoing developments of various text analytic models have shown great promise in improving the utility and reliability of textual data, increasing the content validity of measures of meaning that enhance the interpretative understanding of social attitudes, opinions, and beliefs. The development of highly advanced LLMs has shaded the use of traditional techniques as they have shown remarkable capabilities far exceeding traditional text analytics. However, traditional text analysis models still hold their position in social science research. Traditional topic models perform specific operational tasks in the research process (i.e., interview coding) that could be enhanced by streamlined synthesis that could generate reliable data and valid measures of textual content at a much lower cost. Finally, the human intervention in the interpretation of outcomes generated by the semi-automated structure of streamlined topic models could be seen as their main strength contributing to the dynamic nature of the cultural production of meanings that are deeply grounded in value-oriented, rather than deterministic, frameworks widely used in LLMs. Implementing complementary sequential hybrid techniques could be used to analyze culturally informed convergent and divergent opinions in public discourse that have traditionally afflicted the notion of social cohesion and solidarity.


