1. Introduction
Scanning probe microscopy (SPM) techniques can be used to obtain lateral-resolved information by measuring the interaction between a probe and a surface. The size of the probe determines the achievable resolution, which can range from hundreds of micrometers to several picometers. The probe is moved laterally along the surface using motor or piezo actuators and its response is recorded in dependence of its position. This data can be processed to form an image. SPM has many uses, such as studying materials, understanding effects, and visualizing. However, the individual methods have diverging advantages and disadvantages, instrumental realization, and information provided.
In this field, the invention of scanning tunneling microscopy (STM) by Binnig and Rohrer in 1982 marked the very beginning of the development of various SPM techniques [
1]. STM involves a sharp metallic needle with a tip of several atoms being lowered down to a conductive surface until a tunnel current is observed. The working distance is typically less than 1 nm and the height of the probe can be controlled by the tunnel current. This technique can achieve single atom resolution, but it is essential that the surface is conductive. This main disadvantage was overcome by the development of scanning force microscopy by Binnig, Quate, and Gerber in 1986, better known as atomic force microscopy (AFM) [
2]. In this technique, the attractive and repulsive interactions between the probe and a conductive or non-conductive surface are used for characterization. The tip, here a cantilever, works as a force sensor and can provide nanometer resolution. Besides these two very common techniques (STM and AFM) that use physical interaction between probe and sample, Bard presented a scanning electrochemical microscope (SECM) in 1989, which uses electrochemical reactions for surface probing and imaging [
3]. In contrast to the previously mentioned techniques, SECM initially used relatively large probes that are referred to as (ultra)microelectrodes in this context. The preparation of these microelectrodes was highly reproducible, and their use also simplified the instrumentation and requirements for damping. Furthermore, knowledge from electrochemistry at large electrodes could be transferred, which enabled the modeling of the observed electrochemical processes. It was quickly demonstrated that SECM could be applied to a broad variety of research fields (surface interaction, interfaces, and biological systems). This variety is also evident when looking at the number of electrochemical methods that were transferred from macroscopic to micrometer-sized electrodes. SECM can be considered as “true” chemical microscopy, where an electrochemical reaction at a micro- and later also nanoelectrode is used to obtain laterally resolved information from the surface in close proximity.
Besides many other applications, SECM has become a prominent method in the research field of electrochemical energy storage and conversion. To meet the growing global demand for electricity in the coming decades, powerful devices for storage and conversion must be developed. Furthermore, suitable materials must be found to act as electrodes or electrocatalysts in the converter systems, such as fuel cell, electrolyzers, and batteries. These materials must be characterized in terms of activity, stability, and selectivity. By applying SECM as an electrochemical in situ technique, it can provide a deeper understanding of the processes and structures of materials in order to finally create tailored materials for energy storage and conversion application.
2. State of the Art
To date, scanning electrochemical microscopes are provided from several manufactures and companies. All instruments mainly consist of similar assemblies. One or more x,y,z-positioning systems (motorized or piezo-driven) are used to move the sample or the microelectrode. The accuracy of the positioning system contributes to the experimental resolution; however, the microelectrode dimension is more important. Electrochemical signal sampling is commonly provided by a (bi-)potentiostat in a three or four electrode configuration, where both the microelectrode and the substrate can act as working electrodes. Considering the particular experiment, a second electrode is not always necessary. Here, again, the microelectrode dimension determines the necessity of current amplifiers. In the following sections, more information about the microelectrode and the applicable experimental modes are given.
2.1. Microelectrodes and Electrochemical Response
In SECM, the sensors or probes are referred to as (ultra)microelectrodes. A typical microelectrode consists of a metal wire surrounded by an insulating glass sheath. This is obtained when a piece of metal wire is melted down in the center of a glass capillary by heating the center and applying a vacuum at both ends. After cutting the capillary, the wire can be contacted with conductive epoxy resin or tin and the apex can be ground and polished mechanically. This method is limited to the minimum diameter of commercially available metal wires. Smaller micro- or nanoelectrodes are often made from platinum and are obtained by melting and pulling a metal wire in a quartz capillary (due to the comparable melting points) with a laser puller instrument (Sutter P2000, Sutter Instrument, Novato, CA, USA) [
4].
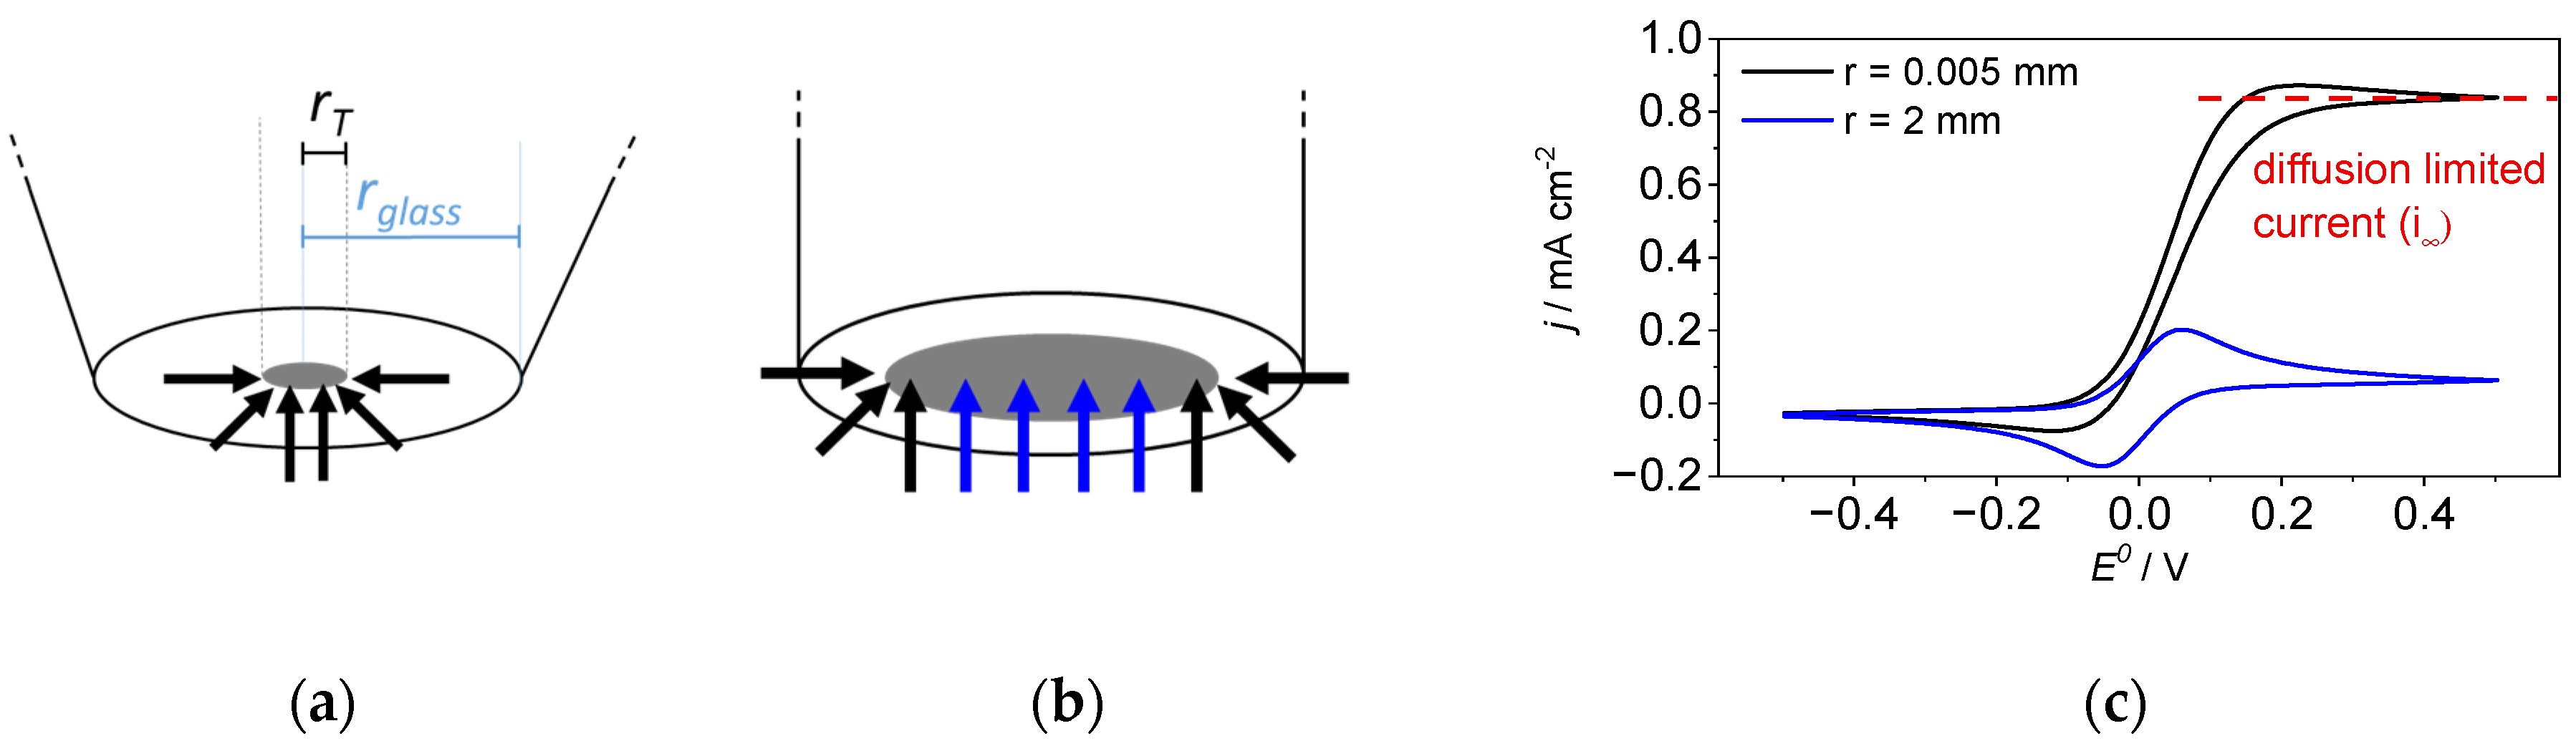
A schematic representation of such a microelectrode is shown in
Figure 1a with the relevant characteristics that can be determined by either optical or electron microscopy. Furthermore, the quotient of the radius of glass (r
glass) to the radius of metal (r
T) is defined as the RG value of a microelectrode. The term “ultramicroelectrode” or “nanoelectrode” is often used when the radius of the metal is smaller than 12.5 µm or 500 nm, respectively. In contrast to microelectrodes, the handling of a nanoelectrode is more challenging and requires protective measures because electrostatic discharge (ESD) can easily destroy the metal [
5]. The electrochemical response of a micro- and nanoelectrode is different to larger electrodes (
Figure 1b), being several millimeters in radius. Cyclic voltammetry (CV) in low-concentrated redox mediator solution (containing a single oxidizable or reducible compound) is often used to characterize a microelectrode and its response significantly differs from that of a bulk electrode (
Figure 1c). The CV of bulk electrodes is comprehensively discussed in a work by Elgrishi et al. [
6] In contrast to bulk electrodes, where planar diffusion (
Figure 1b, blue arrows) is dominant, a hemispherical diffusion field of the microelectrode leads to the constant delivery and removal of the (converted) redox mediator. Referring the current of the CV to the geometrical area (current density, j) the large contribution of this diffusion part becomes obvious. As another consequence, the CV of a microelectrode is independent of the scan rate and applying a constant potential E > E
0 leads to a constant diffusion limited current in the solution (i
∞). For the sake of completeness, it should be mentioned that the number of molecules giving such a response is very limited ([Fe(CN)
6]
3/4+, [Ru(NH
3)
6]
2/3+, Ferrocenemethanol, and some more). However, this diffusion limited current of the microelectrode is the signal source of the SECM technique in its simplest implementation.
The diffusion limited current can also be calculated. For planar microelectrodes (schematically in
Figure 1a) with
RG > 10, the following equation can be used:
with n—the number of transferred electrons, F—the Faraday constant, D—the diffusion coefficient, c—the concentration of the redox active molecule, and r
T—the radius of the metal.
2.2. Feedback Mode of SECM
Applying a constant potential forcing the conversion of a redox active molecule leads to a constant diffusion limited current response, which can be affected by bringing the microelectrode into the proximity of a surface. For the sake of the comparability of different microelectrode radii and to become independent of the type of redox process, the absolute distance is often referred to as the metal radius of the microelectrode, and the current at a certain distance, i
T(d), is related to the initial current at a large distance from the sample (i
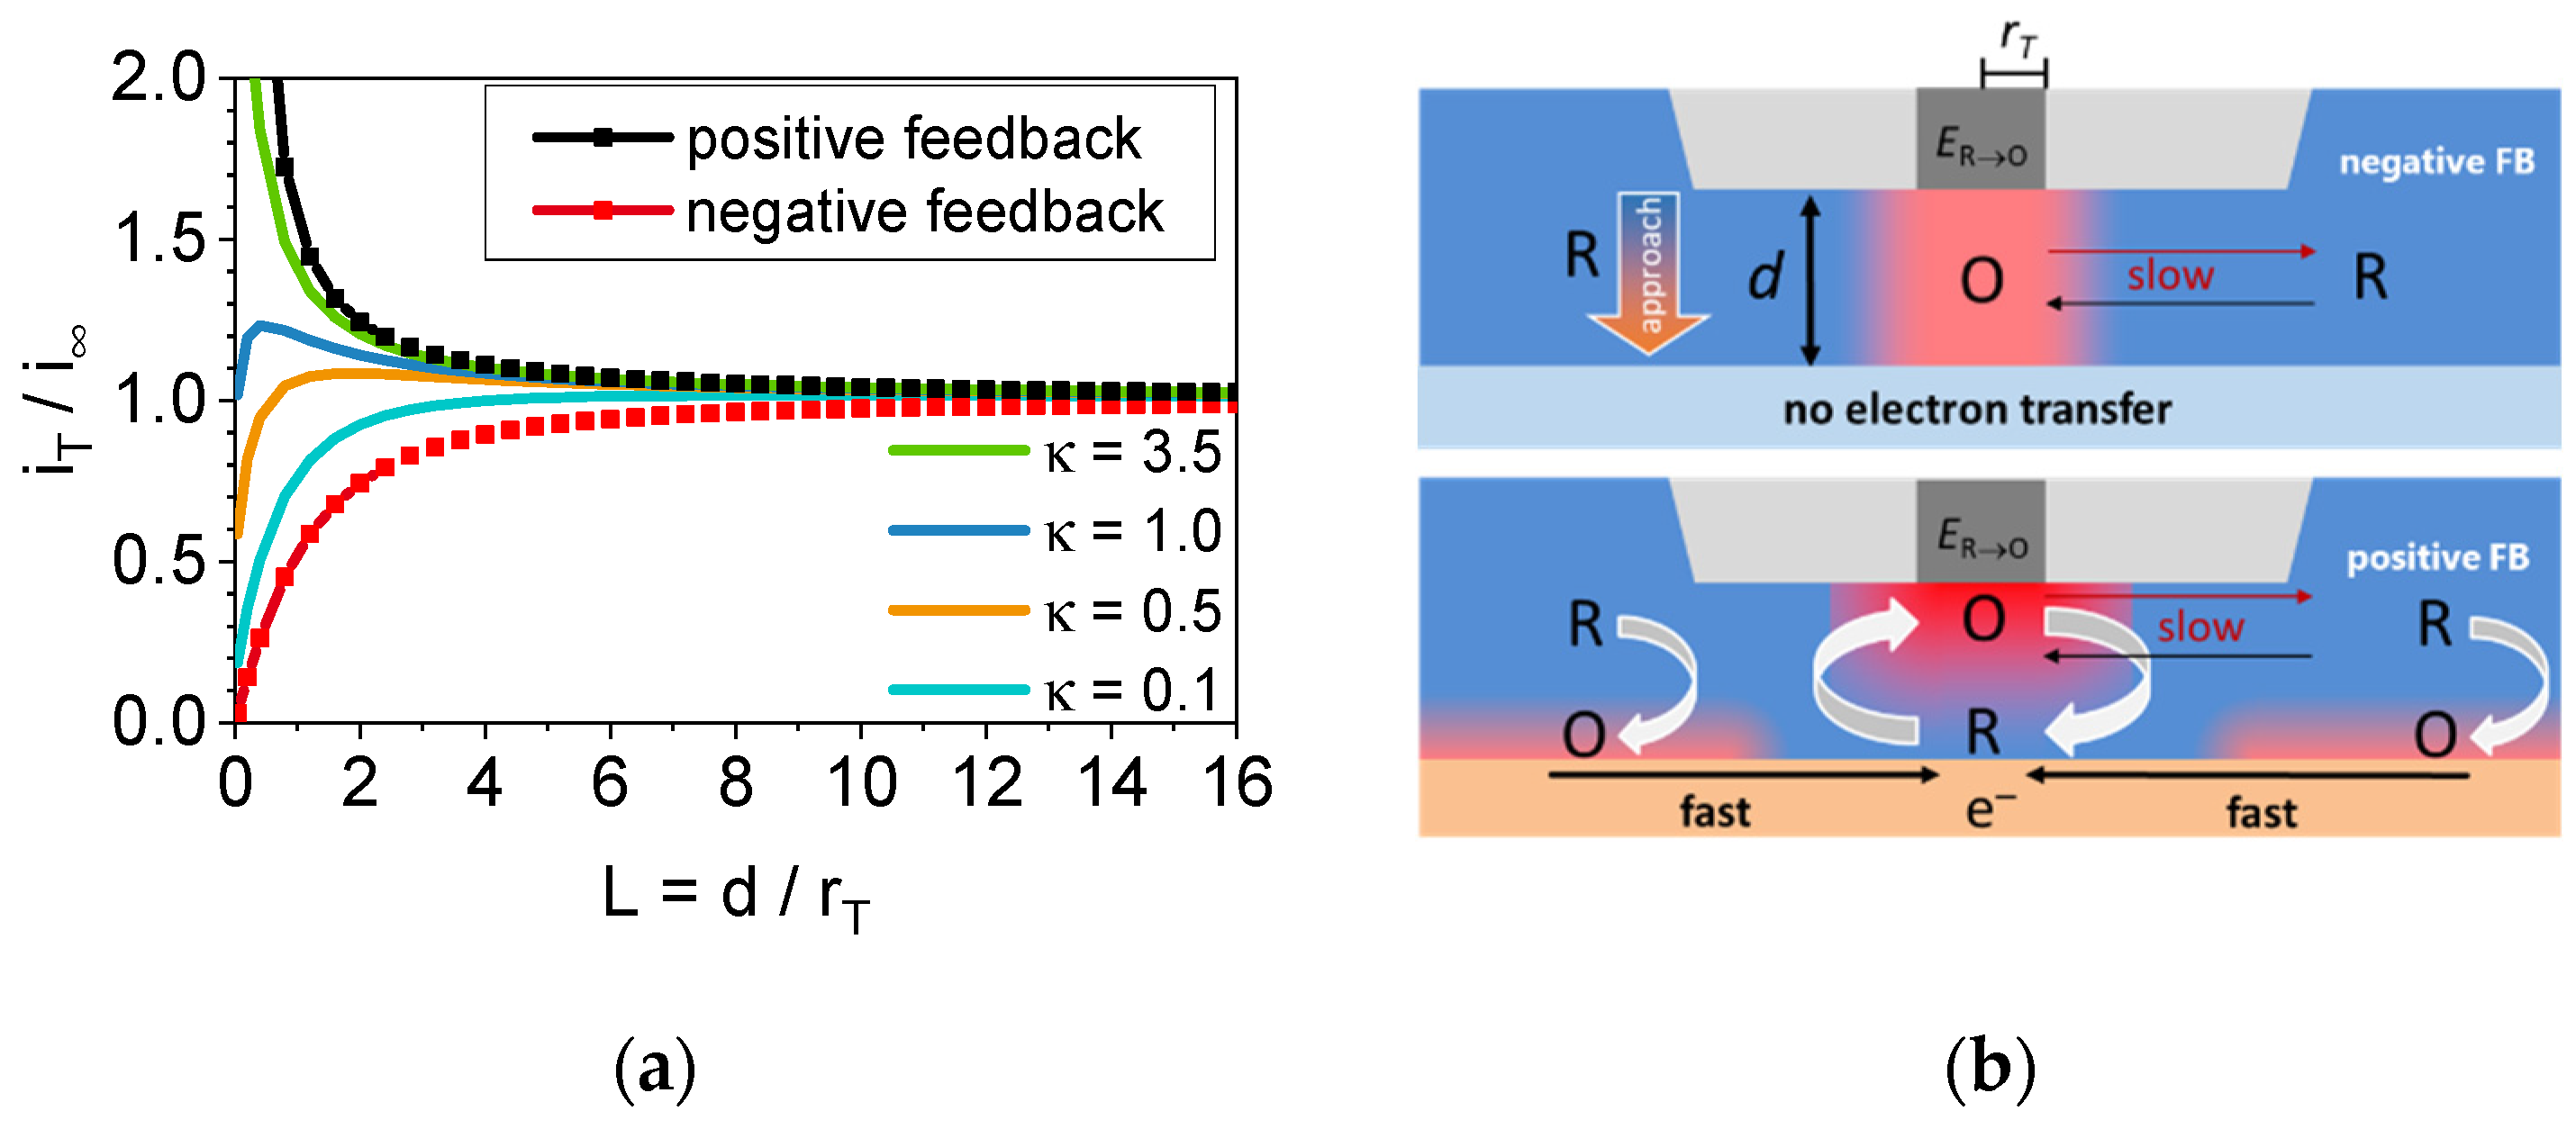
∞). This processing leads us to approach curve diagrams with dimensionless numbers for both the relative current change and the radius-related microelectrode-to-sample distance (L). The examples of various types of approach curves can be found in
Figure 2a and two boarder cases can be defined. First, the current decreases with a smaller microelectrode-to-sample distance (called negative feedback) or, second, the current increases (called positive feedback). The combination of both gives mixed feedback approach curves. In earlier work, the terms “insulator” and “conductor” for the sample surface referred to the negative and positive feedback approach curve, respectively. However, one can also accept the negative feedback as a special case of the mixed feedback where the sample is fully unable to reconvert any mediator molecule. This behavior can also be forced with a conductive sample by applying a suitable potential. Schematic representations of positive and negative feedback responses can be found in
Figure 2b.
First, the negative feedback results from the decrease in the electroactive molecule within the gap between the microelectrode and the sample. Converted molecules have to be exchanged to the bulk electrolyte. However, this slow process is affected by the decreased distance during the approach which leads to a further shrinking of the diffusion into the gap. Finally, the current may match zero when the gap is fully closed. Second, the positive feedback and proportionately also the mixed feedback response is observed when the substrate is capable of converting the molecule to varying degrees. Here, the driving force is a “concentration cell” [
7] between the gap and the surrounding solution compensated by more or less rapid electron transfer. A fast electron transfer, which is related to the high electron transfer coefficient of the substrate (κ in
Figure 2a), leads to the fast regeneration of molecules, which are available for another turnover at the microelectrode. This effect increases with the decrease in microelectrode-to-sample distance (d) because of the decreasing diffusion distance. As a result, the absolute current increases as long as the electron transfer at the substrate is fast enough. If not, the response can turn into a negative feedback at a certain distance (see
Figure 2a, κ = 1.0 as an example). Both processes can be forced or hindered by applying a respective potential at the substrate. Consequently, it becomes clear why the approach curve already provides valuable localized information about a substrate and its ability to reconvert the product molecule of the microelectrode turnover. The quantitative kinetic data of the substrate electron transfer can be obtained by fitting the approach curve data at various substrate potentials [
7]. By performing approach curves at different positions, the distribution of the electron transfer activity can be determined and used for imaging along a sample surface.
The feedback mode of SECM is often used for imaging purposes in constant distance to show electrochemical active areas or hot-spots. However, if the experiment is performed in constant microelectrode-to-sample distance (constant-height mode, typically in the dimension of the diameter of the metal), the sample must be very flat. Otherwise, local activity and topographical artefacts cannot be separated. A rough surface texture makes further distance regulation, i.e., shear force microscopy, necessary (constant-distance mode) [
8].
One particular type of feedback experiment should finally be mentioned here, the surface interrogation mode (SI-SECM), which is frequently used in the field of electrochemical energy conversion. Here, the substrate is polarized at a certain potential only for a short time, which generates active surface (oxidation) sites at the material. Afterwards, a mediator molecule is converted at the microelectrode and the product can react with these surface sides restoring the initial mediator molecule. This works as long as there are active sides at the substrate and allows for a quantitative evaluation of the surface sites of the substrate [
9].
2.3. Generation/Collection Modes of SECM
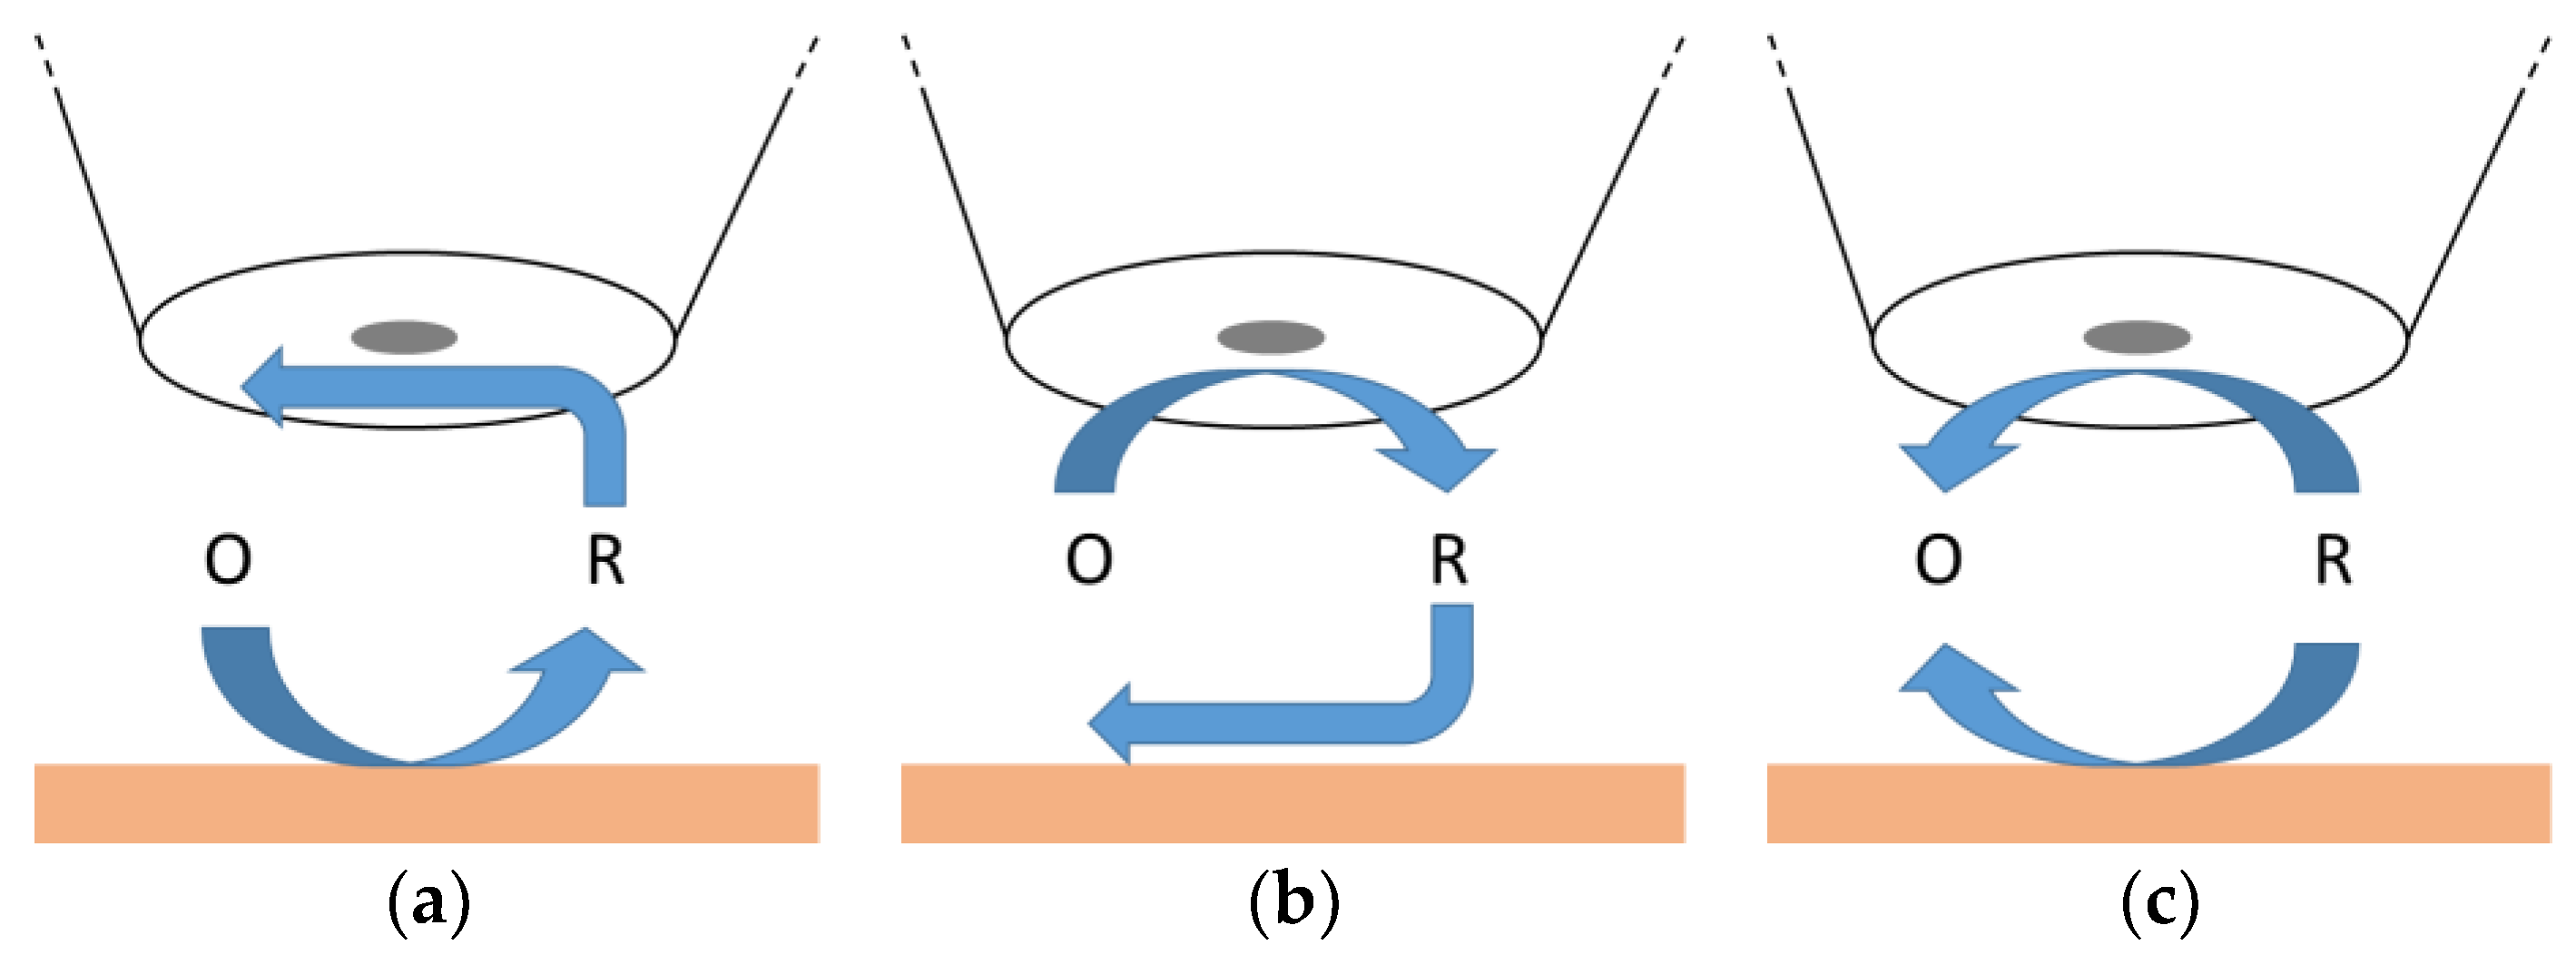
The feedback mode of SECM allows us to determine the localized kinetic parameters of a substrate from the approach curve data when the reaction at the microelectrode is well-defined. However, the number of molecules giving such a controlled response is limited, as already stated before. Furthermore, these mediator molecules play almost no role in the field of electrochemical energy storage and conversion. Here, relevant products and feedstock molecules of fuel cells, electrolyzers, or various battery half-cell reactions need to be studied in a more sophisticated way. Therefore, the generation/collection modes as well as the competitive mode can be useful. The sample generation/tip collection (SG/TC) mode is displayed in
Figure 3a. Here, a relevant molecule is evolved at the surface of a substrate and detected at the microelectrode, at which various electrochemical methods can be applied. An active substrate or suitable potential leads to a signal increase at the microelectrode. This mode is often used for the product or intermediate detection of conversion reactions. In contrast, tip generation/sample collection (TG/SC) mode (
Figure 3b) is used less frequently, since the signal of the substrate is used here. The use of the substrate signal can be challenging, as small changes at high signal may be susceptible to interference. Furthermore, the competitive mode can be used where the substrate and the microelectrode compete for the very same molecule. An active substrate or a suitable potential results in a lower signal at the microelectrode because the molecules are also converted by the substrate.
Feedback and generation/collection as well as the competitive mode of SECM can be realized through various experimental approaches and not only by applying a constant potential. Therefore, a careful examination of the microelectrode process is indispensable in order to be able to draw conclusions about the later substrate interaction. Some experimental aspects are discussed in the following sections.
2.4. General Experimental Methodology
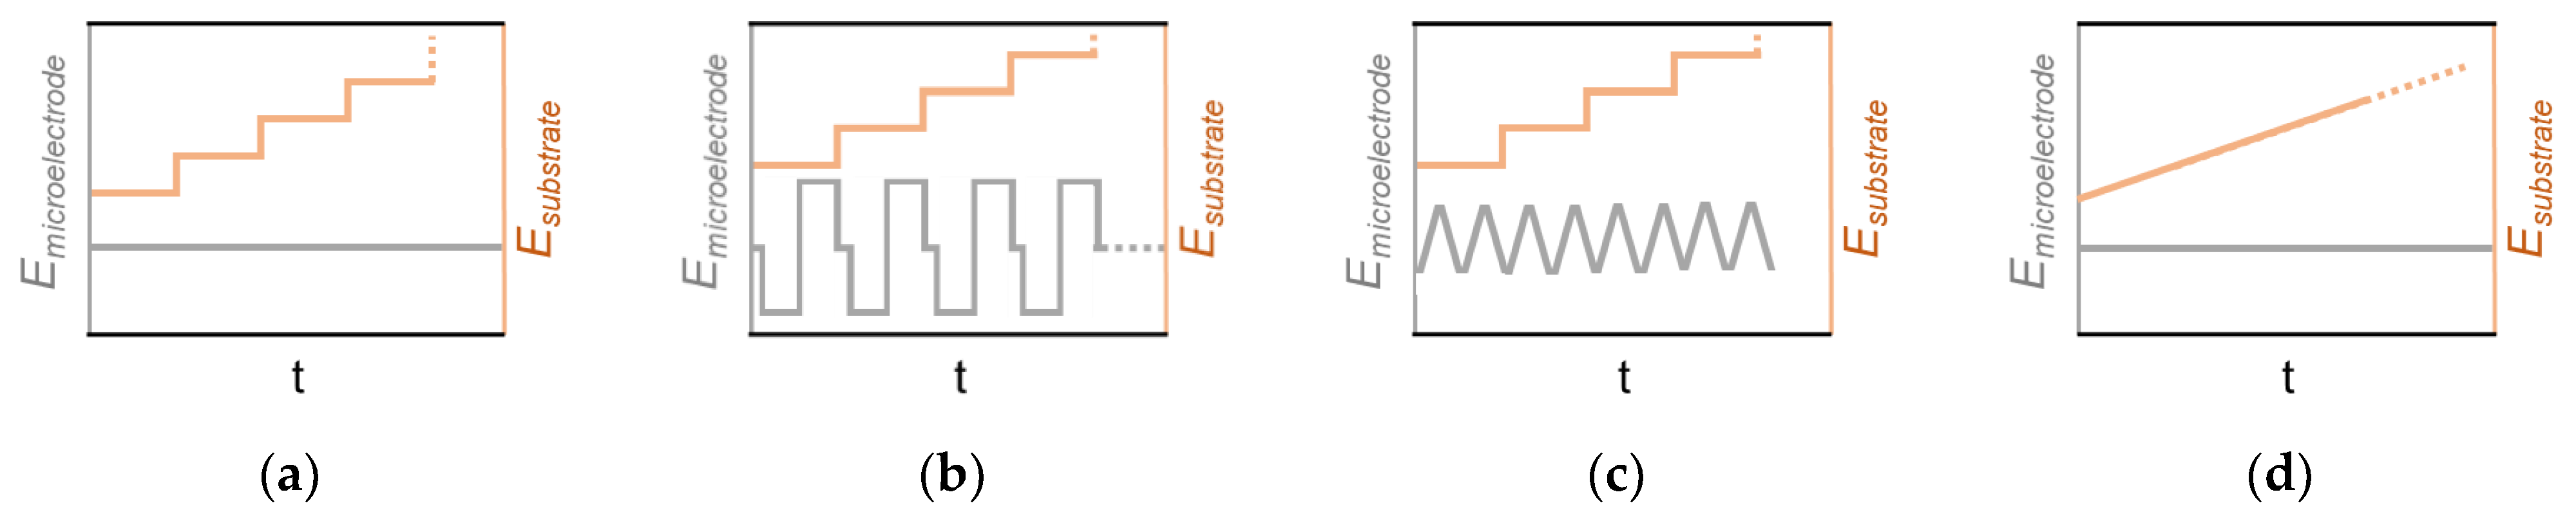
To date, numerous methods have been proposed to derive information about the electrochemical behavior of the surface from the interaction with the microelectrode. However, not all the methods can be presented here in their entirety. Selected experimental designs are displayed in
Figure 4. Beyond that, there are numerous experimental setups and methods possible. As previously discussed, a constant potential can result a constant limited current at the microelectrode, which can be used to study various substrate potentials (
Figure 4a). Here, approach curves provide kinetic data of the substrate or activity distribution by scanning the surface. Furthermore, a constant response can be generated by modulating the potential at the microelectrode in discrete steps (
Figure 4b) or through dynamic potential modulation (
Figure 4c), respectively. In both cases, the potential modulation leads to a reconstitution of the microelectrode surface, which can be necessary when the detection process inactivates the surface. In particular, it can also be used to detect the feedstock molecules and/or (side)products of the electrochemical reaction and conclusions about the selectivity of the sample surface can be drawn. However, both proceedings can prolong the data acquisition at each probed position (i.e., for visualization) to a significant extend and may require more complex data processing afterwards. Finally, the sample substrate can also be dynamically polarized (CV, LSV) while a constant potential is applied at the microelectrode (
Figure 4d). Again, it should be mentioned that there are several other modes using potentiometric or alternating current (AC) methods at the microelectrode. Many of these experimental approaches can be used to create one of the SECM modes shown before (
Figure 3).
3. Trends and Development
For more than three decades, SECM has been used to characterize materials in the field of surface analysis, corrosion, biological samples, and in particular, electrochemical conversion processes for electrical energy storage. From these, selected topics are discussed in the next section.
The direct conversion of chemical energy into electricity has been of great interest for a long time. For example, fuel cells can directly supply electricity through the reaction of hydrogen and oxygen to water in separated half-cells, which makes it very appealing. Analyzing materials and electrocatalysts towards both half-cell reactions (hydrogen oxidation and oxygen reduction reaction, HOR, ORR) quickly came into the focus of the SECM technique in the very beginning. Later, the investigation of the counter-reactions (hydrogen and oxygen evolution reaction, HER, OER), which appear in water electrolyzers, was also added. Besides hydrogen, which is discussed as a long-term storage molecule for electricity, lithium ion batteries (LIB) have developed into a state-of-the-art storage device for automotive and stationary application. Here, the study of the formation of the solid electrolyte interface (SEI) and related intercalation processes through the SECM technique has received much attention for some time. In the last three years, the electrochemical carbon dioxide reduction (CO2RR) reaction came up as a research focus and was studied by various types of SECM experiments. In contrast to all the previously mentioned topics, significantly fewer works have been published on the investigation of electrode processes in electrochemical supercapacitors, which are used as short-term storage devices with high power density. However, several articles, books, or book chapters have fully reviewed all of these topics and only selected milestones, given in the following sections, are related to the modes and experimental methodology discussed previously.
3.1. Oxygen Reduction and Evolution Reaction (ORR/OER)
From the beginning of research on fuel cells, the ORR was of particular interest because it had poor reaction kinetics and high overpotential losses. Furthermore, Pt microelectrodes, which are among the longest used materials in SECM research, were highly suitable for the detection of dissolved oxygen gas and later for the detection of hydrogen peroxide (H
2O
2), which appears as an intermediate product of the 2 + 2 electron reduction process of oxygen to water in the ORR. However, besides fuel cells, understanding ORR also has significance in the case of metal–air batteries and other electrochemical converters. In one of the first works, Liu and Bard extracted the kinetic data of a platinum substrate in alkaline medium through approach curve experiments in feedback mode, providing similar results to other electrochemical techniques [
10]. Later, a whole series of works appeared on the visualization of multi-metal catalyst libraries via TG/SC mode. Here, a constant current at the UME generates an oxygen flux that can be consumed by active catalyst spots at the substrate. In contrast to many other approaches, here, the substrate current is plotted against the microelectrode position, indicating the spots where the generated oxygen is consumed [
11]. To obtain more information about the selectivity of the ORR, the group of Schuhmann proposed a new competitive method that allowed for the visualization of both the ORR and peroxide evolution through a very short pulse sequence comparatively for the Au and Pt catalyst, whereby the Au catalyst predominately formed peroxide in the studied potential region [
12]. This method was particularly suitable for characterizing a non-noble metal catalyst (NNMC) and provided the number of transferred electrons in dependence of the applied potential [
13]. In a recent work, Limani et al. combined the application of a Au microelectrode for ORR activity determination (competitive mode) and a Pt microelectrode for peroxide determination (SG/TC mode) in a sequential experiment to study the influence of the catalyst loading on the ORR selectivity of an NNMC [
14].
As mentioned at the outset, ORR suffers from poor kinetics and high overpotential losses, which also occur in OER. A deep understanding of these loss reactions as well as the materials is of particular interest for the electrochemical water splitting. Among others, Ni, Ni/Fe, NiFeCo and Co compounds play an important role as active OER catalysts in alkaline electrolysis. In initial work nickel electrodes were subjected to SECM investigation in SG/TC mode indicating pH changes during Ni(OH)
2/NiOOH conversion as well as the potential of initial oxygen evolution (E
RP or E
onset) [
15,
16]. The screening of OER catalysts from combinatorial mixtures of tin + iridium oxides was also shown; however, an additional electrochemical shielding of the microelectrode was necessary to reduce the influence of the ongoing gas evolution of the surrounding active spots [
17]. As a special type of SECM feedback experiment, SI-SECM was used to determine exactly the density of catalytically active sites on a cobalt oxide surface as well as rate constants of the cobalt (II/III) and (III/IV) transition [
18]. In a more recent work, this approach was also used to determine the surface sites of electrodeposited manganese oxide samples [
19].
3.2. Hydrogen Oxidation and Evolution Reaction (HOR/HER)
Besides ORR and OER, hydrogen oxidation (HOR) and evolution reaction (HER) were also within the scope of SECM research. HOR, which is the anode side reaction of several types of fuel cells, is a useful reaction to study kinetics and mechanisms of various noble metal substrates by fitting and evaluating the approach curve data. Initially, the feedback mode with approach curve experiments was used to characterize a polycrystalline Pt electrode in sulfuric acid solutions. In addition, the influence of carbon monoxide poisoning of the surface was studied [
20]. In the same way, Zoski studied the kinetics on Pt, Ir, and Rh substrates in acid media and provided Tafel slopes and rate constants for all three metals [
21]. In a recent work, the group of Bertotti showed kinetic data on a platinum-decorated nanoporous gold surface [
22].
In addition to hydrogen, small organic molecules like methanol or formic acid are discussed as alternatives for the anodic feed of low-temperature fuel cells. These oxidation reactions can also be probed through SECM experiments. Recently, a sequential pulse profile was suggested for the simultaneous determination of local catalytic activity for the methanol oxidation reaction and CO evolution of PtRu-supported carbon nanotubes [
23].
The hydrogen evolution reaction (HER) is the reaction at the cathode side of water as well as chlor-alkali electrolyzers. For the industrial supply of green hydrogen, these processes are considered key technologies. Initially, the feedback mode was used to study the electron transfer processes during HER at Pd nanoparticles via methyl viologen radical cations using a Pt microelectrode. Also in this work, kinetic data could be extracted from approach curve data fitting [
24]. The SG/TC mode of SECM was also applied for HER investigations and a reproducible hydrogen quantification could be obtained using a Pd-modified microelectrode [
25]. Recently, hydrogen evolution detection using sub 100 nm microelectrode in a fast scan procedure delivered high-resolution images of active centers at the edges of MoS
2 nanosheets [
26].
3.3. Processes in Lithium Ion Batteries (LIBs)
Lithium ion batteries have developed into a state-of-the-art technology for electrochemical energy storage. It is widely used for high-power or high-energy-density applications. Understanding the individual phenomena of processes in LIB is of particular interest for further battery development and has already been investigated using the SECM technique, including solid electrolyte interface (SEI) and cathode electrolyte interface (CEI) formation, metal plating, and dendrite formation as well as gas evolution reactions. However, some of these phenomena are not restricted to Li but also occur in Na or K ion batteries. In all cases, SECM experiments require gas-tight cells or transferring the instrument into a glove box to avoid contamination from water and air. Mainly, the feedback mode of SECM was used to characterize interfacial processes through the addition of a suitable redox mediator. In an initial work, titanium dioxide paste electrodes were probed during Li intercalation and SEI formation that changed the initial positive feedback into negative right after formation because of its insulating character [
27]. The group of Wittstock analyzed the temporal and spatial changes in SEI on a graphite electrode and observed fluctuation of the insulating character over time and an inhomogeneous distribution of the SEI in the sample [
28]. In contrast, SECM feedback experiments at high voltage lithium–nickel–manganese–cobalt (NMC) and lithium–nickel–manganese (LNM) oxide cathodes showed an electronically conducting layer formed here [
29]. A redox-mediator-free method of direct Li and Na ion determination was suggested by Rodríguez-López’s group. Here, a Li or Na amalgam is formed through electrochemical reduction at a Pt or carbon microelectrode and re-oxidized through anodic stripping voltammetry (ASV) [
30]. Probing various anode materials towards the SEI stability and properties can be found in some recent works. The feedback mode of SECM with a redox mediator molecule has been used together with other in situ and operando techniques for studying bare Li metal in the presence of Li
2S
8 [
31] as well as the degradation mechanisms of the aging process of commercial silicon–graphite electrodes [
32].
3.4. Carbon Dioxide Reduction Reaction (CO2RR)
The conversion of carbon dioxide into valuable chemicals or a defined precursor, such as syngas, in a highly selective and efficient manner remains a major challenge in renewable energy research. Among different approaches for carbon dioxide fixation, the electrochemical reduction (CO2RR) is one of the more promising techniques and requires for highly selective and stable electrode materials for CO
2 electrolysis. Although SECM can be seen as one building block in a multiscale approach for understanding dynamic processes on the electrode surface, it is used as a powerful in situ technique. Here, the research is mainly focused on Au, Cu, and Ag electrodes. In an early work, Sreekanth and Phani suggested cyclic voltammetry at the microelectrode creating a SG/TC mode to study formate and carbon monoxide formation on a Au substrate [
33]. Later, the same approach was also used for investigating the influence of a roughened Au surface on the selectivity [
34]. In contrast, the group of Nogalla applied a feedback mode experiment assuming only formate formation during CO2RR over an electrodeposited Cu structure [
35]. In a much noted work, Koper’s group comparatively studied the activities of Au, Cu, and Ag electrodes towards the presence of cations in the electrolyte. Again, the product evolution (carbon monoxide here) was analyzed through the SG/TC mode using CV at a Pt microelectrode [
36]. Alternatively, the SG/TC mode with a pulse profile at a Au nanoelectrode can be applied to locally measure the amount of carbon monoxide evolved along a gradient loaded gas diffusion electrode [
37]. Due to the high overpotential of the CO2RR, hydrogen evolution (HER) can often be observed in parallel affecting the local pH at the surface. Schuhmann’s group evaluated the pH dependency of PtO reduction potential during the CV of a Pt microelectrode and found strong pH changes during CO2RR on a Ag gas diffusion electrode [
38]. In a recent work, it was shown that extracted currents from CV curves in SG/TC mode could also be used for the imaging purpose of a Cu/Al alloy [
39].
3.5. Supercapacitors
Electrochemical supercapacitors are a necessary component of energy storage and are designed to deliver high energy density and long cycling stability. In some cases, they can already be found in electronic devices and automotive applications. The investigation of electrode materials, such as metal oxides as well as carbon-based materials, has also been carried out using SECM. Initially, Lee’s group studied a α-MnO
2 electrode and found a positive feedback current during the SECM approach curve, indicating an efficient charge transfer process into the electrode, which seems to be highly essential for a high-performance supercapacitor [
40]. Later, carbon-based electrodes, such as polyaniline [
41] and carbon composite electrodes [
42], were studied using a similar approach to determine the charge transfer rate constants (k
eff) of the materials. Recently, carbon nanotubes were investigated as electrode materials through feedback experiments, which provided information about surface wettability, and in the SG/TC mode to study the parasitic HER at low substrate potentials [
43].
4. Conclusions and Prospects
Scanning electrochemical microscopy is a powerful technique for probing electrochemical conversion reactions, in particular in aqueous media. Besides the visualization of active structures and electrochemical hot-spots, kinetic data as well as (side)product formation can be analyzed using various experimental approaches. It has also become clear that, in different research fields of electrochemical energy conversion, selected experimental methods and modes dominate. For example, the hydrogen evolution reaction can be excellently studied by fitting the approach curves in the feedback mode, while carbon dioxide reduction requires dynamic sweeping at the microelectrode to draw conclusions about product formation and selectivity. In the case of the oxygen reduction reaction, the visualization of multi-metal catalyst libraries demands for a method other than the analysis of the electron transfer mechanism. Furthermore, SECM has also been used to study other aqueous and non-aqueous half-cell reactions that are promising candidates for electrochemical energy storage, such as flow batteries, by using various experimental approaches.
Since the beginning of its development, SECM has also been extended with other techniques and methods, or ideas from other probe microscopies have been adopted for it. SECM was combined with different instrumental techniques, where some of them have appeared in only a few works and others have been continuously developed. AFM-SECM is such a technique using a combined AFM-SECM cantilever as a probe. It was described very soon after SECM’s introduction, and it is still being worked on today. A recent work from Kranz’s group describes its application by studying the SEI in LIBs and providing complementary information about topography and local electrochemistry [
44].
Photo-SECM is a technique that studies a light-addressable reaction by illuminating the substrate either from the backside or simultaneously with the glass body of the microelectrode. A localized photoelectrochemical water-splitting reaction was recently shown at a single Al-doped SrTiO
3 microcrystal detecting photogenerated oxygen and hydrogen molecules in the SG/TC mode using a light-conducting Pt nanoelectrode [
45].
In addition, vibrational spectroscopy was combined with SECM, where Raman microscopy, among others, is very suitable to obtain complementary (spatially resolved) spectroscopic data due to the same probing dimension and its application especially in aqueous electrolytes. Recently, CO2RR was studied through the SG/TC mode using a platinum microelectrode and the structural changes in a single Cu
2O microcrystal via Raman microscopy. The microelectrode response indicates the presence of hydrogen and formate ions during reduction and the spectroscopic data allow for the conclusion of an early conversion of Cu
2O to elemental copper [
46].
From all these aspects, it should be clear that this technique has outstanding strengths for the investigation of electrochemical energy storage and conversion reactions. However, other electrochemical scanning probe techniques (EC-SPT) have also been established in this field in recent years, with electrochemical scanning tunneling microscopy (EC-STM) and electrochemical cell microscopy (SECCM) being particularly noteworthy.


