1. Introduction
Many assets of reinforced-concrete infrastructure currently in service were built during the major construction wave of the 1970s and 1980s; reinforced-concrete bridge decks constructed from the mid-1970s to the late 1980s are a well-documented example of this aging asset stock [
1,
2]. More recently, durability-oriented innovations have also been demonstrated on a field scale; for instance, the first large-scale application of self-healing concrete in Belgium showed the practical potential of such approaches [
3]. Despite its inherent durability, concrete remains susceptible to deterioration over time. It can develop cracks, voids, delamination, and other forms of internal deterioration [
4]. These deterioration processes are often driven or accelerated by environmental exposure and reinforcement corrosion (e.g., chloride ingress, carbonation), which can further compromise structural performance and durability [
5,
6]. These defects gradually weaken the structure and, in severe cases, can pose safety hazards, such as falling debris. To avoid such risks, reliable inspection methods are essential for timely maintenance and repair planning [
7].
Traditional inspections often rely on destructive testing methods, such as drilling cores, to assess material condition. Although effective for detailed analysis, these methods cause local damage and are not practical for frequent or large-scale monitoring. Moreover, access constraints and operational disruptions can make extensive intrusive testing costly and difficult to deploy at scale [
8]. In many tunnels, inspections are still carried out manually, with workers tapping the lining with a hammer and judging the sound by ear [
9]. This approach is simple, but subjective, physically demanding and difficult to standardize [
10]. Field guidance also notes that hammer-sounding outcomes can be highly operator dependent and sensitive to ambient noise [
11].
Non-Destructive Testing (NDT) methods offer an alternative that can be faster, repeatable, and more objective [
12]. For concrete, widely used NDT families include stress-wave methods (e.g., impact-echo), ultrasonic techniques, GPR, and acoustic emission [
8,
13]. Vibration-based techniques, in particular, can detect structural changes by measuring shifts in resonance frequencies, changes in amplitude, and changes in mode shapes [
14]. This aligns with the larger concept of Structural Health Monitoring (SHM), where damage-sensitive dynamic features are used for condition evaluation, while accounting for environmental and operational variability [
15,
16]. When a structure is excited mechanically, acoustically, or by a controlled shaker, its response carries information about stiffness, mass distribution, and internal condition. To improve robustness and scalability, statistical pattern recognition and machine learning methods are increasingly applied for feature extraction and classification in SHM/NDT [
17,
18,
19].
Laser Doppler Vibrometry (LDV) is a non-contact optical measurement technique that determines surface vibration velocity by detecting the Doppler frequency shift of laser light reflected from a vibrating surface. The measured frequency shift is directly proportional to the surface velocity, enabling highly sensitive vibration measurements without physical contact or mass loading effects [
20]. In scanning LDV systems, galvanometer mirrors automatically reposition the laser beam over multiple measurement locations, enabling high-spatial-resolution vibration measurements and modal analysis. Compared to conventional contact sensors such as accelerometers, LDV offers several important advantages. Since no sensor is attached to the structure, the dynamic behavior of lightweight or compliant structures is not altered by sensor mass loading. Furthermore, LDV enables remote measurements, high spatial resolution, and measurements on structures where physical sensor placement is difficult or impractical. These advantages have resulted in applications in experimental modal analysis, structural health monitoring, MEMS characterization, acoustics, biomedical measurements, and vibration analysis of rotating machinery.
Within the current state of research, vibration-based NDT and Laser Doppler Vibrometry (LDV)-based measurements have already been applied to concrete inspection in several ways. Conventional NDT studies for concrete include stress wave methods, ultrasonic testing, ground-penetrating radar, acoustic emission, and impact-echo approaches [
8,
13]. In vibration-based SHM, structural damage is commonly associated with changes in resonance frequencies, response amplitudes, damping behavior, and mode shapes [
15,
16]. LDV is particularly attractive in this context because it enables non-contact vibration measurements without sensor mass loading and is therefore well suited to measuring the frequency-response signatures of concrete specimens [
20,
21].
More specifically, previous studies have demonstrated the potential of non-contact or minimally contact-based vibration measurements for concrete defect detection. Akamatsu et al. [
14] investigated concrete inspection using acoustic excitation combined with scanning LDV. Muramatsu et al. [
22] showed that LDV signals can be used for non-contact flaw detection in concrete when combined with neural network classification. Yasuda et al. [
23] proposed the use of laser-ablation-induced vibration for detecting and estimating the characteristics of defects in concrete structures. Scherr et al. [
24] further demonstrated the use of laser ablation impact-echo measurements for detecting delaminations in concrete plates. In addition, automated non-contact resonance excitation has been explored in related civil-engineering materials, showing the relevance of automated excitation strategies for future inspection systems [
25].
However, despite these developments, the current literature remains fragmented with respect to excitation strategy. Most studies focus on one excitation principle or one measurement configuration at a time. Consequently, there is still limited direct experimental evidence showing how different excitation methods perform when evaluated under identical LDV measurement conditions on the same type of concrete specimens with known defect configurations. This is an important research gap, because the excitation method strongly influences the measurable frequency content, signal-to-noise ratio, repeatability, and the visibility of defect-sensitive resonance features. Without such a comparison, it remains difficult to determine which excitation approach is most suitable for future automated and scalable LDV-based inspection of concrete structures.
Therefore, the aim of this research article is to systematically compare three excitation approaches for LDV-based non-contact damage detection in concrete: mechanical impact excitation, acoustic excitation, and shaker excitation. The scope of the study is limited to laboratory-scale concrete specimens with controlled artificial defects, including voids, delamination-type inclusions, and cracks. The novelty of this work lies in the direct side-by-side experimental comparison of these excitation methods under identical LDV measurement conditions, combined with the development and evaluation of a custom compressed-air impact device as a low-cost mechanical excitation alternative. By linking the measured frequency-response characteristics to known defect configurations, this study identifies which excitation methods provide the most reliable defect-sensitive vibration signatures and clarifies their potential for future automated concrete inspection.
2. Materials and Methods
2.1. Materials
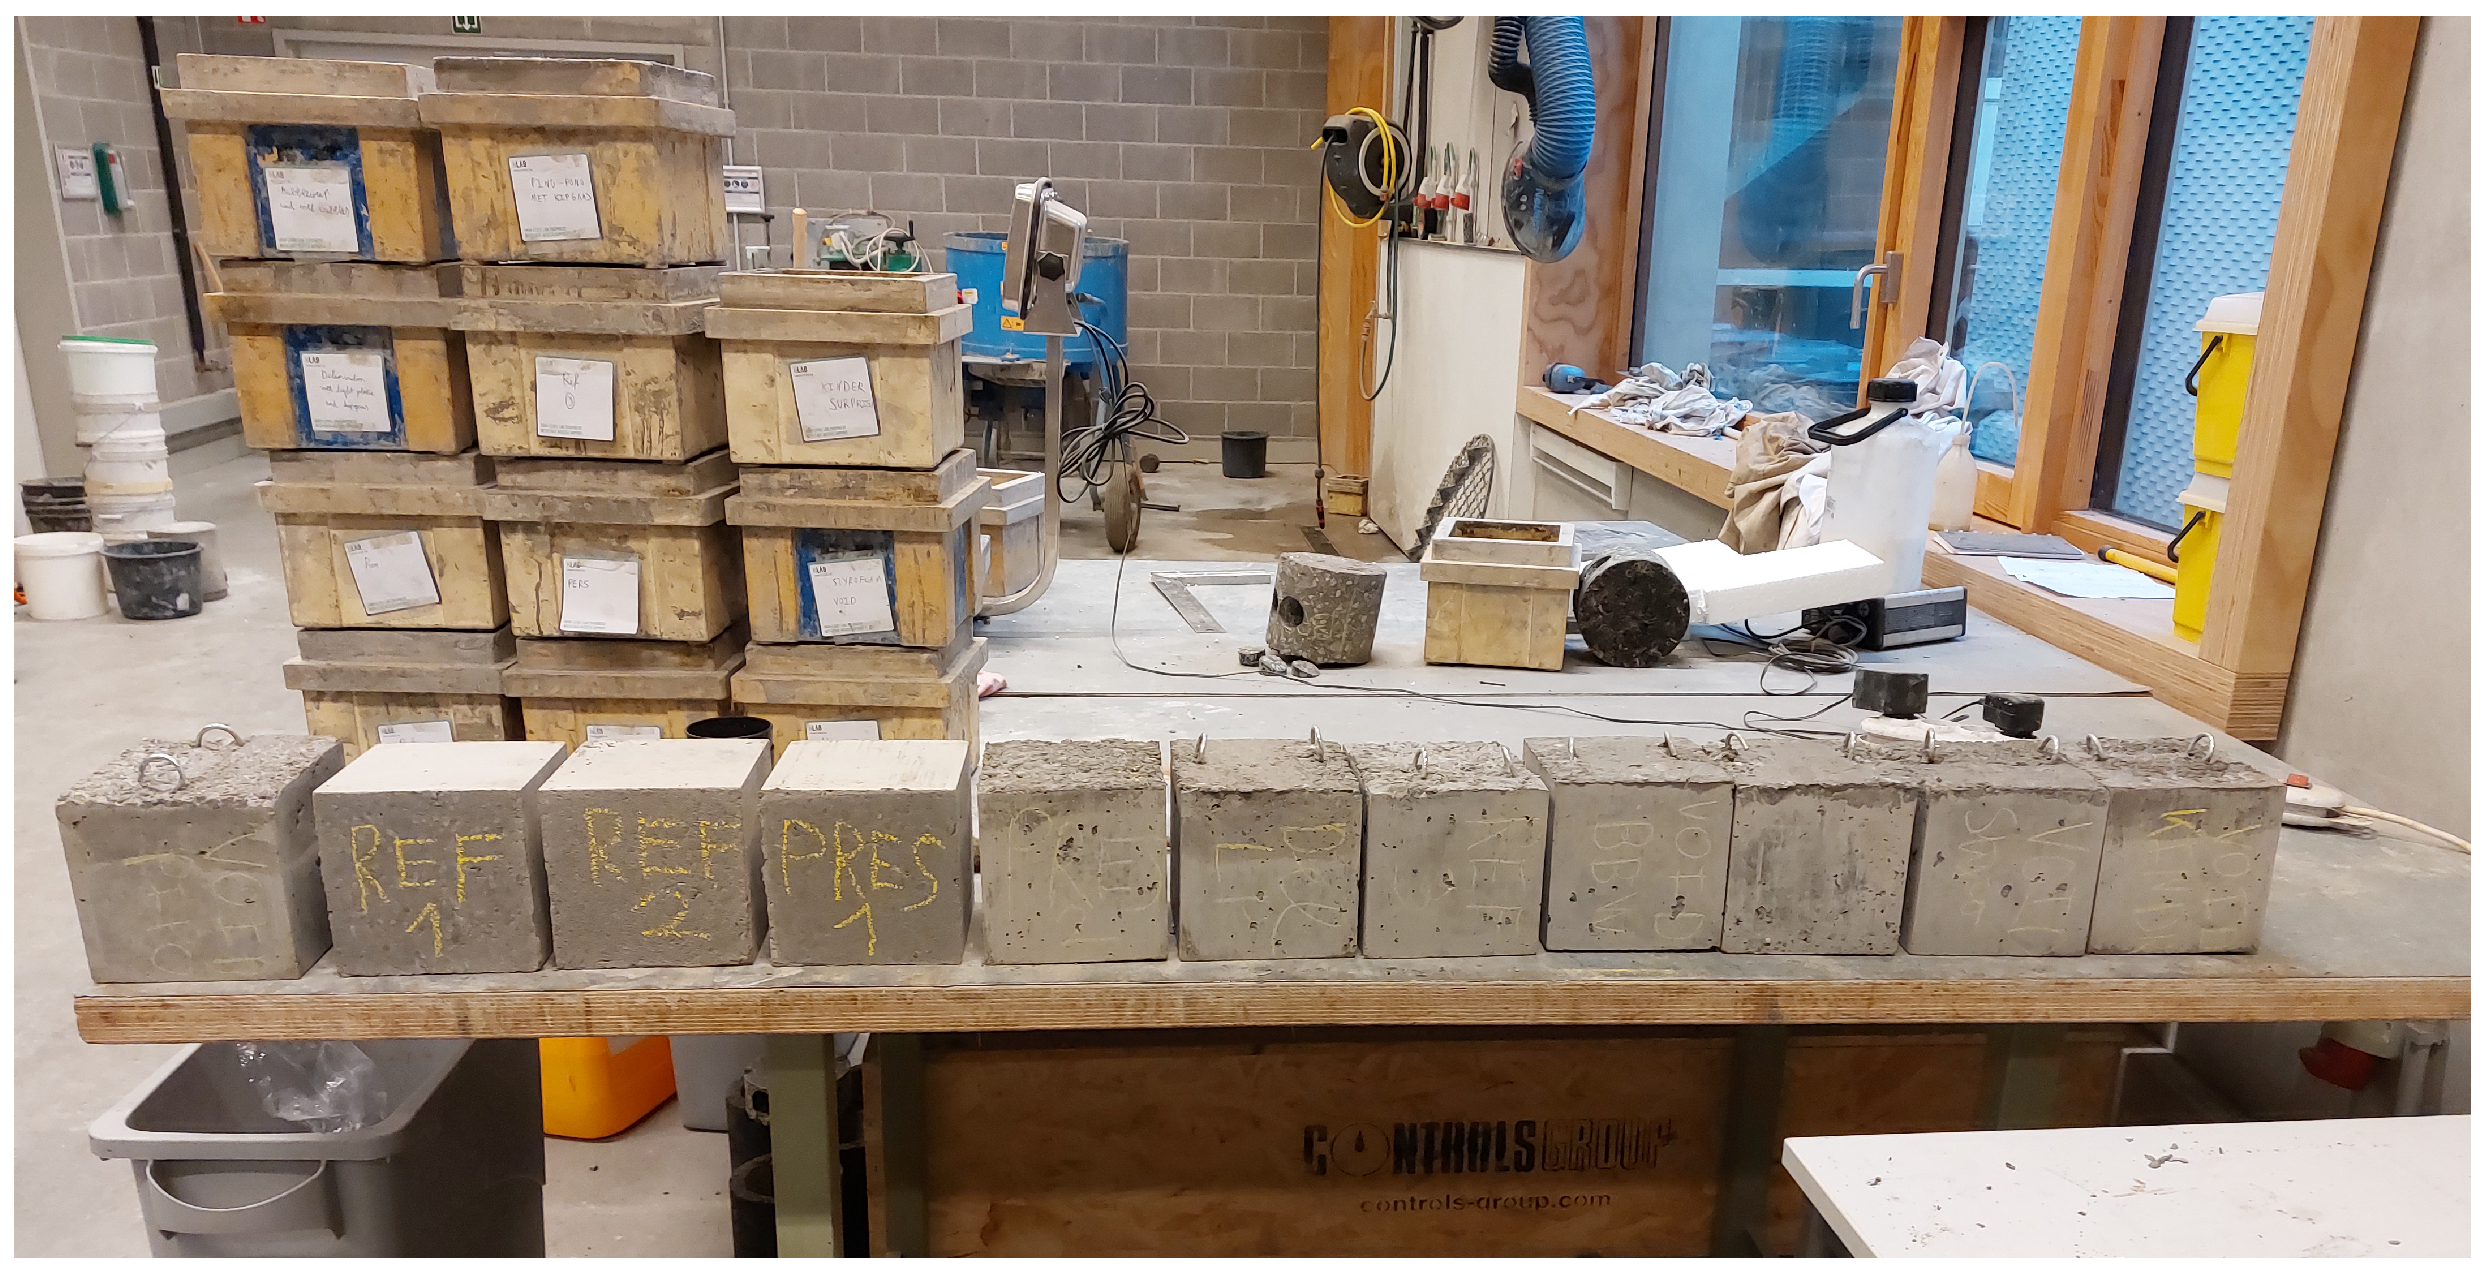
Firstly, concrete blocks were custom made to allow for small-sample testing, these are shown in
Figure 1. The test samples consisted of cubic concrete blocks with dimensions of 150 × 150 × 150 mm and an average mass of
kg. These blocks were cast with standard cement concrete and were used both as reference samples and as modified samples containing artificial defects. All samples were produced in-house at the SuPAR laboratory (University of Antwerp). Reusable rigid molds were used to obtain the target cube geometry. Before casting, the mold surfaces were cleaned and lightly oiled to facilitate demolding and reduce surface damage. The concrete mixture was prepared in batches using a standard procedure: dry components were first mixed, after which water was added gradually while mixing until a homogeneous consistency was obtained. To minimize trapped air and improve compaction, the filled molds were placed on a vibration table during casting (vibration-assisted compaction), after which the top surface was leveled. After demolding, the samples were stored under ambient laboratory conditions at room temperature (≈19 °C) for one month prior to testing. Artificial defects were introduced during casting by placing pre-defined inserts at specified locations in the molds, ensuring repeatable defect geometry and positioning across specimens.
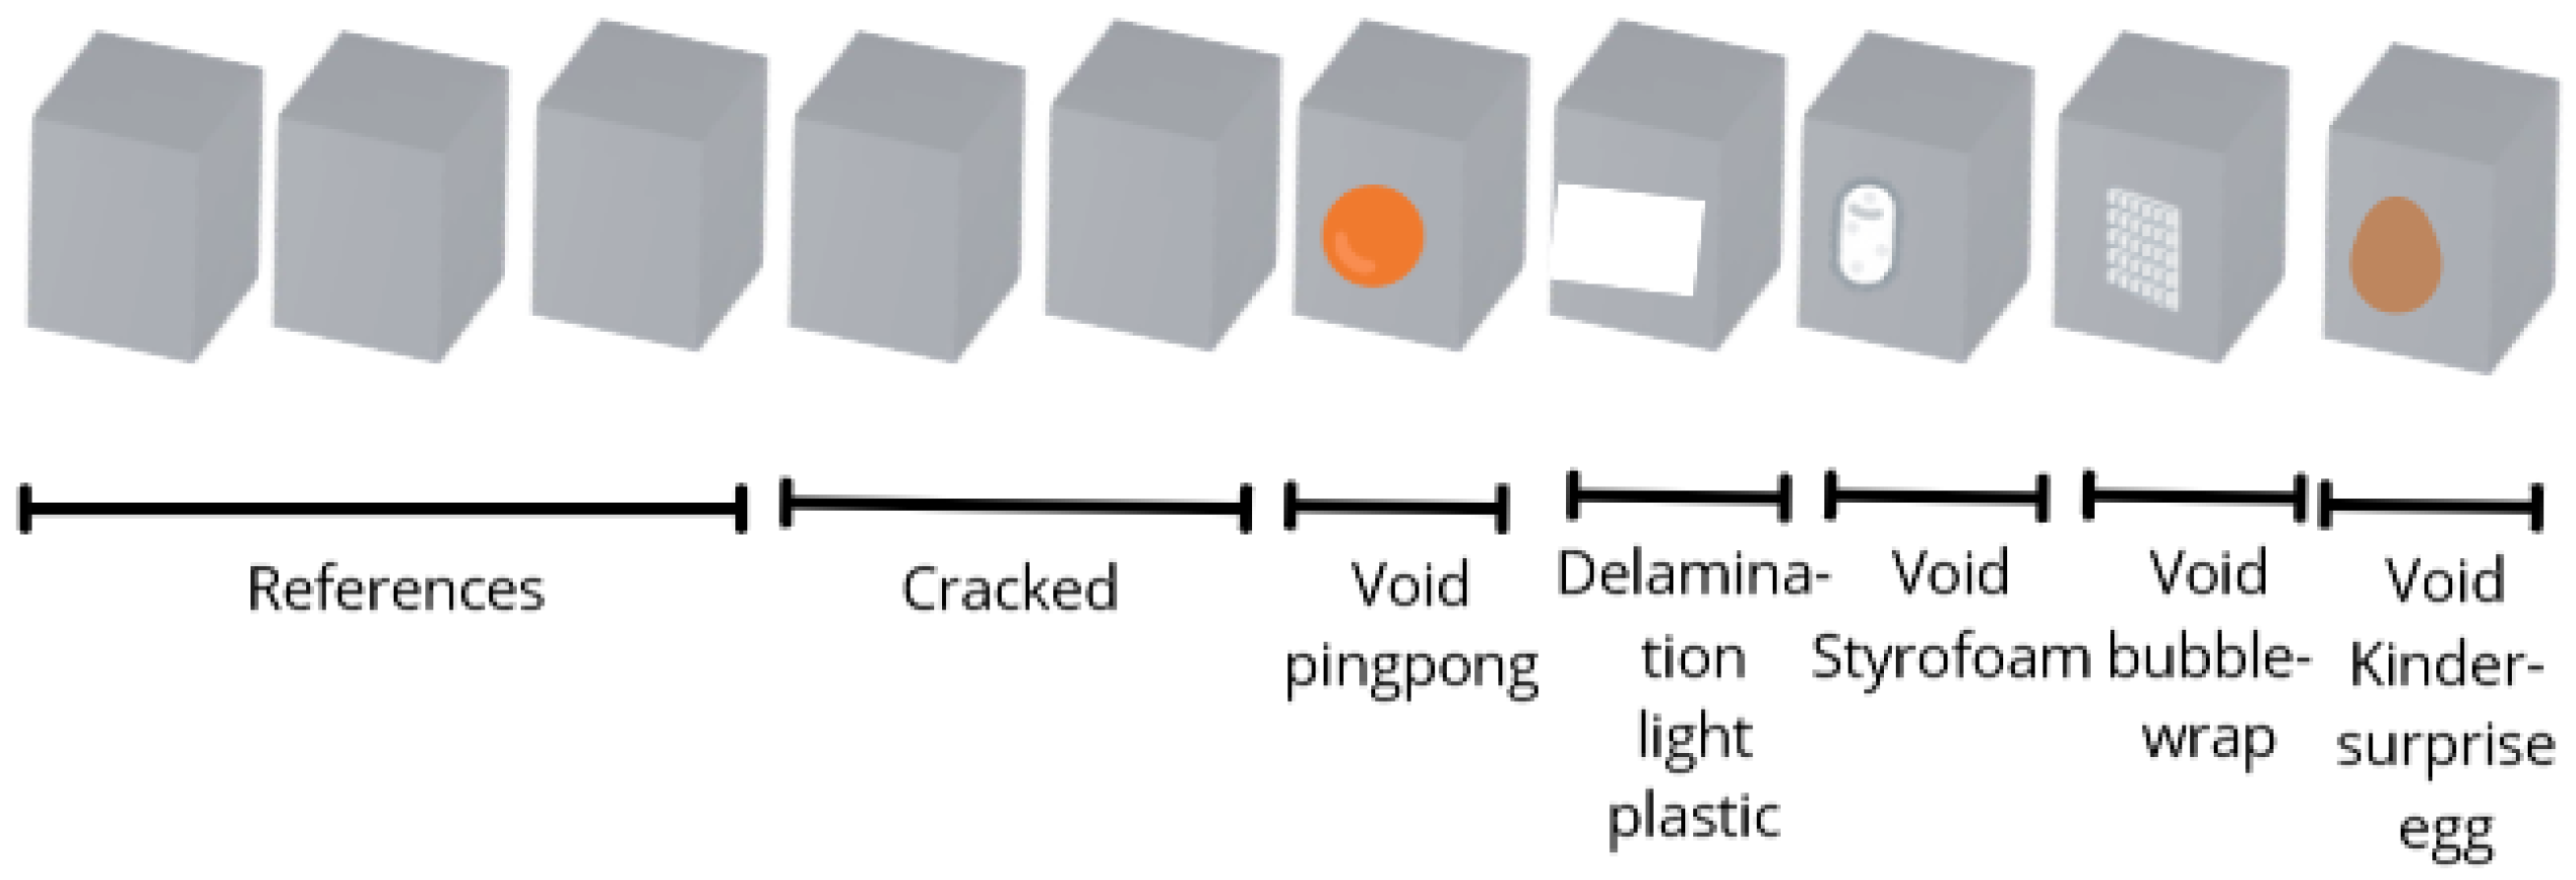
To simulate internal anomalies, certain blocks were prepared with embedded objects intended to represent voids or delamination. These included a ping-pong ball with a diameter of 40 mm, a polystyrene insert measuring 30 × 30 × 15 mm and a plastic capsule with a diameter of 32 mm and a height of 45 mm, similar to those found inside Kinder’s toy-filled chocolate eggs. In addition to these inclusions, two samples were deliberately cracked using a mechanical press to replicate the type of damage that is often seen in aged or overstressed concrete structures. The applied load was carefully controlled so that visible cracks on the surface formed without compromising the overall integrity of the blocks. An overview of the concrete test blocks and the considered defect types is shown in
Figure 2.
2.2. Shaker Excitation
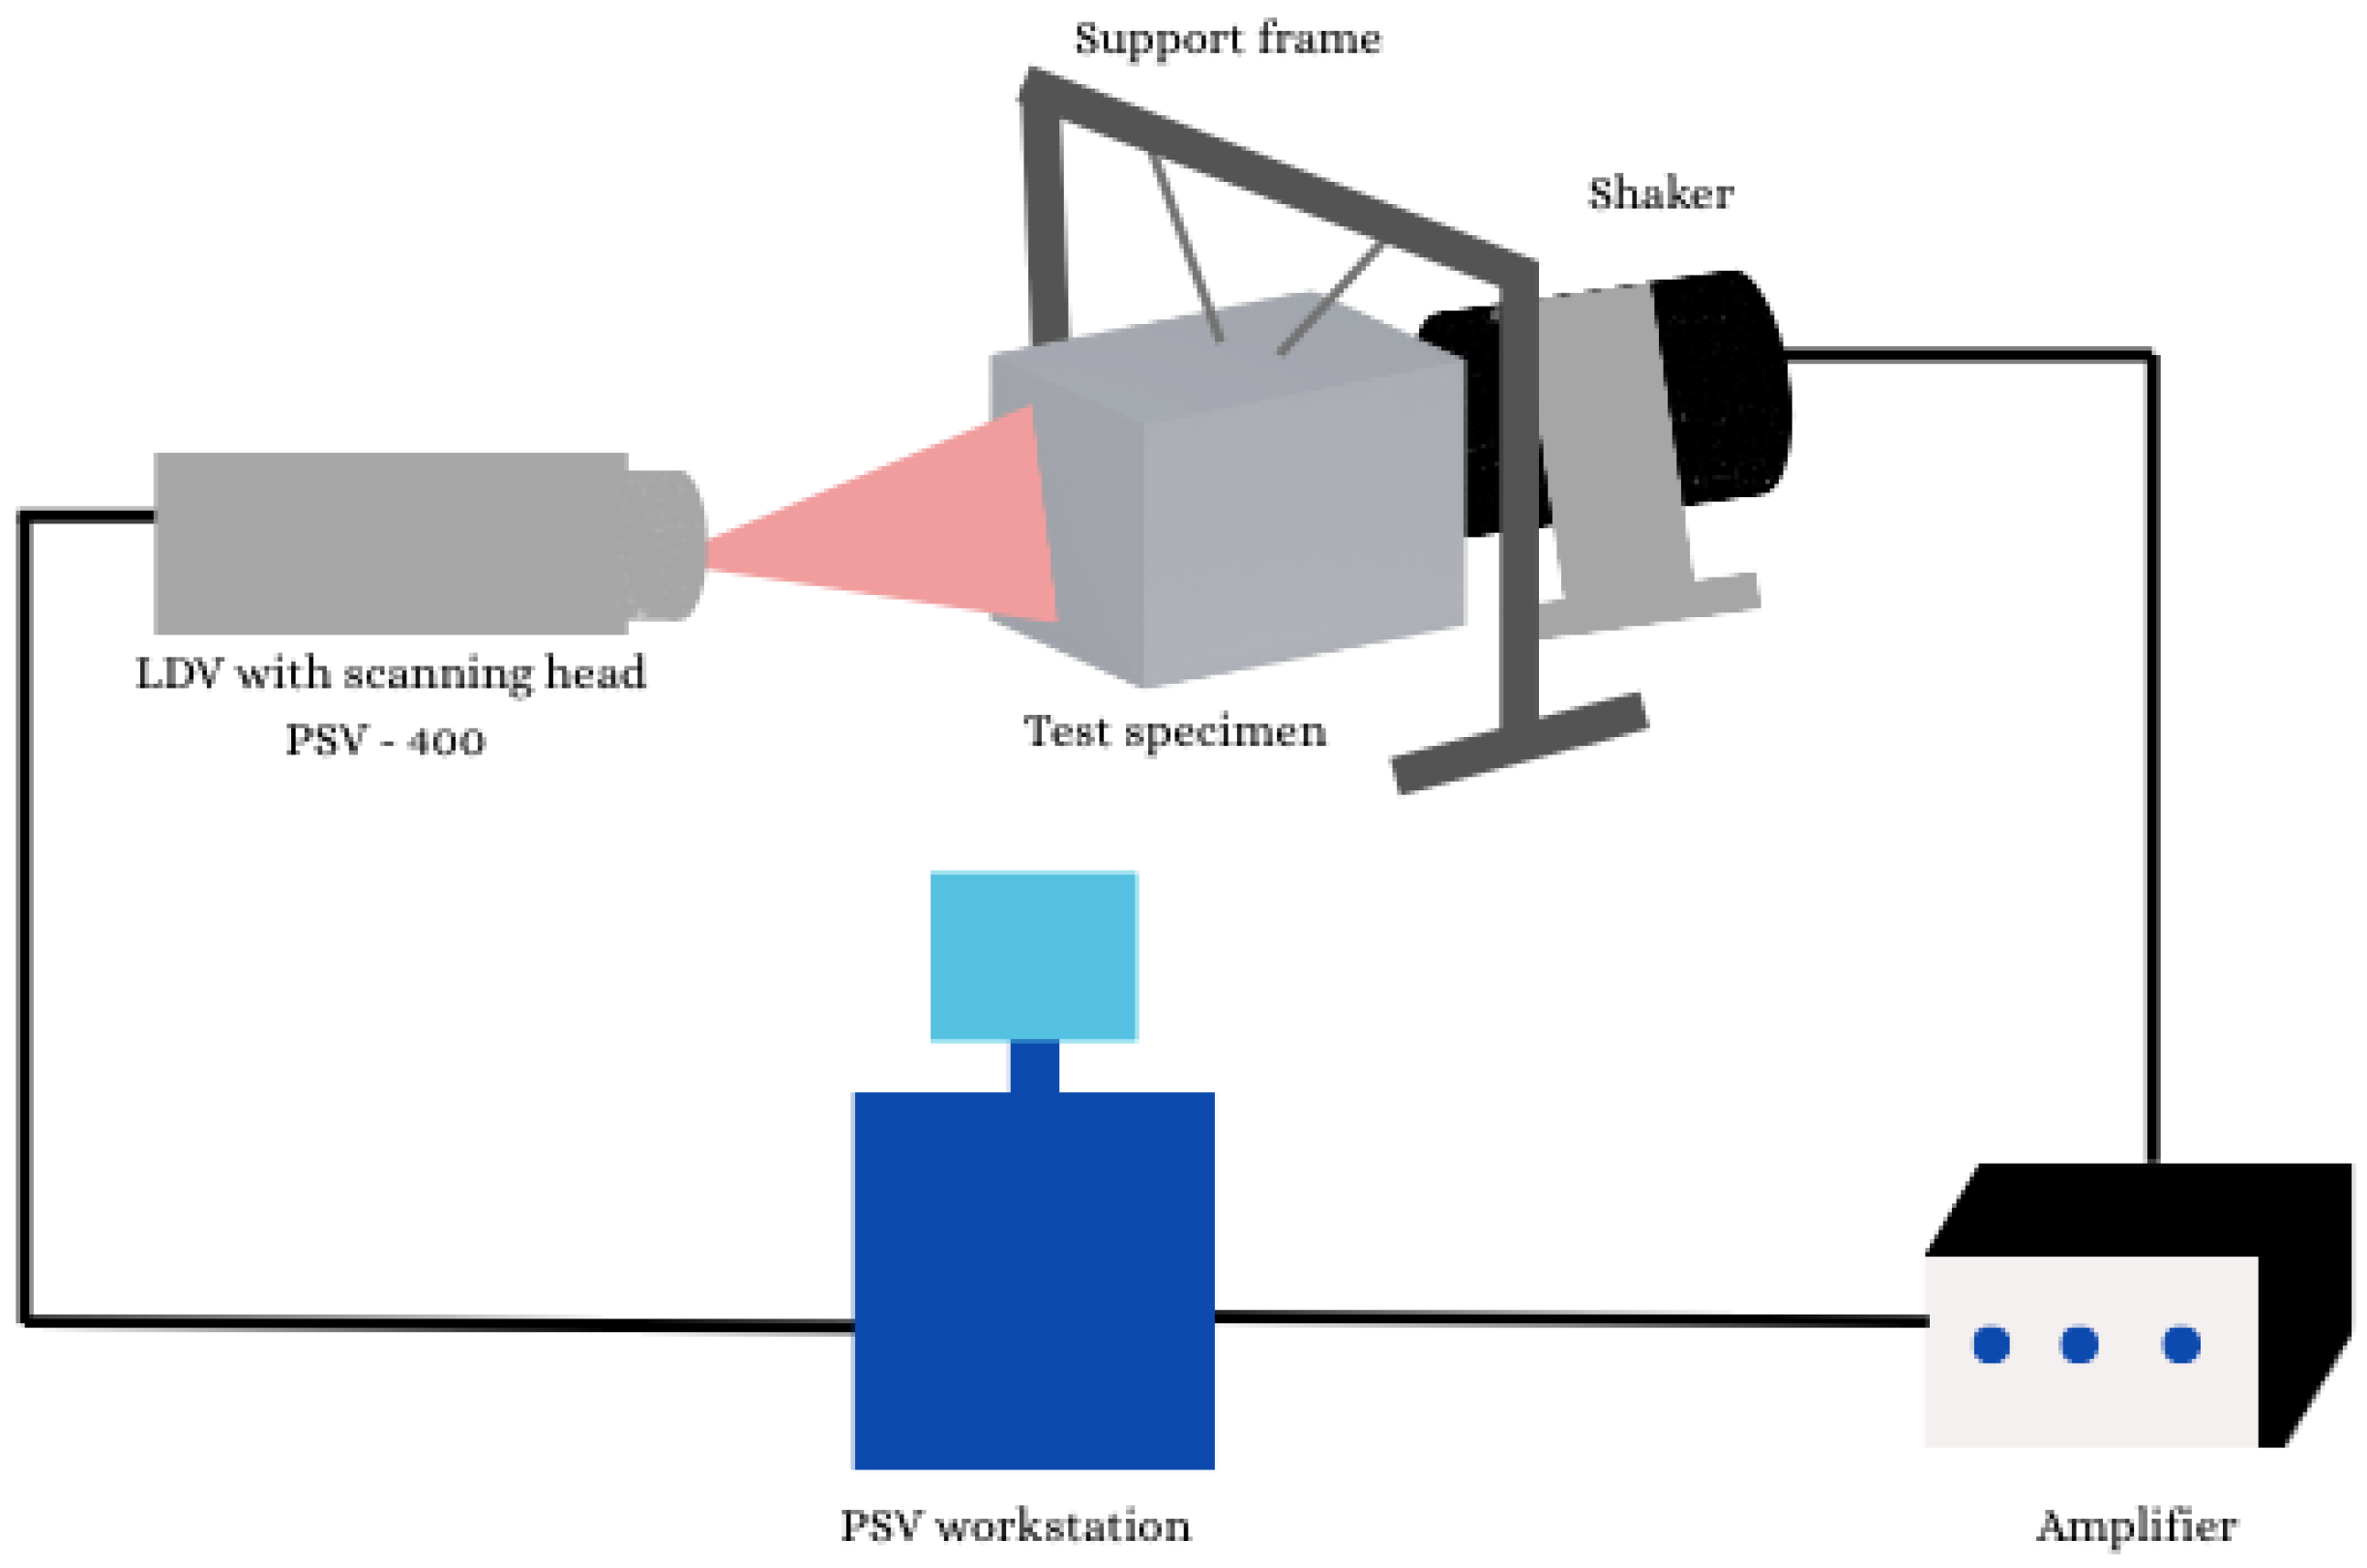
In addition to mechanical and acoustic methods, electrodynamic excitation was applied using two different shakers: a Vibration Exciter, type 4809 (Brüel & KjÆr, NÆrum, Denmark), and a Qlws miniature surface-mounted shaker (Qsources, Liège, Belgium). The BRÜEL & KJÆR system was initially used as a reference, operating over a frequency range from DC to 20 kHz. However, its performance showed limitations at both ends of the spectrum, delivering a minimal input force at below 6 kHz and a reduced excitation efficiency at above 15 kHz. The Qsources Qlws shaker, by contrast, offered several advantages for small-scale testing. Its low mass and compact form factor allowed it to be mounted directly on the concrete surface with minimal influence on the sample’s mass. This direct coupling improved the efficiency of force transmission and provided cleaner frequency response data with fewer artifacts. In both shaker setups, the excitation force was measured by an integrated force sensor and the vibrational response was recorded by the LDV. This allowed Frequency Response Functions (FRFs) to be calculated, enabling a detailed comparison between the excitation methods.
It should be noted that the electrodynamic shaker was used in this study as a controlled reference excitation method rather than as a final field-deployable inspection solution. The shaker provides repeatable excitation and is therefore useful for comparing the dynamic response of the different concrete specimens under controlled laboratory conditions. However, its practical use for large-scale or in situ inspection is limited by the need for physical contact, mounting, and relatively bulky equipment. Therefore, the claim of efficient and scalable inspection should not be interpreted as referring specifically to the electrodynamic shaker setup, but rather to the broader LDV-based inspection concept combined with more practical excitation sources, such as the compressed-air cannon or other compact automated impact systems.The specifications of the shakers can be found in
Table 1, with a visualization of the setup in
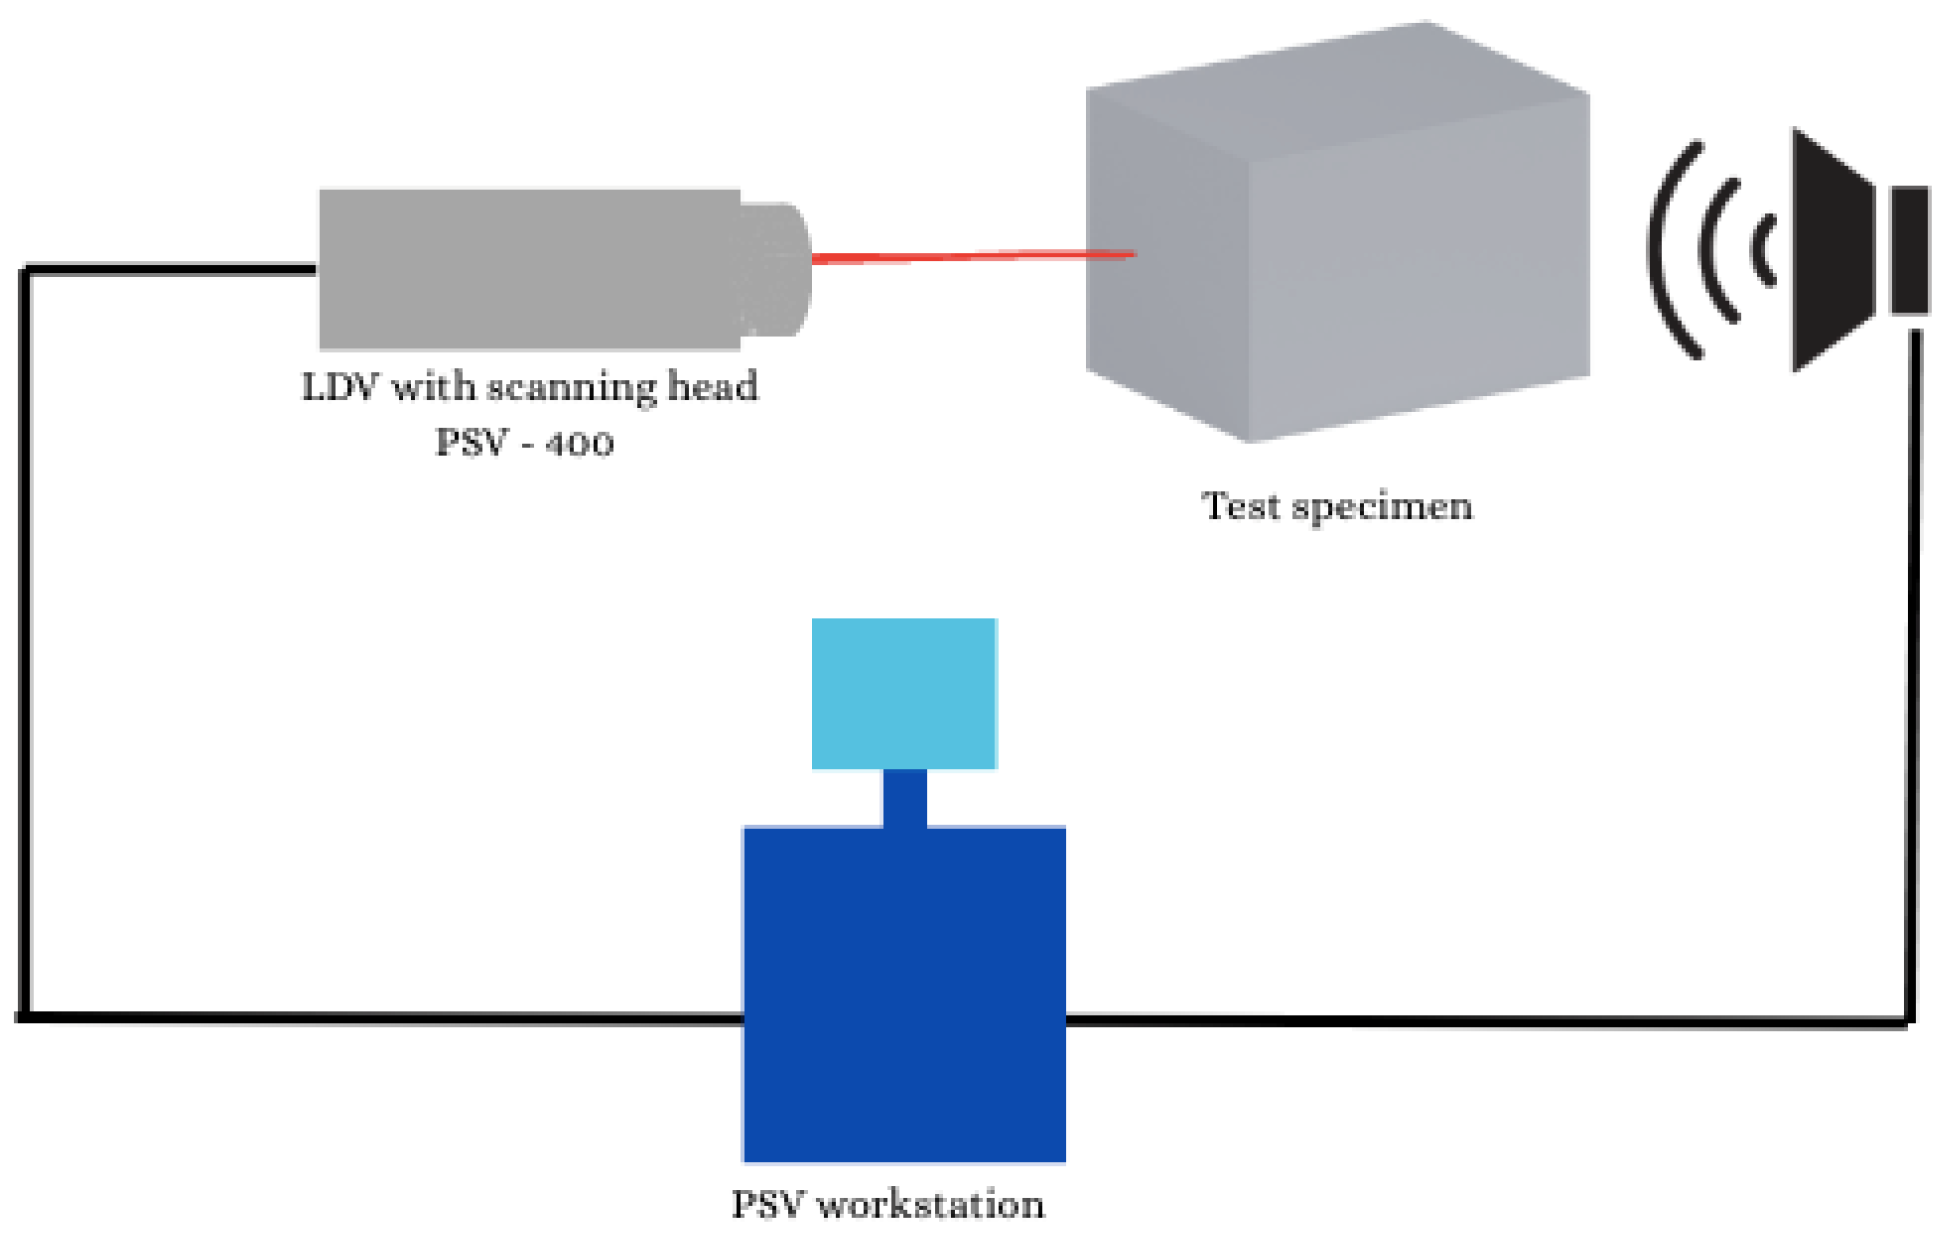
Figure 3.
2.3. Mechanical Excitation
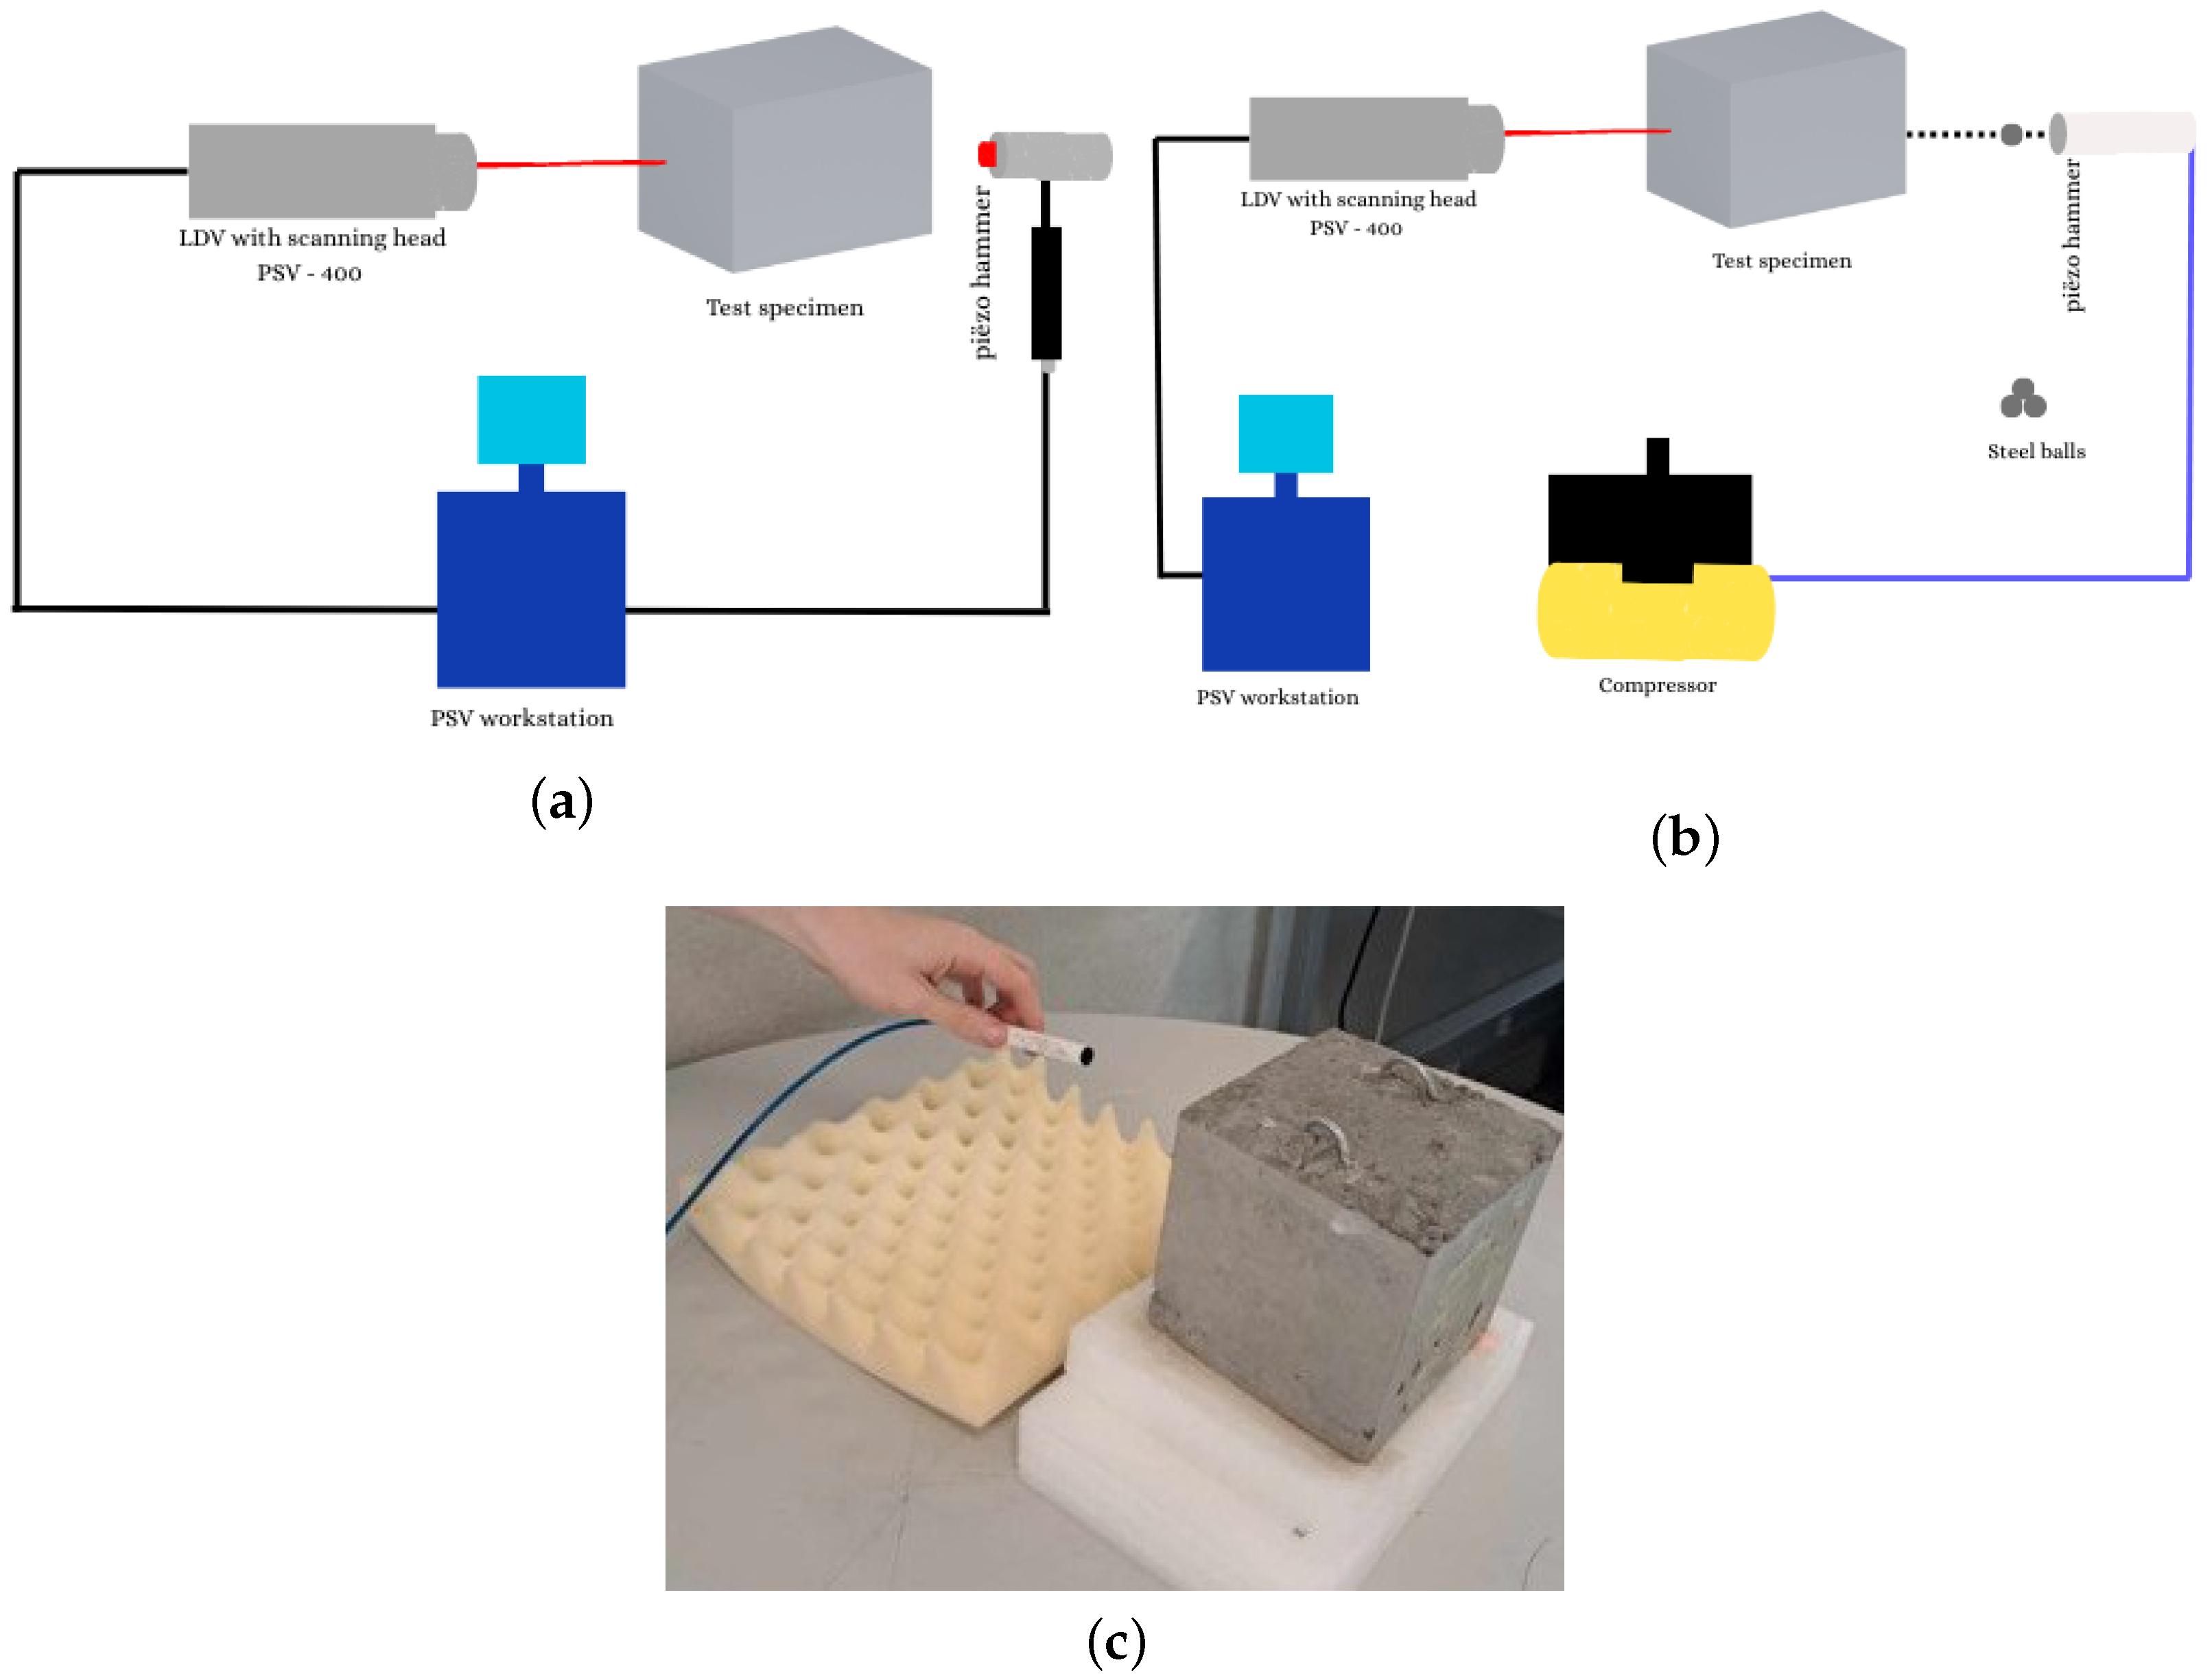
To generate vibrations in the concrete samples, two mechanical excitation techniques were investigated: impact excitation with an instrumented hammer (PCB Piezotronics, Modally tuned hammer, Model 086C03, Buffalo, NY, USA) and impulsive excitation using a small compressed-air cannon. The hammer method involved striking the surface of the sample with an instrumented hammer capable of producing a broadband excitation from DC up to 10 kHz. The force of each impact was measured by a load cell with a sensitivity of 2.2 mV/N, enabling calculation of the Frequency Response Function (FRF). This made it possible to compare the FRFs of the different samples in both frequency and amplitude.
To test projectile excitation, the use of compressed air was proposed. The compressed air guns/cannons on the market can only shoot very small projectiles, such as airsoft bullets, and they proved to be quite expensive. The compressed-air cannon, which was custom built (
Figure 4b,c) for this study with cheap materials, delivered a more powerful and consistent impulse than the hammer. The device propelled an 8 g steel ball at an approximate velocity of 50 km/h using compressed air at 8 bar. The impact produced a strong and well-defined excitation signal. Initially, the measurement trigger was provided by the laser Doppler vibrometer, but this proved to be sensitive to vibrations from nearby activity. The issue was resolved by enabling an external trigger to be synchronized with the cannon firing. This approach ensured that each excitation was highly repeatable and had sufficient energy to produce a clear vibrational response.
2.4. Acoustic Excitation
Acoustic excitation was explored as a fully non-contact alternative for inducing vibrations, which has already proven to be successful for [
9,
14]. In this configuration, a smaller and less powerful loudspeaker was used that emitted a sinusoidal sweep signal ranging from 3 kHz to 20 kHz, with an amplitude of 400 mV generated using an integrated function generator. This signal was then amplified to 20 V and transmitted to a loudspeaker positioned approximately 10 mm from the sample surface. The purpose of this method was to excite the natural modes of vibration in the concrete without any physical contact. The chosen frequency range was selected to encompass the expected resonance frequencies of the samples, allowing for subsequent frequency response analysis. It should be noted that the performance of the acoustic excitation approach may strongly depend on loudspeaker characteristics and sound-field focusing. The use of a more powerful or more directional acoustic source may improve excitation efficiency and should be investigated in future work. The experimental setup for acoustic excitation is shown in
Figure 5.
2.5. Vibration Measurement Device
Vibration measurements were performed using a PSV-400 Scanning Laser Doppler Vibrometer (Polytec, Waldbronn, Germany). The PSV-400 measures vibration velocity by detecting the Doppler frequency shift of reflected laser light, enabling non-contact vibration measurements without altering the dynamic behavior of the specimen through sensor mass loading. A scanning measurement approach was used, in which the laser beam was sequentially directed toward multiple predefined measurement locations on the specimen surface using galvanometer mirrors. For each sample, 81 measurement points were distributed uniformly on the measurement surface. This number of points was selected as a compromise between spatial resolution (1.67 cm between each point) and total acquisition time, while still allowing the dominant vibration patterns and local defect-induced dynamic variations to be captured.
The selected frequency range was chosen on the basis of preliminary experiments on the concrete specimens. Distinct resonance peaks were consistently observed within the 3–20 kHz range, while measurements below 3 kHz showed increased sensitivity to environmental disturbances, rigid-body motion, and low-frequency artifacts. Furthermore, the relatively small sample dimensions resulted in dominant resonance modes that occurred primarily in the kHz range rather than at lower frequencies typical for full-scale concrete structures. It is important to choose the right parameters. This was achieved with some preliminary tests on the samples and then comparing the results after changing the parameters. At the end, these parameters were established and can be found in
Table 2. Complex averaging was used to reduce the noise, but the amount of averages depended on the excitation method. For both the shakers, 15 averages were taken. For the hammer, 3 averages were taken and there was no averaging for the canon. This was due to the difficulty with repeatability for the canon.
Synchronization between excitation and acquisition was achieved using external triggering. Similar synchronization approaches have previously been applied in LDV-based measurements to improve the repeatability and temporal consistency of non-contact measurements [
28]. For the compressed-air cannon setup, the triggering was conducted on the laser Doppler vibrometer itself. The trigger level was set at 90% with a pretrigger of 3% to capture the full vibration response of the sample. The trigger level had to be very high to ensure that the device was not accidentally triggered.
Although LDV measurements provide high sensitivity and non-contact operation, several factors can still influence measurement quality and introduce noise into the Frequency Response Functions (FRFs). First, the excitation energy delivered by the different excitation methods was not uniformly distributed across the entire frequency range. In particular, the BRÜEL & KJÆR shaker produced relatively low excitation forces below approximately 6 kHz and above 15 kHz, resulting in lower response amplitudes and increased sensitivity to noise in these regions. Second, the concrete surface properties and optical scattering behavior may have introduced speckle-related noise effects, which are known limitations of LDV measurements on optically rough surfaces [
20]. Finally, the relatively small specimen dimensions and local boundary effects may also have contributed to closely spaced resonance peaks and increased modal complexity in certain frequency bands.
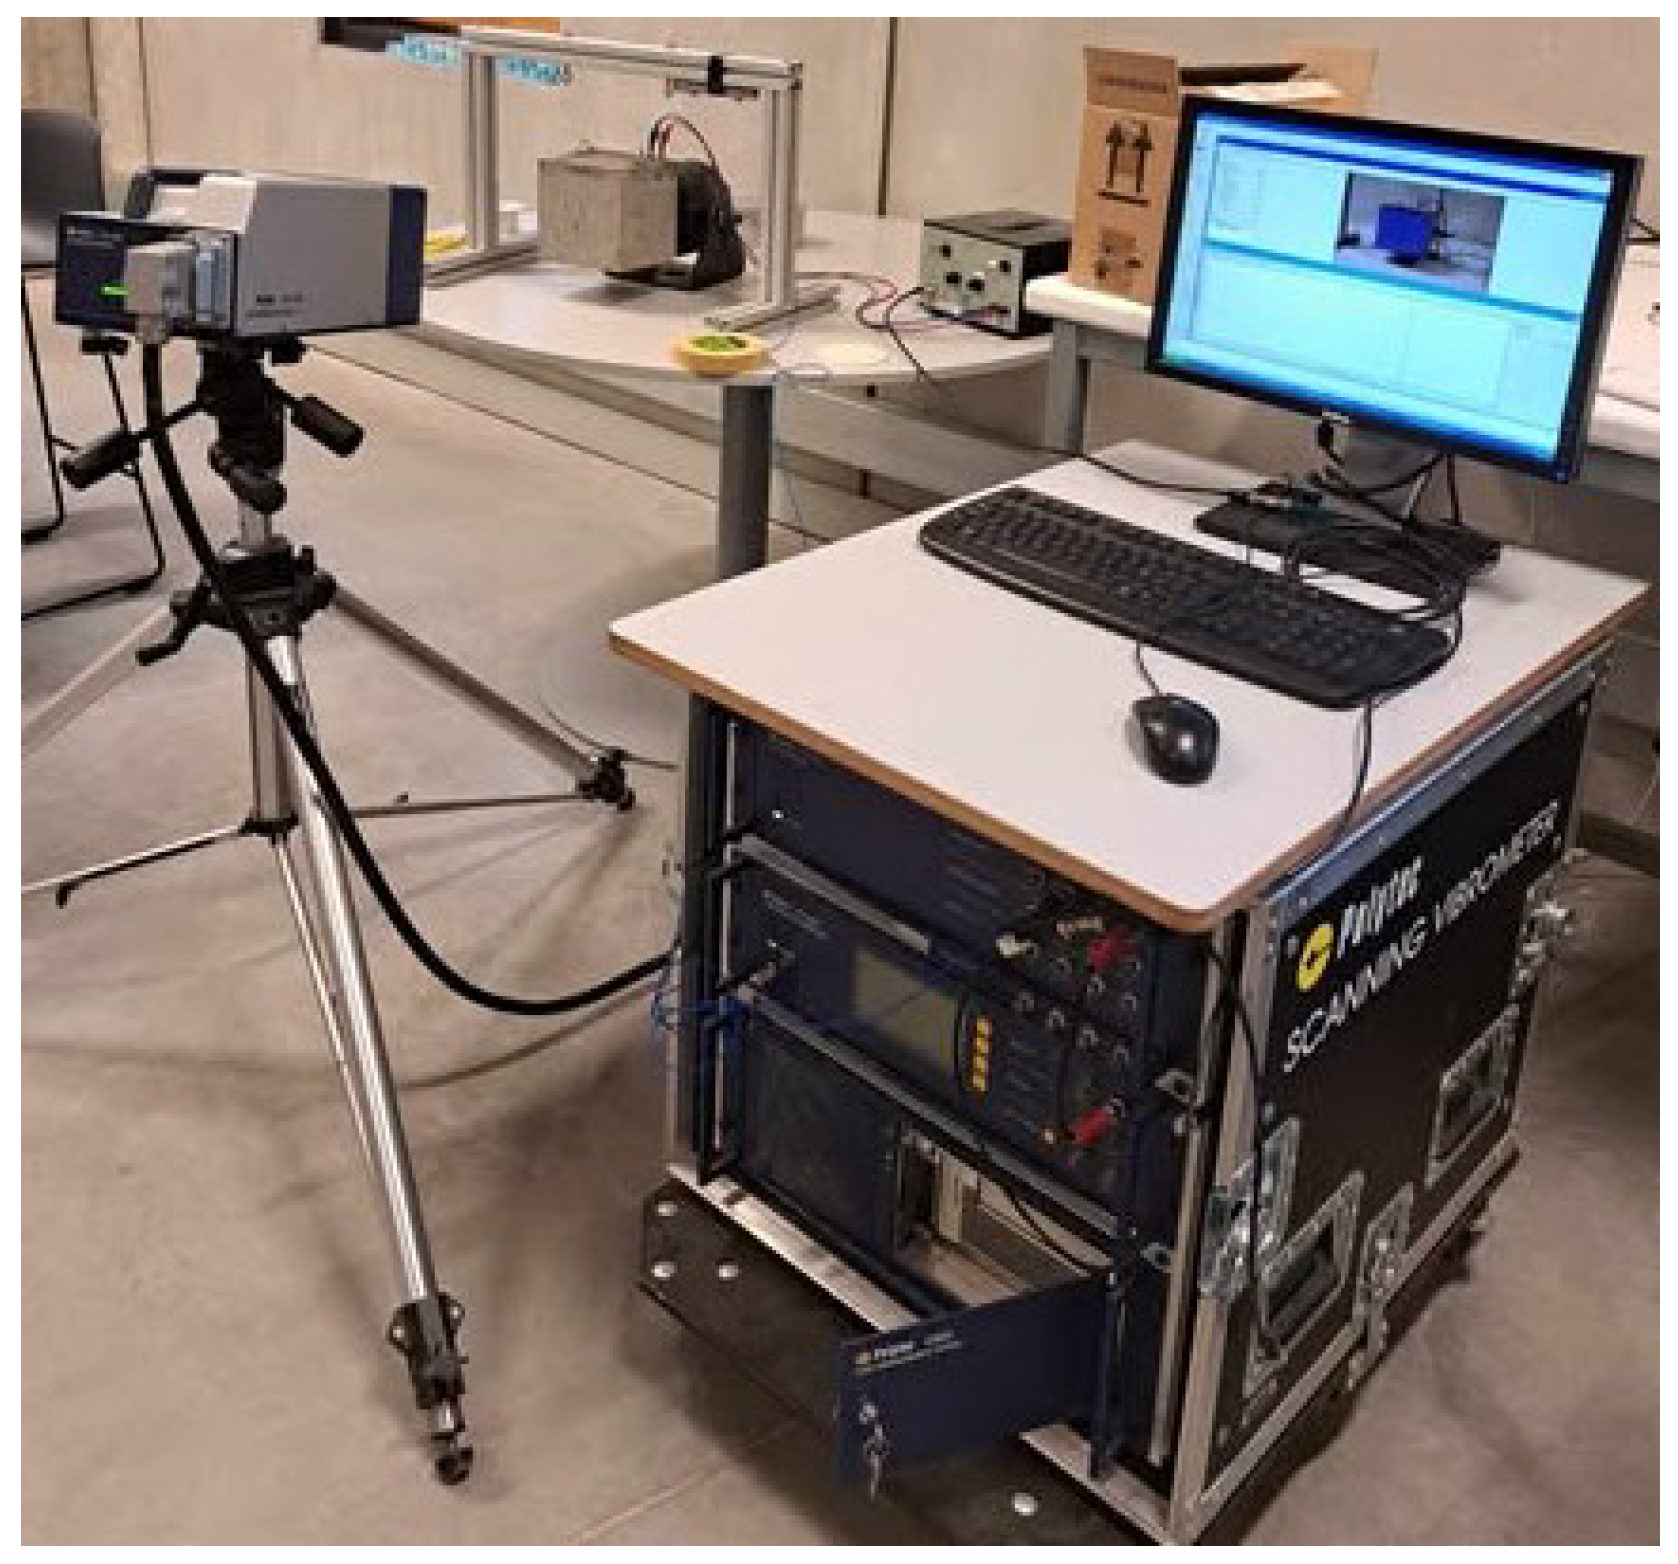
Figure 6 shows the setup of the PSV-400 with the BRÜEL & KJÆR Vibration Exciter in the background.
3. Results
3.1. Shaker
3.1.1. BRÜEL & KJÆR Vibration Exciter
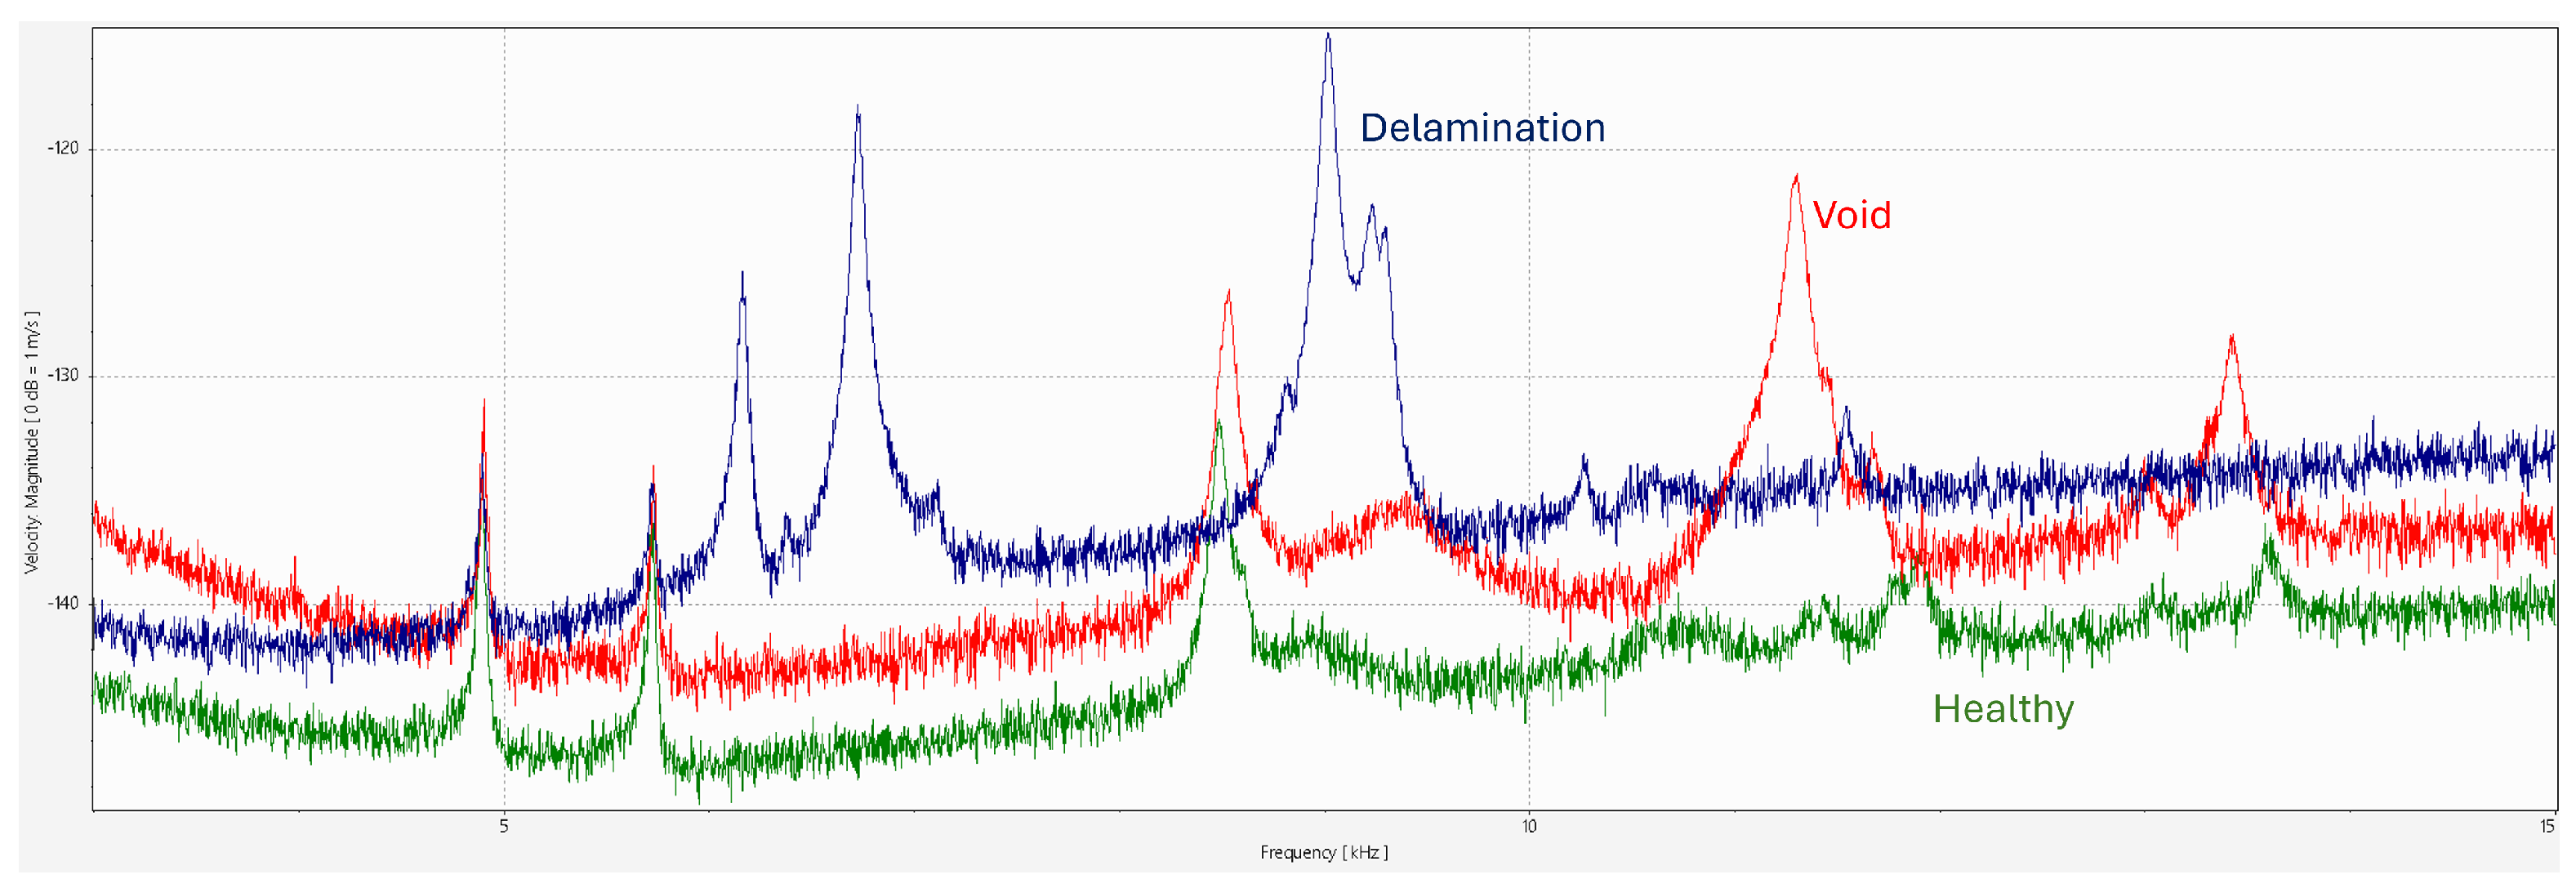
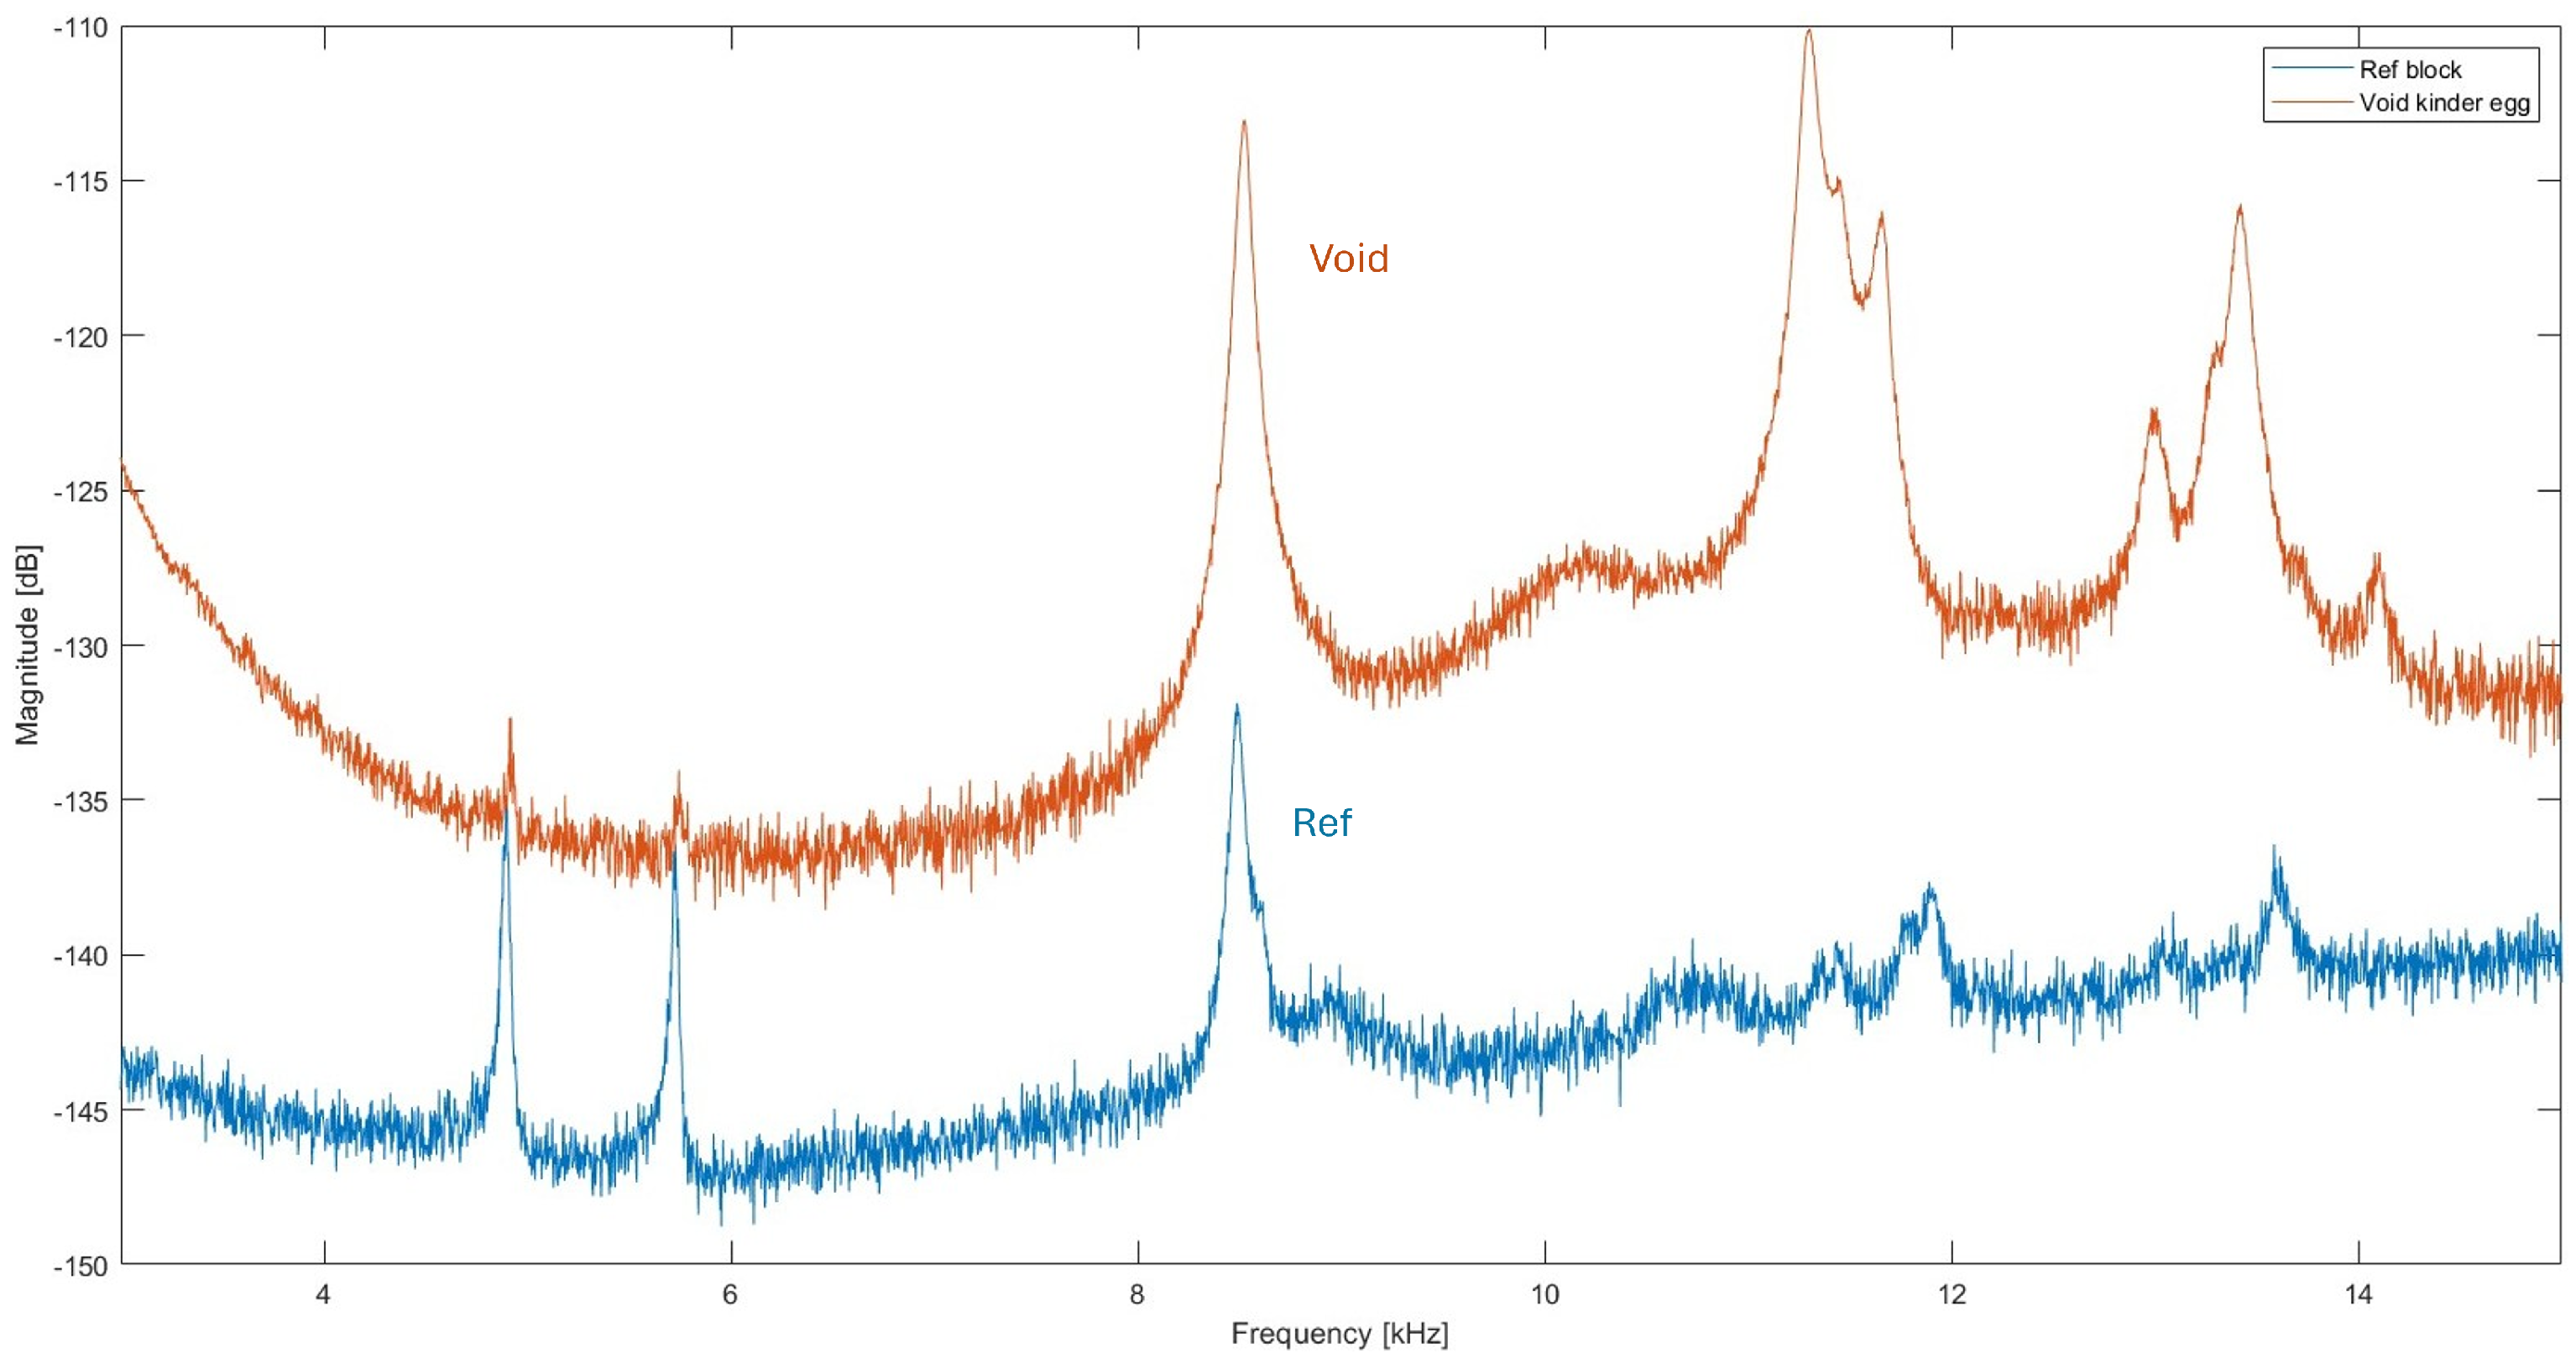
The BRÜEL & KJÆR Vibration Exciter was used to establish a baseline against which to compare the different excitation methods. Initial measurements were performed on the healthy, delamination, and void samples to assess whether the different conditions can be distinguished in the frequency domain. As shown in
Figure 7, the responses differ primarily through changes in the resonance peak frequencies.
Figure 7 compares the measured frequency responses for the three specimen conditions (healthy, void, and delamination), where each condition exhibits a strong set of dominant peak frequencies across the measured band. The delamination and void cases show additional and/or shifted peaks relative to the healthy specimen, indicating a change in dynamic signature associated with the type of defect. Because the measured velocity level can be influenced by excitation and coupling conditions (e.g., shaker input, stinger dynamics, and contact/interface effects), the interpretation focuses primarily on peak frequencies and their relative prominence under identical test settings rather than on absolute amplitude values. Therefore, these peak-frequency patterns are used as the main comparative features in the subsequent analysis.
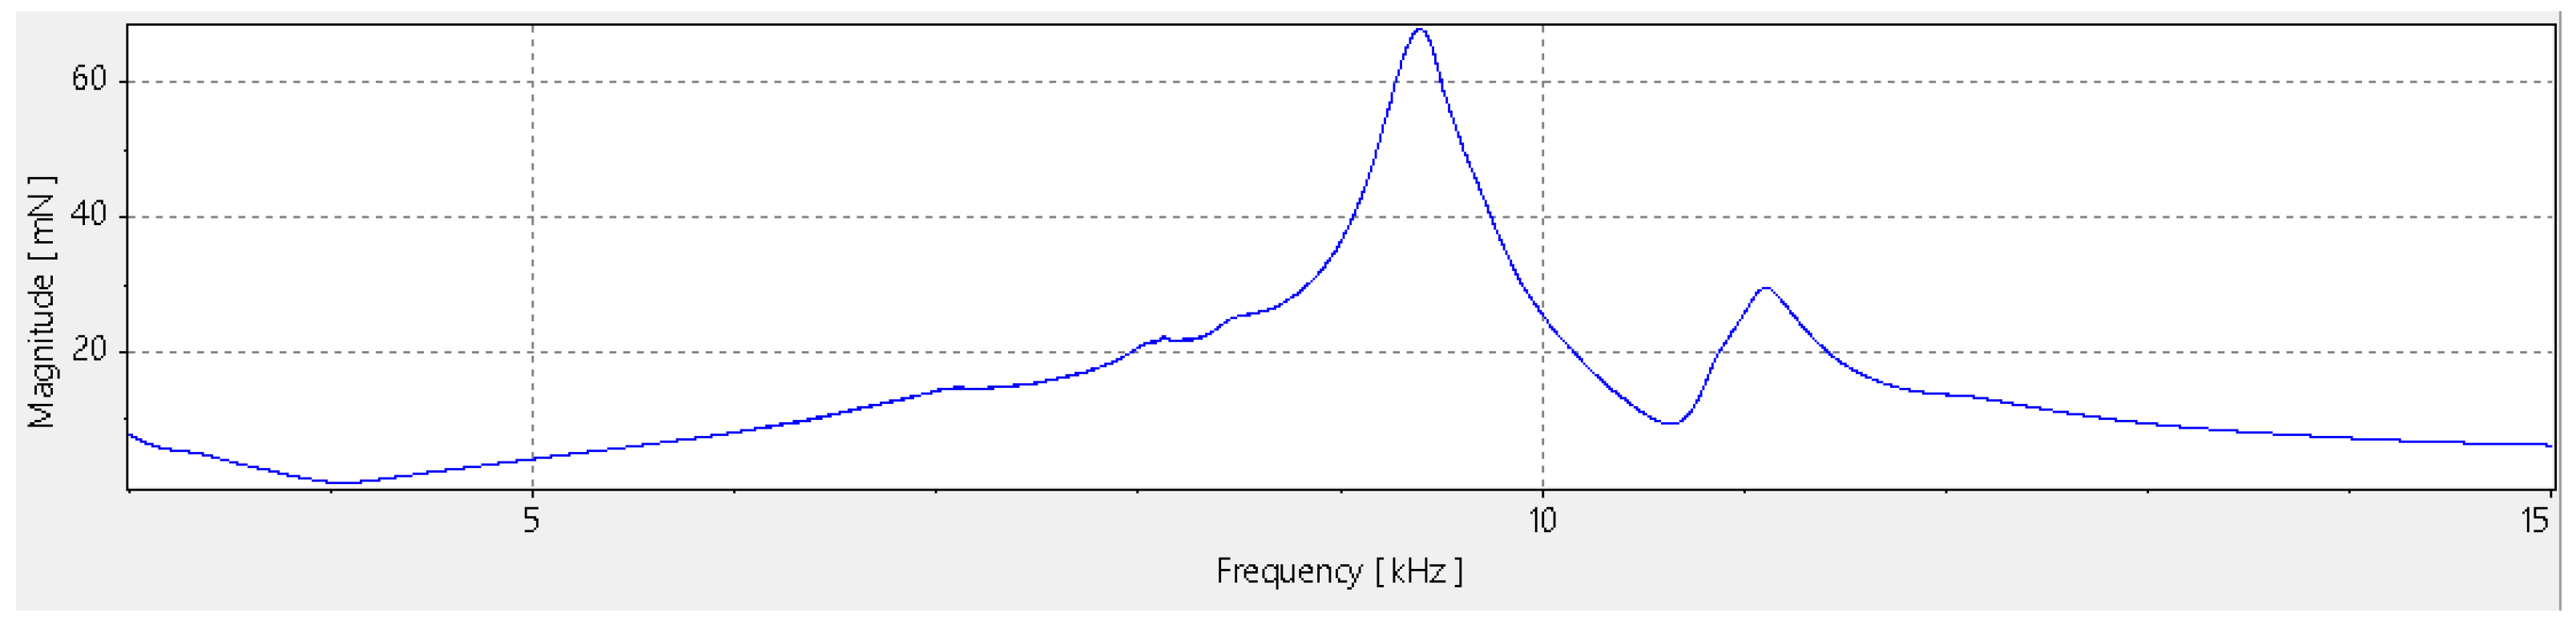
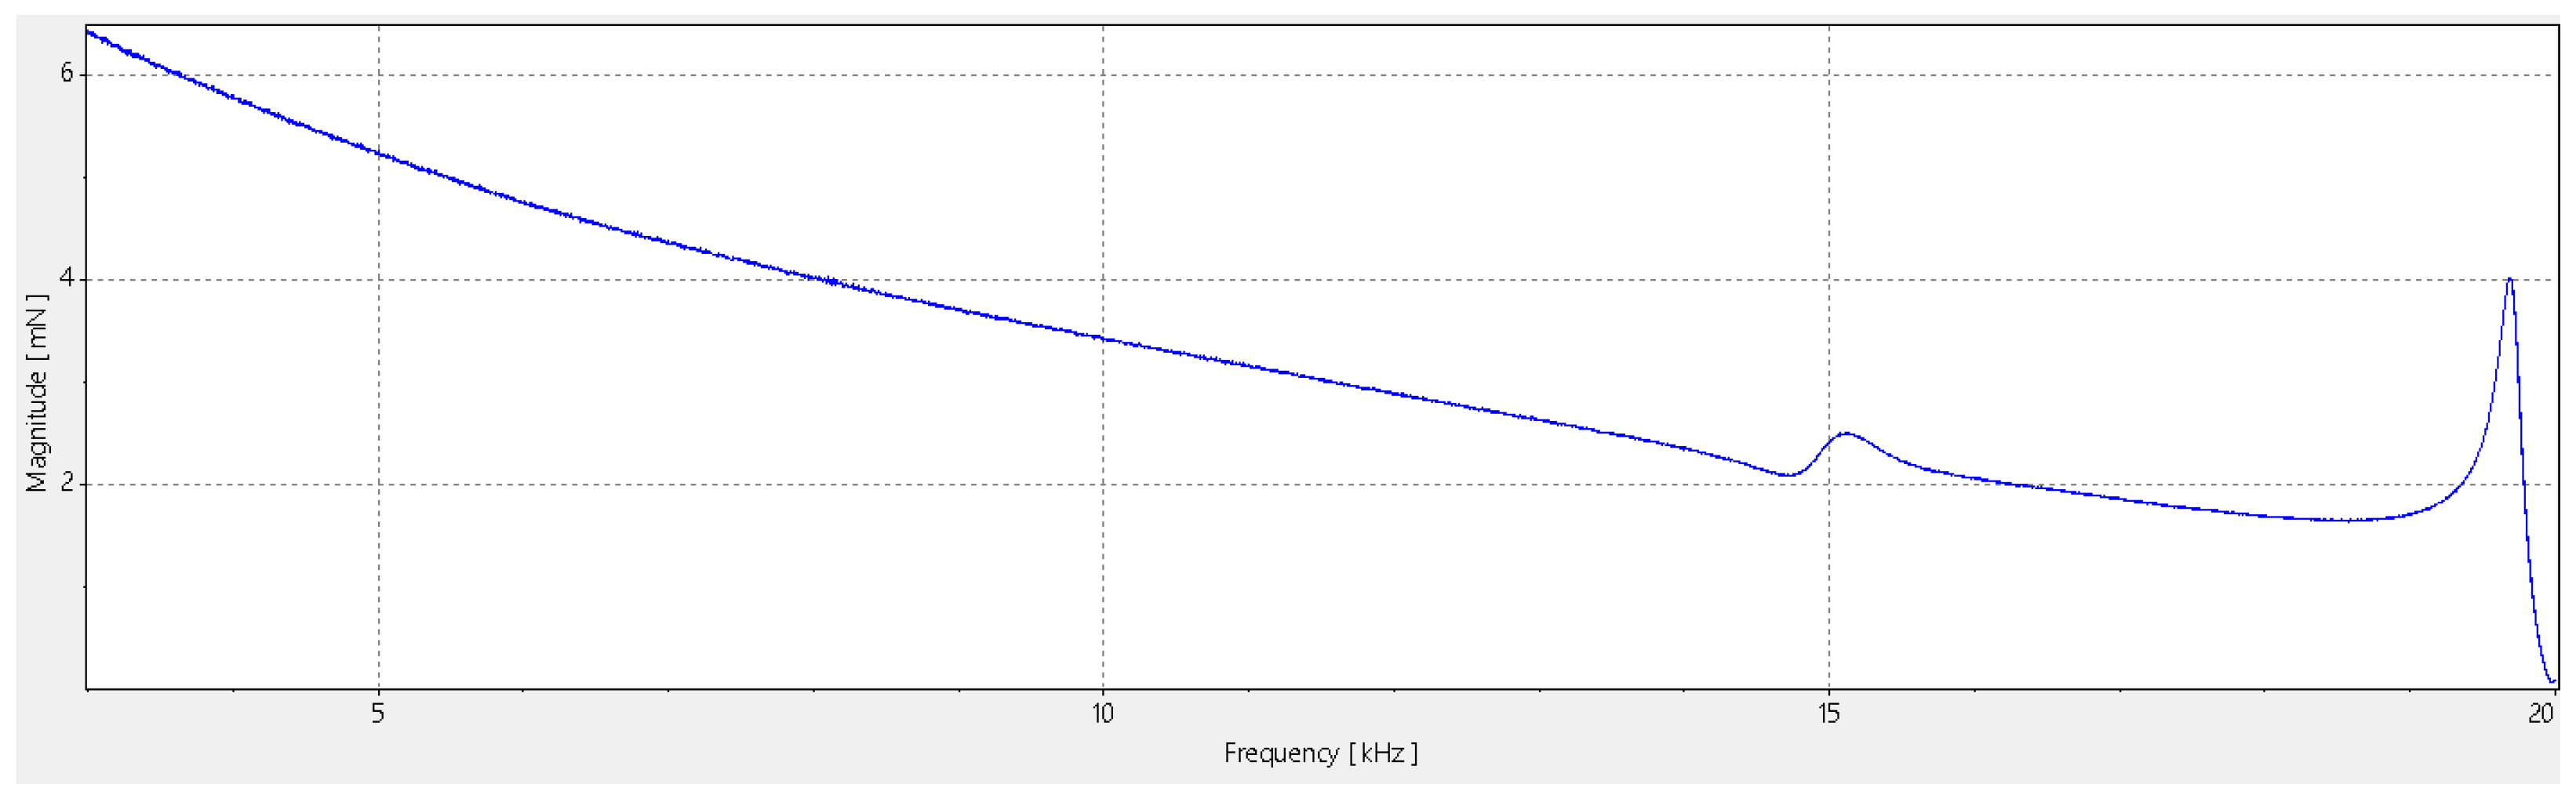
Analysis of the force sensor data at the tip of the stinger showed that the input energy was not evenly distributed throughout the frequency range (
Figure 8). In this setup, a stinger is a rod that mechanically connects the shaker to the specimen. Distinct peaks appeared at the eigenfrequencies of the stinger itself, causing motion in the block not related to its own natural frequencies. This effect highlights the necessity of using the Frequency Response Function (FRF) when applying shaker excitation. By relating the measured response to the input force, FRF analysis suppresses spurious peaks in the frequency domain that occur in ranges with minimal input force, allowing for a more accurate representation of the dynamic behavior of the sample.
One notable limitation of this shaker is its low excitation force in the lower frequency range (
Figure 9). For frequencies below approximately 6 kHz, the input force was minimal, making this method unsuitable for larger structures, which tend to resonate at lower frequencies. Similarly, excitation above 15 kHz was less effective, as evidenced by increased noise levels in the measurements. Consequently, the optimal working range of the BRÜEL & KJÆR Vibration Exciter in this setup is limited to approximately 6–15 kHz.
3.1.2. Comparative Analysis of Specimen Types
Figure 7 compares the frequency-domain responses of the representative specimen types: a healthy reference specimen, a void-type specimen, and a delamination-type specimen. The comparison focuses on the location and relative visibility of resonance peaks rather than on absolute amplitude values, since the measured velocity amplitude can be influenced by excitation and coupling conditions.
The healthy specimen provides the baseline resonance pattern of an undamaged concrete block. The void-type specimen shows additional and shifted resonance peaks compared with the healthy specimen, especially at higher frequencies. This indicates that the localized internal void changes the local stiffness and mass distribution of the block. The delamination-type specimen shows the strongest deviation from the healthy response, with several additional peaks and a broader modification of the frequency-response pattern. This behavior is consistent with the presence of a planar internal discontinuity, which affects the effective stiffness over a larger region of the specimen.
This comparison shows that the LDV-based frequency response is sensitive not only to the presence of damage, but also to the type of internal defect. Localized voids and planar delaminations both alter the dynamic response relative to the healthy specimen, but they do so in different ways. Therefore, the resonance peak patterns can be used as comparative signal features for distinguishing between healthy and defective concrete specimens.
3.1.3. Qsources Qlws Shaker
The Qsources Qlws shaker yielded considerably better results compared to the larger BRÜEL & KJÆR system. Its compact size and low mass allowed it to be mounted directly on the surface of the concrete block with minimal influence on the overall mass and stiffness of the structure. This direct coupling resulted in efficient force transmission, with sufficient input force as seen in
Figure 10, and clean frequency response function measurements.
The frequency response functions recorded with the Qsources shaker exhibited well-defined eigenfrequencies and low background noise. Unlike the larger shaker, which introduced artifact peaks, the Qsources data was free from such interference. The ease of repositioning this small shaker makes it possible to target specific locations on the specimen for rapid testing. The low noise floor and high peak resolution observed confirm its suitability for small-scale structures and applications where quick and repeatable measurements are required.
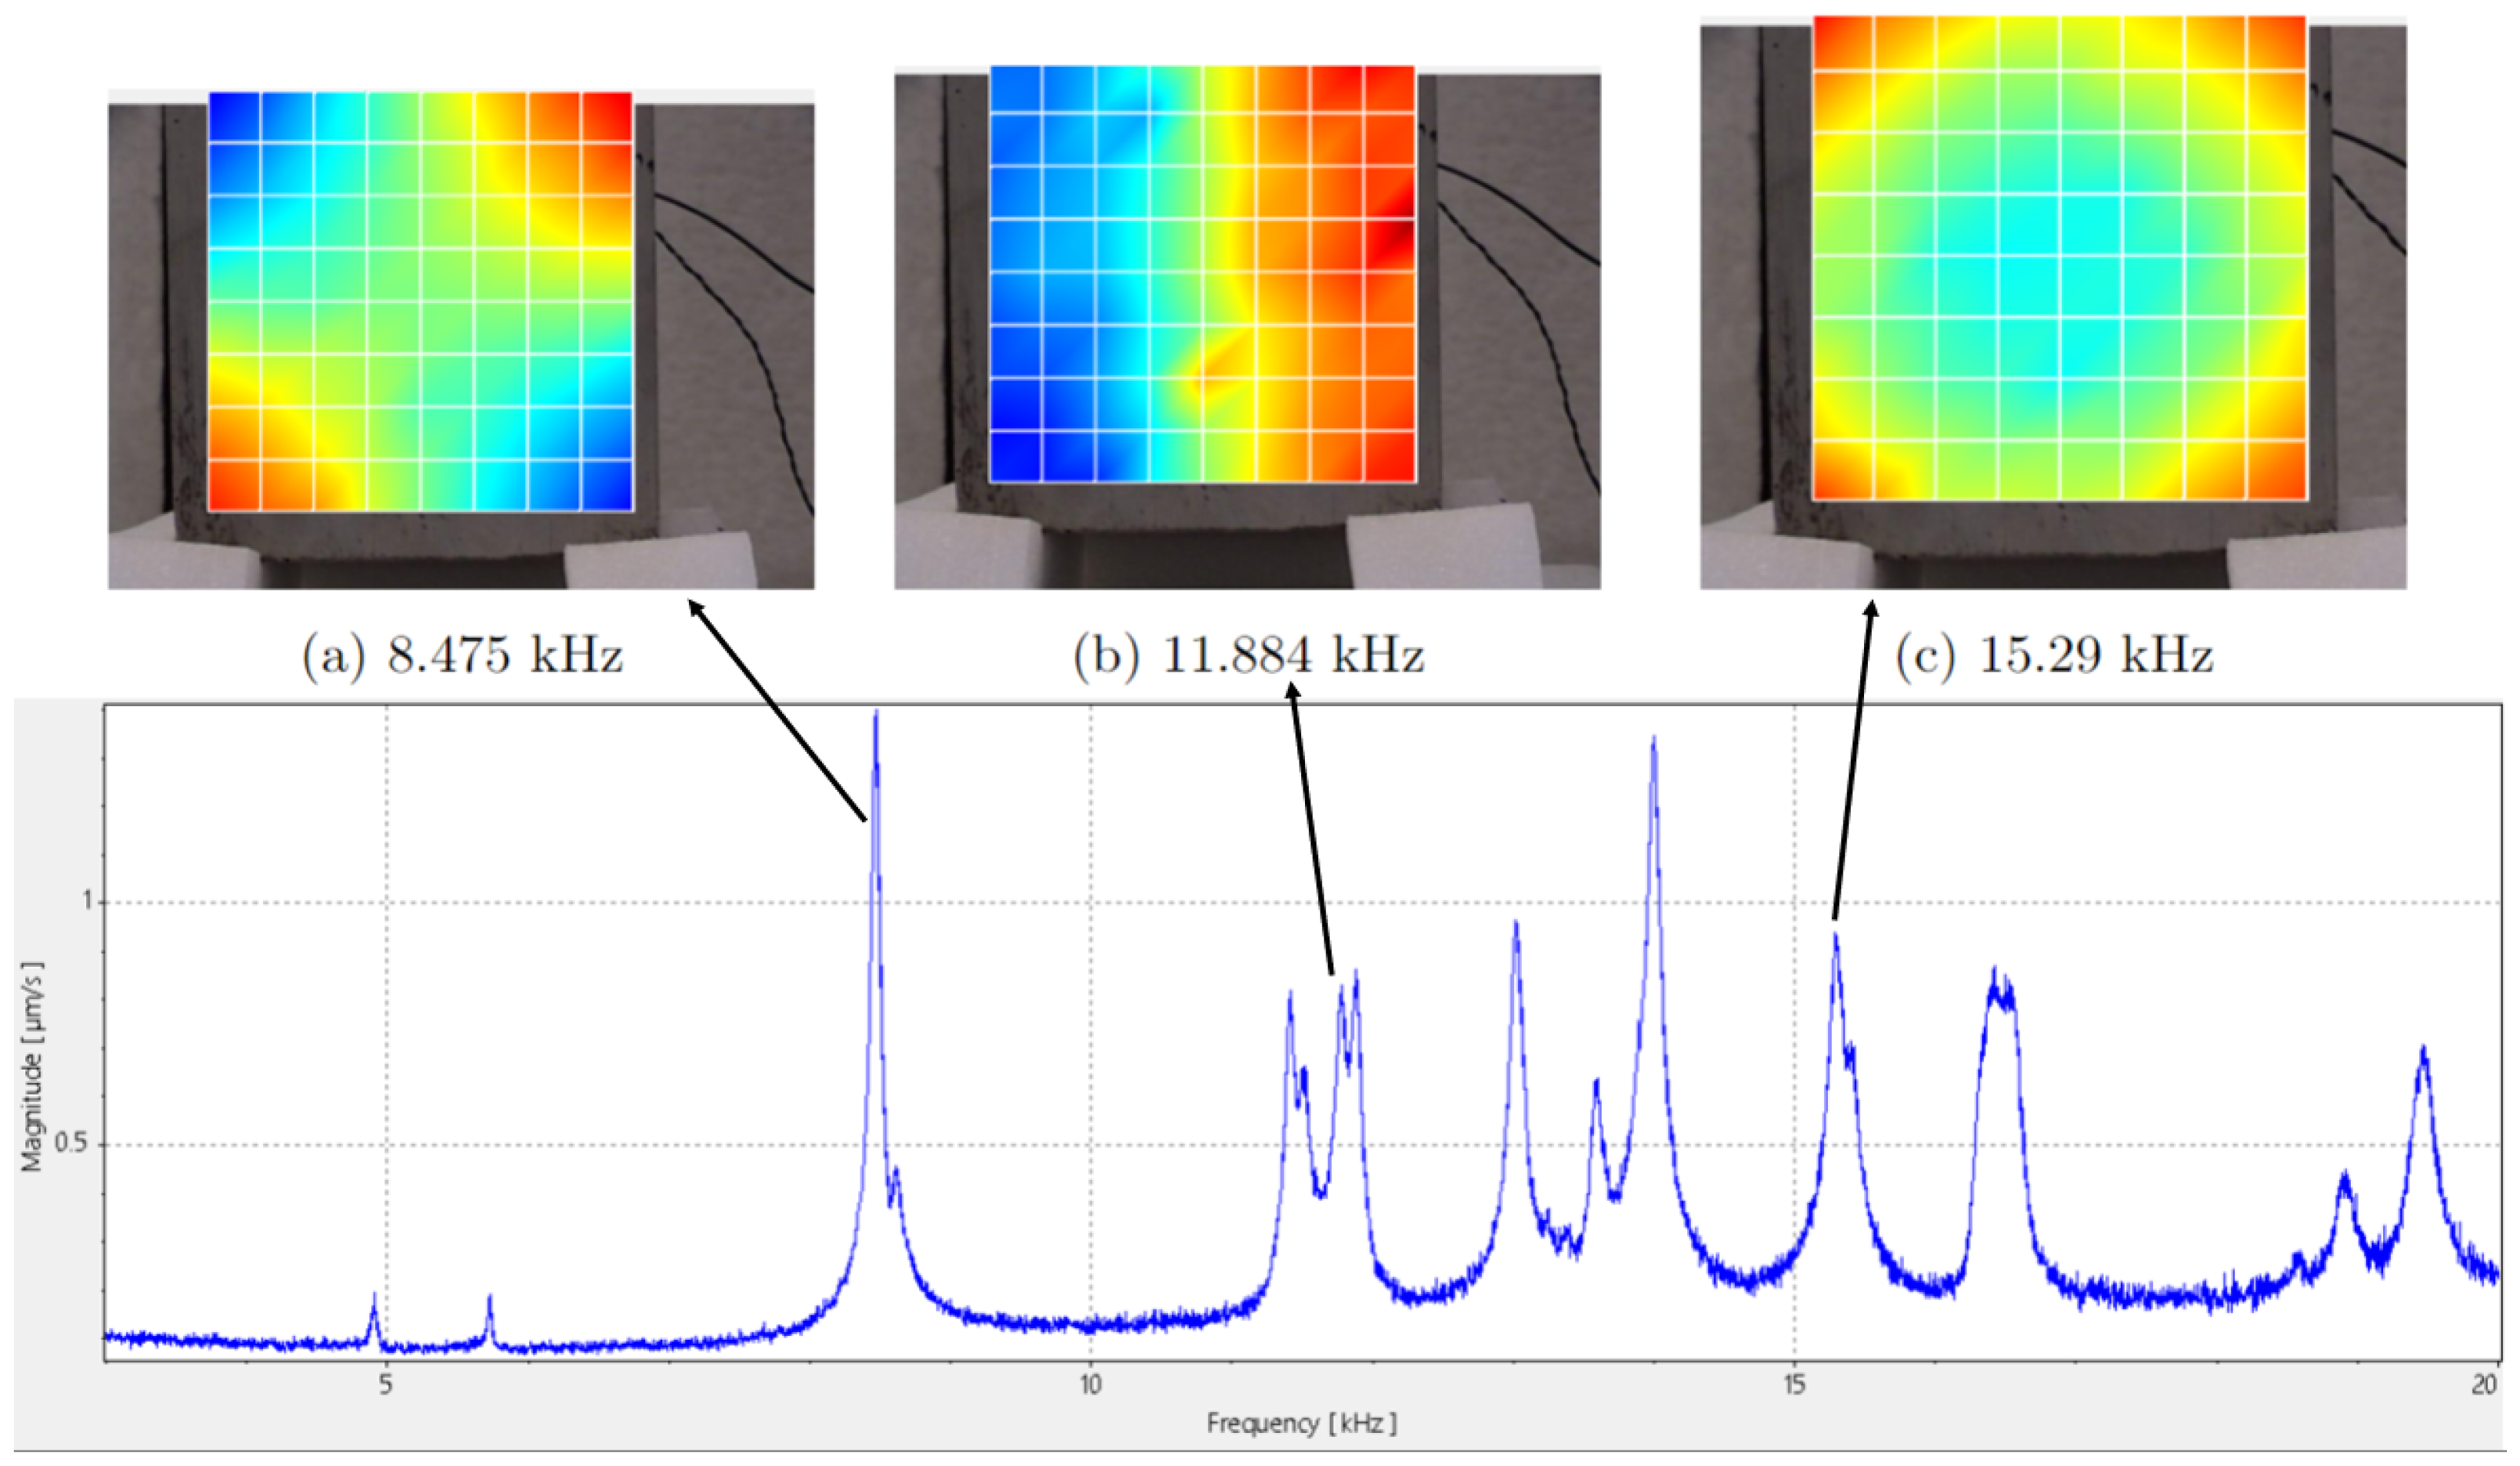
Before discussing the response of the defective specimens, it is useful to first identify the main resonance peaks and the corresponding mode shapes of the reference block. These reference modes provide a basis for interpreting the frequency-response changes observed in damaged samples. The dominant peaks at 8.475, 11.884, and 15.29 kHz correspond to the mode shapes shown in
Figure 11.
Figure 12 shows the measured frequency response in the upper left corner of the ‘Kinder egg void’ specimen under Qsources shaker excitation. The response is dominated by a sharp resonance at 8.8 kHz, which is identified as the first natural frequency of this measurement point. Several additional peaks are observed between approximately 11 and 20 kHz, indicating higher-order modes and/or resonances of the coupled measurement chain.
3.2. Mechanical
3.2.1. Hammer
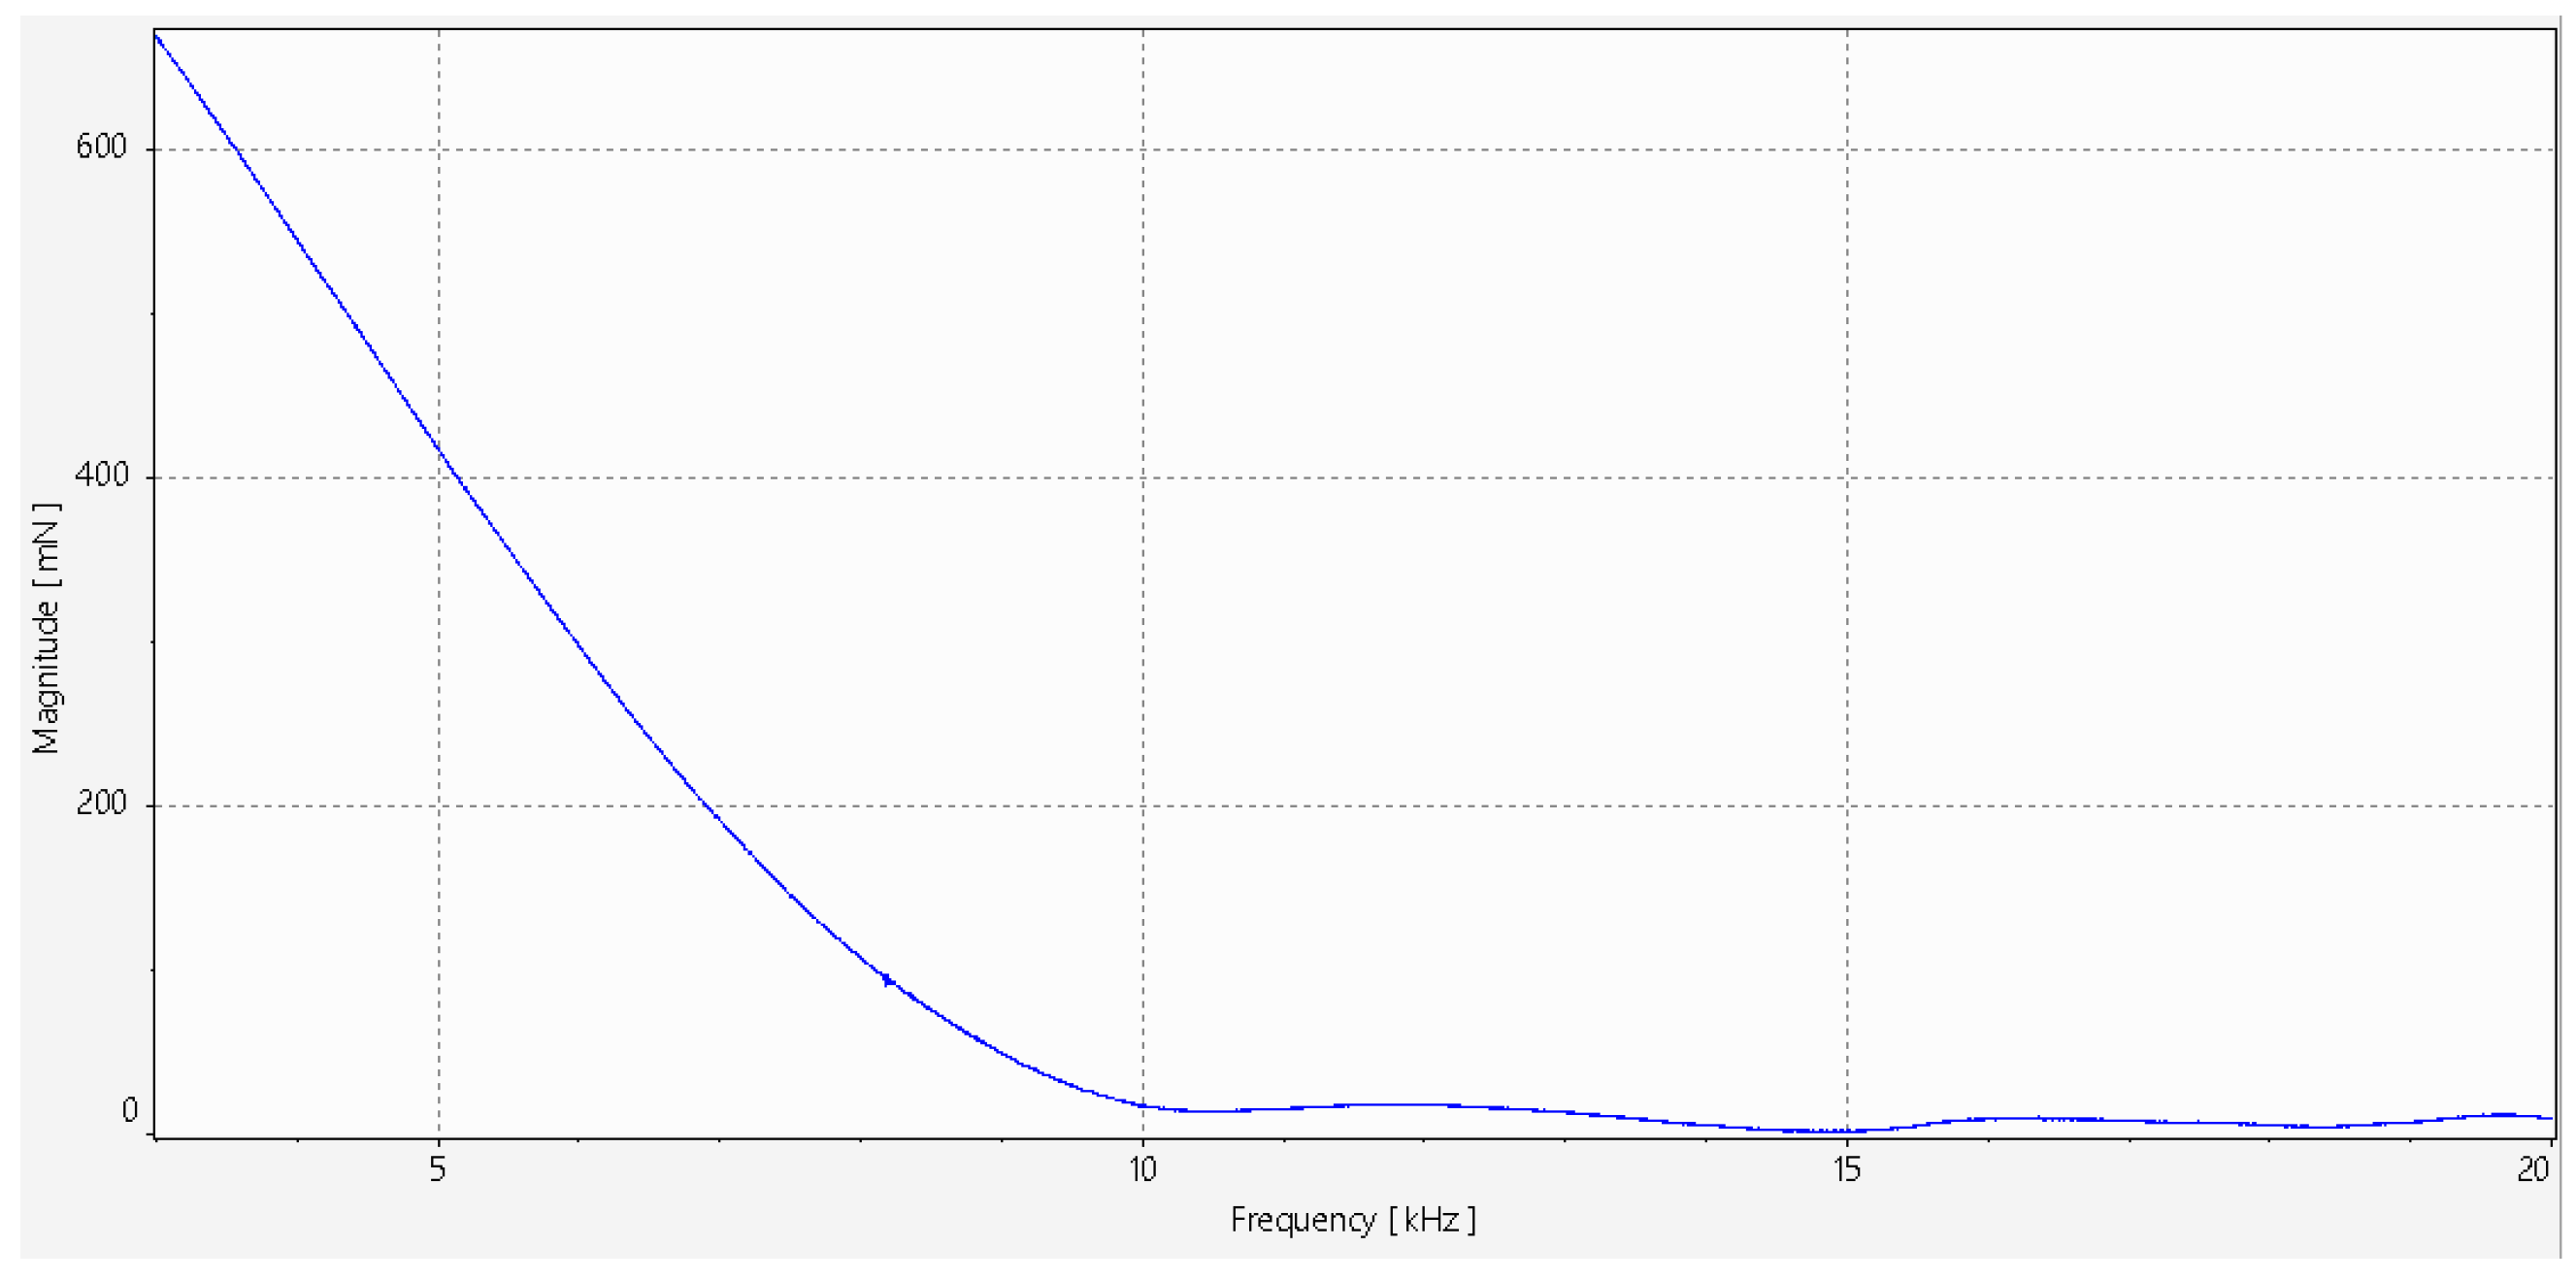
The setup of the shakers takes some time and requires glue to attach the stinger to the samples. Therefore, the instrumented hammer was tested to determine whether mechanical impact excitation could produce usable data on the concrete samples. The main limitation of this method was the relatively long impact duration, which restricted the excitation of higher frequencies. As shown in
Figure 13, the energy content at frequencies above 10 kHz was insufficient to excite the corresponding resonant modes.
Although the frequency response function can improve the signal-to-noise ratio and partially address variability in the impact force, the lack of repeatability remains problematic, especially when the hammer is operated manually. This limitation also prevents the use of the hammer for surface scanning, as it is nearly impossible to deliver identical impulses across multiple points while maintaining a short contact duration. Consequently, the hammer is recommended only for situations in which low-frequency responses at a single location are of interest, and it is not suitable for the objectives of the present study (
Figure 14).
3.2.2. Compressed-Air Cannon
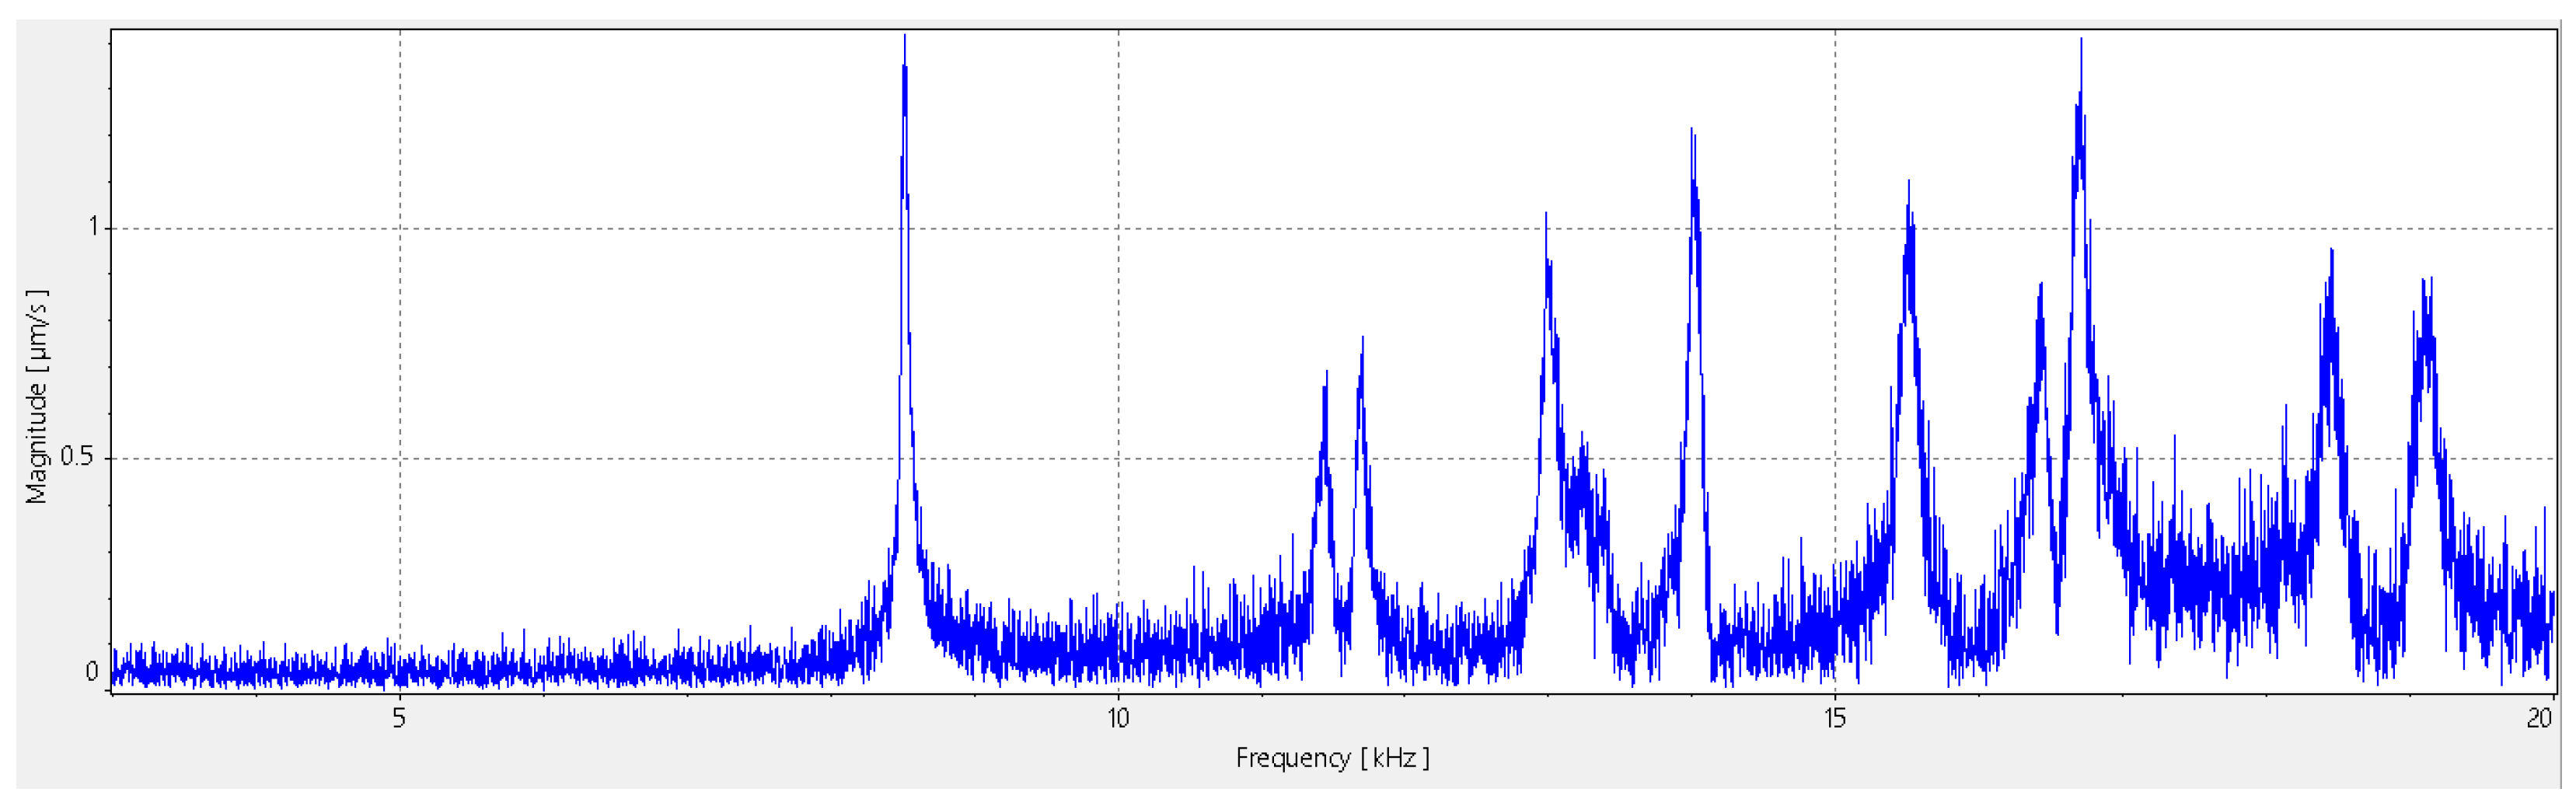
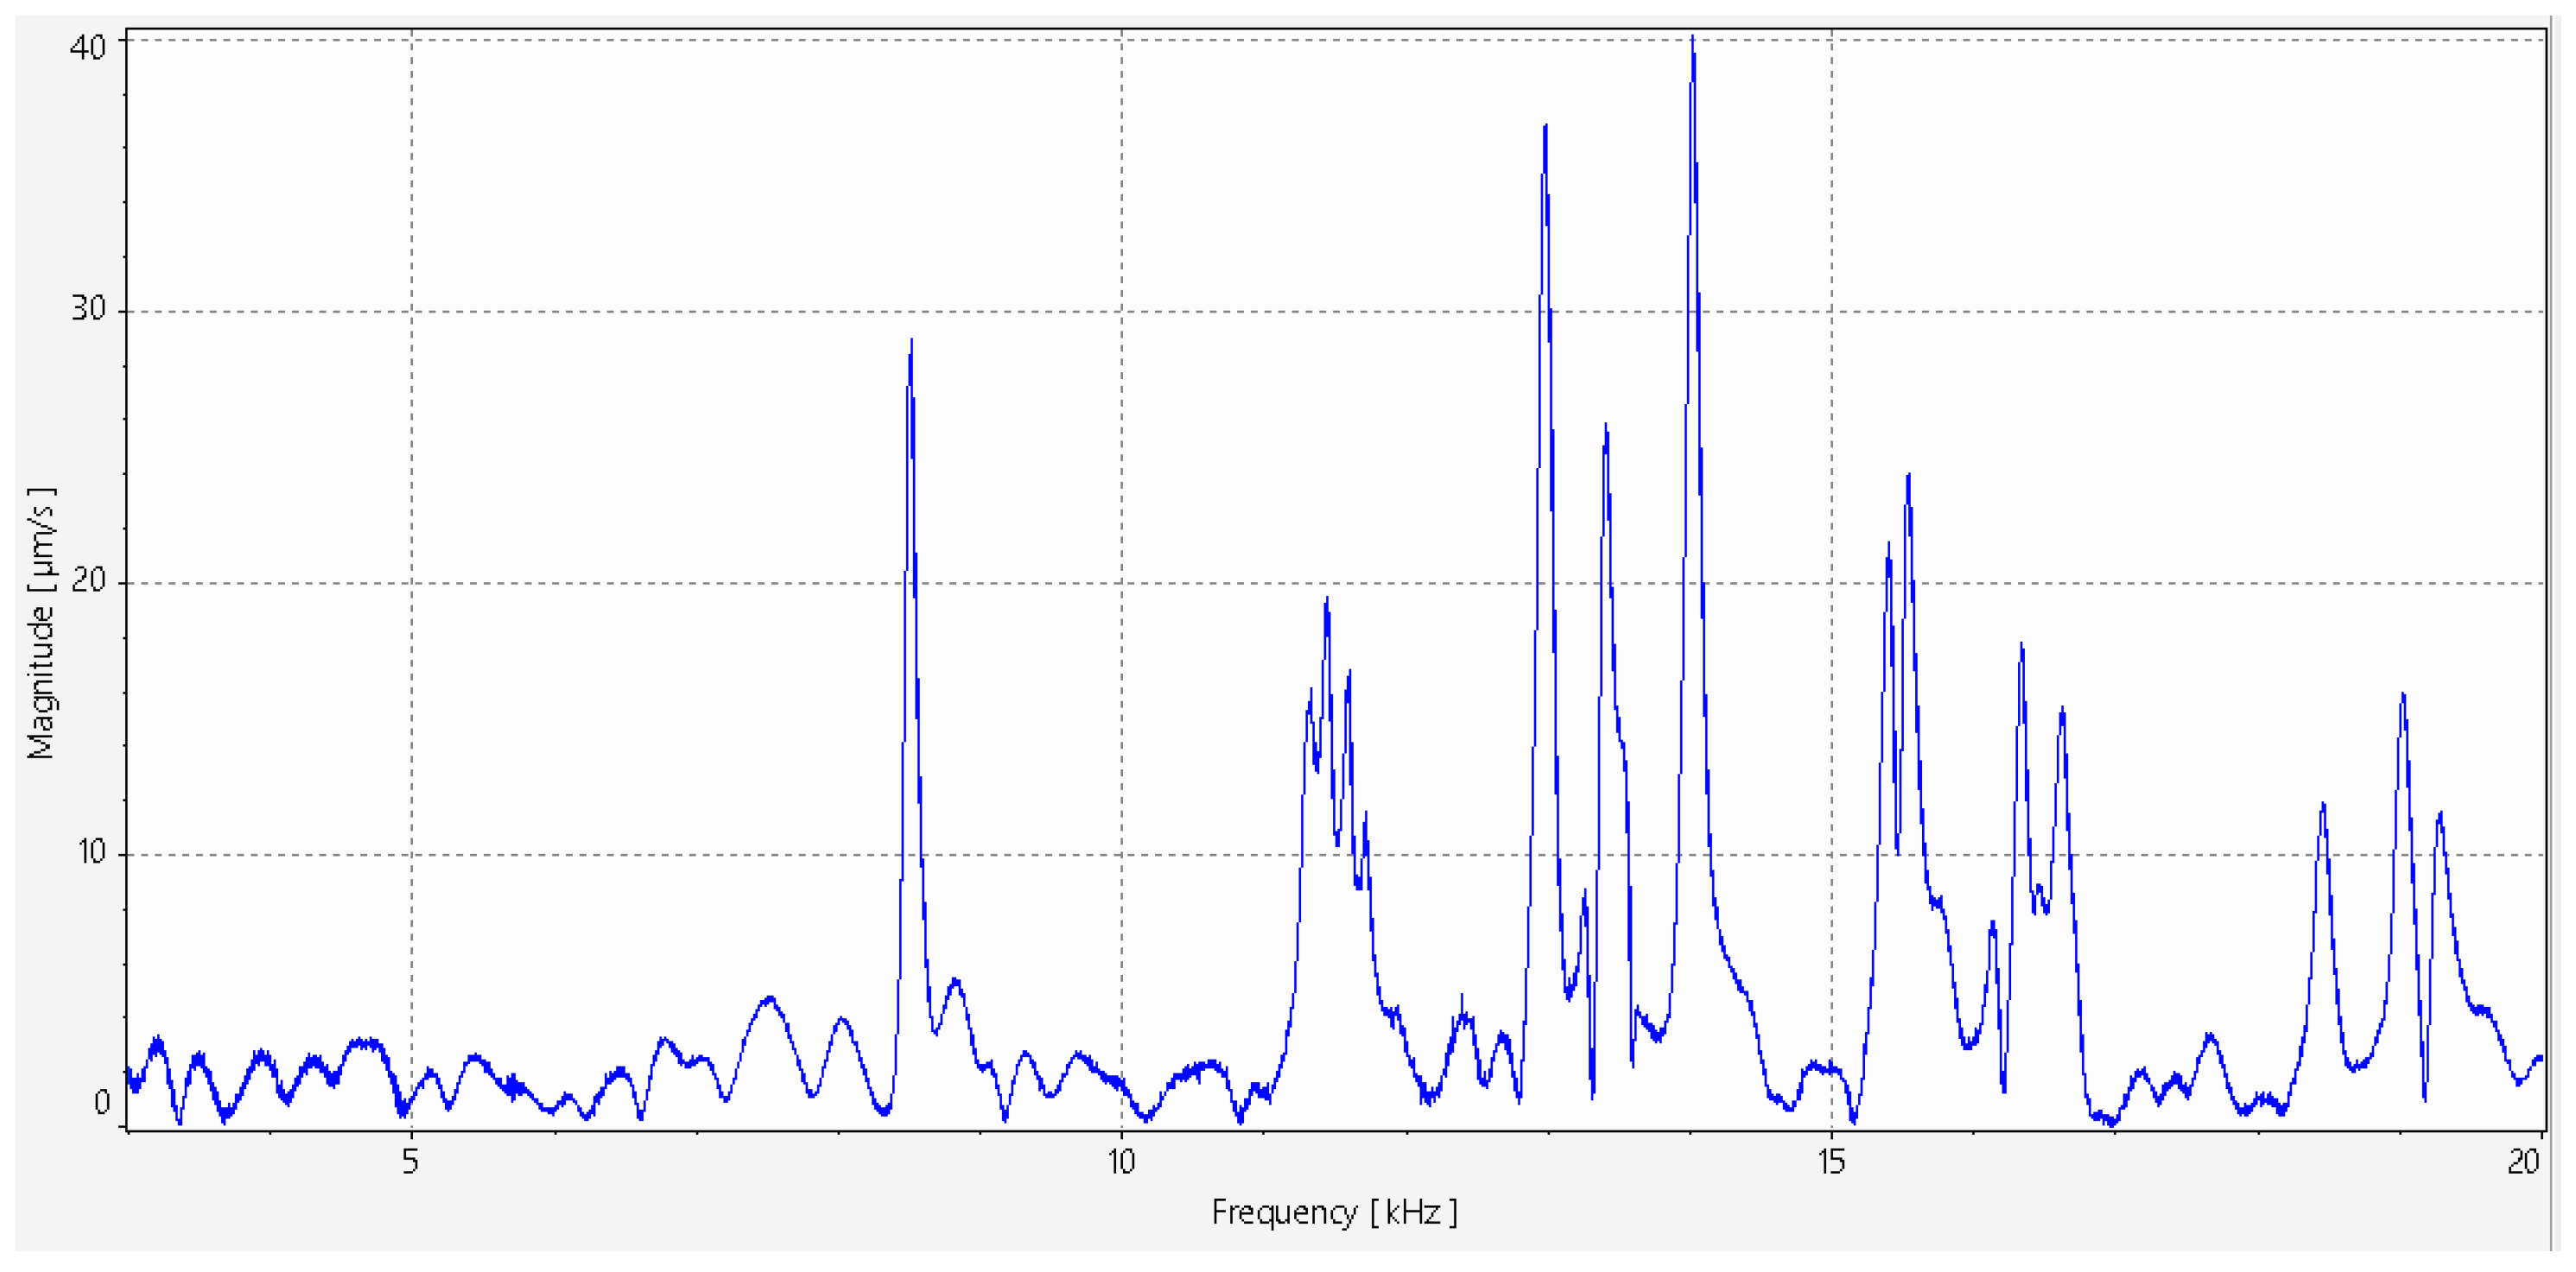
Unfortunately, shakers take a long time to set up and the hammer does not excite high enough frequencies; that is why the small compressed air cannon proved to be a highly effective method to mechanically excite the concrete samples. Operating at a pressure of 8 bar, the device propelled an 8 g steel ball at a velocity of approximately 50 km/h, delivering a strong, short-duration impulse to the sample surface. The resulting vibration responses, such as that shown in
Figure 15, exhibited high signal-to-noise ratios and clear resonance peaks.
One of the key advantages of the cannon was that even a single impact provided reliable data without the need for averaging multiple measurements. The high energy of the impulse is likely to be responsible for exciting a wide range of structural modes, making the method particularly effective for detecting subtle changes in the dynamic response. Compared to the hammer, the cannon offered greater repeatability, higher frequency content, and a much clearer signal, although its repeatability still does not match that of controlled shaker excitation.
3.2.3. Quantitative Comparison Between Hammer and Compressed-Air Cannon Excitation
To directly compare the two mechanical excitation methods shown in
Figure 4, measurements obtained with the modal hammer and the compressed-air cannon were compared on the same specimen and at the same measurement location. The comparison was performed using the measured LDV velocity spectra, since the compressed-air cannon was not equipped with a force sensor and therefore did not allow a force-normalized FRF to be calculated. Consequently, the comparison focuses on practical inspection performance, namely the identifiable frequency range, the visibility of resonance peaks, and the interpretation of the measured output spectra.
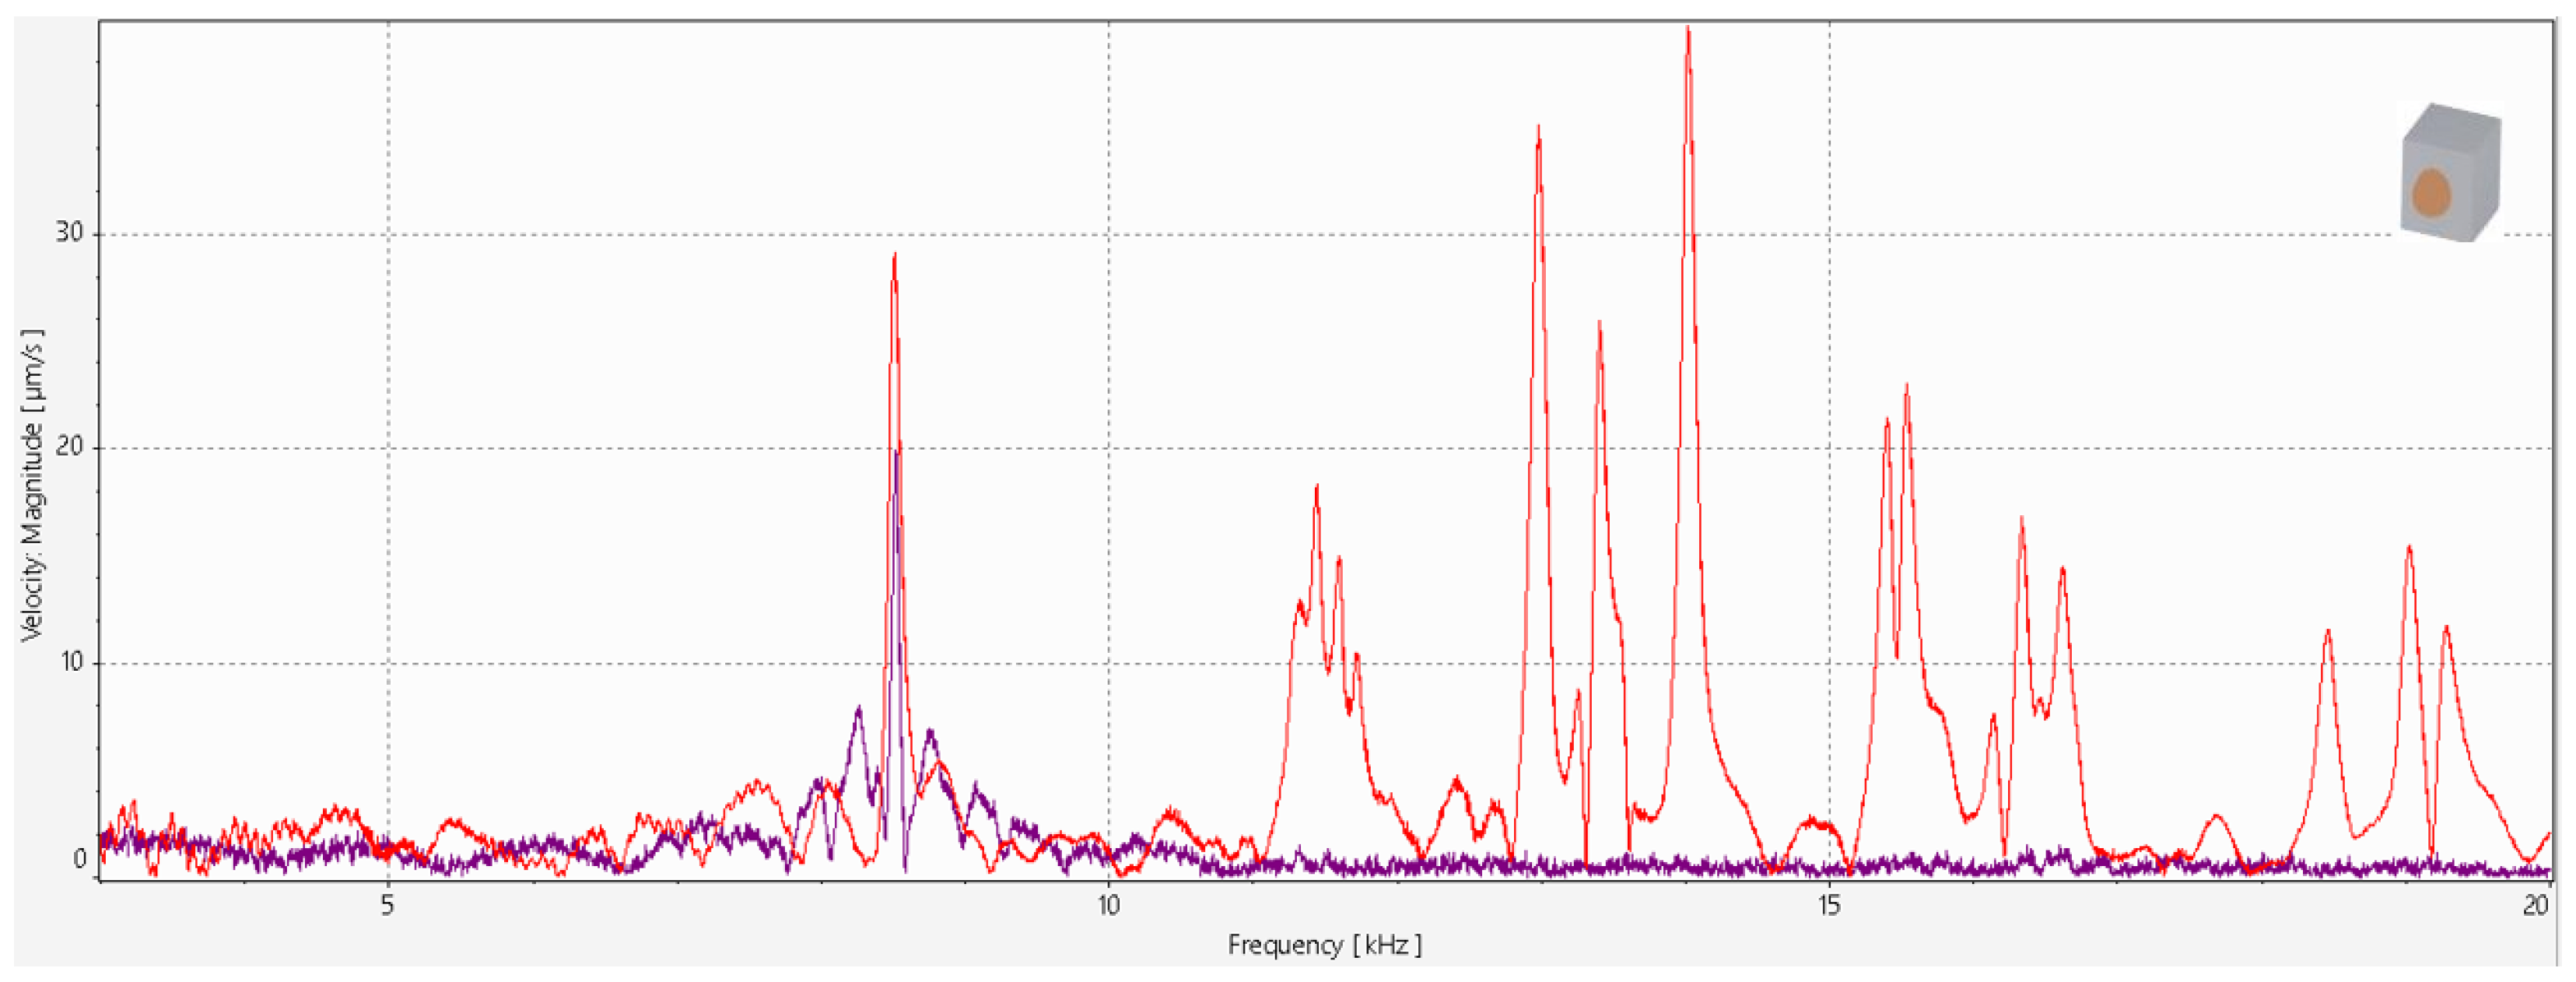
As shown in
Figure 16, both excitation methods were able to identify the first dominant resonance of the specimen, located at approximately 8.8 kHz. However, the useful frequency content differed substantially. The hammer response was mainly concentrated around the first resonance and did not produce clearly distinguishable higher-frequency peaks above approximately 10 kHz. In contrast, the compressed-air cannon generated several clearly visible resonance peaks over a broader frequency range, approximately from 3 to 20 kHz. Because the compressed-air cannon was not equipped with a force sensor, this comparison should not be interpreted as a force-normalized amplitude comparison, but rather as a practical comparison of the visibility of resonance features in the measured output spectra.
The comparison in
Table 3 shows that the compressed-air cannon is more suitable for broadband excitation of the small concrete specimens used in this study. Its short-duration impact excites higher-frequency resonance features more clearly than the modal hammer, which is beneficial for detecting local changes in the dynamic response. The modal hammer remains useful when a force-normalized FRF is required, but its limited high-frequency content makes it less suitable for the broadband defect-sensitive measurements targeted in this work.
3.3. Acoustic
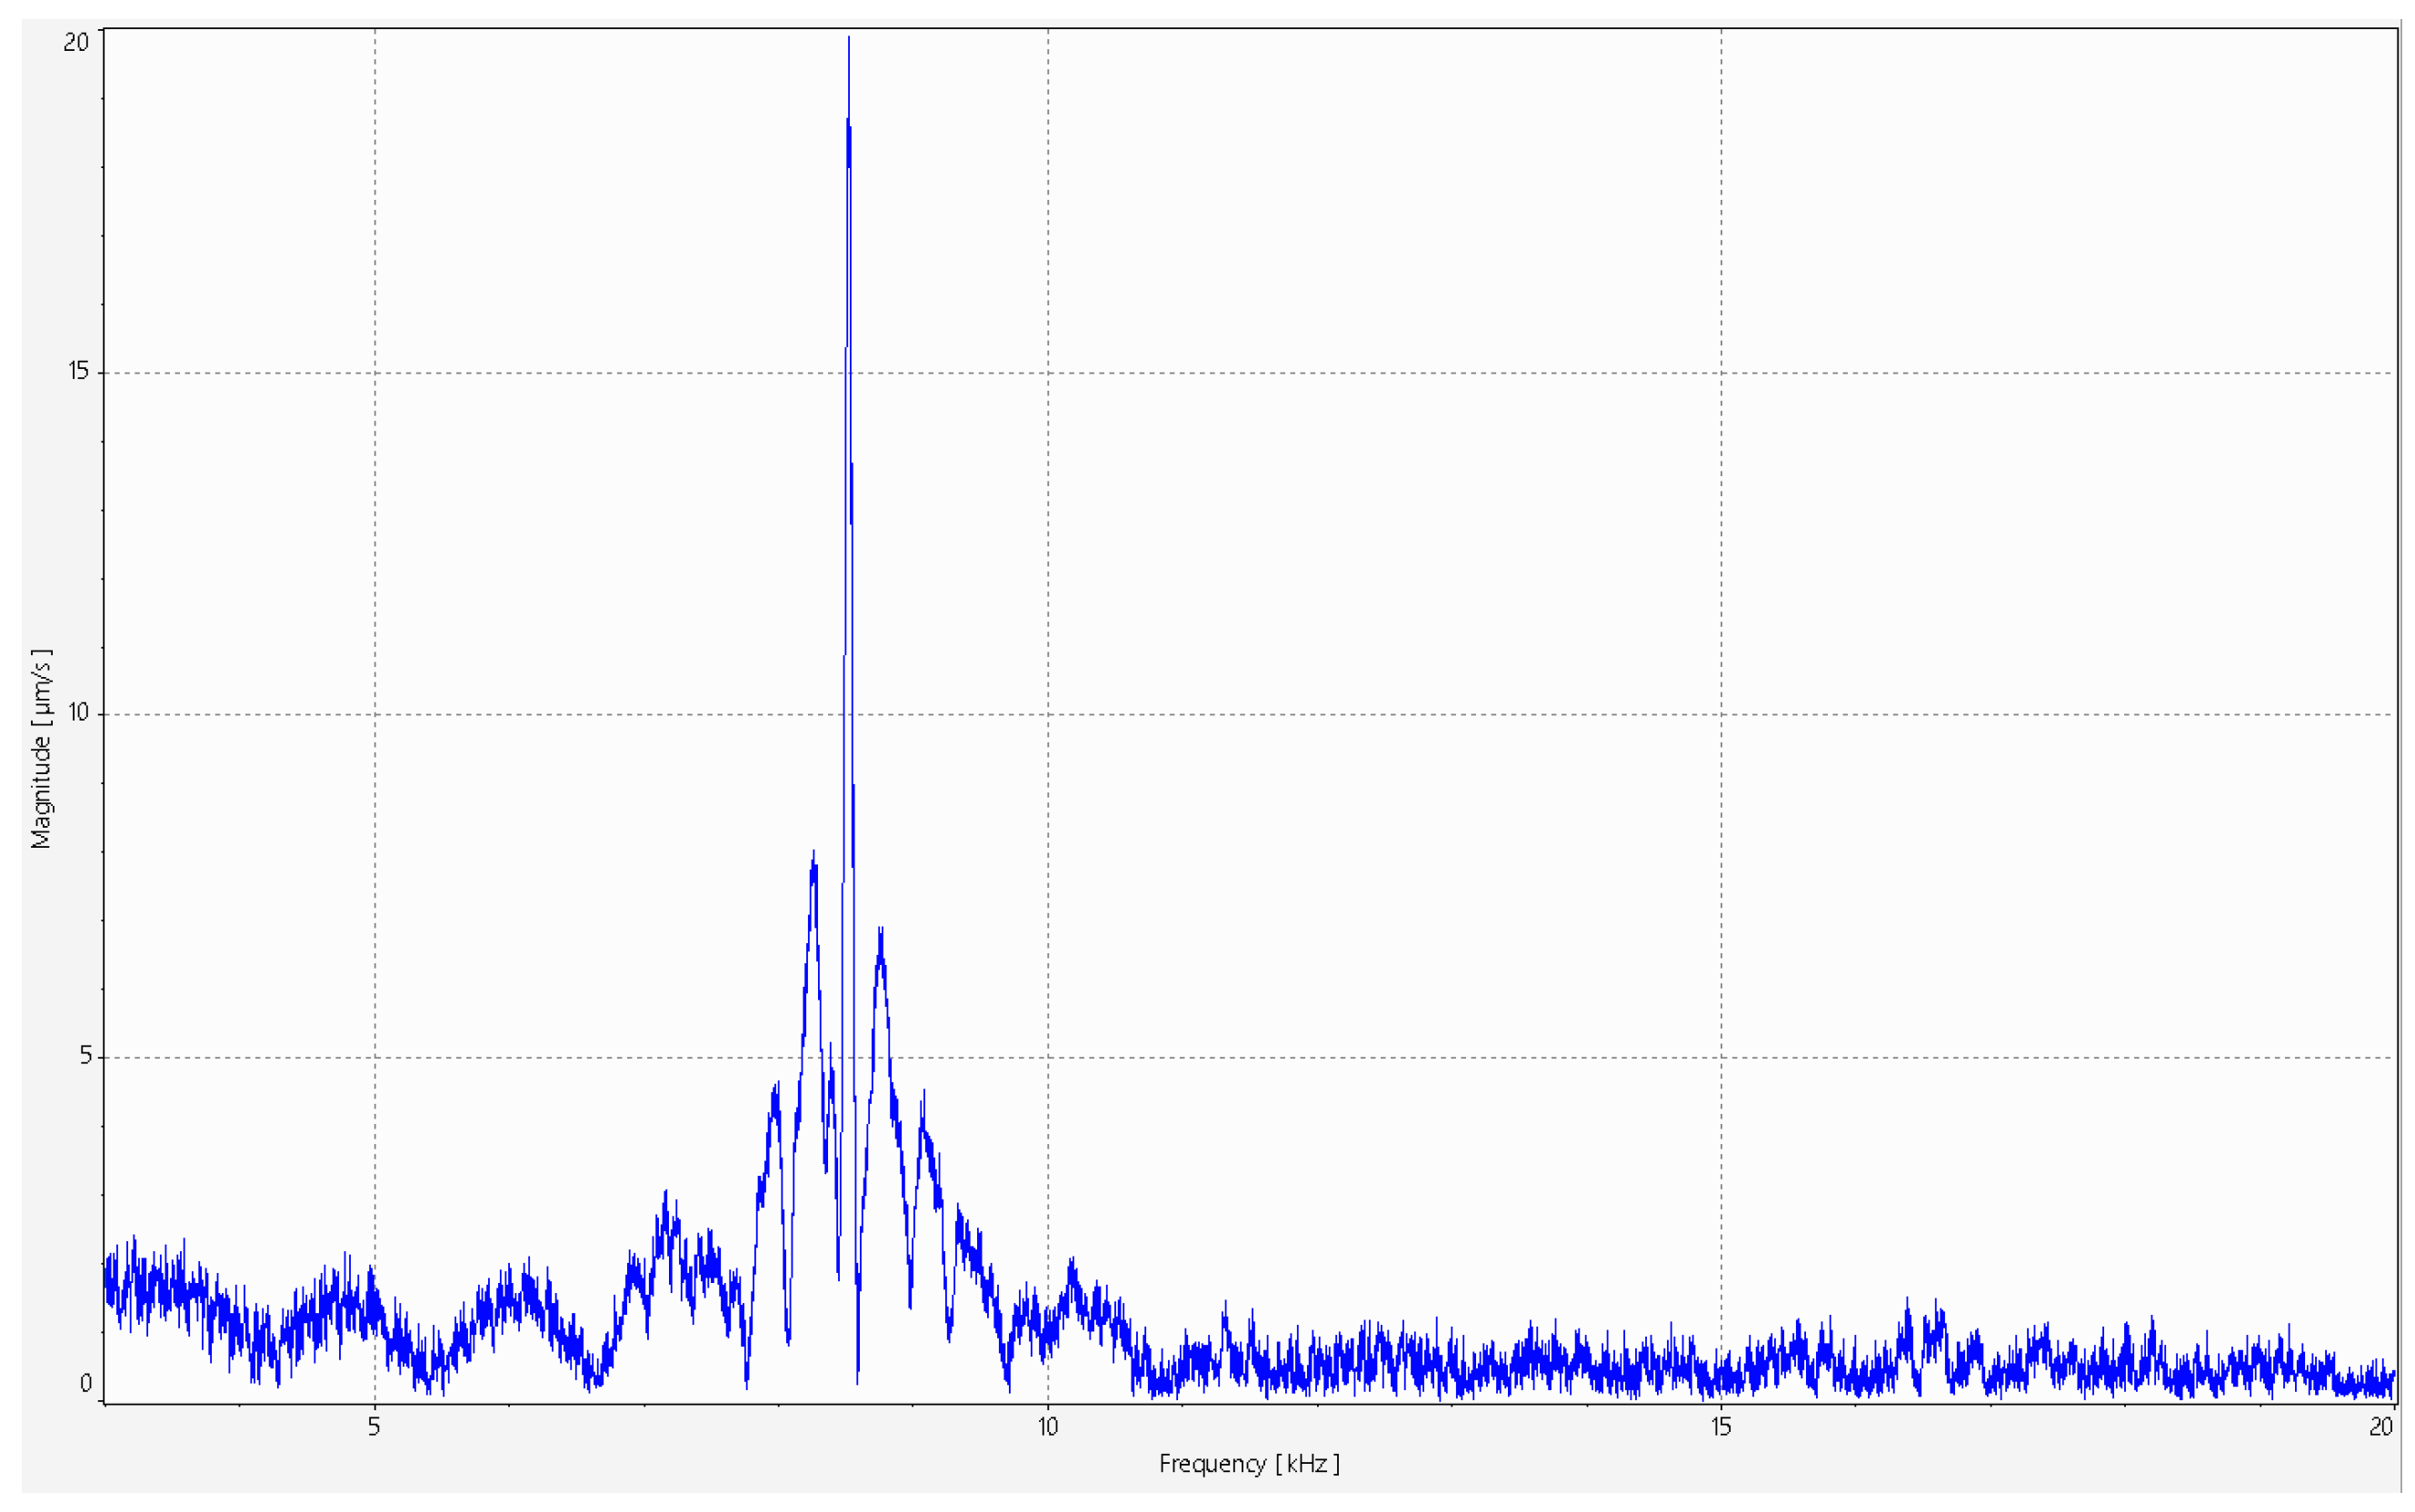
Acoustic excitation, in the form of an amplified sinusoidal sweep directed at the sample surface, did not produce satisfactory results under the test conditions in contrast to that of the compressed-air cannon. Despite adjustments to the frequency range and amplitude, the measured vibration responses from the laser Doppler vibrometer were minimal or undetectable within the targeted range of DC to 20 kHz.
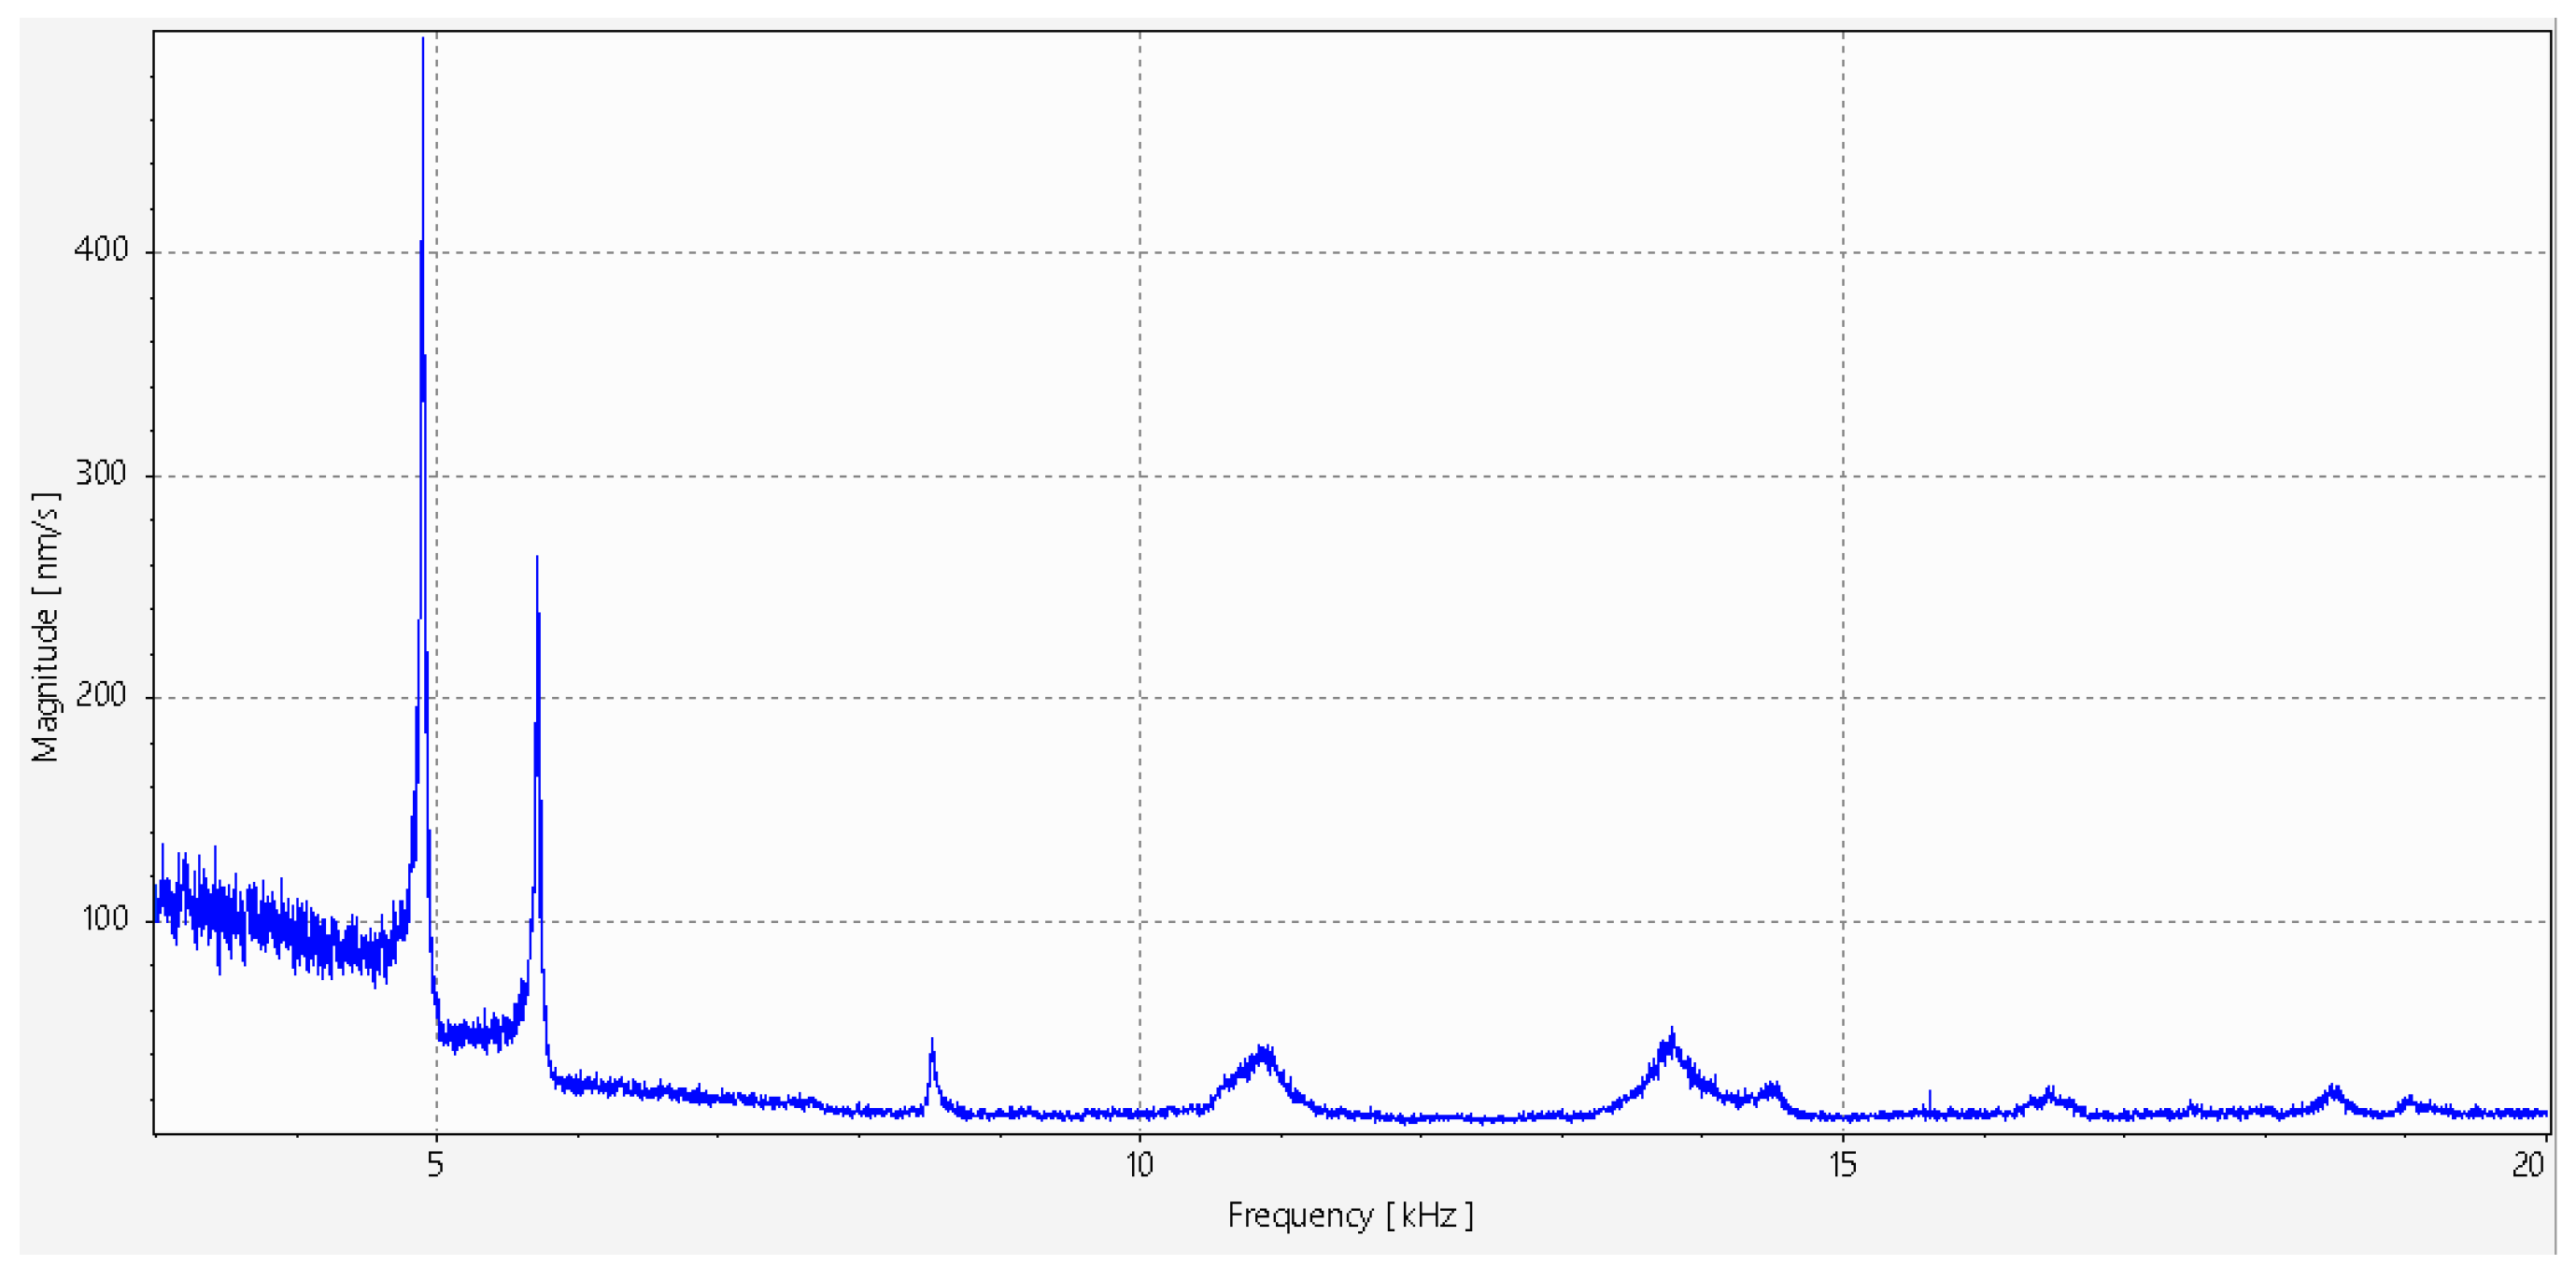
This lack of response is likely due to the limited acoustic power of the loudspeaker relative to the mass of the concrete samples. The energy transferred through air coupling was insufficient to generate detectable resonances. As shown in
Figure 17, no distinct peaks could be identified in the frequency response functions.
Although this method was ineffective for the small and dense samples used in the laboratory, it may still hold potential for larger structures such as tunnel linings, provided that a sufficiently powerful sound source—such as a Long-Range Acoustic Device (LRAD)—is used [
14]. This possibility should be explored before acoustic excitation is completely excluded from tunnel inspection applications.
4. Discussion
This study investigated how internal defects influence the vibrational characteristics of concrete blocks, using different excitation techniques and recording the dynamic response with a laser Doppler vibrometer. By embedding artificial defects such as voids, delamination, and cracks, and comparing these modified specimens with intact reference blocks, it was possible to examine the sensitivity of frequency-based measurements for defect detection.
An important observation across all measurements involving the shakers and loudspeaker was the occurrence of artifact peaks at approximately 4.9 kHz and 5.7 kHz. These peaks appeared in all measurements where the output of the junction box generator was used to control the excitation device. This behavior was traced to an electrical error and is not related to the dynamic properties of the samples. As such, these frequencies should be taken into account in the interpretation of the results.
The performance of the different excitation methods varied significantly, both in terms of signal-to-noise ratio (SNR) and the ability to use a Frequency Response Function (FRF) to suppress noise and remove false peaks. The hammer, Qsources shaker and BRÜEL & KJÆR Vibration Exciter all allowed FRF calculation, which improves the reliability of the data. In the case of the loudspeaker, an FRF could be obtained by dividing the LDV-measured velocity by the input voltage. However, this approach is not entirely accurate because the air gap between the speaker and the sample introduces unequal damping across frequencies, altering the amplitude of the transmitted signal. In contrast, the compressed-air cannon cannot be used directly to calculate an FRF because the input force is not measured.
The observed noise floor in several FRFs is attributed to a combination of excitation-related and optical measurement factors. Although LDV measurements are highly sensitive, the signal quality remains strongly dependent on the excitation energy transferred into the specimen. In the present setup, the excitation force generated by the BRÜEL & KJÆR shaker was limited at lower frequencies, resulting in reduced response amplitudes, and therefore lower signal-to-noise ratios in certain frequency regions. In addition, speckle-related optical noise and local surface scattering effects may have contributed to fluctuations in the measured velocity signals, particularly near weaker resonance regions [
20]. Some of the samples had small notches which increased the speckle noise as well. The application of complex averaging reduced random noise contributions, but residual noise remained visible in some FRFs.
When comparing the two shaker systems, the BRÜEL & KJÆR exciter delivered higher peak input power overall, but its frequency range was limited in practice. It struggled to excite frequencies below 6 kHz and above 15 kHz, reducing its applicability for larger structures and higher-frequency defect detection. The Qsources shaker, while producing lower peak input power, maintained effective excitation across higher frequencies and delivered cleaner, artifact-free data, making it more versatile for small-scale testing. For mechanical methods, the comparison between the hammer and the compressed-air cannon demonstrated a clear difference in frequency content and SNR. The hammer produced responses dominated by lower frequencies, a direct consequence of its longer impact time, and showed greater noise even when analyzed using an FRF. The compressed-air cannon, on the other hand, generated short-duration, high-energy impulses that excited a broader frequency range with very high SNR. This suggests that the cannon is better suited for applications that require the detection of fine structural details.
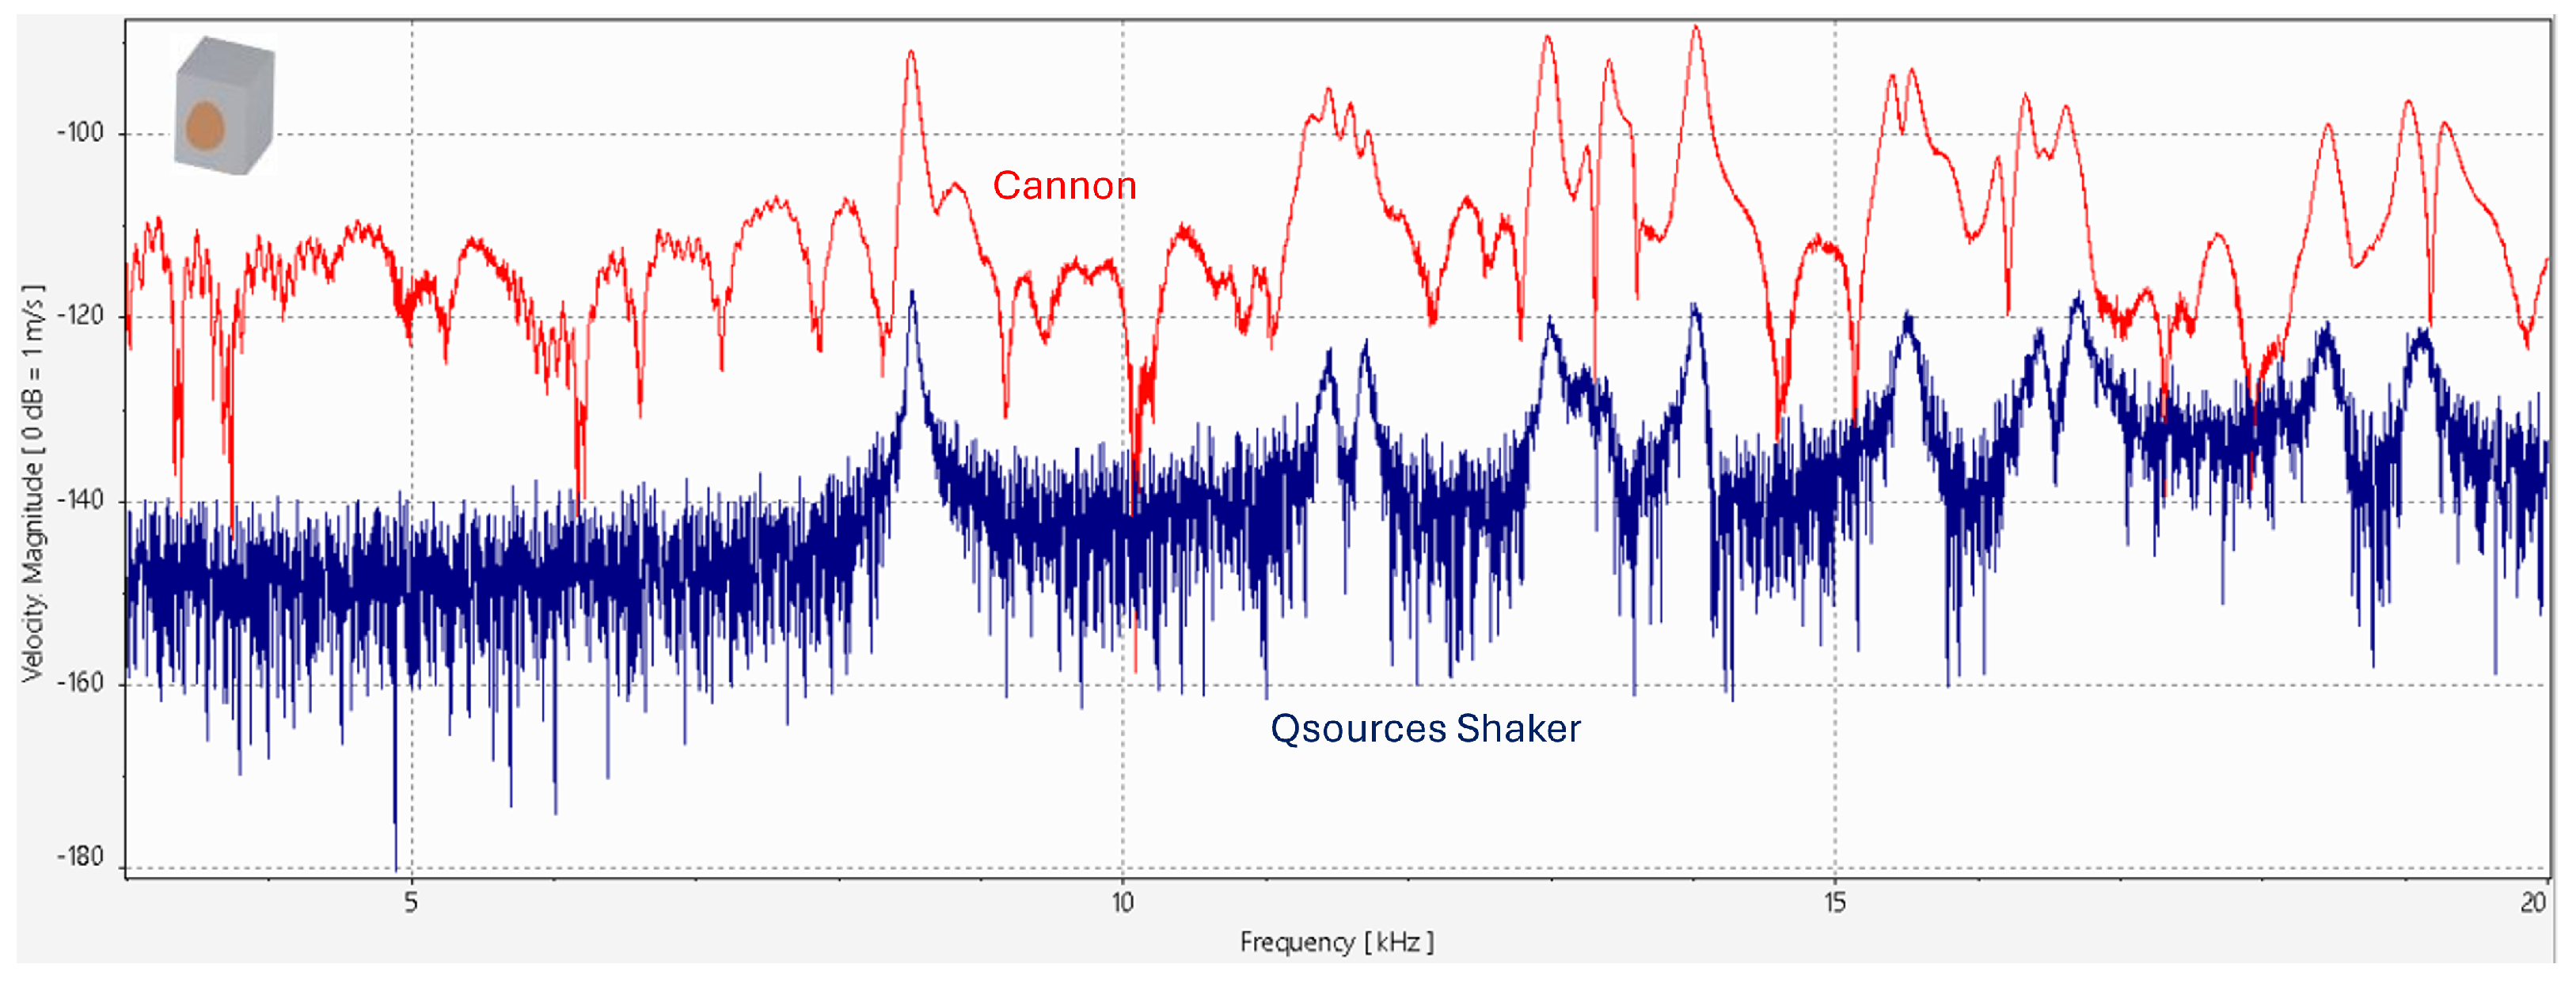
The comparison between the two best-performing methods—the Qsources shaker and the compressed-air cannon—revealed distinct trade-offs, as shown in
Figure 18. Here, the signal-to-noise ratio (SNR) is defined as the ratio between the response magnitude at a resonance peak and the surrounding noise floor in a narrow frequency window around that peak (expressed in dB). Using this definition, the air cannon generally yields a higher peak-to-noise-floor contrast than the shaker in the measured spectra, even without computing the FRF. This may be due to the greater amount of energy imparted to the sample, which excites additional structural features beyond the natural frequencies of the sample. However, the repeatability of the cannon is inherently lower than that of the Qsources shaker. For single-point measurements, where repeatability is less critical, the cannon may therefore be preferable. In contrast, for applications requiring consistent excitation across multiple measurement locations, such as scanning a larger surface, the Qsources shaker offers a more reliable solution.
In general, the results confirm that damage and internal defects in concrete produce measurable changes in dynamic response, particularly in the form of shifts in natural frequencies and alterations to the mode shapes. This validates the potential of vibration-based Non-Destructive Testing (NDT) methods for structural health monitoring and early defect detection in reinforced concrete infrastructure.
However, several limitations of this study must be acknowledged. All tests were conducted on small-scale laboratory-prepared specimens under controlled conditions. Although the defects introduced are representative of those found in real structures, the environmental stability and material uniformity of the test blocks differ from real-world concrete, which often degrades in more complex and heterogeneous patterns. In addition, large structures such as tunnels may not display distinct mode shapes detectable in small laboratory samples. In such cases, defect detection may need to rely on amplitude changes across frequency bands rather than on clear modal peaks, which requires further investigation.
Finally, the laboratory setup allowed for measurements on all sides of each block, an advantage that is not available in the field. In a tunnel environment, measurements would be limited to the accessible surface, typically the front face of the tunnel lining. This restriction could limit the applicability of certain excitation methods or require adaptations to the measurement strategy.
Future work should therefore include in situ tests on full-scale concrete elements under realistic environmental conditions, assessing the influence of temperature, humidity, and other operational factors. Such studies could determine the practicality of applying these methods in the field and identify which excitation techniques offer the best combination of sensitivity, repeatability, and operational feasibility.
5. Conclusions
This study compared three excitation methods—acoustic, mechanical, and shaker-based—for their effectiveness in detecting defects in small-scale concrete specimens through vibration-based Non-Destructive Testing (NDT) using a laser Doppler vibrometer. The concrete blocks included both intact reference samples and samples with artificial defects such as voids, delamination, and cracks, allowing controlled assessment of the sensitivity of each method to structural changes.
Acoustic excitation, implemented with a loudspeaker producing a sinusoidal sweep, proved ineffective under current laboratory conditions. The limited acoustic power, combined with the relatively high mass of the specimens, prevented sufficient energy transfer to excite detectable resonances. Although unsuitable for the present setup, acoustic methods may still be viable for large-scale applications if high-power directional sources, such as Long-Range Acoustic Devices (LRADs), are employed.
Mechanical excitation with the custom-built compressed-air cannon produced excellent results. The short-duration, high-energy impulse generated a high signal-to-noise ratio and clearly defined resonance peaks without requiring multiple measurements for averaging. These findings indicate that further refinement of this technique could provide a valuable, low-cost option for defect detection, particularly in applications where single-point measurements are sufficient.
Shaker excitation was performed using both a BRÜEL & KJÆR Vibration Exciter and a Qsources Qlws surface-mounted shaker. The Qsources device outperformed the larger shaker in multiple aspects, producing cleaner and artifact-free data, effectively exciting higher frequency ranges, and offering greater ease of use. These characteristics make it highly suitable for scanning applications that require repeatable excitation.
The results indicate that LDV-based measurements can support efficient non-contact inspection of concrete specimens. For scalable field inspection, however, the excitation method remains an important practical consideration. While the large electrodynamic shaker is valuable as a controlled laboratory reference, more compact and automated excitation methods, such as the compressed-air cannon or compact surface-mounted shakers, are more suitable candidates for future scalable inspection systems.
A promising direction for future research lies in combining these excitation techniques with artificial intelligence and pattern recognition algorithms. By building datasets of frequency response characteristics for healthy and defective concrete, machine learning models could be trained to automatically classify structural conditions and potentially locate defects. Such developments could make tunnel inspections faster, safer and entirely non-destructive, while reducing reliance on manual interpretation and subjective judgment. Lastly, regarding automating the measurements, research could be conducted on a moving measurement setup requiring no human involvement in moving and reconfiguring it. For tunnels, this could be achieved with a ground drone that has the excitation method and the LDV mounted on it.
Author Contributions
Conceptualization, M.A., J.L., N.G. and S.V.; methodology, M.A. and J.L.; software, M.A. and J.L.; validation, M.A., J.L. and N.G.; formal analysis, M.A. and J.L.; investigation, M.A. and J.L.; resources, N.G., O.D.M. and S.V.; data curation, M.A. and J.L.; writing—original draft preparation, M.A. and J.L.; writing—review and editing, N.G. and O.D.M.; visualization, M.A. and J.L.; supervision, N.G. and O.D.M. All authors have read and agreed to the published version of the manuscript.
Funding
The authors gratefully acknowledge support of the Research Fund of the University of Antwerp, and more specifically the Impulse project with number 46381.
Institutional Review Board Statement
Not applicable.
Data Availability Statement
Data available on request.
Acknowledgments
The authors would like to thank Jan Stoop and Lacy Wouters for their assistance in manufacturing the concrete specimens in their laboratory. The authors also acknowledge Konnexxions for providing and supplying the materials used in this work. Furthermore, the authors gratefully acknowledge support from the Research Fund of the University of Antwerp, in particular through the Impuls Project (No. 46381). During the preparation of this manuscript, the authors used ChatGPT (GPT-5.2 Thinking) for language editing. The authors reviewed and edited the output and take full responsibility for the content of this publication.
Conflicts of Interest
Author Olivier De Moor was employed by the company Konnexxions BV. The author declares no conflicts of interest. The company had no role in the design of the study; in the collection, analyses, or interpretation of data; in the writing of the manuscript; or in the decision to publish the results.
Abbreviations
The following abbreviations are used in this manuscript:
| NDT | Non-Destructive Testing |
| LDV | Laser Doppler Vibrometry |
| FRF | Frequency Response Function |
| SHM | Structural health monitoring |
| SNR | Signal-to-noise ratio |
| LRAD | Long-Range Acoustic Device |
References
- Canziani, A.; Quist, W. CONCRETO Code Book: Study on Historic Concrete Conservation; CONCRETO Academy: Ivrea, Italy, 2025; Available online: https://concreto-academy.org/wp-content/uploads/2025/05/Concreto_book_e-book.pdf (accessed on 3 March 2026).
- Austroads. Fatigue Life Estimation for Existing Reinforced Concrete Slab Bridges; Technical Report ABC-IAR004-11; Austroads: Sydney, Australia, 2011. Available online: https://austroads.gov.au/publications/bridges/abc-iar004-11 (accessed on 3 March 2026).
- Van Mullem, T.; Gruyaert, E.; Caspeele, R.; De Belie, N. First Large Scale Application with Self-Healing Concrete in Belgium: Analysis of the Laboratory Control Tests. Materials 2020, 13, 997. [Google Scholar] [CrossRef] [PubMed]
- Breysse, D. Deterioration processes in reinforced concrete: An overview. Woodhead Publ. Ser. Civ. Struct. Eng. 2010, 1, 28–56. [Google Scholar]
- Mehta, P.K.; Monteiro, P.J.M. Concrete: Microstructure, Properties, and Materials, 4th ed.; McGraw-Hill Education: New York, NY, USA, 2014. [Google Scholar]
- Broomfield, J.P. Corrosion of Steel in Concrete: Understanding, Investigation and Repair, 2nd ed.; CRC Press: Boca Raton, FL, USA, 2007. [Google Scholar]
- Boccacci, G.; Frasca, F.; Bertolin, C.; Siani, A.M. Diagnosis of Historic Reinforced Concrete Buildings: A Literature Review of Non-Destructive Testing (NDT) Techniques. Procedia Struct. Integr. 2024, 55, 160–167. [Google Scholar] [CrossRef]
- Helal, J.; Sofi, M.; Mendis, P. Non-Destructive Testing of Concrete: A Review of Methods. Electron. J. Struct. Eng. 2015, 14, 97–105. [Google Scholar] [CrossRef]
- Kasahara, J.Y.L.L.; Yamashita, A.; Asama, H. Acoustic Inspection of Concrete Structures Using Active Weak Supervision and Visual Information. Sensors 2020, 20, 629. [Google Scholar] [CrossRef] [PubMed]
- Jedidi, M. Evaluation of the concrete quality using destructive and non-destructive tests. MOJ Civ. Eng. 2018, 4, 219–223. [Google Scholar] [CrossRef]
- Federal Highway Administration (FHWA). Hammer Sounding (Limitations and Practice Notes). 2017. Available online: https://infotechnology.fhwa.dot.gov/ (accessed on 16 February 2016).
- Aggelis, D.; Kordatos, E.; Strantza, M.; Soulioti, D.; Matikas, T. NDT approach for characterization of subsurface cracks in concrete. Constr. Build. Mater. 2011, 25, 3089–3097. [Google Scholar] [CrossRef]
- Sansalone, M.; Carino, N.J. Impact-Echo: A Method for Flaw Detection in Concrete Using Transient Stress Waves; Technical Report NBSIR 86-3452; National Bureau of Standards: Washington, DC, USA, 1986.
- Akamatsu, R.; Sugimoto, T.; Utagawa, N.; Katakura, K. Proposal of Non Contact Inspection Method for Concrete Structures Using High-Power Directional Sound Source and Scanning Laser Doppler Vibrometer. Jpn. J. Appl. Phys. 2013, 52, 07HC12. [Google Scholar] [CrossRef]
- Farrar, C.R.; Worden, K. An Introduction to Structural Health Monitoring. Philos. Trans. R. Soc. A 2007, 365, 303–315. [Google Scholar] [CrossRef] [PubMed]
- Doebling, S.W.; Farrar, C.R.; Prime, M.B. A Summary Review of Vibration-Based Damage Identification Methods. Shock Vib. Dig. 1998, 30, 91–105. [Google Scholar] [CrossRef]
- Sohn, H.; Farrar, C.R.; Hunter, N.F.; Worden, K. Structural Health Monitoring Using Statistical Pattern Recognition Techniques. J. Dyn. Syst. Meas. Control 2001, 123, 706–711. [Google Scholar] [CrossRef]
- Worden, K.; Manson, G. The Application of Machine Learning to Structural Health Monitoring. Philos. Trans. R. Soc. A 2007, 365, 515–537. [Google Scholar] [CrossRef] [PubMed]
- Azimi, M.; Eslamlou, A.D.; Pekcan, G. Data-Driven Structural Health Monitoring and Damage Detection through Deep Learning: State-of-the-Art Review. Sensors 2020, 20, 2778. [Google Scholar] [CrossRef] [PubMed]
- Rothberg, S.; Allen, M.; Castellini, P.; Di Maio, D.; Dirckx, J.; Ewins, D.; Halkon, B.; Muyshondt, P.; Paone, N.; Ryan, T.; et al. An international review of laser Doppler vibrometry: Making light work of vibration measurement. Opt. Lasers Eng. 2017, 99, 11–22. [Google Scholar] [CrossRef]
- Staszewski, W.J.; Jenal, R.B.; Klepka, A.; Szwedo, M.; Uhl, T. A Review of Laser Doppler Vibrometry for Structural Health Monitoring Applications. Key Eng. Mater. 2012, 518, 1–15. [Google Scholar] [CrossRef]
- Muramatsu, M.; Uchida, S.; Takahashi, Y. Noncontact Detection of Concrete Flaws by Neural Network Classification of Laser Doppler Vibrometer Signals. Eng. Res. Express 2020, 2, 025017. [Google Scholar] [CrossRef]
- Yasuda, N.; Misaki, N.; Shimada, Y.; Yamaoka, D. Detection and Characteristics Estimation of Defects in Concrete Structures Using Laser Ablation-Induced Vibration. Tunn. Undergr. Space Technol. 2020, 103, 103460. [Google Scholar] [CrossRef]
- Scherr, J.F.; Kollofrath, J.; Popovics, J.S.; Bühling, B.; Grosse, C.U. Detection of Delaminations in Concrete Plates Using a Laser Ablation Impact Echo Technique. J. Nondestruct. Eval. 2023, 42, 11. [Google Scholar] [CrossRef]
- Bekele, A.; Ryden, N.; Gudmarsson, A.; Birgisson, B. Automated Non-contact Resonance Excitation Method to Assess Low Temperature Dynamic Modulus of Asphalt Concrete. J. Nondestruct. Eval. 2019, 38, 43. [Google Scholar] [CrossRef]
- Hottinger Bruel & Kjaer A/S (HBK). Product Data: Vibration Exciter Type 4809; BP 0231–17; Hottinger Bruel & Kjaer A/S: Naerum, Denmark, 2021; Available online: https://www.bksv.com/-/media/literature/Product-Data/bp0231.ashx (accessed on 25 March 2026).
- Qsources. Light Weight Shaker—Qlws. Available online: https://www.qsources.be/structural-excitation-products/light-weight-shaker-qlws (accessed on 25 March 2026).
- Ghaderi, N.; Hasheminejad, N.; Sels, S.; Ribbens, B.; Dirckx, J.; Vanlanduit, S. Soft material characterization through surface wave elastography using a laser Doppler vibrometer. Mech. Syst. Signal Process. 2025, 224, 112037. [Google Scholar] [CrossRef]
Figure 1.
All of the concrete blocks that were prepared using the molds shown on the left.
Figure 1.
All of the concrete blocks that were prepared using the molds shown on the left.
Figure 2.
Overview of concrete test blocks with various defect types, including cracks, voids (ping-pong ball, styrofoam, and plastic), and delaminations.
Figure 2.
Overview of concrete test blocks with various defect types, including cracks, voids (ping-pong ball, styrofoam, and plastic), and delaminations.
Figure 3.
Schematic of excitation by the big shaker with the PSV-400 as measuring device.
Figure 3.
Schematic of excitation by the big shaker with the PSV-400 as measuring device.
Figure 4.
Setups of the mechanical excitation methods with the PSV-400 as measuring device. (a) Schematic of the setup to induce vibrations using a modal hammer. (b) Schematic of the setup to induce vibrations using the improvised compressed-air cannon with a pressure of 8 bar. (c) Small improvised compressed-air cannon that was held at roughly the same position for every excitation.
Figure 4.
Setups of the mechanical excitation methods with the PSV-400 as measuring device. (a) Schematic of the setup to induce vibrations using a modal hammer. (b) Schematic of the setup to induce vibrations using the improvised compressed-air cannon with a pressure of 8 bar. (c) Small improvised compressed-air cannon that was held at roughly the same position for every excitation.
Figure 5.
Experimental setup for acoustic excitation using a 20 V amplitude signal over a frequency range of 3–20 kHz.
Figure 5.
Experimental setup for acoustic excitation using a 20 V amplitude signal over a frequency range of 3–20 kHz.
Figure 6.
A picture of the PSV-400 laserhead measuring the vibration of the concrete block from the BRÜEL & KJÆR Vibration Exciter.
Figure 6.
A picture of the PSV-400 laserhead measuring the vibration of the concrete block from the BRÜEL & KJÆR Vibration Exciter.
Figure 7.
The different FFTs of the 3 types of samples, with a clear difference between the frequencies at which peaks are located.
Figure 7.
The different FFTs of the 3 types of samples, with a clear difference between the frequencies at which peaks are located.
Figure 8.
Input shaker from 3 kHz to 15 kHz with a resonance frequency at 9.2 kHz.
Figure 8.
Input shaker from 3 kHz to 15 kHz with a resonance frequency at 9.2 kHz.
Figure 9.
Measurement on sample ‘Kinder egg void’ on the top left corner of the sample with the BRÜEL & KJÆR Vibration Exciter. The first natural frequency is at 8.8 kHz.
Figure 9.
Measurement on sample ‘Kinder egg void’ on the top left corner of the sample with the BRÜEL & KJÆR Vibration Exciter. The first natural frequency is at 8.8 kHz.
Figure 10.
The input force from the Qsources shaker, which is roughly evenly distributed with a small peak at 19.5 kHz.
Figure 10.
The input force from the Qsources shaker, which is roughly evenly distributed with a small peak at 19.5 kHz.
Figure 11.
Eigenmodes from a reference block obtained with the Qsources shaker.
Figure 11.
Eigenmodes from a reference block obtained with the Qsources shaker.
Figure 12.
Measurement of ‘Kinder egg void’ on the top left corner of the sample with the Qsources shaker. First natural frequency at 8.8 kHz.
Figure 12.
Measurement of ‘Kinder egg void’ on the top left corner of the sample with the Qsources shaker. First natural frequency at 8.8 kHz.
Figure 13.
The input force of the modal hammer is very low from 10 kHz. Measurements of low frequencies can be made using this hammer.
Figure 13.
The input force of the modal hammer is very low from 10 kHz. Measurements of low frequencies can be made using this hammer.
Figure 14.
Measurement of ‘Kinder egg void’ on the top left corner of the sample with the modal hammer. Only the first natural frequency can be determined because of the inefficient input force at higher frequencies.
Figure 14.
Measurement of ‘Kinder egg void’ on the top left corner of the sample with the modal hammer. Only the first natural frequency can be determined because of the inefficient input force at higher frequencies.
Figure 15.
Measurement of ‘Kinder egg void’ on the top left corner of the sample with compressed-air cannon. Higher natural frequencies are visible because of the short impact time.
Figure 15.
Measurement of ‘Kinder egg void’ on the top left corner of the sample with compressed-air cannon. Higher natural frequencies are visible because of the short impact time.
Figure 16.
Comparison between the measured velocity spectra obtained using the modal hammer and the compressed-air cannon on the same ‘Kinder egg void’ specimen and at the same measurement location. The purple curve represents the modal hammer response, while the red curve represents the compressed-air cannon response.
Figure 16.
Comparison between the measured velocity spectra obtained using the modal hammer and the compressed-air cannon on the same ‘Kinder egg void’ specimen and at the same measurement location. The purple curve represents the modal hammer response, while the red curve represents the compressed-air cannon response.
Figure 17.
Measurement of ‘Kinder egg void’ on the top left corner of the sample with the loudspeaker. The artifact peaks at 4.8 kHz and 5.4 kHz are much higher than the natural frequencies, which are barely visible.
Figure 17.
Measurement of ‘Kinder egg void’ on the top left corner of the sample with the loudspeaker. The artifact peaks at 4.8 kHz and 5.4 kHz are much higher than the natural frequencies, which are barely visible.
Figure 18.
Measurement of ‘Kinder egg void’ on the top left corner of the sample: Qsources (blue) vs. compressed-air cannon (red) [in dB]. Both give the same natural frequencies but with a different amplitude.
Figure 18.
Measurement of ‘Kinder egg void’ on the top left corner of the sample: Qsources (blue) vs. compressed-air cannon (red) [in dB]. Both give the same natural frequencies but with a different amplitude.
Table 1.
Main specifications of the shakers used for electrodynamic excitation.
Table 1.
Main specifications of the shakers used for electrodynamic excitation.
| Device | Manufacturer | Model | Range | Remarks |
|---|
| Vibration Exciter | Brüel & KjÆr
NÆrum, Denmark | 4809 | 10 Hz–20 kHz | Reference shaker; limited at below 6 kHz and less efficient above 15 kHz. |
| Miniature surface-mounted shaker | Qsources
Liège, Belgium | Qlws | Core: 250–8000 Hz
Extended: 63–12,500 Hz | Low-noise measurements; suitable for small-scale testing. |
Table 2.
Parameters used for the measurements taken with the PSV-400.
Table 2.
Parameters used for the measurements taken with the PSV-400.
| Sensitivity | Max Frequency | FFT Lines | Resolution | High-Pass Filter |
|---|
| 5
(m/s)/V | 20 kHz | 6400 | 3.125 Hz | 100 Hz |
Table 3.
Comparison between modal hammer and compressed-air cannon excitation based on the measured LDV velocity spectra shown in
Figure 16.
Table 3.
Comparison between modal hammer and compressed-air cannon excitation based on the measured LDV velocity spectra shown in
Figure 16.
| Criterion | Modal Hammer | Compressed-Air Cannon |
|---|
| First dominant resonance | ∼8.8 kHz | ∼8.8 kHz |
| Useful frequency range in this measurement | Mainly below ∼10 kHz | Approximately 3–20 kHz |
| Clearly visible resonance peaks above 10 kHz | Not clearly distinguishable | Multiple peaks visible |
| Input force measurement | Available | Not available |
| FRF calculation | Possible | Not possible without additional
force measurement |
| Main practical advantage | Force-normalized analysis possible | Clearer broadband excitation response |
| Main practical limitation | Limited high-frequency excitation | Output spectrum only, unless input force
is measured |
| Disclaimer/Publisher’s Note: The statements, opinions and data contained in all publications are solely those of the individual author(s) and contributor(s) and not of MDPI and/or the editor(s). MDPI and/or the editor(s) disclaim responsibility for any injury to people or property resulting from any ideas, methods, instructions or products referred to in the content. |





 ,
,