Abstract
The proper usage of a bandwidth-limited imaging bolometer for the measurement of the lateral temperature profile of microstructures in Silicon-Carbide (SiC) is analyzed. The SiC spectral emissivity, , has a dip at m, which is in the band of a typical commercially available instrument and complicates the selection of the value of the equivalent emissivity, , in the instrument settings. The impact is analyzed by deduction using simulation, and by experimental validation. Membranes of 3C-SiC of 1000 m diameter and 3 m thickness have been fabricated on Si wafers, with integrated poly-SiC resistors for both membrane heating and on-membrane temperature measurement for calibration purposes. The optimum setting was found as = 0.705 ± 0.025 by deduction and as = 0.66 ± 0.06 by experimental validation in the temperature range 120 °C to 400 °C. The apparent temperature coefficient of emissivity, 2 × 10⁻⁴ °C−1 is due to the shift of the Wien peak wavelength relative to the instrument’s sensitivity band.
1. Introduction
This paper focuses on the proper usage of a commercially available imaging bolometer for measuring the lateral temperature profile of microheaters fabricated in a membrane using micro electro mechanical system (MEMS) technology (also referred to as microtechnology). An essential aspect of the membrane characterization is the actual temperature distribution over the membrane area at a given heating power, for which non-contact temperature measurement using a bolometer (also referred to as total radiation pyrometer) is the most appropriate approach. The traditional bolometer is a simple non-contact temperature sensor without imaging capabilities [1,2]. In the early stage of membrane characterization, such a single-point sensor was used in combination with an x–y translation table for obtaining 2D information by mechanical scanning [3]. Currently, imaging bolometers (also referred to as thermal imaging cameras) are available, comprising of an array of uncooled microbolometers, readout, and data-processing for electronic scanning, to simplify such a thermal analysis [4,5,6]. However, both the traditional bolometer and the imaging bolometer are subject to a material-dependent uncertainty in the temperature measurement due to the spectral emissivity of a heated microstructure. As is demonstrated here, such a complication does not arise in a silicon (Si)-based heated micromembrane, but is an issue in the interpretation of the measurement result in case of a membrane fabricated in silicon-carbide (SiC).
Similar to an electric circuit, the thermal contact resistance in combination with the heat capacity of any contact-based temperature sensor results in a low-pass frequency response with a scale error and a settling time [7]. Contact temperature measurement essentially requires heat flowing from the measurement object to the sensing element to heat up the sensor to the object temperature. For an acceptable inaccuracy, this re-balancing of the heat initially stored in the object should not lead to a significant reduction in the object temperature. Consequently, the heat capacity of the external temperature sensor must be significantly lower compared to that of the object to ensure a measurement within reasonable inaccuracy specifications. This is a limitation, especially in contact measurement on devices of miniature dimensions, such as a structure that is fabricated in MEMS-technology. Operation of the bolometer does not involve heat flow by thermal conduction but rather the measurement of the amount of optical power (flux of radiation) emitted. Therefore, the bolometer is favored for temperature measurement on MEMS structures.
The optical power emitted by the object at absolute temperature (in Kelvin [K]) in a given direction per unit solid angle (per steradian) and per unit area is referred to as the radiance, . The radiance results from the integration of the temperature-dependent spectral radiance, , as described by Planck’s expression, over the entire wavelength range. The result is the Stefan–Boltzmann expression for radiance per unit area and per steradian: = , with 5.67 × 10⁻⁸ Wm−2 K−4 the Stefan–Boltzmann constant [6,7]. Figure 1a shows the simplified bolometer set-up.
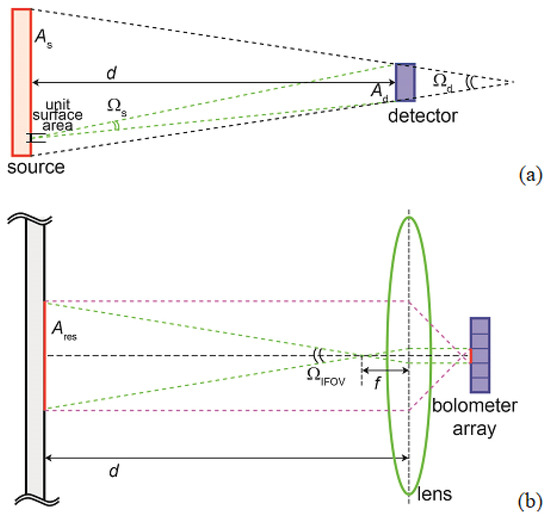
Figure 1.
Simplified schematic of (a) the typical set-up of a bolometer system for non-contact temperature sensing with the object within the opening angle (field of view) of the detector, and (b) the regular operating mode of an imaging bolometer.
The radiance within the opening angle (also known as cone of acceptance or field of view), , of the optical system is imaged onto a detector for optical power and used as a measure for . When assuming Lambertian radiation (a non-directional emitter) at temperature , the power absorbed at the detector is described by
with = the solid angle at which the detector area is viewed from the emitter and is the absorbance of the detector. The bolometer is typically calibrated using a blackbody emitter as the source. However, a practical source is not a perfect emitter (absorber) and is referred to as a graybody emitter with a material-dependent emissivity, (with = 1 for a blackbody emitter and 1 otherwise).
From a fundamental metrological perspective, Equation (1) contains too many unknowns. The temperature of the source, , is the quantity of interest but uncertainties are added by the estimates of (the distance between emitter and instrument, d, is not accurately known), (which is not necessarily known for the material investigated) and the emitter area, , within the opening angle of the detector (also depending on distance between emitter and instrument, d). This problem is reduced when also considering the opening angle of the detector, which is a known property of the instrument and defined as = . When considering that = , Equation (1) can be expressed as
The accuracy of the power reading depends solely on the properties of the instrument, with the exception of the emissivity , and is independent of d, provided that the solid angle is completely filled with the emitter surface at temperature , which is a challenge in temperature measurement on a MEMS structure due to size. This requirement is an operational weakness, but must be satisfied to avoid inaccuracy due to interference from background radiation at a different temperature. A solution is a bolometer with a narrow value for equipped with a visible LED-based pointer system for enabling the user to align this cone of acceptance in such a way that the intended object is included. In a high-temperature application, the opening angle must be small enough to maintain a safe distance from an object at a very high temperature.
Over time, the bolometer has evolved from an instrument for non-contact measurement of temperature at a single node, to a two-dimensional (2D) thermal imager (imaging bolometers) based on an array of micro-bolometers. Imaging bolometers are equipped with a lens system to ensure that the object is imaged over a maximum number of pixels in the detector array, as shown schematically in Figure 1b [6]. This feature has made the imaging bolometer highly suitable for thermal characterization of the temperature profile of a highly miniaturized structure, such as a MEMS. The spatial resolution is in principle defined by the FOV of a single pixel (the instantaneous field of view—IFOV), while a pixel is completely filled by the spatial resolution of the imaged object in a well-designed instrument.
The instrument has been extensively calibrated by the manufacturer to minimize the effect of optical and electrical sources of uncertainty [6,8,9]. The uncertainty in the emissivity of the source is the only remaining fundamental weakness of the bolometer as a general-purpose instrument. The temperature reading, , of the instrument is based on calibration using a blackbody emitter, which implies an = . However, the blackbody assumption is usually inadequate and this measured radiance is actually = due to a graybody emitter at actual temperature . Equating results in
Therefore, a correction factor should be applied to the reading, which can be entered into the instrument [6]. Techniques are provided in the literature to avoid the reliance on prior information about the material for making an estimate of the emissivity, such as the dual-wavelength (or two-color) pyrometry, which involves radiance measurement at two different narrow bands and calculation of the ratio between the readings. The error analysis is described extensively in the literature and indicates that dual-wavelength pyrometry is particularly powerful if is without a strong wavelength dependence (the object is in good approximation a graybody source) [1,5,10]. Application-specific approaches based on deep learning algorithms are sometimes possible [11]. These options do not offer a solution in case of a significant wavelength-dependence, which is the case discussed here for MEMS-based microheaters in SiC. A closer examination of its material properties in relation to the specifications of the instrument, as presented here, is required to ensure a bolometer measurement of acceptable inaccuracy.
2. Materials and Methods
The radiance per steradian at a given temperature T, , is calculated over the wavelength range of sensitivity of the bolometer by integration of the temperature-dependent spectral radiance, , as described by the Planck’s expression. The spectral emissivity of the source, , is the core issue of this analysis and is considered temperature independent (this assumption is discussed in detail in Section 3) [12,13]. The relative spectral response of the bolometer system is . The radiance over the operating bandwidth between and can be described as
The bolometer system is fully calibrated by the manufacturer against a blackbody emitter. Hence,
Therefore,
The second part is zero in case of a wavelength-independent emissivity and Equation (6) reduces to
which is the general rule for a graybody emitter. However, SiC has a strongly wavelength-dependent emissivity within and the second part of Equation (6) is non-zero. Therefore, one cannot simply assign a constant equivalent emissivity, , based on weighted average. Instead, the optimum instrument setting for equivalent emissivity is derived using numeric integration of Equation (6), rather than a calculation of the weighted average of the emissivity only and =
The calculations are implemented in MATLAB version R2020b.
The experimental validation is carried out in two steps. In the first step, devices are placed in a temperature-controlled oven and the temperature is (actively) increased from 50 °C to 400 °C and subsequently (passively) cooled to 50 °C. Meanwhile, temperature readings are taken using the on-membrane poly-SiC resistors that are used for both heating and temperature measurement. From this measurement, the resistance of the resistor/heater (temperature coefficient of resistivity—TCR) is calibrated against the furnace temperature.
In the second step, the membrane is electrically heated using the same on-membrane resistive heater and the temperature profile is recorded using a commercially available imaging bolometer (FLIR a325sc camera), while the default emissivity setting = 0.95 was used in combination with a close-up lens [6]. The four-wire set-up enables simultaneous heating and resistance readout of the heater. The results are used to calibrate the temperature reading of the bolometer against the temperature measurement by the on-membrane resistor. From this information, a correction factor can be derived that accounts for the SiC emissivity.
A complication is the non-uniform lateral temperature profile over the heated membrane, which is due to the operating mechanism of the microheater (this was the initial reason for our use of the imaging bolometer in the research on MEMS devices). The thermal gradients are the result of heat flow from heater to ambient, which is a loss mechanism that is not applicable in a furnace calibration. Although the data is processed and systematically checked for non-plausible thermal gradients, significant uncertainties are unavoidable.
3. Complications of a Bandwidth-Limited Bolometer
3.1. Comparison Between Si and SiC
While the state-of-the-art in microheaters is based on silicon-related materials on a silicon substrate, there are good reasons to consider SiC as an alternative. Silicon devices are typically based on a microfabricated membrane with a thickness in the <1–5 m range and a diameter in the 100–1000 m range. The membrane is usually of silicon-oxide (SiO2) because of its relatively low thermal conductivity, but SiNx is also being used because of its larger mechanical strength. A lateral structure of either a metal thin film or a polycrystalline–silicon (poly-Si) layer is microfabricated on top of the membrane and serves as resistive heater by applying an appropriate doping level [14,15,16,17].
MEMS-based microheaters are primarily used in two application domains. The first is for device heating for a wide range of purposes, ranging from only a few degrees of temperature above ambient temperature, such as in thermal flow sensors [14,15], to heating of thin-film gas sensors by a few hundred degrees for establishing a surface temperature for maximum sensitivity for a specific gas [16,17,18]. The second is as incandescent light source in, for instance, absorption spectroscopy for gas composition sensing in the IR (usually CO2, N2O and CO in the 4–5 m range) [19,20,21]. The silicon emissivity, , can be considered wavelength-independent within the spectral operating range of commercially available bolometers. Thus, thermal profile characterization of microfabricated heaters is sufficiently accurate to enable validation of simulation results.
Silicon-Carbide has been extensively investigated for use in harsh environments because of its high chemical inertness, high melting temperature, high critical E-field, high Young’s modulus, and high radiation hardness [22,23]. Moreover, fabrication can be merged with Si-based MEMS technology and SiC layers can be deposited on a silicon wafer using equipment that is highly similar to that used in Si-based microfabrication [24]. This compatibility with Si microtechnology makes SiC suitable as a material for device fabrication in a MEMS. Therefore, SiC is a competitive alternative to a Si membrane in case of an application requiring an extremely robust device, especially with regard to high operating temperature. SiC is transparent in the visible part of the optical spectrum. This property has enabled the realization of a MEMS window, which can be mounted on the wall of an exhaust system for providing a view into the exhaust system by an external optical sensor [25]. Such a window can be used for measuring specific properties of the exhaust gas using optical techniques, such as composition by absorption spectroscopy or presence and diameter of particulates by scattering spectroscopy. Additional environmental protection is imparted with integrated resistors, which are used for periodically raising the window temperature for burning off (oxidizing) any soot deposits and thus for regenerating transparency. Although successful, this research has also revealed significant inconsistencies in the thermal characterization results obtained from heated membranes in SiC using an imaging bolometer. These are investigated and found to be mainly due to the wavelength dependence of within the band of sensitivity of the bolometer.
It should be emphasized that the work presented here is not a materials study on SiC or a fundamental study on the physics governing its emissivity or its use as a nanomaterial [26,27]. Issues such as scattering due to surface roughness are not investigated because the spatial dimensions of the roughness are typically smaller than the wavelengths in the part of the spectrum considered.
Kirchhoff’s law of thermal radiation states that the power radiated by an object in thermal equilibrium must be equal to the power absorbed, which implies that the spectral emissivity of a material can be expressed in terms of its spectral absorbance. However, the emitting layer should be of a sufficiently high absorption coefficient and thickness to ensure full absorption of radiation. This requirement is considered satisfied in this study.
Bolometric measurement of the wafer surface temperature profile has been generally applied during silicon microfabrication. Therefore, data on the spectral emissivity of silicon, , is important and results on characterization efforts on is available in literature [28,29,30]. This information is used for constructing the curves shown in Figure 2.
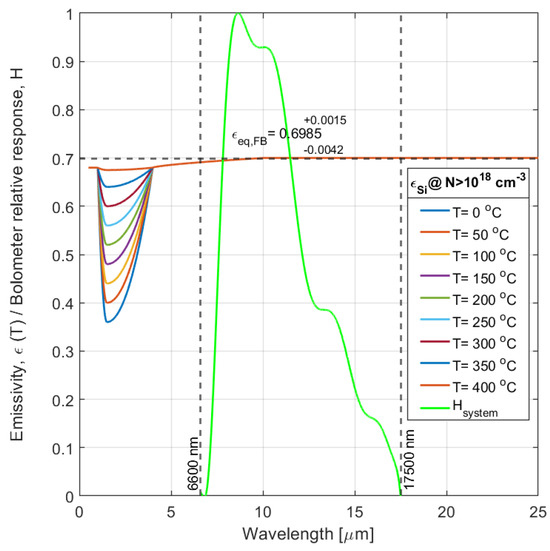
Figure 2.
Si spectral emissivity as a function of temperature for a doping concentration (deducted from [29,30]) and the bolometer (system) relative spectral response, , (green curve).
The emissivity of silicon has a profound wavelength-dependence, with 0.7 and independent of temperature in most of the IR, but with a temperature-dependent dip in the 1–4 m band. The magnitude and spectral position of this dip also depends on doping concentration. For intrinsic material (1.5 m) < 0.1 for 350 °C and , but for the doping dependency saturates and only a temperature dependence remains. This implies that silicon is a wavelength-independent graybody source only for wavelengths longer than 4 m. This is convenient, as membranes for heaters are usually at a doping level that exceeds and the spectral operating range includes the 4–5 m band that is popular for gas sensing by absorption spectroscopy.
However, 0.7 also implies that 30% of the potentially available power is not emitted. For this reason, heated silicon membranes for use as mid-IR emitters are often coated with a layer providing high absorbance, such as a porous metal [31], a thin-film multi-layer used as interference filter [32], vertically grown carbon nanotubes (CNT) [33] or metamaterials [21,34,35,36].
Imaging bolometers have been used without complication for characterization of the lateral temperature profile of silicon microheaters, despite this spectral dip, by setting the instrument to a source emissivity of = 0.7. This is mainly due to the fact that practical bolometers do not measure over an unlimited spectrum, but are limited to the spectral range that results from the transmission through the different lenses in the optical system and the spectral response of the absorber/detector. The overall system spectral transmittance results from the multiplication of these spectral dependencies, which is not a simple band-pass but a higher-order filter instead. This property is referred to here as the bolometer (system) relative spectral response, , and is shown in Figure 2 for a typical commercially available imaging bolometer [6].
This limited spectral range inevitably leads to loss of information, but actually brings two practical benefits. The first is the compression of the dynamic range of the input signal, which facilitates the use of the instrument for measurement of both objects at room temperature and those at very high temperature. Secondly, it reduces the spectral range in which a material needs to be a graybody emitter. As the silicon spectral emissivity is almost constant within the spectral range of sensitivity of the bolometer, a setting of the equivalent emissivity to = 0.7 can be used without causing complications, which is an aspect that has served the development of silicon-based microheaters well and is an advantage that has gone largely unnoticed and therefore taken for granted.
The spectral emissivity of SiC has a very different wavelength dependence as compared to that of Si, as shown in Figure 3.
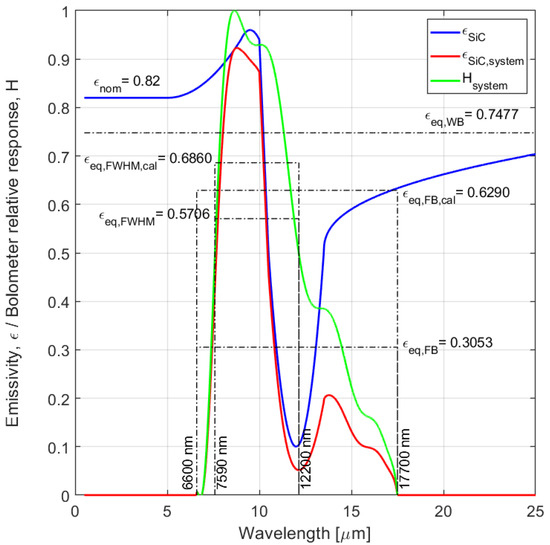
Figure 3.
Actual SiC emissivity (blue curve), in comparison to the calculated weighted emissivity (red curve) as defined by the bolometer relative spectral response, , (green curve). The different options for the equivalent emissivity are calculated and plotted as dashed curve: when considering the entire band between 1–25 m while disregarding the weighing by (full width—FW), when considering the FWHM-bandwidth of (FWHM band), or when considering the entire bandwidth of (full band—FB).
This spectral emissivity of was already investigated in an early study, which confirmed an independence to temperature within the ±2% inaccuracy of the set-up used [12]. This conclusion was confirmed in a more recent study for temperatures up to 850 °C [13]. Although = 0.82 in most of the IR, it is reduced to 0.1 in the 11–12 m band. The spectral absorbance of a material is generally governed by the energy levels of the different phonon modes, which are usually specified as the associated wavelengths. These have no significant effect on the Si spectral absorbance in the wavelength range considered here. However, for a polar material such as SiC, the longitudinal optical phonon mode (at ) and the transverse optical phonon mode (at ) are particularly relevant and the values for 3C SiC at 300 K are: = 10.28 m and = 12.54 m [13,37,38]. The spectral band in between is referred to as the ‘Reststrahlenband’. In this band the reflectance is close to unity and as a consequence the absorbance is small [13]. This effect is confirmed in Figure 3 by 0.1 in the range between about 10.5 m and 12.5 m.
An additional phenomenon in a polar material is the Christiansen effect at a wavelength slightly shorter than . At this wavelength, the index of refraction n = 1 and thus the material is perfectly matched to the medium of incidence (air) [37]. The result is a non-reflecting surface and thus full penetration of incident radiation into the material. The full absorption is equivalent to 1, as is confirmed in Figure 3 for SiC at m.
The fact that SiC can be considered a graybody emitter with up to about 8 m wavelength is a significant advantage when used as an IR light source in optical gas absorption spectroscopy. However, the emitted spectral power in the 10–14 m band is significantly reduced due the wavelength-dependent dip of in this range, which is also within the operating spectrum of the imaging bolometer. This effect makes it more difficult to define an optimum instrument setting, , and can be expected to introduce a problem in case a bolometer is used for the investigation of the lateral temperature profile over the heated membrane (and indeed has in our work on the regenerable MEMS window). The spectral dip would result in a measured radiance that would be interpreted as originating from a source at a temperature lower than the actual value. Several models can be considered to account for this effect.
3.2. Options for Modeling
Figure 3 can be directly used for identifying possible models for . A straightforward model would be based on taking the weighted average of the spectral emissivity over the full sensitivity band of the bolometer, which is referred to as (as shown by the dashed horizontal line in Figure 3). Using the data from [13,37,38] and taking the specified response curve of the bolometer, , as the weighting function, results in = 0.3053. However, this value does not take advantage of the fact that the bolometer is fully calibrated for a blackbody emitter by the manufacturer, so it would be more appropriate to use the calibrated weighted average over the full band: = 0.6290. In an alternative approximation the complexity of the system response is disregarded, and the transfer function is assumed a simple band-pass with peak value and half-power wavelengths. The bandwidth in such an optical filter is defined as the full-width half magnitude (FWHM) and results in = 0.5706 for the filter weighted emissivity within the FWHM band and = 0.6860 when considering the calibration. One can also take a simple wholistic view and ignore the system bandwidth and take the wideband average as = 0.7477 (see the different options as dashed lines in Figure 3).
These are basically a number parameters without a direct physical meaning and are appropriate only within the framework the objective addressed in this paper, which is the selection of the most suitable value of for use as bolometer setting when the instrument is used for the electro-thermal characterization of heated membranes in SiC, such as membrane temperature distribution as a function of heater geometry or electrical heating power. These are also used as reference lines in the analysis presented in Section 4 and the experimental validation in Section 5.
4. Analyzing by Deduction
The spectral radiance as emitted by a blackbody emitter at a given source temperature is shown by the dashed curves in Figure 4a. Subsequently, the effect of is included as a spectral weighting function and the result is shown in the solid curve. The figure clearly shows that the bandwidth limitation of the bolometer does result in the omission of essential information. The Wien peak is out of the bolometer band for 200 °C, but the curves remain unambiguous and can be used for non-contact temperature measurement up to 800 °C.
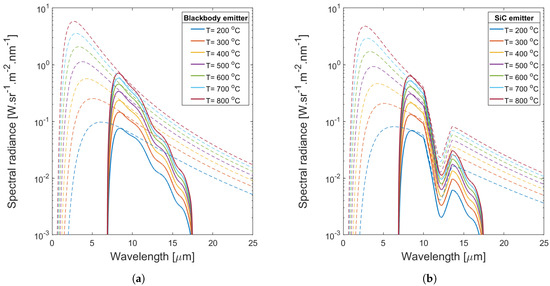
Figure 4.
Calculated spectral radiance for a source temperature in the range 200 °C to 800 °C, as incident on the bolometer (dashed line) and as measured at the detector array of the imaging bolometer (solid line) for (a) a blackbody emitter and (b) a SiC emitter.
Similarly, the spectral radiance curves for SiC are shown in Figure 4b. Although monotonicity over the temperature range is maintained, the curves are clearly more compressed in the 11–12 μm spectral range. The spectral radiance curves from a blackbody reference emitter are basically used for bolometer calibration.
In the temperature range 0–80 °C, the Wien peaks are within the bolometer system, as is shown in Figure 5. The temperature-dependent spectral radiance curves are more clearly separated as compared to those at high temperatures, but the Wien peak is at a much lower spectral radiance level.
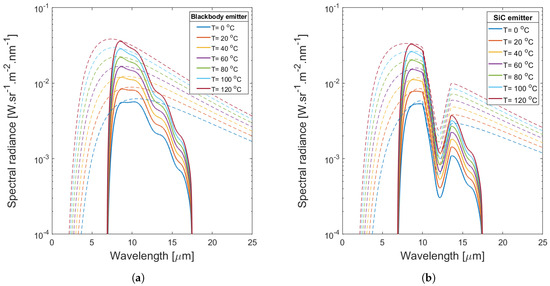
Figure 5.
Calculated spectral radiance for a source temperature in the range 0 °C to 120 °C, as incident on the bolometer (dashed line) and as measured at the detector array of the imaging bolometer (solid line) for (a) a blackbody emitter and (b) a SiC emitter.
Integration of the spectral radiance at a particular source temperature over the wavelength range 0.5 μm to 25 μm, with a spectral weighting as defined by the system transfer function, results in the radiance as measured at the detector array of the imaging bolometer. The result over a range of temperatures is shown in Figure 6a in comparison to a number of plausible values of the equivalent emissivity. The results confirm our starting hypothesis that the near-IR emissivity of = 0.82 cannot be used. The SiC spectral radiance over a wide range of temperatures appears close to that of a graybody emitter with = 0.748, which would suggest the wideband weighed value of the equivalent emissivity to be the most appropriate. However, the calibrated average over the FWHM band, = 0.686, seems like a closer fit for temperatures lower than 200 °C.
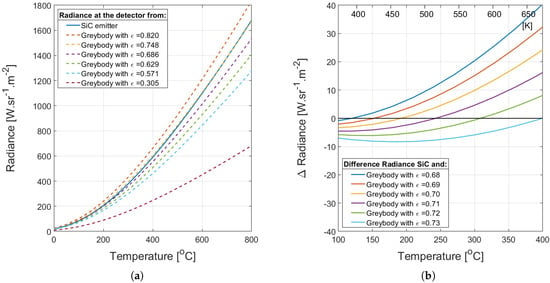
Figure 6.
Calculated: (a) radiance as a function of source temperature in the range 0 °C to 800 °C for several suggested options of , and (b) differential radiance, = as a function of source temperature in the range 100 °C to 400 °C for in the range 0.68 to 0.73.
The perfect match is at the temperature for which the radiance of the SiC and the blackbody emitter are equal, which suggest a temperature dependence. Figure 6b shows the differential radiance (i.e., the difference between the calculated at the actual and the radiance at different values of ) as a function of temperature. The figure indicates an optimum at = 0.68 for 120 °C, which increases to an optimum = 0.73 at 400 °C. The apparent temperature coefficient of emissivity, 2×10⁻⁴ °C−1 is only a result of the simulation results and suggest a significance of the Wien peak moving out of the spectral sensitivity range of the instrument at higher emitter temperatures. It should be emphasized that this temperature dependence is a derived instrument property and does not imply a specific temperature dependent physical effect of the material.
The calculated and especially its apparent temperature-dependence is experimentally tested, with the results presented and discussed in Section 5.
5. Experimental Validation of
The structure of the SiC membrane with integrated poly-SiC heaters on a Si-substrate is shown schematically in Figure 7. The membrane is composed of an optically transparent intrinsically doped poly-SiC membrane (N cm−3) with a diameter ranging from 100 m up to 2000 m. N-doped poly-SiC heaters (N cm−3) are fabricated on top of the membrane [25]. Device fabrication starts with a silicon prime wafer and growth of 2 m of SiO2 by thermal oxidation. This layer is intended as an etch-stop during the through-wafer etching of the backside cavity etching. Subsequently, two differently doped poly-SiC layers are deposited by LPCVD. The lower layer is an intrinsic SiC film and used as the membrane, and an upper SiC layer, which is highly n-doped by adding nitrogen during deposition and patterned as an open ring-shape for use as a poly-SiC resistor. The sheet resistance of the deposited films was measured, using a Keithley Source Measure Unit (SMU type 2420) in a four-point Kelvin arrangement, as = 440 cm for the intrinsic SiC and cm for the highly doped SiC layer.
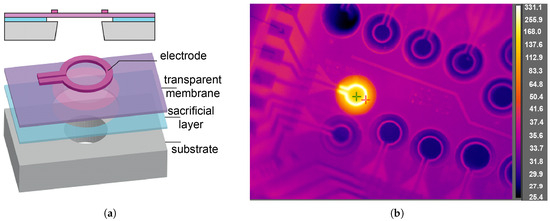
Figure 7.
(a) Structure of the membrane with circularly shaped poly-SiC resistors that are used as both temperature sensor and on-membrane heater, and (b) FLIR photograph of the realized device with heating power applied to one of the test structures and measured temperature shown in °C.
In the intended application, each membrane is heated by the poly-SiC resistor within its area and used for regenerating its optical transparency, but in this work the poly-SiC resistors are initially calibrated for enabling their use as on-membrane resistive temperature sensors. In our experiment the resistors are used in two subsequent measurements: first for their temperature calibration and secondly for thermal characterization of the bolometer.
Chips (also referred to as ‘dies’), as in Figure 7b, are cut out of the wafer at selected positions, chip-bonded, and mounted on a printed-circuit board (pcb) for electrical connection to external readout. These are used for calibration of the poly-SiC resistors and measuring their variation of resistivity over the wafer area. In the calibration, the pcb is mounted in the oven using clamps, as shown in Figure 8a.
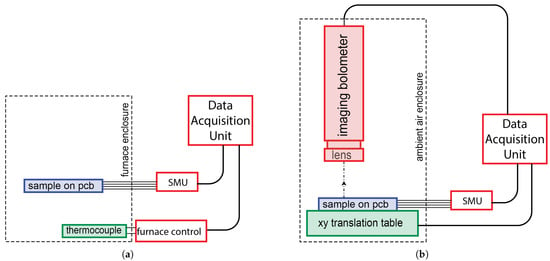
Figure 8.
Schematic diagrams of the 2-stage measurement set-up: (a) the furnace calibration using the on-membrane poly-SiC resistor and (b) the non-contact membrane temperature measurement using the imaging bolometer.
The same pcb is mounted on an xy-translation table in the subsequent bolometer measurement for lateral positioning of the selected sample relative to the opening angle of the bolometer. The bolometer is in a vertically adjustable clamp for varying the sample-detector spacing during the measurement, as shown in Figure 8b.
It should be noted that the set-up is simple, with both measurements on clamped devices performed in ambient air, which is well-controlled in terms of temperature and humidity, but does not provide the thermal isolation as a setup in vacuum. Therefore, thermal loss mechanisms, such as thermal conduction along the suspension used and convection, are present. Measurements are performed in an enclosed compartment and turbulence is avoided. Therefore, the effect of convection can be considered time-invariant and the measurement repeatable.
Samples are subjected to a furnace run in a temperature-controlled oven (Lindberg/Blue M tube TF55035A furnace with an Omega K-type thermocouple). The 4-point DC-impedance measurement (SMU, Keithley 2420) of several poly-SiC resistors was compared with the thermocouple-based reading of the furnace temperature for a series of 15 temperature levels, each with sufficient settling time applied for a stable reading.
The result is shown for T = as the series of blue open bullet points in Figure 9, with also the best-fitting 2nd -order polynomials listed. The regular specification of a temperature-dependent resistance = [1 + (higher-order non-linearity terms are disregarded) is in terms of the nominal resistance = 0 °C) = , temperature coefficient of resistivity TCR = = ()/ and quadratic term = . While these can be derived by extrapolation as = 4775 and = −1.24 × 10⁻³ K−1, the more pragmatic ad-hoc specification used here takes the operating range of this experiment into account and results in a nominal resistance at = 500 K as = 3766 and a temperature coefficient of resistivity at , TCR = = = −0.794 × 10⁻³ K−1. The quadratic nonlinearity term in the temperature sensitivity at 500 K, = 34 × 10−7 K−2. The average of the measurements over different heaters of the same geometry was taken and the uncertainty due to non-uniformity over the wafer surface was estimated as ±2% from the nominal value. Within this level of uncertainty, we have not observed a hysteresis between the measurements taken during the (active) heating part of the measurement cycle and those during (passive) cooling.
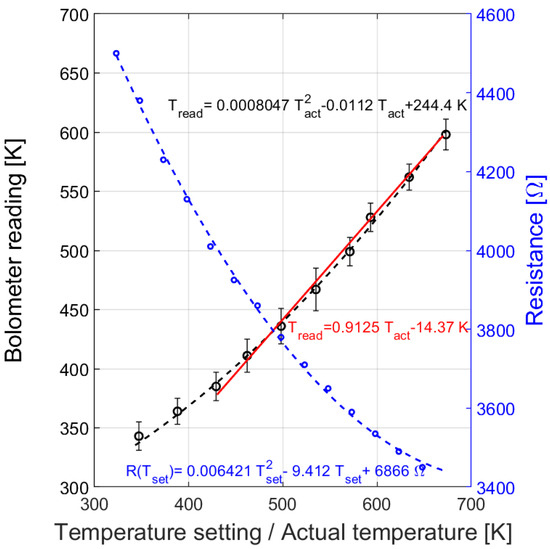
Figure 9.
Measurements on the heatable membrane with the blue open bullet points indicating the poly-SiC resistance as a function of furnace setting in a calibration run, while the quadratic approximation is shown as the dashed curve. In addition, the black open bullet points with error bar indicate the bolometer reading as a function of the temperature as measured on-membrane using the poly-SiC resistor, while the quadratic approximation is shown as the dashed curve and the linear approximation as the red curve.
In subsequent measurements, the SiC resistor was used as a heater (with the SMU set for controlled voltage drive) and as a membrane temperature sensor. The resistance measurements are correlated with infrared camera readings. The FLIR a325sc imaging bolometer was used (with emissivity setting at default value of 0.95) in combination with a close-up lens of type T197415 (focal length f = 18.2 mm, which results in a spatial resolution of 25 m at a 20 mm working distance) [6]. The result is shown as the series of open bullet points in Figure 9. The reading of the camera data is affected by the precision of the lateral positioning of the probing point (as indicated by the red and green crosses in Figure 7b) on the heater. The xy-translating table is used under manual control for coarse positioning of the sample relative to the FLIR. Subsequently, the FLIR software allows the user to select the point of interest using a box enclosing a single-pixel or a multi-pixel array. We used the single-pixel box option, as can be seen in the image in Figure 7b. The lateral variation of the temperature profile over the ring cannot be disregarded. Positioning is based on the visual feedback from the bolometer and a minor misplacement does already result in an error. Repeated measurements indicate a non-repeatability in the bolometer reading at subsequent placements of about ±10 K, which is included in Figure 9 by error bars.
The best-fitting linear curve is the red line shown in the figure, which suggest a reasonably linear relation in the temperature range from 423 K to 673 K (about 150 °C to 400 °C), with = 0.9125. The instrument reading is derived from the measured radiance using the absorbed power, (as expressed in Equation (1)), within the instrument spectral band. is proportional to the value for / and can easily be converted to by calculation. However, this absorbed power results from the actual emissivity and is proportional to . Consequently, the instrument setting at = 0.95 results in = = 0.91254 × 0.95= 0.6587. Note that the 4-digit resolution (of the fraction) only applies to the calculation and rounding to a 2-digit number is appropriate when considering the uncertainties, resulting in = 0.66.
The uncertainties of this relatively simple experiment are considerable. The membrane temperature is measured during the furnace calibration using the on-membrane poly-SiC resistors. The uncertainty of the furnace calibration is dominated by the limited reproducibility of poly-SiC measurement over the wafer surface as compared to the accuracy of the furnace setting and is estimated as = 2%. The uncertainty of the bolometer temperature measurement is affected by the lateral variation of the temperature at the heater in combination with the positioning of the software probing pointer, which amounts to = 10 K. The worst-case relative error within the temperature range considered is: / = 2.3%. These uncertainties are not correlated, thus resulting in an uncertainty in the estimate for the relative equivalent emissivity:
Therefore, this measurement results in: = 0.66 ± 0.06. The offset in the linear fit for / results as = −14.37 K (red line in Figure 8), which was not taken into consideration in the estimation of . The uncertainty of the experiment results from
= 16.8 K, which implies that = 14.73, although large, remains within the range of uncertainties. A linear fit of the curve for / for only the lower temperature range 350 K to 450 K in Figure 9 would result in a line with a smaller angle of inclination, which confirms the apparent temperature dependence of already discussed in Section 4.
6. Discussion and Conclusions
The focus of this study is on the a specific anomaly in non-contact temperature measurement on a SiC structure of miniature dimensions using a commercially available imaging bolometer, and not on the SiC material properties or on the internal calibration of such an instrument in general. The issue at hand is the optimal setting of the equivalent emissivity, , of such a bolometer for temperature profile measurements of a SiC surface. This measurement is complicated by the significant wavelength-dependence of the spectral emissivity of that material within the spectral sensitivity range of the instrument. The main purpose is to demonstrate that a value significantly smaller than = 0.82, which is applicable in the near- to mid-IR spectral range, is more suitable. Two approaches are presented for substantiating our argument that a lower value is a more appropriate estimate for .
The first is based on deduction from theoretical considerations and the resulting estimated equivalent emissivity presented in Section 2 is = 0.705 ± 0.025 in the temperature range 120 °C to 400 °C. For T< 100 °C even smaller values would be more appropriate.
The second is based on experimental validation and results in = 0.66 ± 0.06 in the same temperature range 150–400 °C. The experimental set-up is relatively simple and a considerable uncertainty is introduced. However, the measured trend is clear and is in reasonable agreement with the prediction based on theoretical considerations. Therefore, it can be concluded that
- The variations of () within the sensitivity band of the bolometer do affect the optimum instrument setting for the non-contact temperature measurement on a SiC sample.
- The Wien shift of the peak in the spectral radiance to shorter wavelengths with increasing emitter temperature, and thus out of the sensitivity band of the bolometer for 80 °C, does result in a apparent temperature dependence of the optimum instrument setting for emissivity, which is expressed in terms of an apparent temperature coefficient of emissivity, 2 × 10⁻⁴ °C−1.
This work does not suggest that the SiC emissivity as a material property, , would be temperature dependent, but rather that the wavelength-dependence of the emissivity, (), results in a temperature dependence of the optimum equivalent emissivity setting of the instrument, (T). The temperature-dependent Wien shift of the peak in the spectral radiation out of the sensitivity band with increasing temperature results in an increased loss of information. This effect is expressed here as an apparent temperature dependence of and is used only as a means for refining the characterization of the effect of the wavelength dependence of . The conclusions drawn are applicable within the framework of the instrument only and have no bearing on the suitability of SiC as a sensor material. For instance, the emissivity of a heated membrane in the mid-IR part is not affected, (4–5 m)= 0.82 (Figure 3). Thus the advantages of SiC for use as light source in an NDIR for measuring CO or CO2 gas remain undisputed.
We consider the results of the experimental validation slightly less convincing as compared to the deduction made on the basis of theoretical considerations for three reasons:
- The measurements are performed in air and not in vacuum. Although the combined calibration–bolometer characterization in a sequence of two measurements is in principle a ratiometric measurement in which this effect, if time-invariant, is in a first approximation canceled out, a residual dependency cannot be ruled out. We have taken measures to ensure a repeatable measurement.
- The sample is suspended using clamps during measurement; therefore, there is heat flow due to thermal conduction. However, this effect is also in first approximation canceled out in the ratiometric measurement.
- The effect of material properties, such as the SiC layer doping concentration, its vertical profile, and surface roughness, are not considered in this study. The typical spatial wavelength of the surface roughness is significantly smaller than the IR wavelength range considered and the amount of scattering is small. In this work the emitting layer is of a sufficiently high doping concentration and thickness to ensure compliance with Kirchhoff’s law of thermal radiation.
Nonetheless, the results of the two approaches are in reasonable agreement and the estimates obtained are highly overlapping. After combining the theoretical range with the results from experimental validation, we confidently set our recommended value of the optimal setting at = 0.70 for characterization of SiC-heated membranes at temperatures in the range between 150 °C and 450 °C. The reason for restricting this study to this range is partly pragmatic (the wire insulation cannot withstand higher temperatures). In principle, an improved wire contacting configuration could overcome this limitation. More importantly, the objective of this study is to analyze the emissivity of SiC in the range of operating temperatures of membranes used for temperature-modulated thin-film chemical sensing or as IR light source. Therefore, we have not attempted such a modification of the set-up.
There is a somewhat ironic aspect to the established optimum setting at = 0.70. If a temperature measurement on a SiC membrane is run with a bolometer that has been routinely used for silicon membranes with a setting = 0.70 while the operator is unaware of the entire issue of emissivity setting, and this setting is not modified, correct results are obtained. However, if the same experiment is run by a somewhat better skilled operator, and this setting is changed to = = 0.82, incorrect results are obtained. Our taking a closer look during initial work on a SiC membrane for exhaust gas monitoring, because of a somewhat implausible aspect suggested by the data obtained at default instrument setting, can perhaps be regarded as a case of serendipity.
Our ongoing work is on investigating the effect of doping concentration of poly-SiC on the emissivity, rather than on improving the measurement set-up. The focus of this study has been on SiC and the complications in bolometer-based temperature measurement that results from its strong wavelength dependence. Although such an effect could be an issue in the thermal characterization of other polar materials, these have not been considered.
We would like to emphasize that this is not a materials study on SiC, or a study on the fundamental physics of its emissivity, but rather an empirical study on the practical non-contact temperature measurement on a structure in SiC of miniature dimensions using a commercially available imaging bolometer. We hope that our findings on optimum instrument settings will help researchers to acquire improved results on material parameters in their future experimentation.
Author Contributions
All authors have equally contributed to the analysis and interpretation of results. Conceptualization, R.W.; methodology, R.W. and D.B.; software, R.W.; validation, D.B. and J.V.; formal analysis, R.W., D.B. and J.V.; investigation, R.W., D.B. and J.V.; resources, J.V.; data curation, D.B.; writing—original draft preparation, R.W.; writing—review and editing, R.W., D.B. and J.V.; funding acquisition, J.V. All authors have read and agreed to the published version of the manuscript.
Funding
Financial support for this project was provided in part by a Ford University Research Project grant (URP project number 721).
Data Availability Statement
Data can be obtained on request by contacting the corresponding author.
Acknowledgments
The authors would like to acknowledge microfabrication by Luke Middelburg at the EKL cleanroom of Delft University of Technology, the Netherlands, and by Amir Ghaderi at the MC2 Institute of Chalmers, University in Sweden. Optical characterization was carried out at the Ford Center for Research and Advanced Engineering, USA.
Conflicts of Interest
The authors declare no conflicts of interest. Ford Motor Company had no role in the design of this study; in the collection, analyses, or interpretation of data; in the writing of the manuscript; or in the decision to publish the results.
Abbreviations
The following abbreviations are used in this manuscript:
| SiC | Silicon-Carbide |
| MEMS | Micro Electro Mechanical System |
| TCE | Temperature Coefficient of Emissivity |
| LED | Light Emitting Diode |
| FOV | Field of View |
| IFOV | Instantaneous Field of View |
| FWHM | Full Width Half Magnitude |
| SMU | Source Measure Unit |
| pcb | printed circuit board |
| LPCVD | Low-Pressure Chemical Vapor Deposition |
| TCR | Temperature Coefficient of Resistivity |
References
- Michalski, L.; Eckersdorf, K.; McGee, J. Temperature Measurement; Wiley: Hoboken, NJ, USA, 1991. [Google Scholar]
- Richards, P.L. Bolometers for infrared and millimeter waves. J. Appl. Phys. 1994, 76, 1–24. [Google Scholar] [CrossRef]
- Afridi, M.; Beming, D.; Hefner, A.; Suehle, J.; Zaghloul, M.; Kelley, A.; Parrilla, Z.; Ellenwood, C. Transient heating study of microhotplates by using a high-speed thermal imaging system. In Proceedings of the IEEE 18th SEMI-THERM Symposium, San Jose, CA, USA, 12–14 March 2002; pp. 92–98. [Google Scholar]
- Peterson, B.J. Infrared imaging video bolometer. Rev. Sci. Instrum. 2000, 71, 3696–3701. [Google Scholar] [CrossRef]
- Grujić, K. A Review of thermal spectral imaging methods for monitoring high-temperature molten material streams. Sensors 2023, 23, 1130. [Google Scholar] [CrossRef] [PubMed]
- The Ultimate Infrared Handbook for R&D Professionals. Available online: https://www.flir.eu/discover/rd-science/the-ultimate-infrared-handbook-for-rnd-professionals/ (accessed on 10 June 2024).
- Meijer, G.; van Herwaarden, A. Thermal Sensors; IOP Publishing: Bristol, UK, 1994. [Google Scholar]
- Saunders, P.; Fischer, J.; Sadli, M.; Battuello, M.; Park, C.; Yuan, Z.; Yoon, H.; Li, W.; Van Der Ham, A.; Sakuma, F.; et al. Uncertainty budgets for calibration of radiation thermometers below the silver point. Int. J. Thermophys. 2008, 29, 1066–1083. [Google Scholar] [CrossRef]
- Budzier, H.; Gerlach, G. Calibration of uncooled thermal infrared cameras. J. Sens. Sens. Syst. 2015, 4, 187–197. [Google Scholar] [CrossRef]
- Musto, M.; Rotondo, G.; De Cesare, M.; Vecchio, A.D.; Savino, L.; De Filippis, F. Error analysis on measurement temperature by means dual-color thermography technique. Measurement 2016, 90, 265–277. [Google Scholar] [CrossRef]
- Martinez, I.; Otamendi, U.; Olaizola, I.G.; Solsona, R.; Maiza, M.; Viles, E.; Fernandez, A.; Arzua, I. A novel method for error analysis in radiation thermometry with application to industrial furnaces. Measurement 2022, 190, 110646. [Google Scholar] [CrossRef]
- Stewart, J.E.; Richmond, J.C. Infrared Emission Spectrum of silicon carbide heating elements. J. Res. Natl. Bur. Stand. 1957, 59, 405–409. [Google Scholar] [CrossRef]
- Cagran, C.P.; Hanssen, L.M.; Noorma, M.; Gura, A.V.; Mekhontsev, S.N. Temperature-resolved infrared spectral emissivity of SiC and Pt–10Rh for temperatures up to 900 °C. Int. J. Thermophys. 2007, 28, 581–597. [Google Scholar] [CrossRef]
- van Oudheusden, B.W.; Huijsing, J.H. Integrated silicon flow-direction sensor. Sens. Actuators 1989, 16, 109–119. [Google Scholar] [CrossRef]
- de Graaf, G.; Abarca Prouza, A.; Ghaderi, M.A.; Wolffenbuttel, R.F. Micro thermal conductivity detector with flow compensation using a dual-MEMS device. Sens. Actuators A Phys. 2016, 249, 186–198. [Google Scholar] [CrossRef]
- Briand, D.; Krauss, A.; Van der Schoot, B.; Weimar, U.; Barsan, N.; Göpel, W.; De Rooij, N.F. Design and fabrication of high-temperature micro-hotplates for drop-coated gas sensors. Sens. Actuators B Chem. 2000, 68, 223–233. [Google Scholar] [CrossRef]
- Martinelli, E.; Polese, D.; Catini, A.; D’Amico, A.; Di Natale, C. Self-adapted temperature modulation in metal-oxide semiconductor gas sensors. Sens. Actuators B Chem. 2012, 161, 534–541. [Google Scholar] [CrossRef]
- Illyaskutty, N.; Knoblauch, J.; Schwotzer, M.; Kohler, H. Thermally modulated multi sensor arrays of SnO2/additive/electrode combinations for enhanced gas identification. Sens. Actuators B Chem. 2015, 217, 2–12. [Google Scholar] [CrossRef]
- Hildenbrand, J.; Korvink, J.; Wöllenstein, J.; Peter, C.; Kürzinger, A.; Naumann, F.; Elbert, M.; Lamprecht, F. Micromachined mid-infrared emitter for fast transient temperature operation for optical gas sensing systems. IEEE Sens. J. 2010, 10, 353–362. [Google Scholar] [CrossRef]
- Liao, J.H.; Chen, C.J.; Yu, C.J.; Wu, M.C. MEMS-based planar incandescent microfilaments with low voltage operation. IEEE J. Electron. Devices Soc. 2020, 8, 640–643. [Google Scholar] [CrossRef]
- Lochbaum, A.; Fedoryshyn, Y.; Dorodnyy, A.; Koch, U.; Hafner, C.; Leuthold, J. On-Chip narrowband thermal emitter for mid-IR optical gas sensing. ACS Photonics 2017, 4, 1371–1380. [Google Scholar] [CrossRef]
- Kimoto, T.; Cooper, J.A. Fundamentals of Silicon Carbide Technology: Growth, Characterization, Devices and Applications; Wiley: Hoboken, NJ, USA, 2014. [Google Scholar]
- Wijesundara, M.; Azevedo, R. Silicon Carbide Microsystems for Harsh Environments; Springer: New York, NY, USA, 2011. [Google Scholar]
- Wright, N.G.; Horsfall, A.B. SiC sensors: A review. J. Phys. D Appl. Phys. 2007, 40, 6345. [Google Scholar] [CrossRef]
- Middelburg, L.M.; Ghaderi, M.A.; Bilby, D.; Visser, J.H.; Zhang, G.Q.; Lundgren, P.; Enoksson, P.; Wolffenbuttel, R.F. Maintaining transparency of a heated MEMS membrane for enabling long-term optical measurements on soot-containing exhaust gas. Sensors 2020, 20, 3. [Google Scholar] [CrossRef]
- Liu, H.; Zhang, X.; Xu, N.; Han, C.; Wu, N.; Wang, B.; Wang, Y. Progress of one-dimensional SiC Nanomaterials: Design, fabrication and sensing applications. Nanomaterials 2024, 14, 187. [Google Scholar] [CrossRef]
- Sun, K.; Wang, T.; Gong, W.; Lu, W.; He, X.; Eddings, E.G.; Fan, M. Synthesis and potential applications of silicon carbide nanomaterials. Nanocomposites Ceram. Int. 2022, 48, 32571–32587. [Google Scholar] [CrossRef]
- Sato, K. Spectral emissivity of silicon. Jpn. J. Appl. Phys. 1967, 6, 339–347. [Google Scholar] [CrossRef]
- Ravindra, N.M.; Abedrabbo, S.; Chen, W.; Tong, F.M.; Nanda, A.K.; Speranza, A.C. Temperature-dependent emissivity of silicon-related materials and structures. IEEE Trans. Semicond. Manuf. 1998, 11, 30–39. [Google Scholar] [CrossRef]
- Ravindra, N.M.; Sopori, B.; Gokce, O.H.; Cheng, S.X.; Shenoy, A.; Jin, L.; Abedrabbo, S.; Chen, W.; Zhang, Y. Emissivity measurements and modeling of silicon-related materials: An overview. Int. J. Thermophys. 2001, 22, 1593–1611. [Google Scholar] [CrossRef]
- Lehman, J.; Theocharous, E.; Eppeldauer, G.; Pannell, C. Gold-black coatings for freestanding pyroelectric detectors. Meas. Sci. Technol. 2003, 14, 916. [Google Scholar] [CrossRef]
- Kats, M.A.; Capasso, F. Optical absorbers based on strong interference in ultra-thin films. Laser Photonics Rev. 2016, 10, 735–749. [Google Scholar] [CrossRef]
- Gheitaghya, A.M.; Ghaderi, M.A.; Vollebregt, S.; Ahmadi, M.; Wolffenbuttel, R.F.; Zhan, G.Q. Infrared absorbance of vertically aligned multi-walled CNT forest as a function of synthesis temperature and time. Mat. Res. Bull. 2020, 126, 110821. [Google Scholar] [CrossRef]
- Lee, Y.P.; Rhee, J.Y.; Yoo, Y.J.; Kim, K.W. Metamaterials for Perfect Absorption; Springer Series in Materials Science; Springer: Singapore, 2016; Volume 236. [Google Scholar]
- Li, A.; Singh, S.; Sievenpiper, D. Metasurfaces and their applications. Nanophotonics 2018, 7, 989–1011. [Google Scholar] [CrossRef]
- Ghaderi, M.A.; Shahmarvandi, E.K.; Wolffenbuttel, R.F. CMOS-compatible mid-IR metamaterial absorbers for out-of-band suppression in optical MEMS. Opt. Mater. Express 2018, 8, 1696–1707. [Google Scholar] [CrossRef]
- Rousseau, B.; Brun, J.F.; Meneses, D.; Echegut, P. Temperature measurement: Christiansen wavelength and blackbody reference. Int. J. Thermophys. 2005, 26, 1277–1286. [Google Scholar] [CrossRef]
- Guo, Y.M.; Pang, S.J.; Luo, Z.J.; Shuai, Y.; Tan, H.P.; Qi, H. Measurement of directional spectral emissivity at high temperatures. Int. J. Thermophys. 2019, 40, 10. [Google Scholar] [CrossRef]
Disclaimer/Publisher’s Note: The statements, opinions and data contained in all publications are solely those of the individual author(s) and contributor(s) and not of MDPI and/or the editor(s). MDPI and/or the editor(s) disclaim responsibility for any injury to people or property resulting from any ideas, methods, instructions or products referred to in the content. |
© 2025 by the authors. Licensee MDPI, Basel, Switzerland. This article is an open access article distributed under the terms and conditions of the Creative Commons Attribution (CC BY) license (https://creativecommons.org/licenses/by/4.0/).