Article

Revisiting an Indentation Method for Measuring Low Wear Rates Using 3D Interferometry

by
Gabriela R. Piazzetta
,
Thomas M. Zeller
,
Juan M. Hernandez-Otalvaro
and
Giuseppe Pintaude
*
Academic Department of Mechanics, Universidade Tecnológica Federal do Paraná, Curitiba 81280-340, PR, Brazil
*
Author to whom correspondence should be addressed.
Metrology 2025, 5(2), 35; https://doi.org/10.3390/metrology5020035
Submission received: 22 March 2025 / Revised: 14 May 2025 / Accepted: 6 June 2025 / Published: 8 June 2025
(This article belongs to the Special Issue Advances in Optical 3D Metrology)

Abstract

:
Predicting the wear of disc cutters in Tunnel Boring Machines (TBMs) is a complex challenge due to the large scale of the machinery and the numerous operational variables involved. Laboratory-scale tests offer a controlled approach to isolating and analyzing specific wear mechanisms. However, the extremely low wear rates observed in such simulations pose challenges for conventional characterization methods, as gravimetric and profilometric techniques often lack the precision and accuracy needed to measure low wear patterns with an uneven morphology. To address this, this study revisited a methodology for quantifying low wear rates in a reciprocating wear test using AISI H13 tool steel disc cutters. This approach integrates spherical indentation marks as reference points with 3D white-light interferometry, enabling high-precision material loss measurements. Eighteen disc samples were subjected to wear testing, with 3 indentations analyzed per sample, for a total of 54 indentations. The statistical validation confirmed the method’s reproducibility and reliability. The proposed approach provides a robust alternative to existing techniques, addressing a critical gap regarding the accurate quantification of low wear rates in controlled laboratory settings.

1. Introduction

The increasing demands of projects in urban environments have driven the widespread adoption of mechanized excavation using Tunnel Boring Machines (TBMs). The efficiency and cost-effectiveness of these operations rely heavily on the performance and durability of their cutting tools [1], which can represent up to 30% of the cost per excavated meter. Despite advancements in TBM technology, the unpredictable consumption of Tunnel Boring Machine (TBM) disc cutters remains a significant challenge, leading to cost overruns and delays in tunnel construction projects. Accurately predicting cutter wear is, therefore, crucial for optimizing excavation performance, minimizing maintenance downtime, and ensuring cost-effective operations.
Traditionally, disc cutter wear is evaluated through field-based measurements [2], full-scale testing [3,4], and laboratory-scale simulations [5,6]. Each of these approaches has inherent limitations. Although they can capture actual operational conditions, field-based methods often lack precision due to uncontrolled variables and operational constraints. Full-scale testing, although highly representative, is prohibitively expensive and time-consuming, making it impractical for widespread use. Consequently, laboratory-scale testing has emerged as a viable alternative, enabling researchers to isolate and control specific factors that influence wear mechanisms.
Despite its advantages, laboratory-scale testing for disc cutter wear determination presents certain challenges. TBM thrust forces typically reach the mega-Newton range, whereas laboratory equipment operates at a much lower force magnitude, often in the Newton range (i.e., six orders of magnitude lower). Additionally, the critical wear height observed under uniform wear conditions in the field translates to extremely low wear rates in laboratory setups.
Conventional methods, such as mass loss measurements [7,8] and profilometry [9], struggle to capture the minimal amounts of material removed in these tests [10]. Mass loss techniques are generally ineffective in low-wear conditions due to their limited sensitivity. Meanwhile, optical interferometry for “almost zero wear” (AZW) [11,12] determinations suffers from positioning errors that restrict its reliability. These limitations highlight the need for alternative measurement techniques to detect and quantify low wear rates with high accuracy and reproducibility.
This study addressed the challenge of quantifying low wear rates in laboratory simulations of TBM disc cutter wear. Our research framework combines two methodologies: the use of spherical indentation marks as reference points and 3D white-light interferometry for high-precision measurements. This approach aims to overcome the limitations of traditional wear determination techniques, which often rely on operator-dependent measurements and lack the sensitivity required for low-wear applications [13,14,15]. Through the integration of interferometry, we can reduce inaccuracies [16] and enhance the precision of the obtained measurements, offering a simplified and more reliable wear assessment process compared to conventional AZW techniques.
To validate the proposed methodology, we conducted a reciprocating wear test on AISI H13 tool steel disc cutter samples to create indentation marks, and the height before and after the wear experiment was measured. Statistical analyses, including ANOVA and paired t-tests, were performed to confirm the method’s reproducibility and reliability. The key findings demonstrate that this integrated approach provides a robust and statistically validated alternative to existing techniques, effectively addressing the critical gap in quantifying low wear rates in controlled laboratory settings.

2. Materials and Methods

2.1. Steel Characterization

The chemical composition of the disc cutter sample was determined through spark atomic emission spectrometry; the result is presented in Table 1. The disc cutter sample was prepared using standard metallographic procedures, which consisted of grinding and polishing, followed by etching with 3% nitric acid. The observed microstructure was a tempered martensite resulting from quenching and tempering (Figure 1).
Ten Vickers hardness measurements were conducted in an EMCO-TEST M4C G3 Universal Hardness Testing Machine (EMCO-TEST Prüfmaschinen GmbH, Kuchl, Österreich) with a 1 Kg load, resulting in an average value of 615 ± 4 HV.

2.2. Test Rig and Specimen Preparation

To develop a novel laboratory-scale wear test for Tunnel Boring Machine (TBM) disc cutters (AISI H13), we made several simplifications and methodological choices to replicate the real-scale problem while optimizing the practicality of the test. We acknowledge that the actual TBM working environment involves complex conditions, including high contact pressures, heterogeneous rock, and variable cutter velocities—factors that differ significantly from a controlled lab setting. To bridge this gap, we focused on replicating key aspects of the TBM process, such as the variable velocity profile. In real operations, the disc cutter starts with zero velocity, reaches a maximum speed during rock contact, and then decelerates back to zero [17]. To simulate this, we adopted a reciprocating test module, similar to that of Milan et al. [18], in order to replicate the variable velocity profiles in our lab-scale tests.
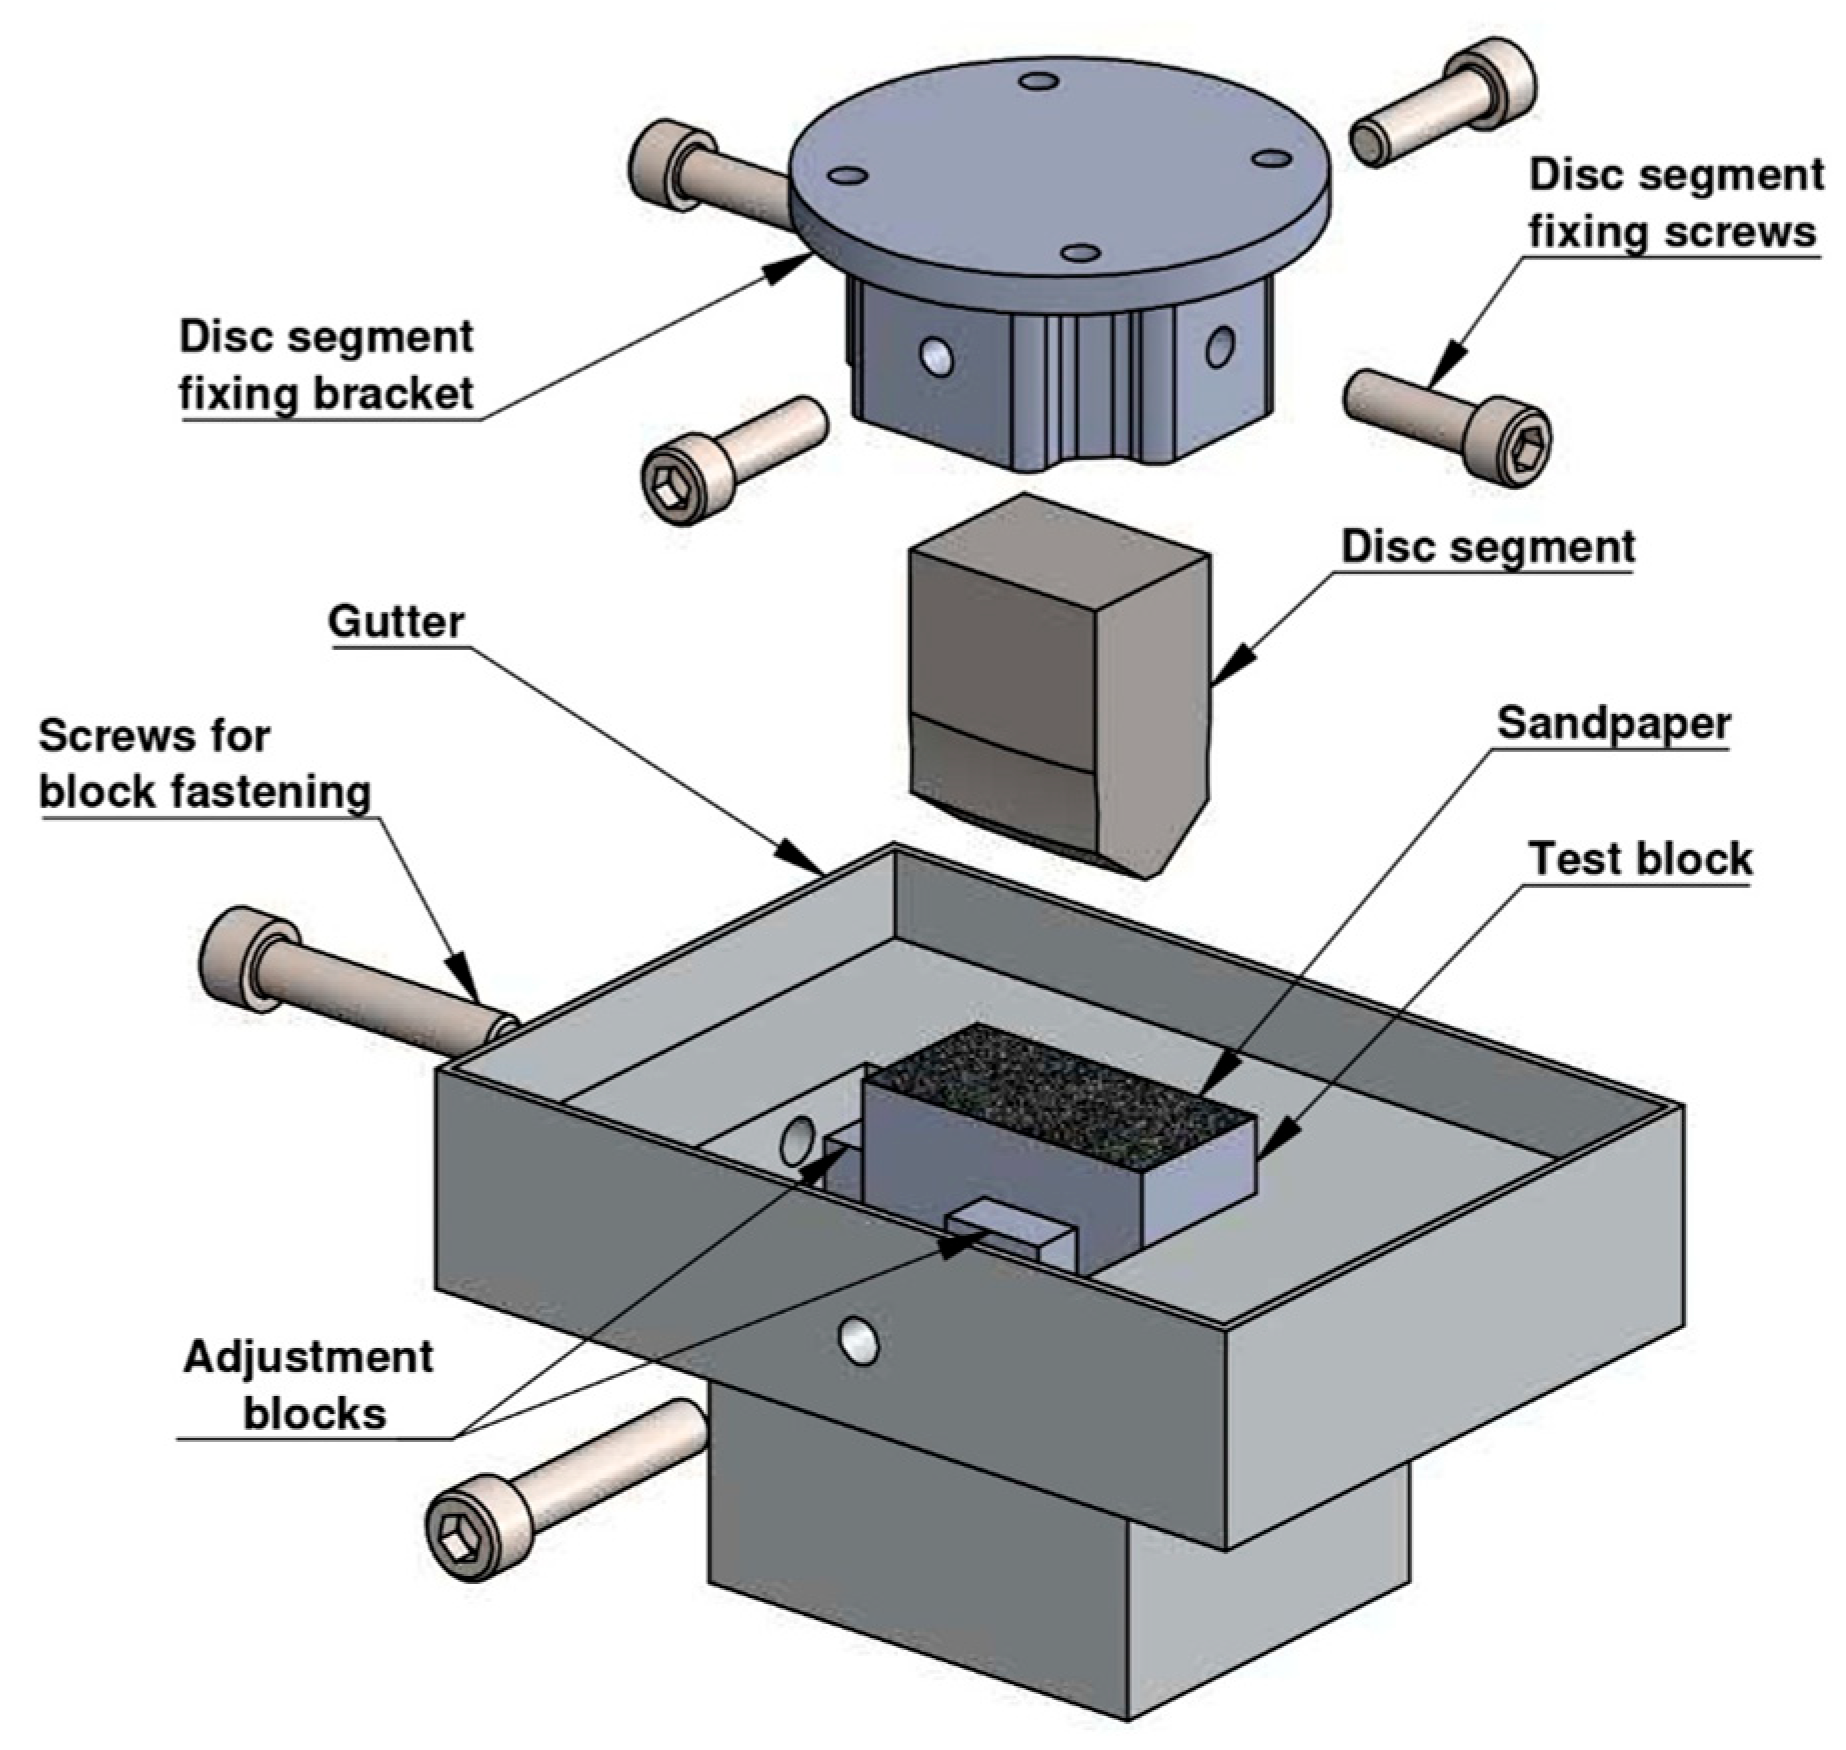
The test rig used was the UMT Universal tribometer in the reciprocating module. The setup included a fixing bracket for the disc sample, a test block with sandpaper, and a gutter (Figure 2). The upper part was fixed, and the lower part had a 10 mm track with reciprocating movements. The test was performed at a frequency of 3 Hz for 90 s. Water at an inflow rate of 3 mL/test was used as the lubricant.
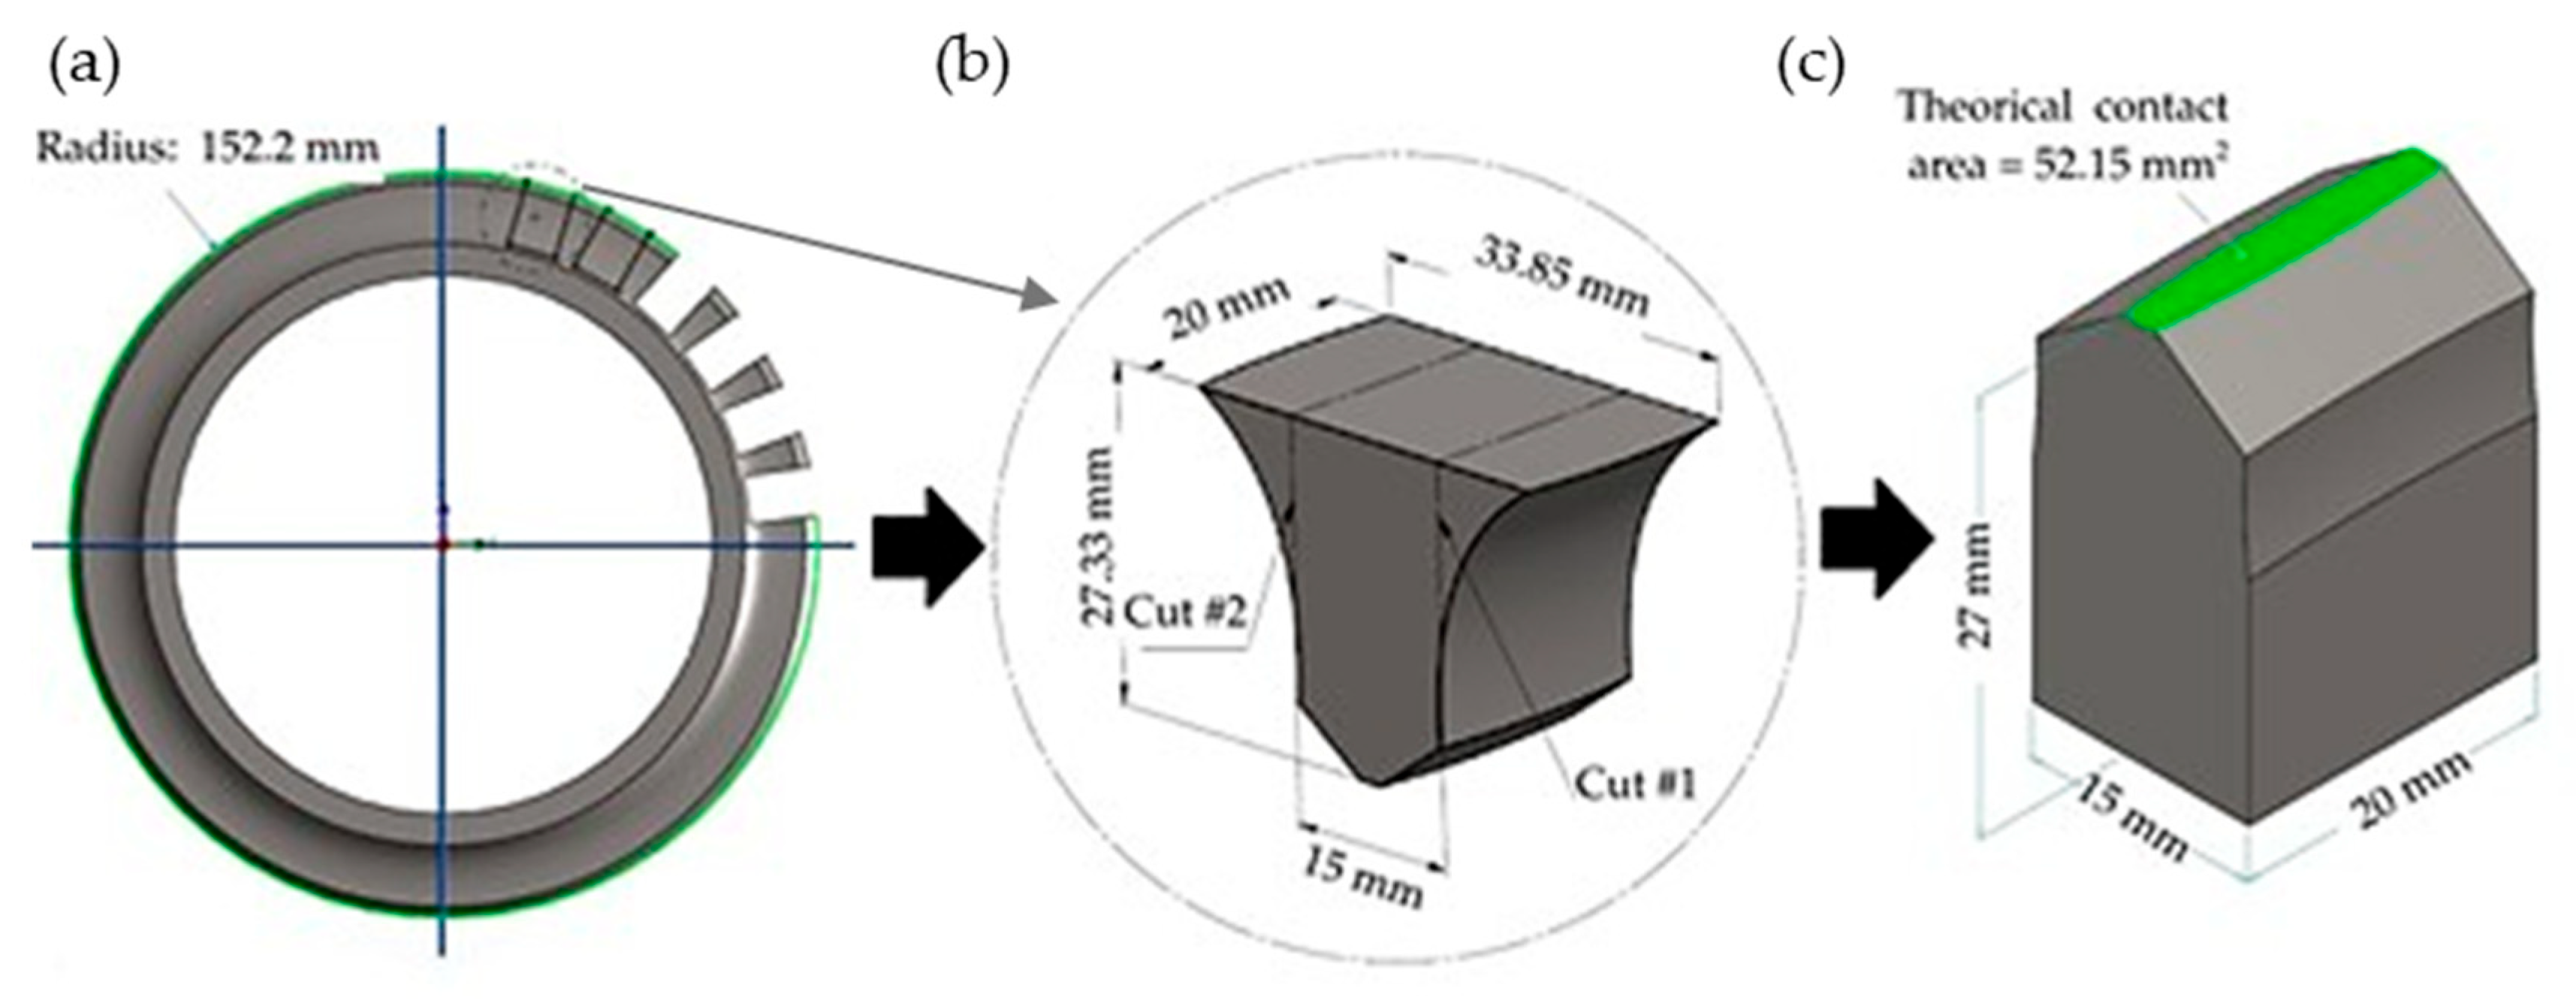
The disc samples were taken from a 15″ TBM disc cutter and reduced by electro-discharge machining to a length of 20 mm, a width of 15 mm, and a height of 27 mm (Figure 3). The wear test setup was utilized to prepare eighteen samples. First, the contact area of the disc samples was prepared by coarse sanding until a flat surface was obtained. Then, using the same test setup, all the samples were finely sanded with decreasing grit sizes, ranging from 220 to 600 mesh. The flatness of the contact area was verified to ensure complete contact between the disc and the sandpaper.
The final contact areas were measured using a light optical microscope, and five determinations were made using the ImageJ software 1.46r [19]. The applied force for the test was adjusted based on the mean area of contact to achieve 1.5 MPa of contact stress, resulting in an applied force variation between 75 and 96 N.
A key aspect of this study was the use of alumina sandpaper as the counterbody instead of a rock sample. In TBM operations, disc cutters experience complex interactions with heterogeneous rock formations. This heterogeneity introduces uncontrolled variability that complicates laboratory testing. A sandpaper counterbody allows for a controlled abrasive surface, ensuring consistent and repeatable wear measurements. Although this simplification reduces some of the complexity of real interactions between disc and rock samples, the use of alumina sandpaper [20] as the counterbody avoids the complexities associated with preparing rock samples, reduces the test time, and minimizes the variability introduced by the heterogeneity of rock materials, enabling the isolation of specific wear mechanisms and improving the methodological reliability. Future studies will extend this methodology to rock-based counterbodies in order to enhance its applicability in practical tunneling scenarios.
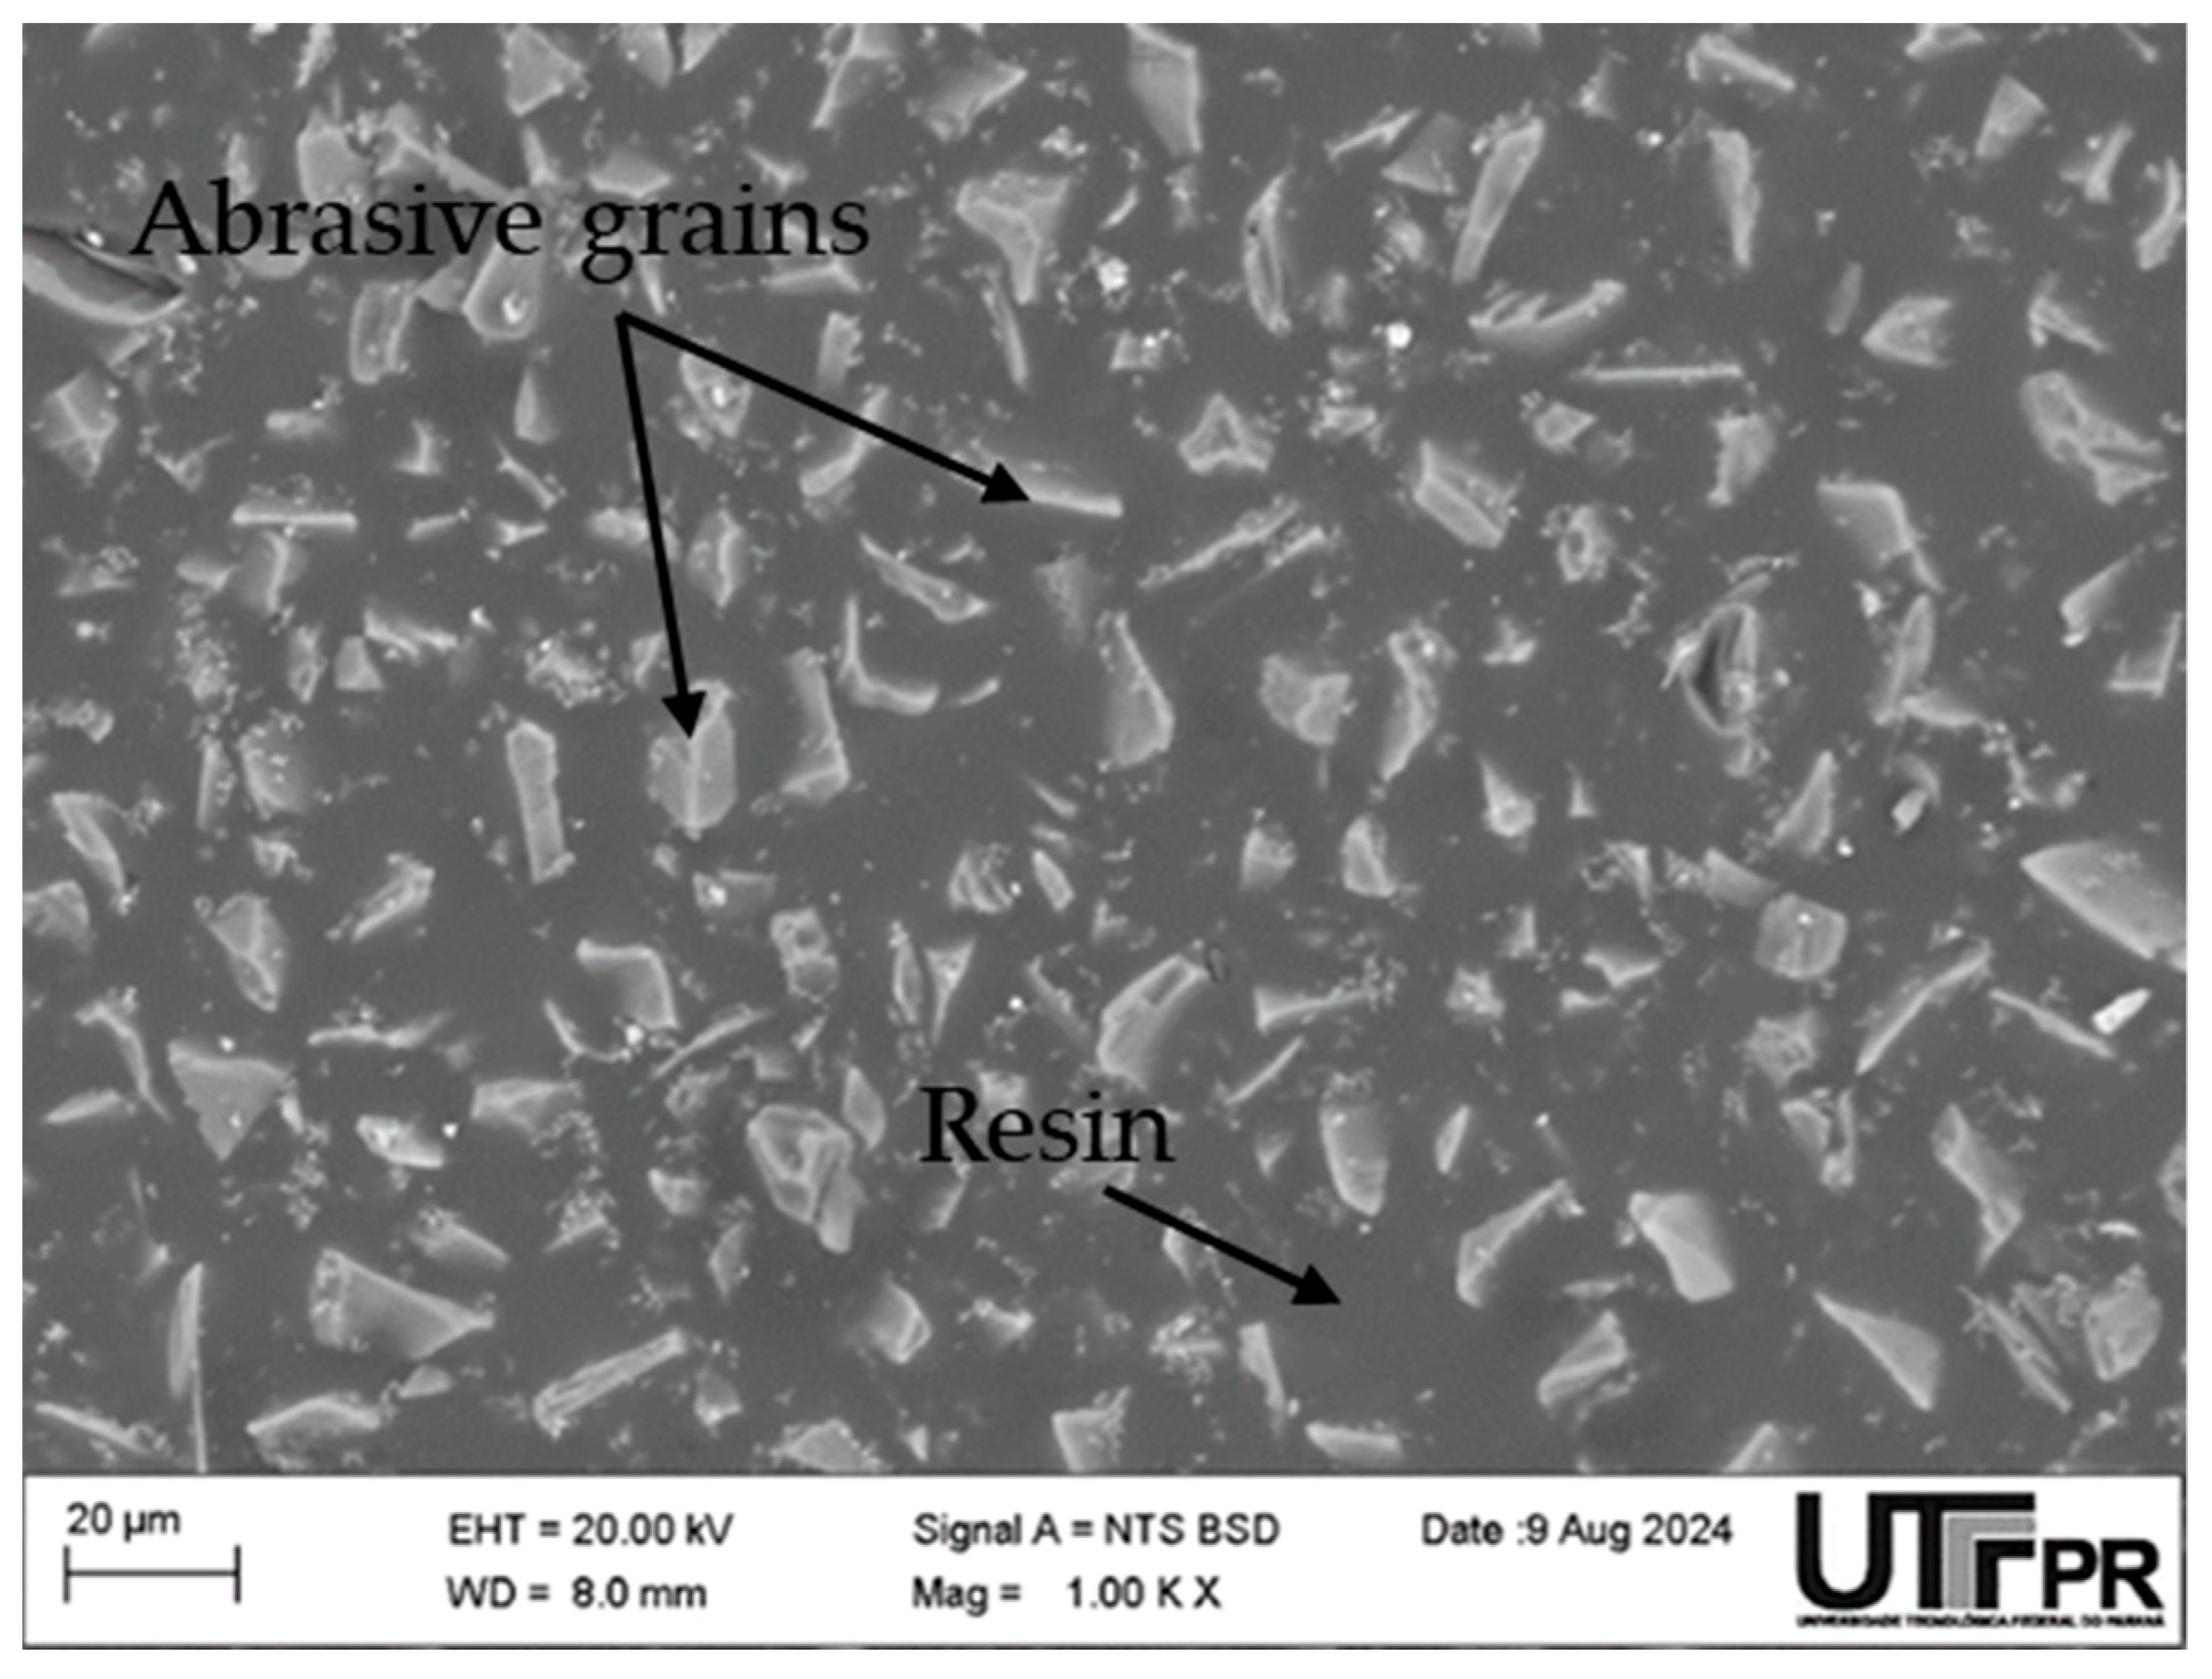
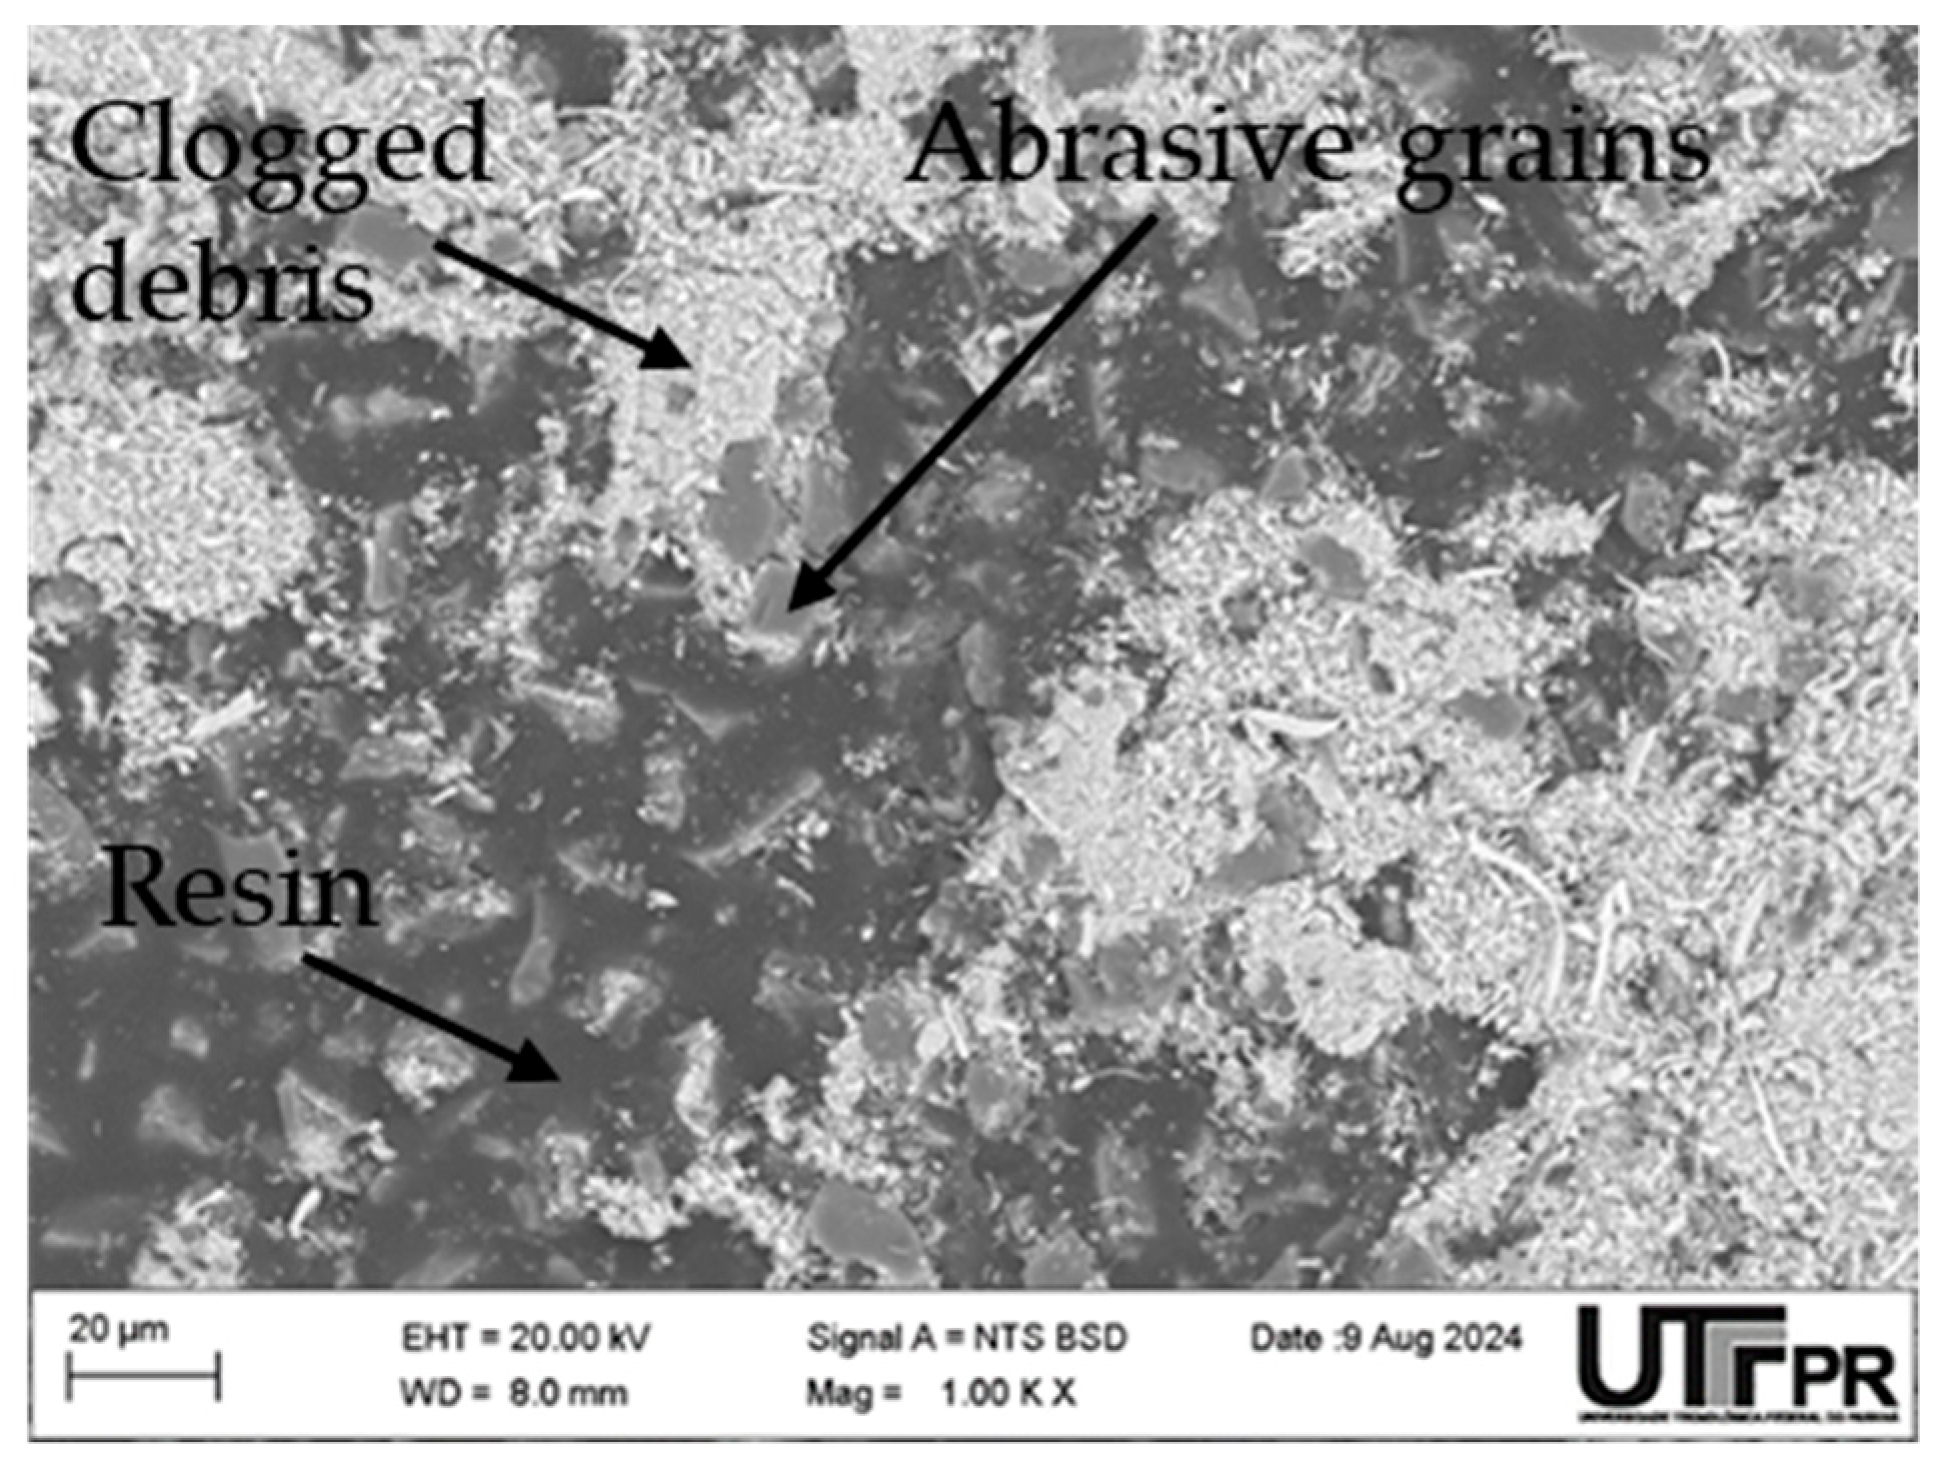
Abrasive grains, with diameters ranging from 15 to 30 μm, provided a consistent and uniform wear surface (Figure 4), enabling us to measure variations in indentation height. This setup allowed for the investigation of regular disc cutter wear while maintaining a controlled tribosystem.
Given the controlled nature of the setup, abrasive wear resulting from the direct interaction between the tool steel disc cutter and the alumina sandpaper was considered to be the primary mechanism at play. The observed changes in surface roughness likely stemmed from the formation of micro-grooves caused by the abrasive particles. Consequently, the reduction in indentation height reflects the overall material loss due to this abrasive action. It is important to note that the experimental design accelerated the wear to facilitate quantifiable measurements. As a result, it may not perfectly replicate the complex interplay of wear mechanisms observed in real-world TBM operations.

2.3. Wear Measurement Procedure

The wear measurement procedure involved creating indentation marks on the contact area of the sample and comparing the height before and after the wear experiment.
Several criteria guided the selection of the reference mark. It needed to be easily identifiable, minimize potential errors, and account for the limitations of interferometry measurements, especially regarding the geometry of the mark, such as closed-angle marks (e.g., a Vickers pyramid). The interferometry measurement required sufficient precision without necessitating nanoscale measurements, as the worn height range was outside the measurement error range.
Considering these criteria, including the necessity of creating a worn height that exceeded the measurement limit and the high time cost for fine preparation, a spherical indentation (Brinell) shape was selected.
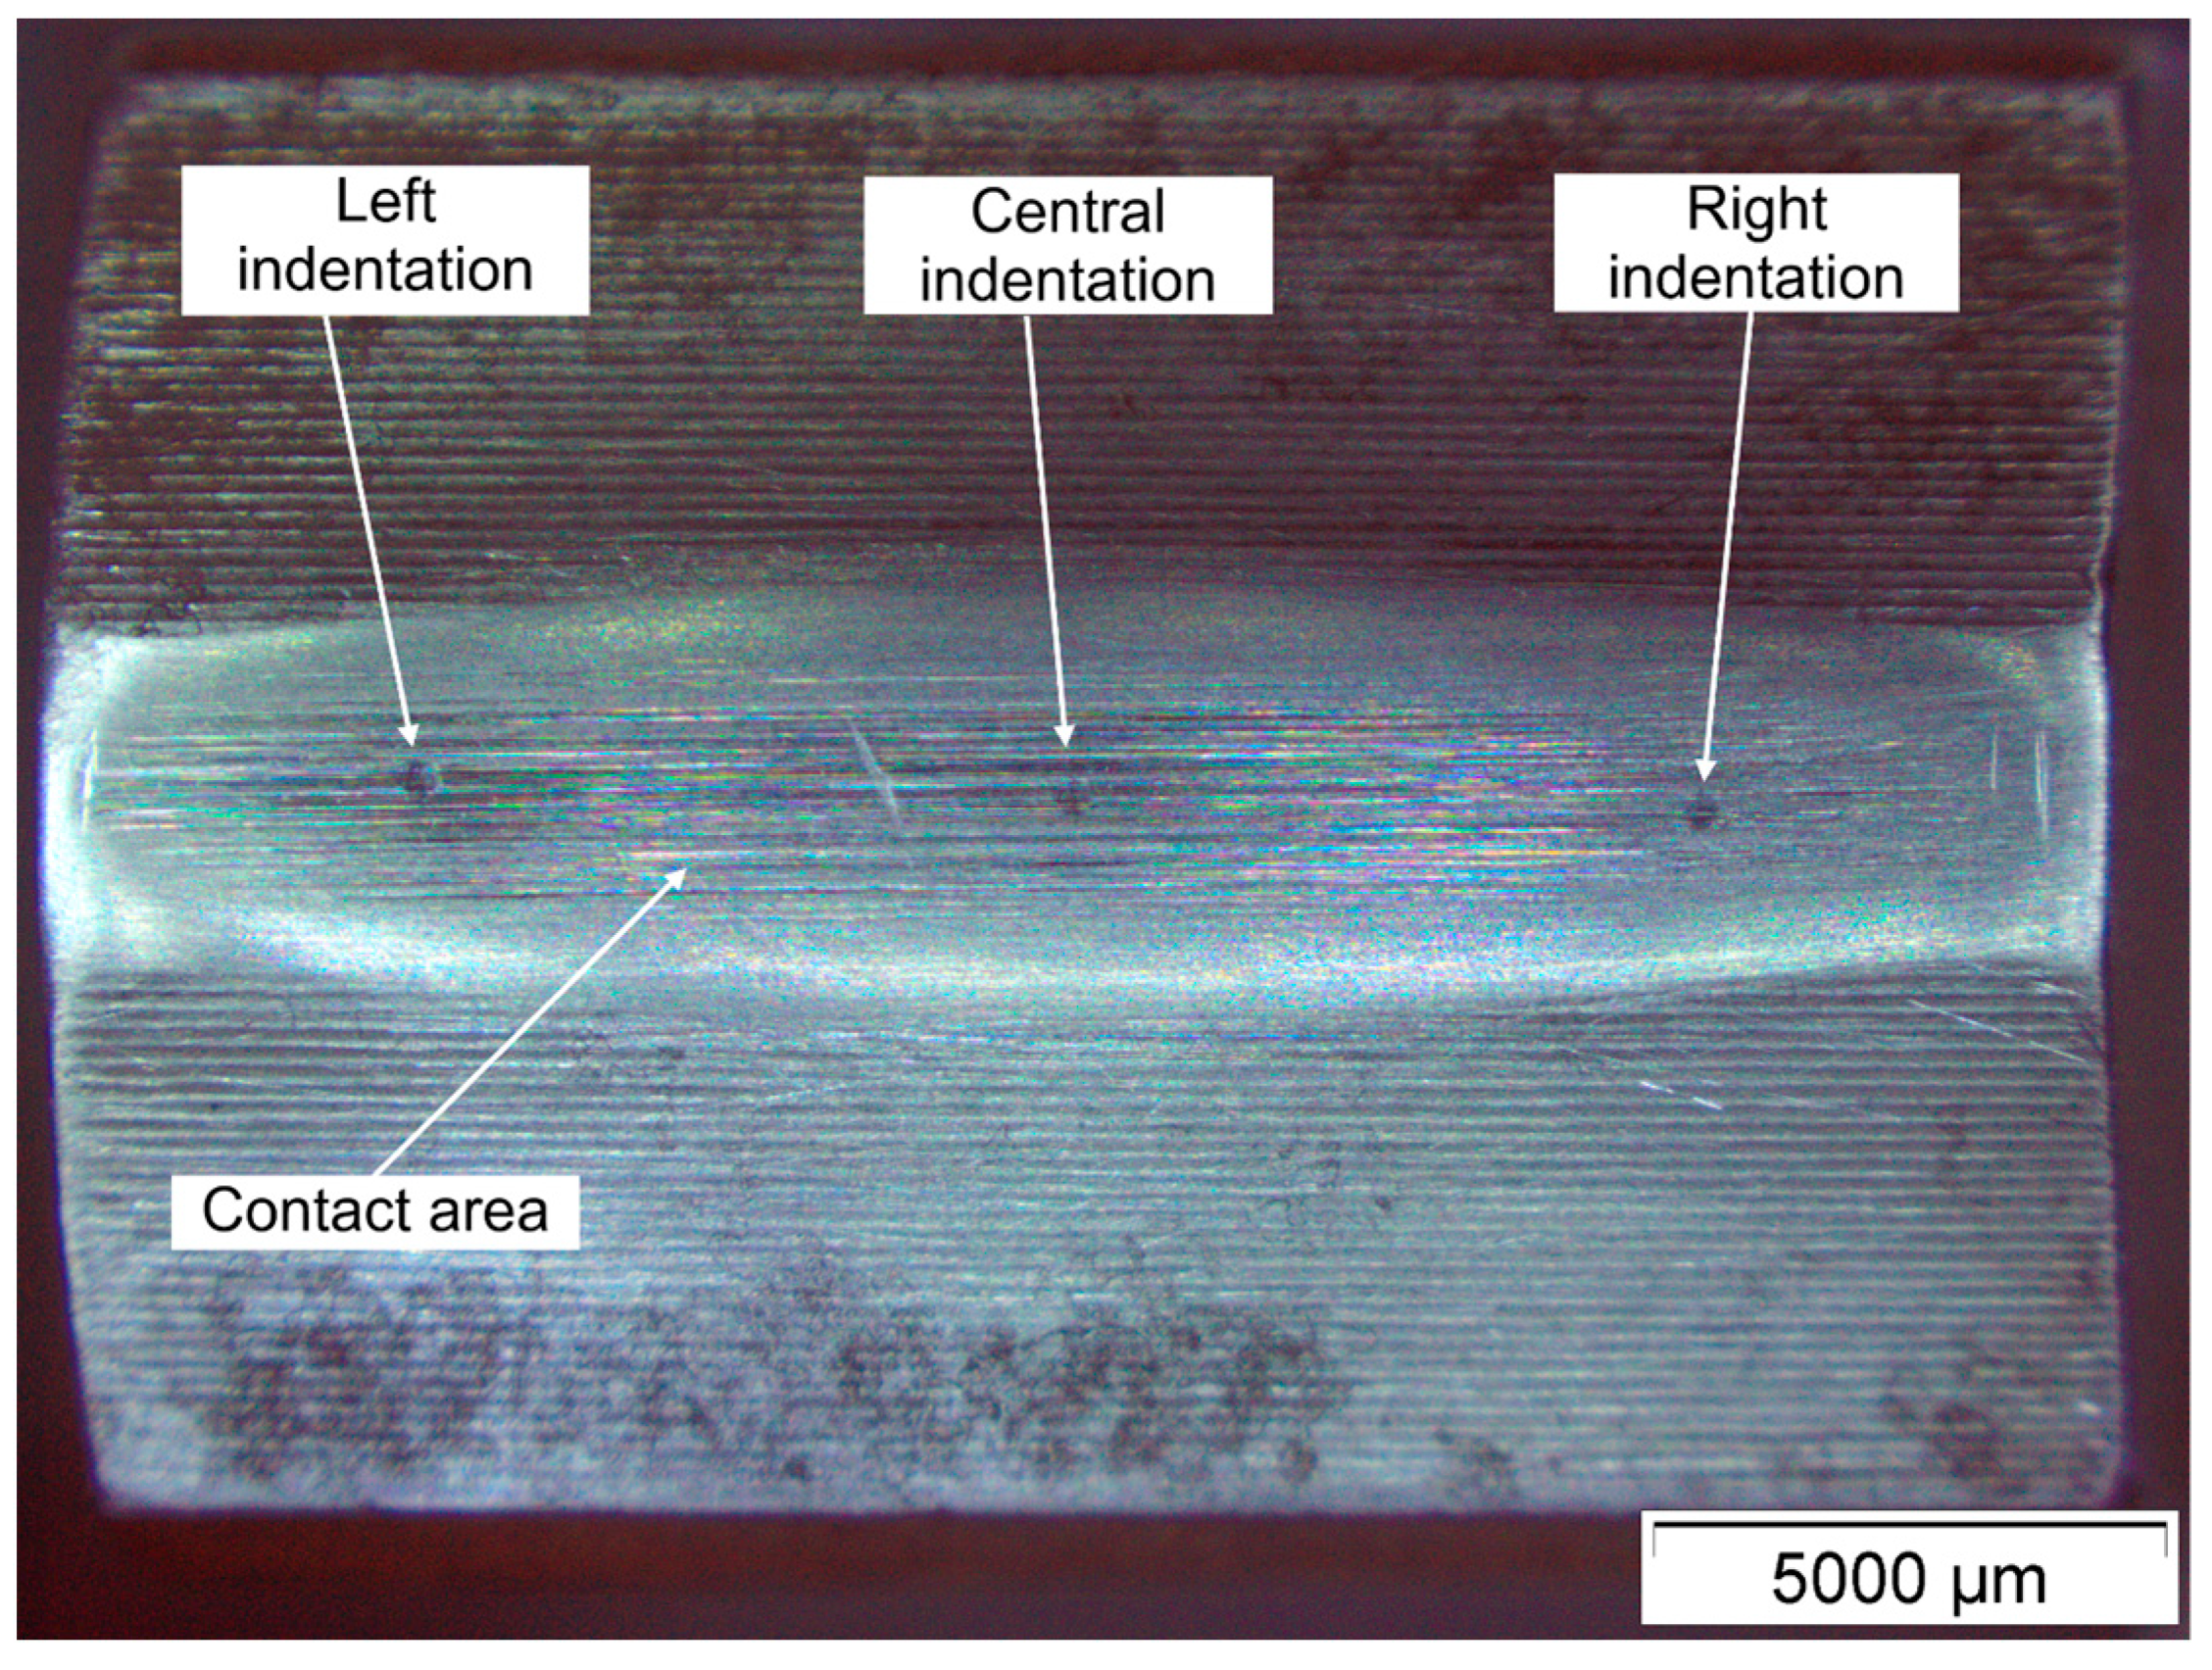
Indentations were created using an EMCO-TEST M4C G3 (EMCO-TEST Prüfmaschinen GmbH, Kuchl, Österreich) hardness tester with 5 mm tungsten carbide balls, applying a load of 60 kg for 15 s. The indentations were spaced at least 3 mm apart to avoid the hardening effect, as recommended by ASTM E10-18 [21]. Three indentations were made on each disc sample: central, left, and right indentations (Figure 5).
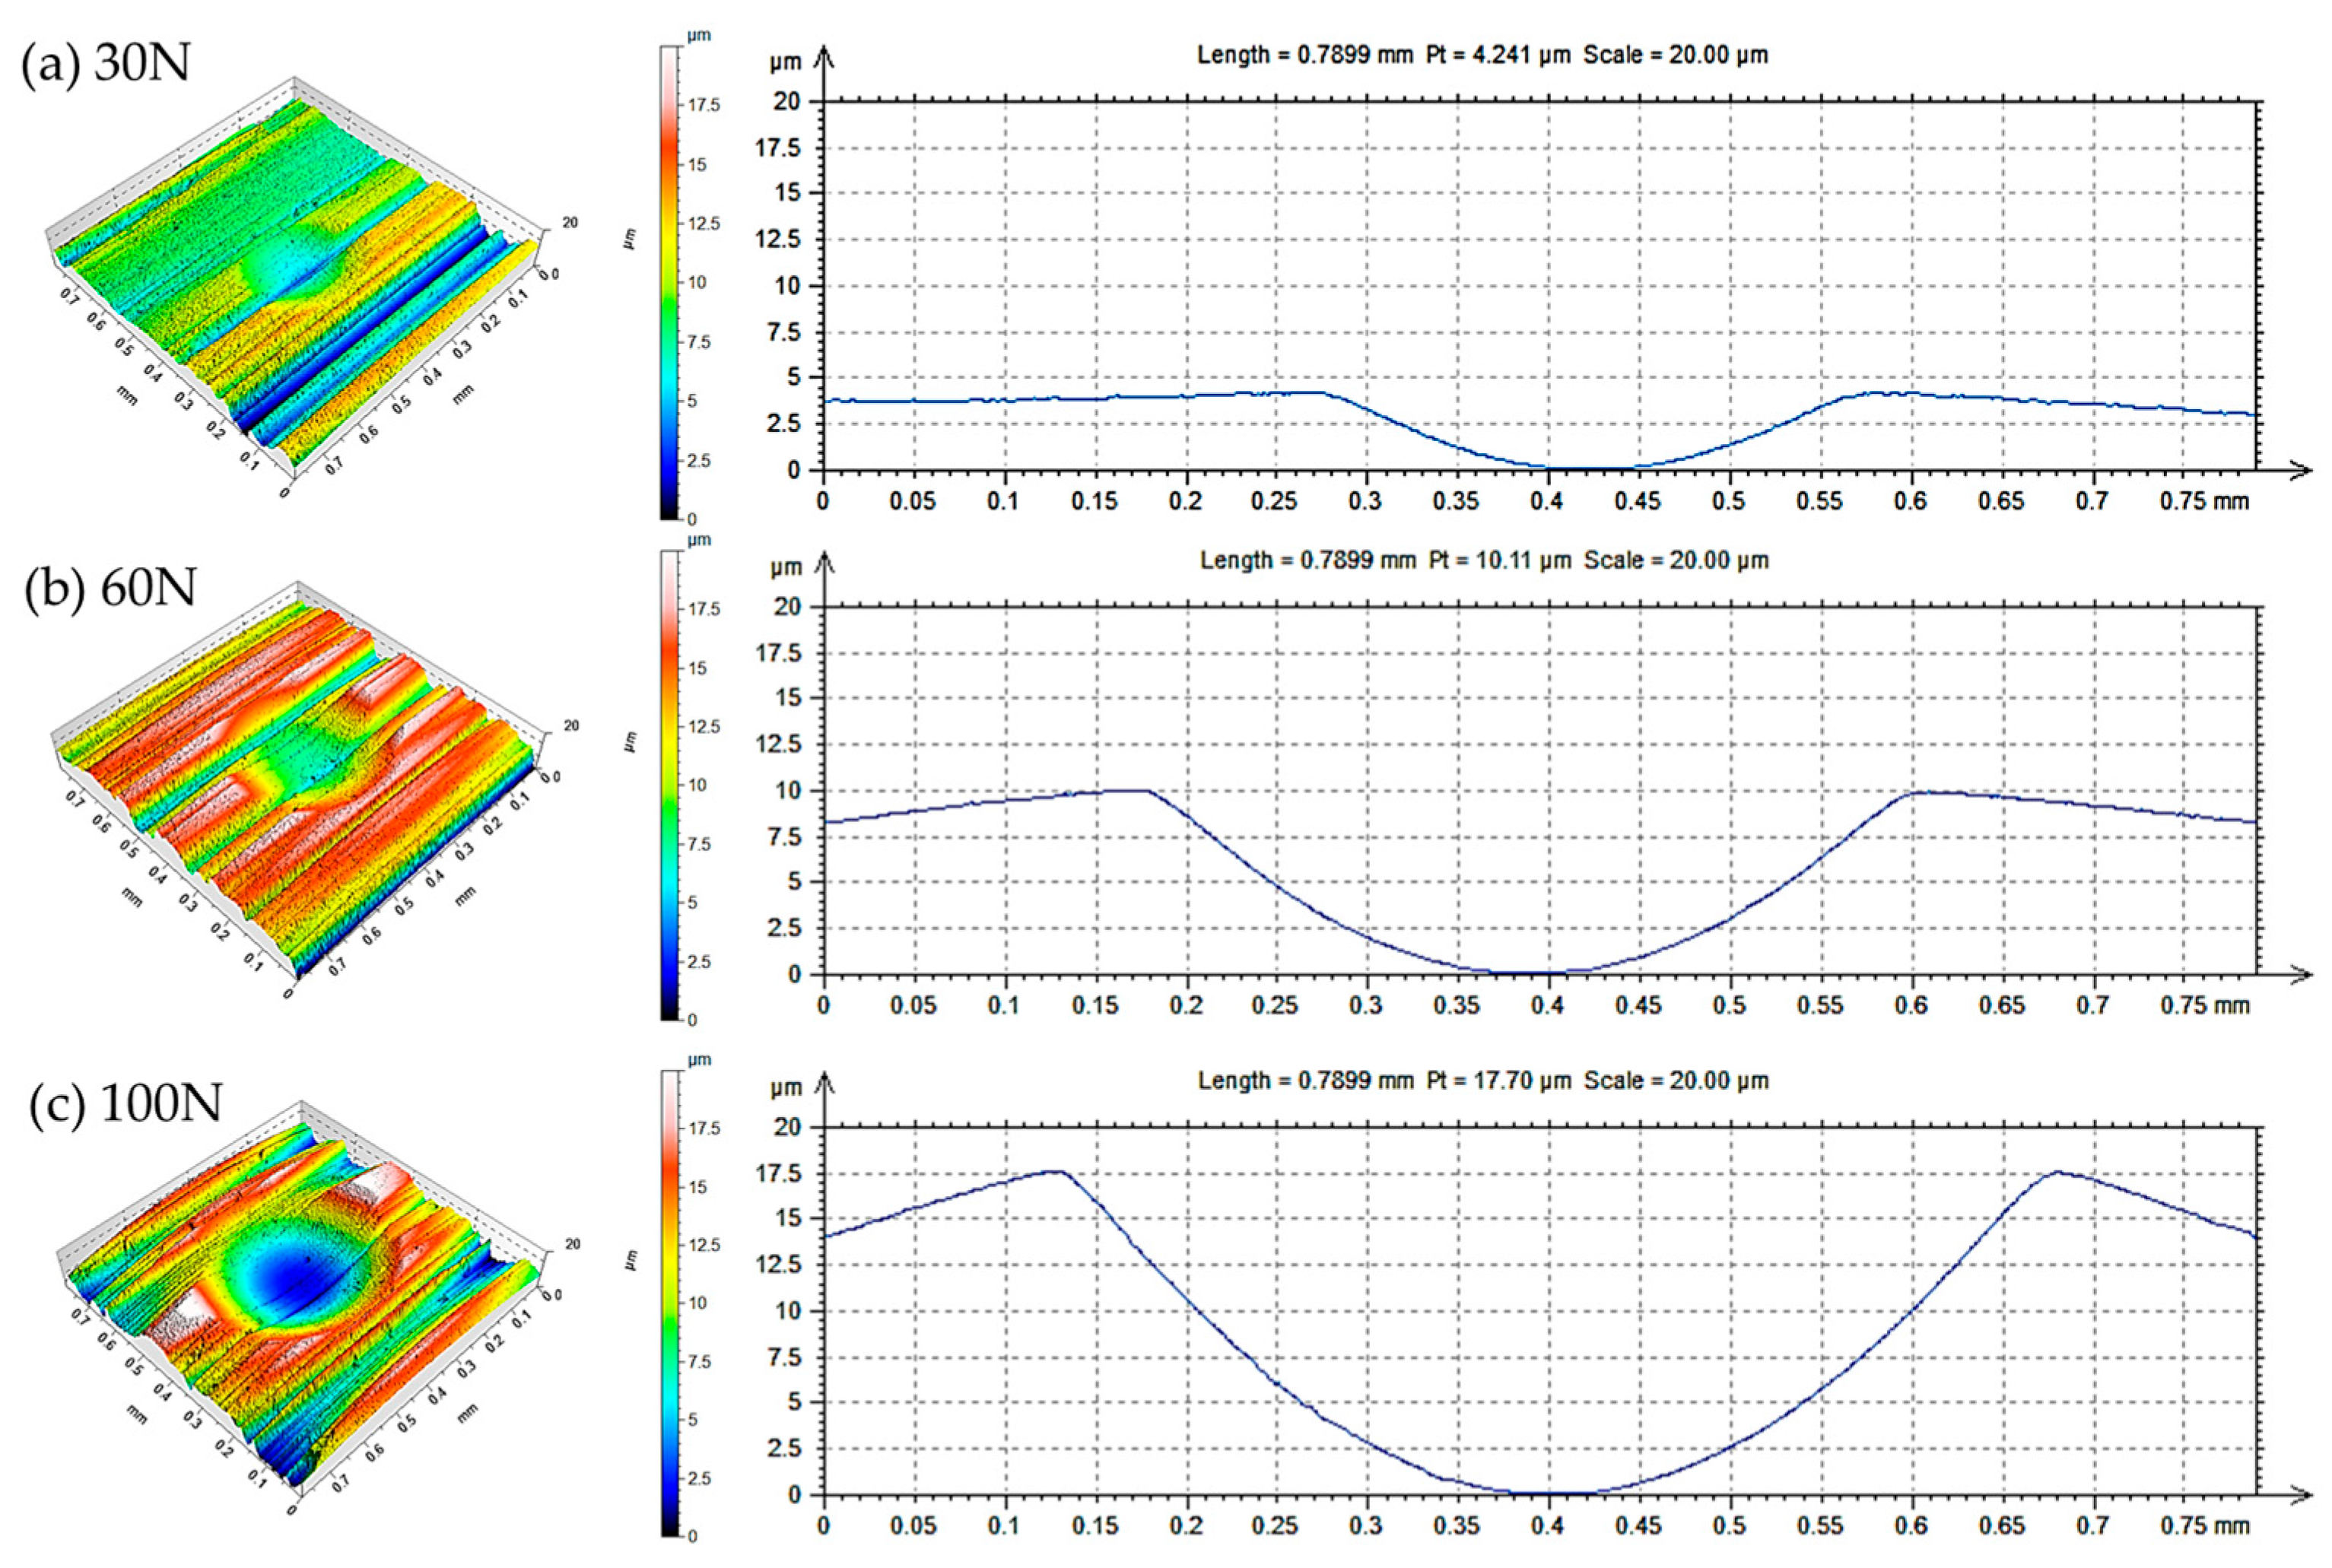
The applied load used for indenting was determined in preliminary tests with loads of 30 N, 60 N, and 100 N. Figure 6 displays a comparison between the indentations and the mean horizontal profile of each load. The 30 N load resulted in very shallow indentations, with the depth being lost during the wear test. The 100 N load caused a pronounced pile-up, potentially creating a preferential contact surface that would alter the wear conditions compared to flat surface contact. Based on this preliminary assessment, a 60 N load was selected.
The indentation marks and the roughness of the contact area outside the indentations (contact area post-preparation) were measured before and after each wear test using a white-light interferometer (Taylor Hobson Talysurf CCI Lite) integrated with the TalyMap Platinum 6.1 (DigitalSurf) software. The interferometer has a resolution of 1024 × 1024 pixels, with a sampling area of 0.83 × 0.83 mm and a vertical resolution of 0.01 nm. Measurements were conducted as follows using consistent filtering operations: (i) leveling using the least squares (LS) plane method, (ii) form removal using a third-order polynomial, (iii) filling of non-measured points, and (iv) applying a threshold from 0.001 to 99.9%.
The contact area roughness of each sample before the wear test was Sq (root mean square) = 1.1 ± 0.7 μm and Str (texture aspect ratio) = 0.07 ± 0.02, indicating that the sanding resulted in strongly anisotropic surfaces. The variability in the roughness of the contact areas before the wear test was analyzed through the height distribution and quantified using the roughness parameters Ssk and Sku.
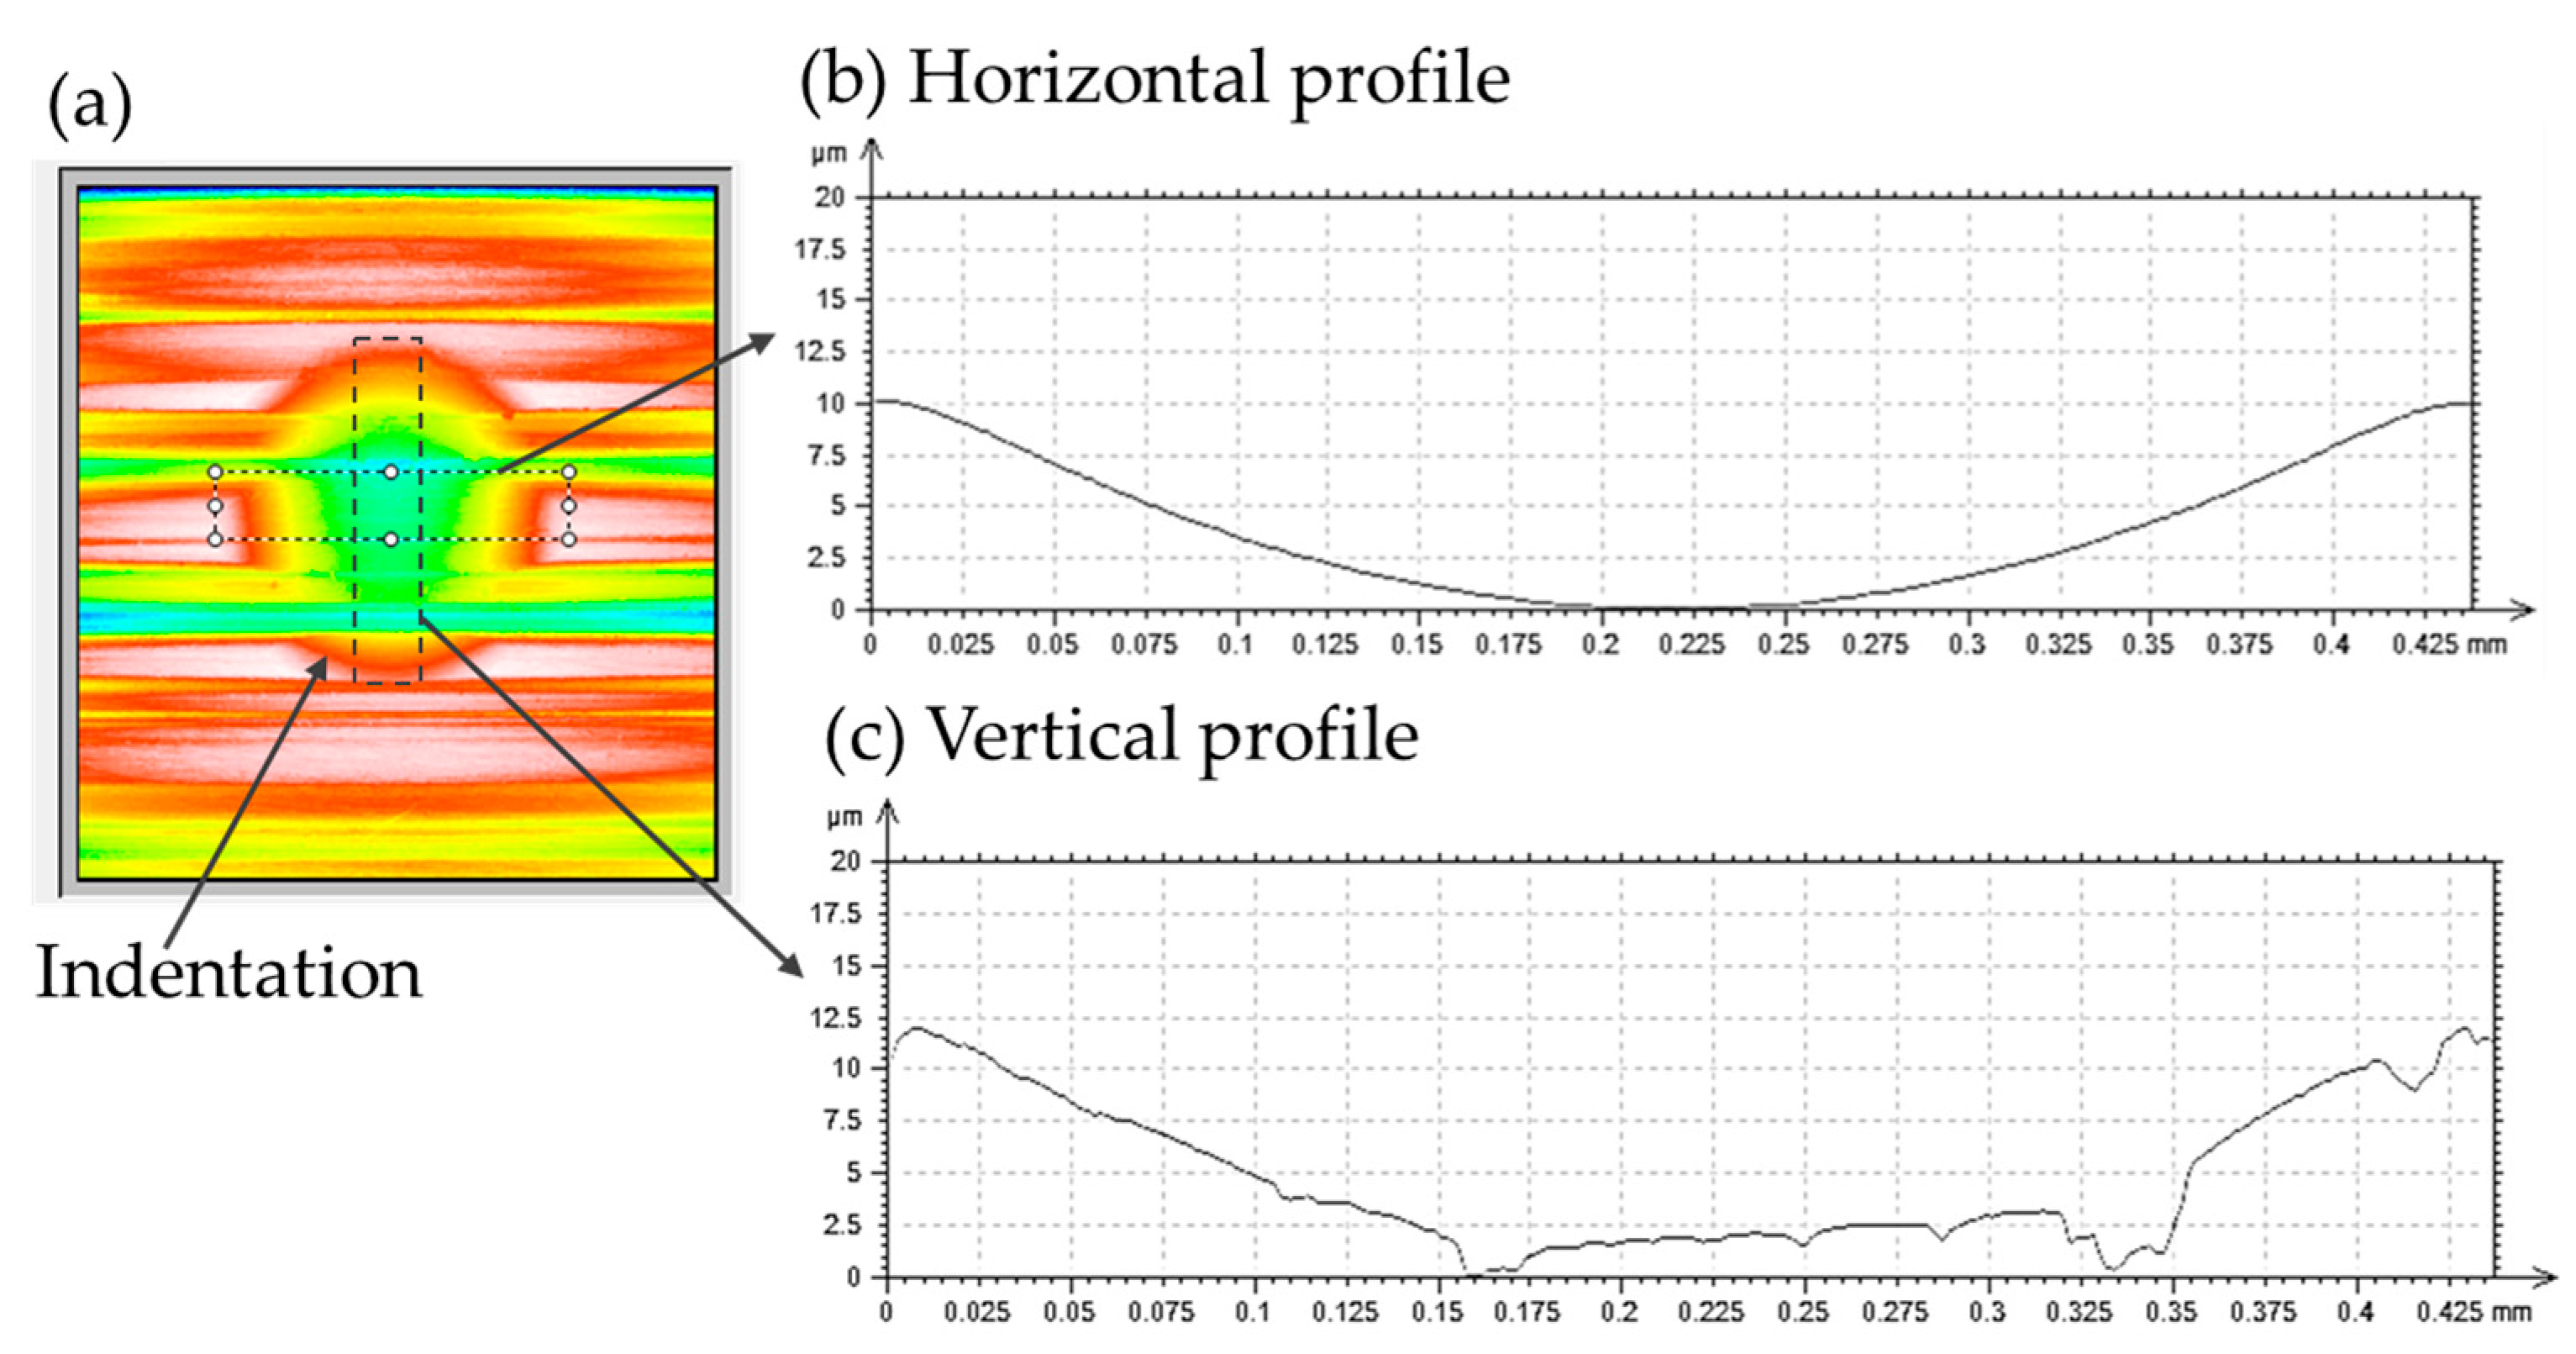
The height of each indentation was determined by averaging 100 horizontal profiles extracted from a consistent area within the deepest central region of the indentation (Figure 7). Vertical profiles were not used due to the high roughness resulting from their perpendicular orientation relative to the sanding direction.
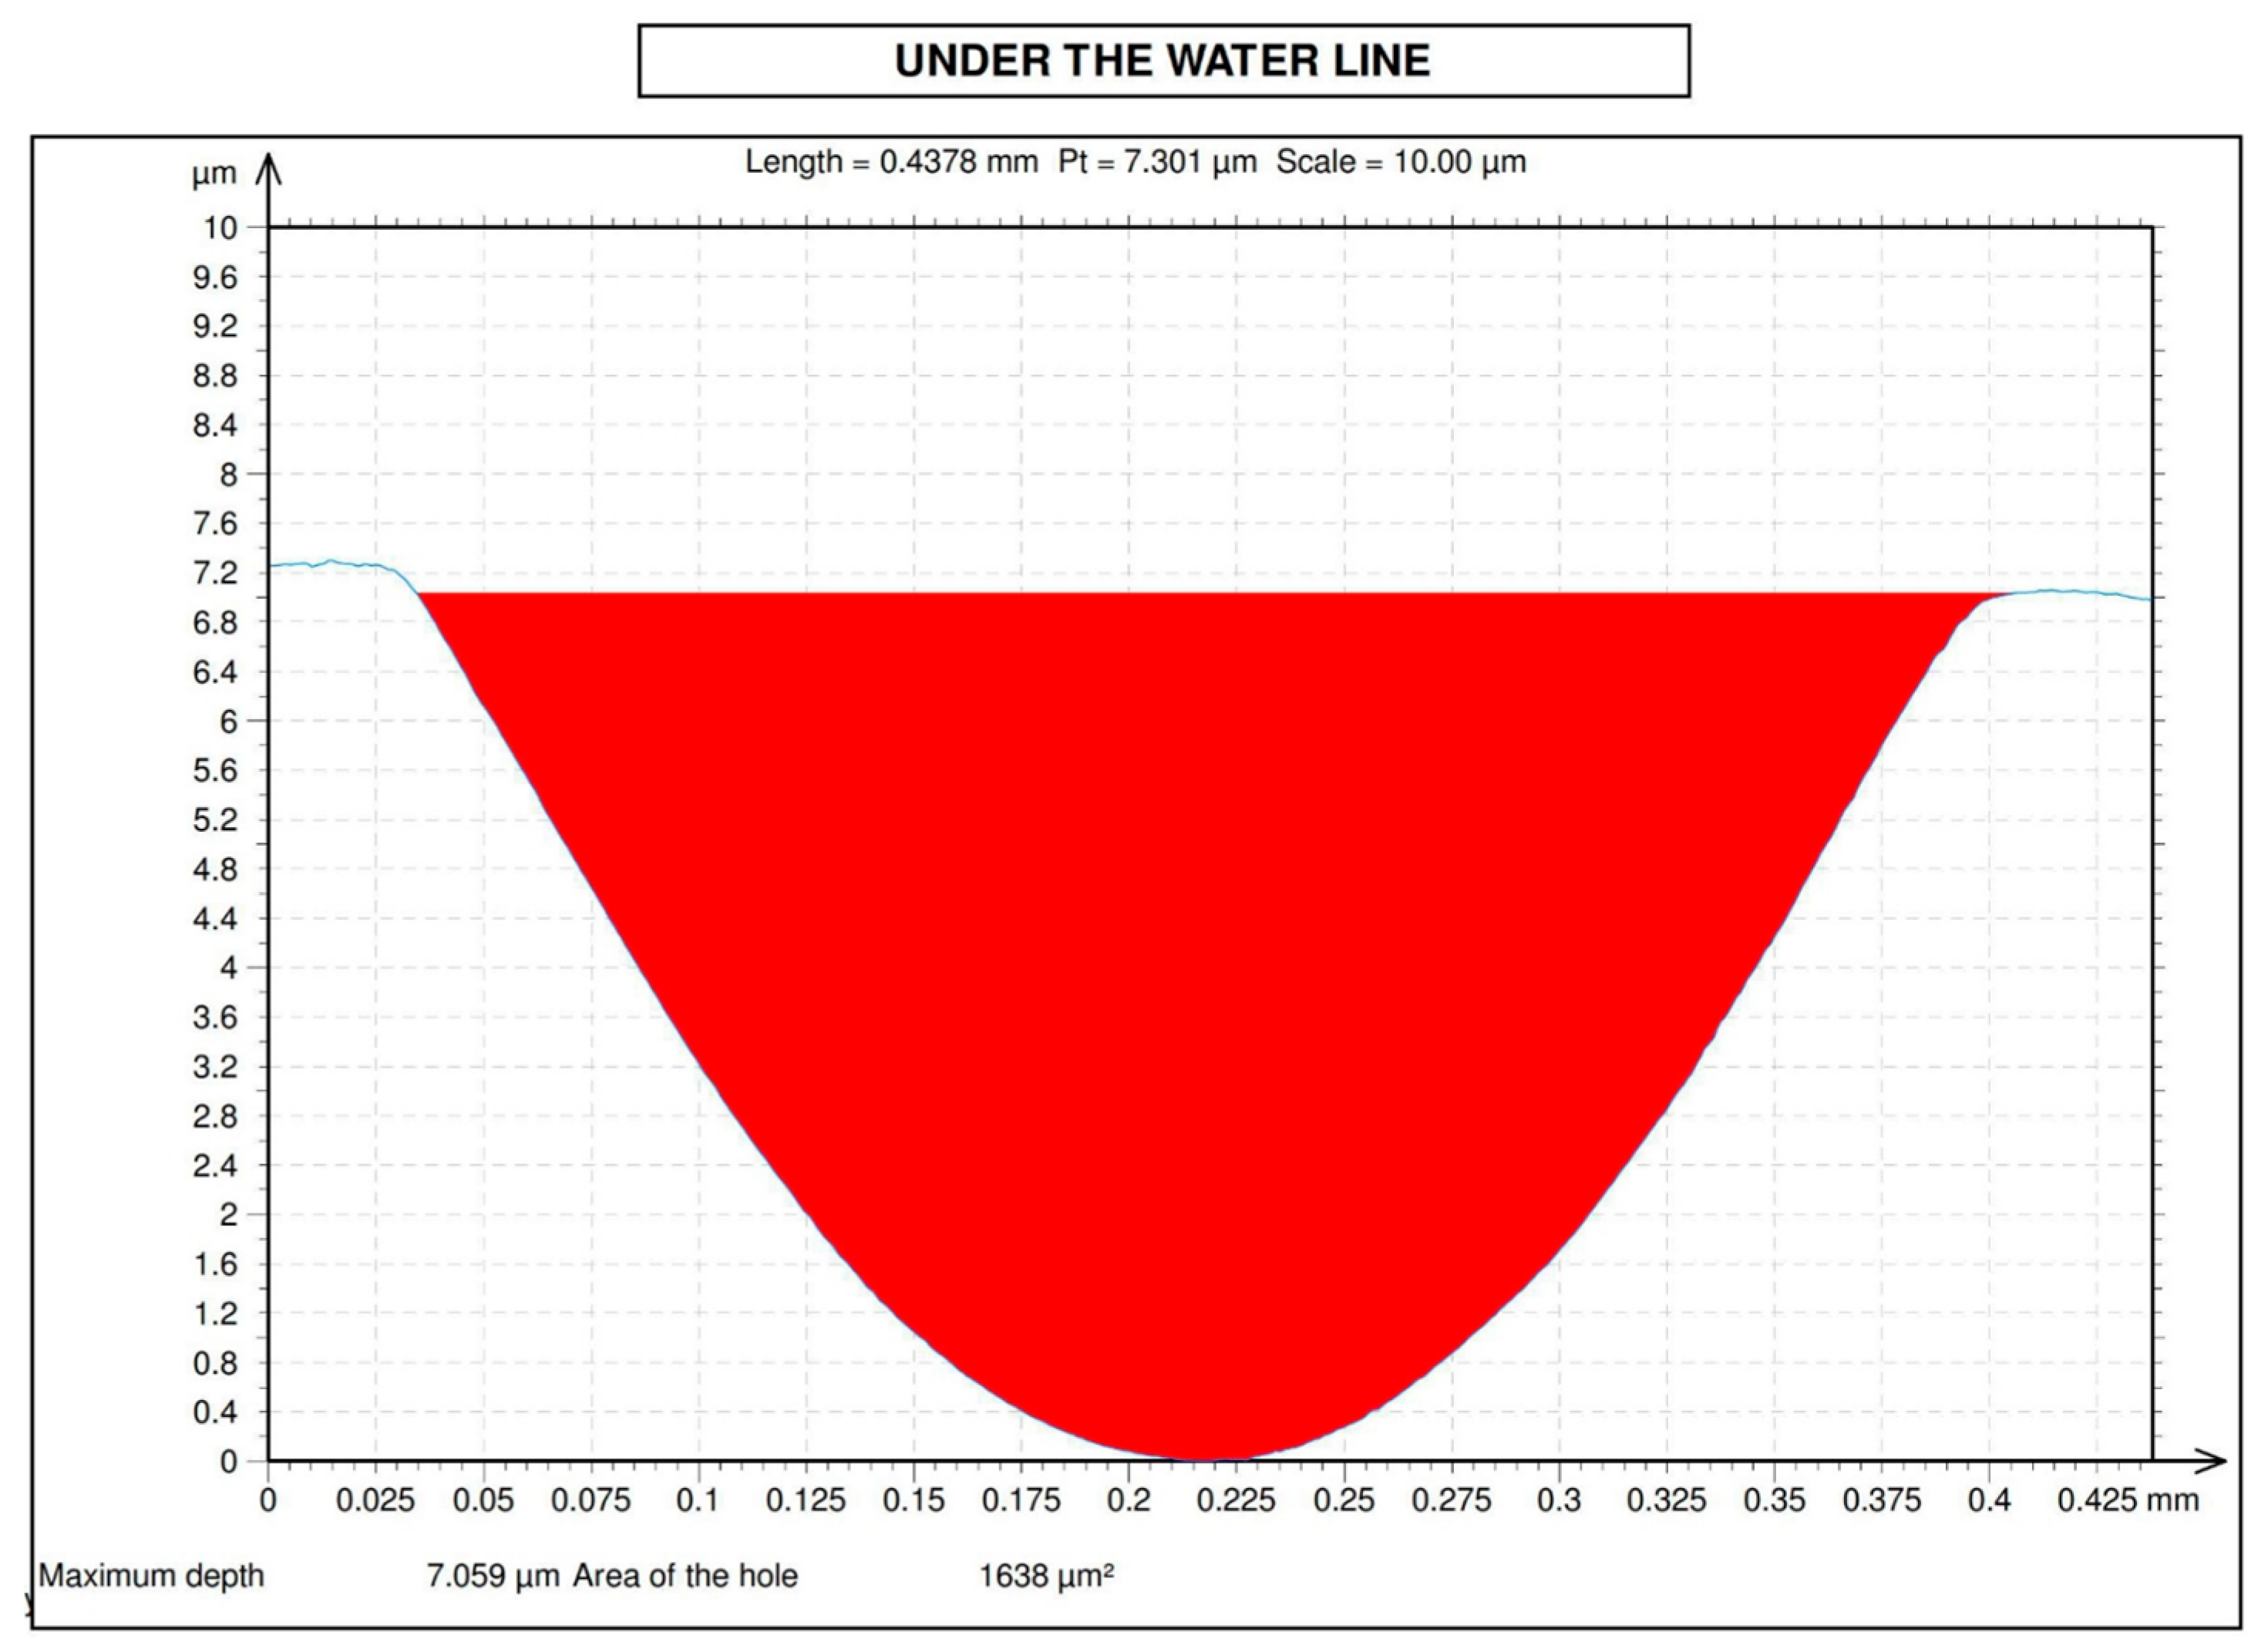
The height of the mean horizontal profile was defined using the Surface of a Hole/Peak (Profile) tool available in the TalyMap Platinum 6.1 software, which allows the user to quantify specific measurements in a hole or peak. Among the available methods to limit the extension of the hole, the chosen method (“Hole under the Water Line”) simulates filling the hole with water up to an imaginary level, which identifies the lowest and highest points between the two delimiters of the profile, and then fills the hole up to the lower of the two summits (Figure 8). This method is particularly effective in minimizing errors related to roughness outside the profile and reducing operator influence in defining the indentation extension, making it the optimal choice for this study.

2.4. Statistical Analysis

Statistical analyses were performed using the R programming language [22,23,24]. The two variables analyzed were the indentation height before and after the wear test. A level of 5% (p < 0.05) was considered to be statistically significant in all the analyses.
According to the Central Limit Theorem (CLT), if a population is normally distributed, the distribution of the sample means will also follow a normal distribution, regardless of the sample size. For populations with unknown or non-normal distributions (e.g., asymmetric or uniform), the CLT states that the sampling distribution of the means approaches normality as the sample size becomes sufficiently large (typically n ≥ 30). This principle enables confidence intervals and hypothesis testing to be applied reliably, even when the underlying population distribution is unknown or non-normal.
The statistical treatment of the experimental data was structured into five stages.
  • Descriptive Statistics: Median, mean, mode, standard deviation (SD), coefficient of variation (CV), confidence interval (CI), kurtosis, skewness, and p-values were calculated for all measured parameters. These descriptive metrics provided an initial understanding of the data distribution.
  • Sample Size Validation: Based on the Central Limit Theorem, sample size adequacy was confirmed by calculating the confidence intervals for the mean. The maximum error, “e”, of the confidence interval was computed according to Equation (1):
    n = Z γ 2 . σ e 2
    where e = CImax − CImin; n = sample size; Z(γ/2) = normal value associated with confidence coefficient; and σ = standard deviation of X.
  • Verification of Statistical Differences Between Groups: Analysis of variance (ANOVA) was applied to assess the statistical significance of the differences between the three groups of indentations: central, right, and left. The null hypothesis assumed similar means across the groups, while the alternative hypothesis suggested that at least one mean was different.
  • T-Test for Paired Samples: To evaluate the differences in indentation height before and after the wear test, a paired Student’s t-test was conducted. The null hypothesis posited that the means were similar, while the alternative hypothesis suggested a difference.
  • Data Visualization: The results were visualized using boxplots to illustrate the distribution and variability of the indentation heights. Additionally, p-values were reported to indicate the statistical significance of the observed differences.

3. Results and Discussion

3.1. Surface Roughness Variation

The roughness of the contact area outside the indentations, as measured by the Sq parameter, decreased to 0.6 ± 0.3 µm after sanding in the wear test. This reduction indicates the influence of overlap during the sanding process, which contributed to the wear of the sandpaper itself. As illustrated in Figure 9, the worn sandpaper exhibited significant clogging, characterized by metal debris embedded within the abrasive surface. This clogging is a critical factor in the expected decrease in the sandpaper’s efficiency [25], as the accumulation of metal debris obstructs the cutting action of the alumina grains, reducing their ability to effectively remove material from the disc cutter.
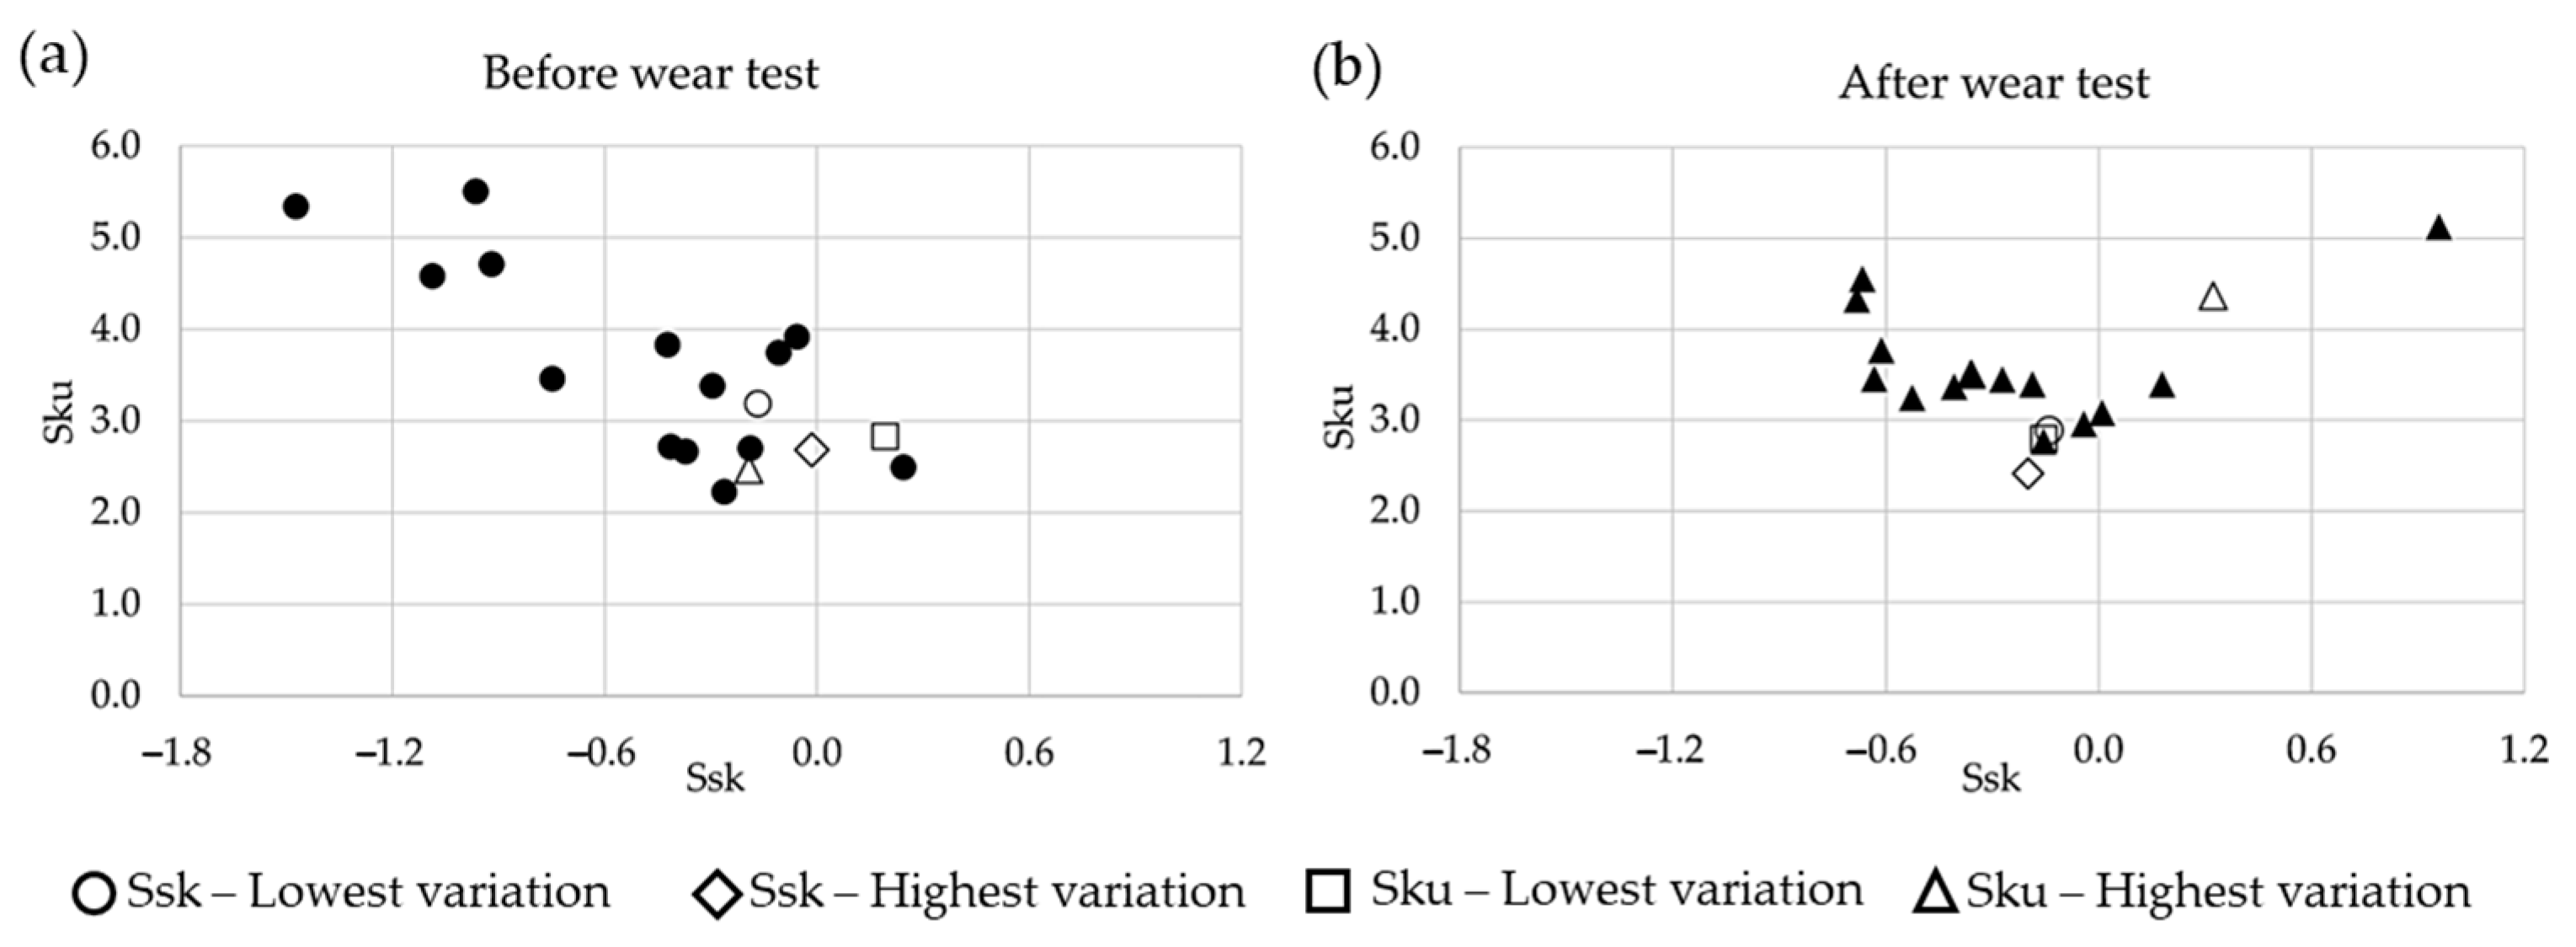
While some loss of anisotropy was expected, the measurements of the Str parameter showed consistent average values before and after sanding. However, further insights into the wear process can be gained by analyzing the height distribution of the asperities using a morphological map, as proposed by Mehl et al. [26] (Figure 10). This approach aligns with the findings of Duo et al. [27], who emphasized the critical role of skewness (Ssk) in characterizing wear performance. Data from all 18 sample contact areas outside the indentations were used for this analysis to ensure statistical relevance.
The surface topography analysis before and after the wear test revealed distinct characteristics in terms of asymmetry (Ssk) and kurtosis (Sku). Before the test, Ssk exhibited a mean of −0.322 ± 0.481, indicating a general tendency toward surfaces with more valleys than peaks and considerable variability across the different samples. After the test, the mean Ssk shifted slightly to −0.204 ± 0.449. In contrast, Sku exhibited a mean of 3.405 before and 3.408 after the test, with standard deviations of 0.909 and 0.688, respectively, suggesting a consistent level of “peakedness” and less variability. The Ssk parameter values for unworn surfaces were generally more negative, indicating a predominance of valleys. However, after the wear process, the skewness values decreased, shifting toward a balance between peaks and valleys, with positive Ssk values appearing, suggesting active cutting across the surfaces.
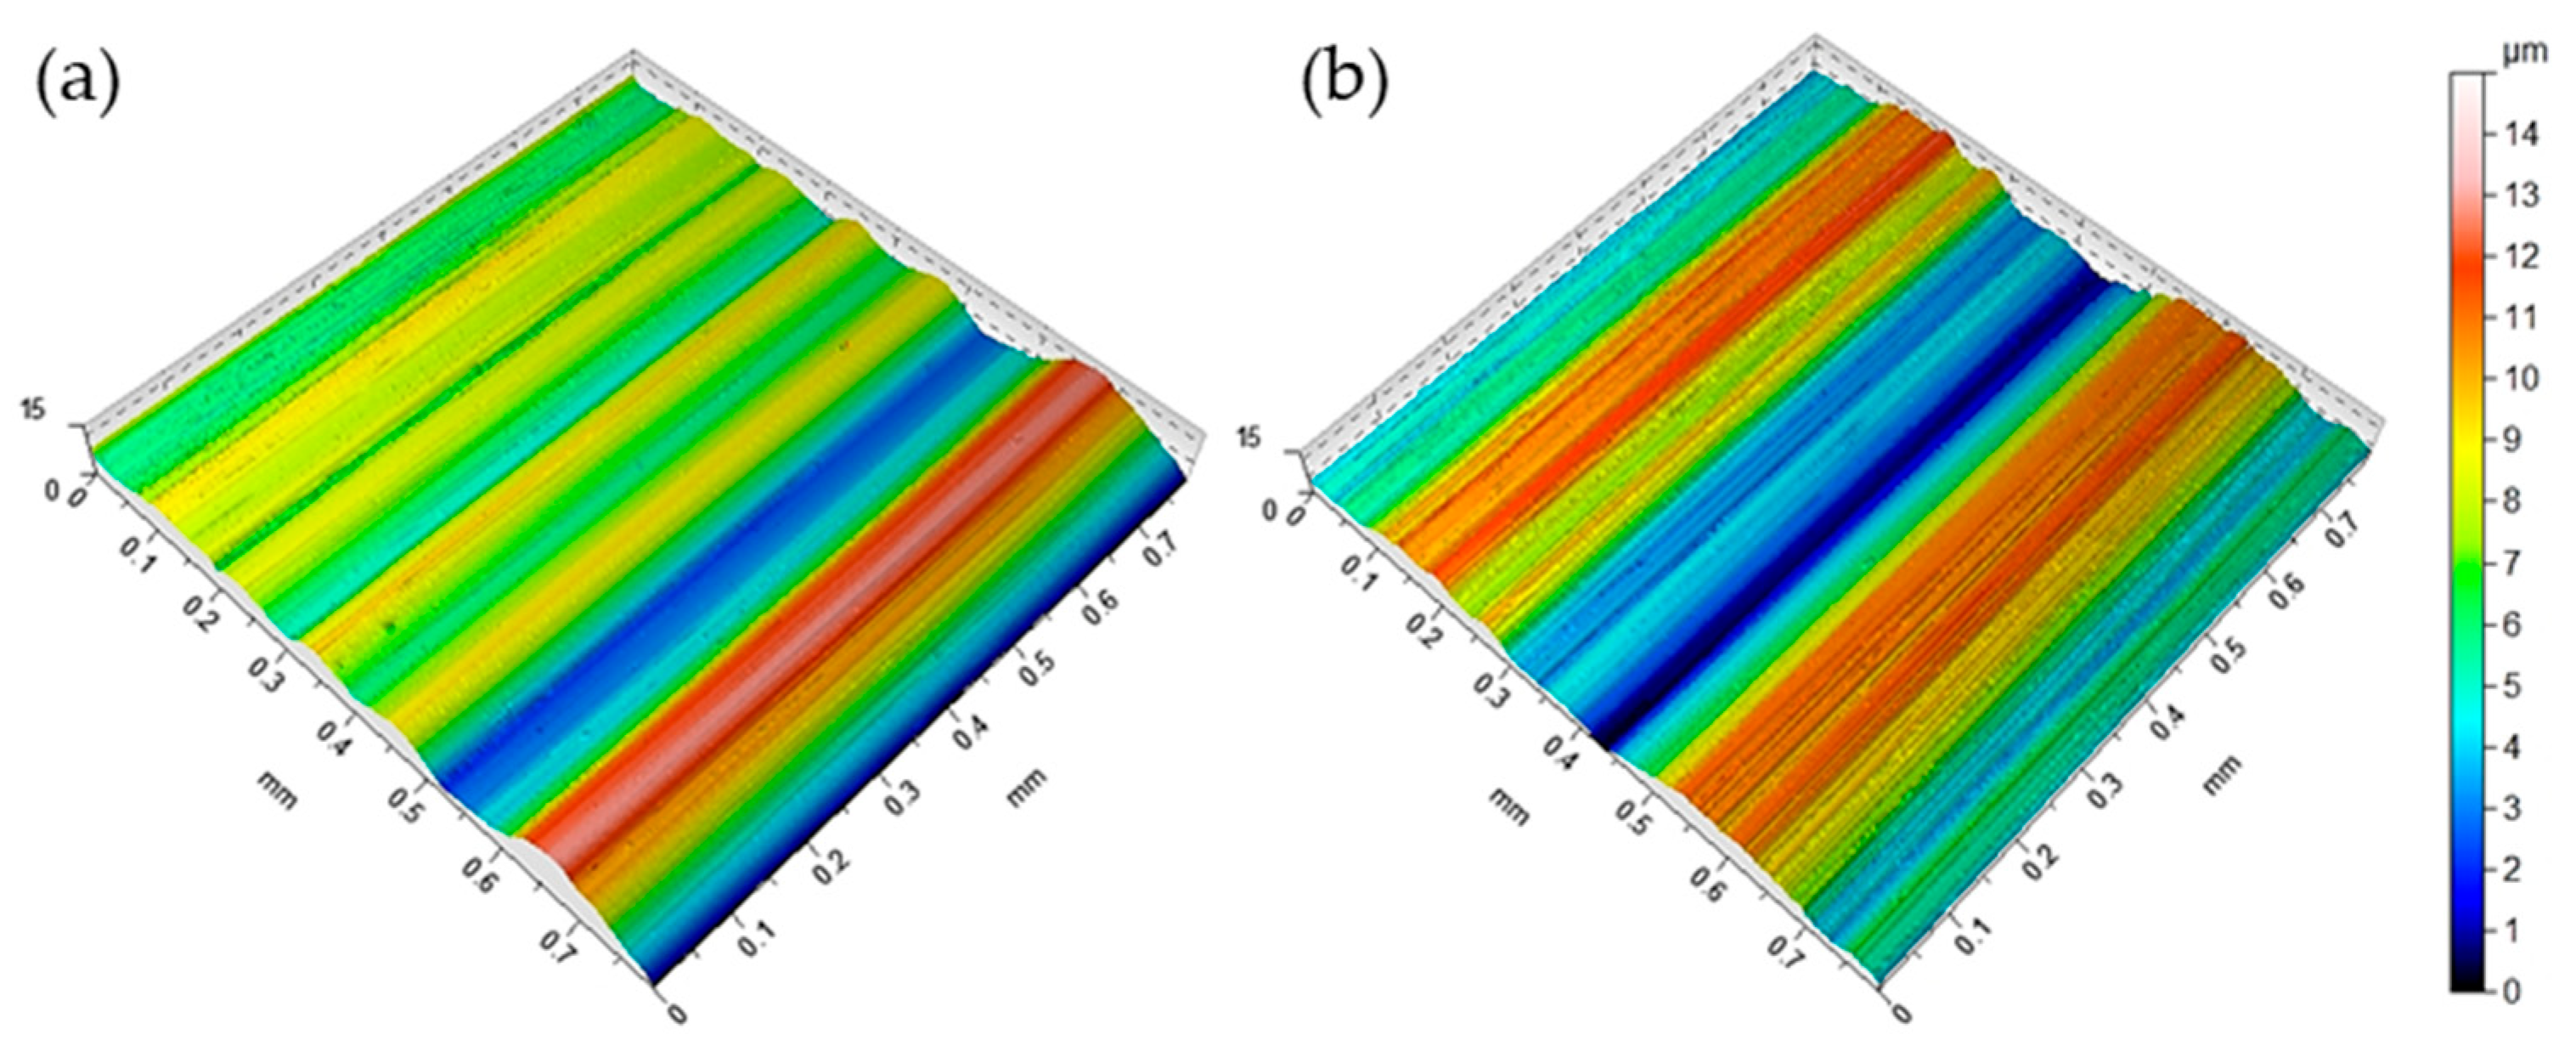
Despite the apparent homogeneity of the sandpaper, considerable variation in the surface topographic parameters was observed, challenging the application of “almost zero wear” methods. The percentage changes in Ssk exhibited a wide range, from 18% to 1245% (Figure 11), while the percentage changes in Sku ranged from 1% to 77%. This, combined with the shift in mean Ssk, suggests that the surface roughness was not uniform and predictable, potentially introducing errors in the “almost zero wear” measurements based on surface roughness. This issue is exacerbated when considering rock heterogeneity, further complicating accurate reference repositioning.

3.2. Wear Measurements

A total of 18 disc samples were tested, and 54 indentations were measured before and after the wear test. Table 2 presents the test parameters (mean contact area and applied force) and the height measurements before and after the wear test for each indentation.

3.3. Reliability of Results

Table 3 presents the descriptive statistics calculated for the two variables: height before and after the wear test. The sample size calculated for both variables was approximately 14 units, confirming that the sample size of 18 units per group (54 in total) was statistically sufficient for the study.
Table 4 shows the shape parameters, including kurtosis and skewness, and the p-values for normality testing. Based on parametricity criteria, both variables demonstrated a normal distribution.
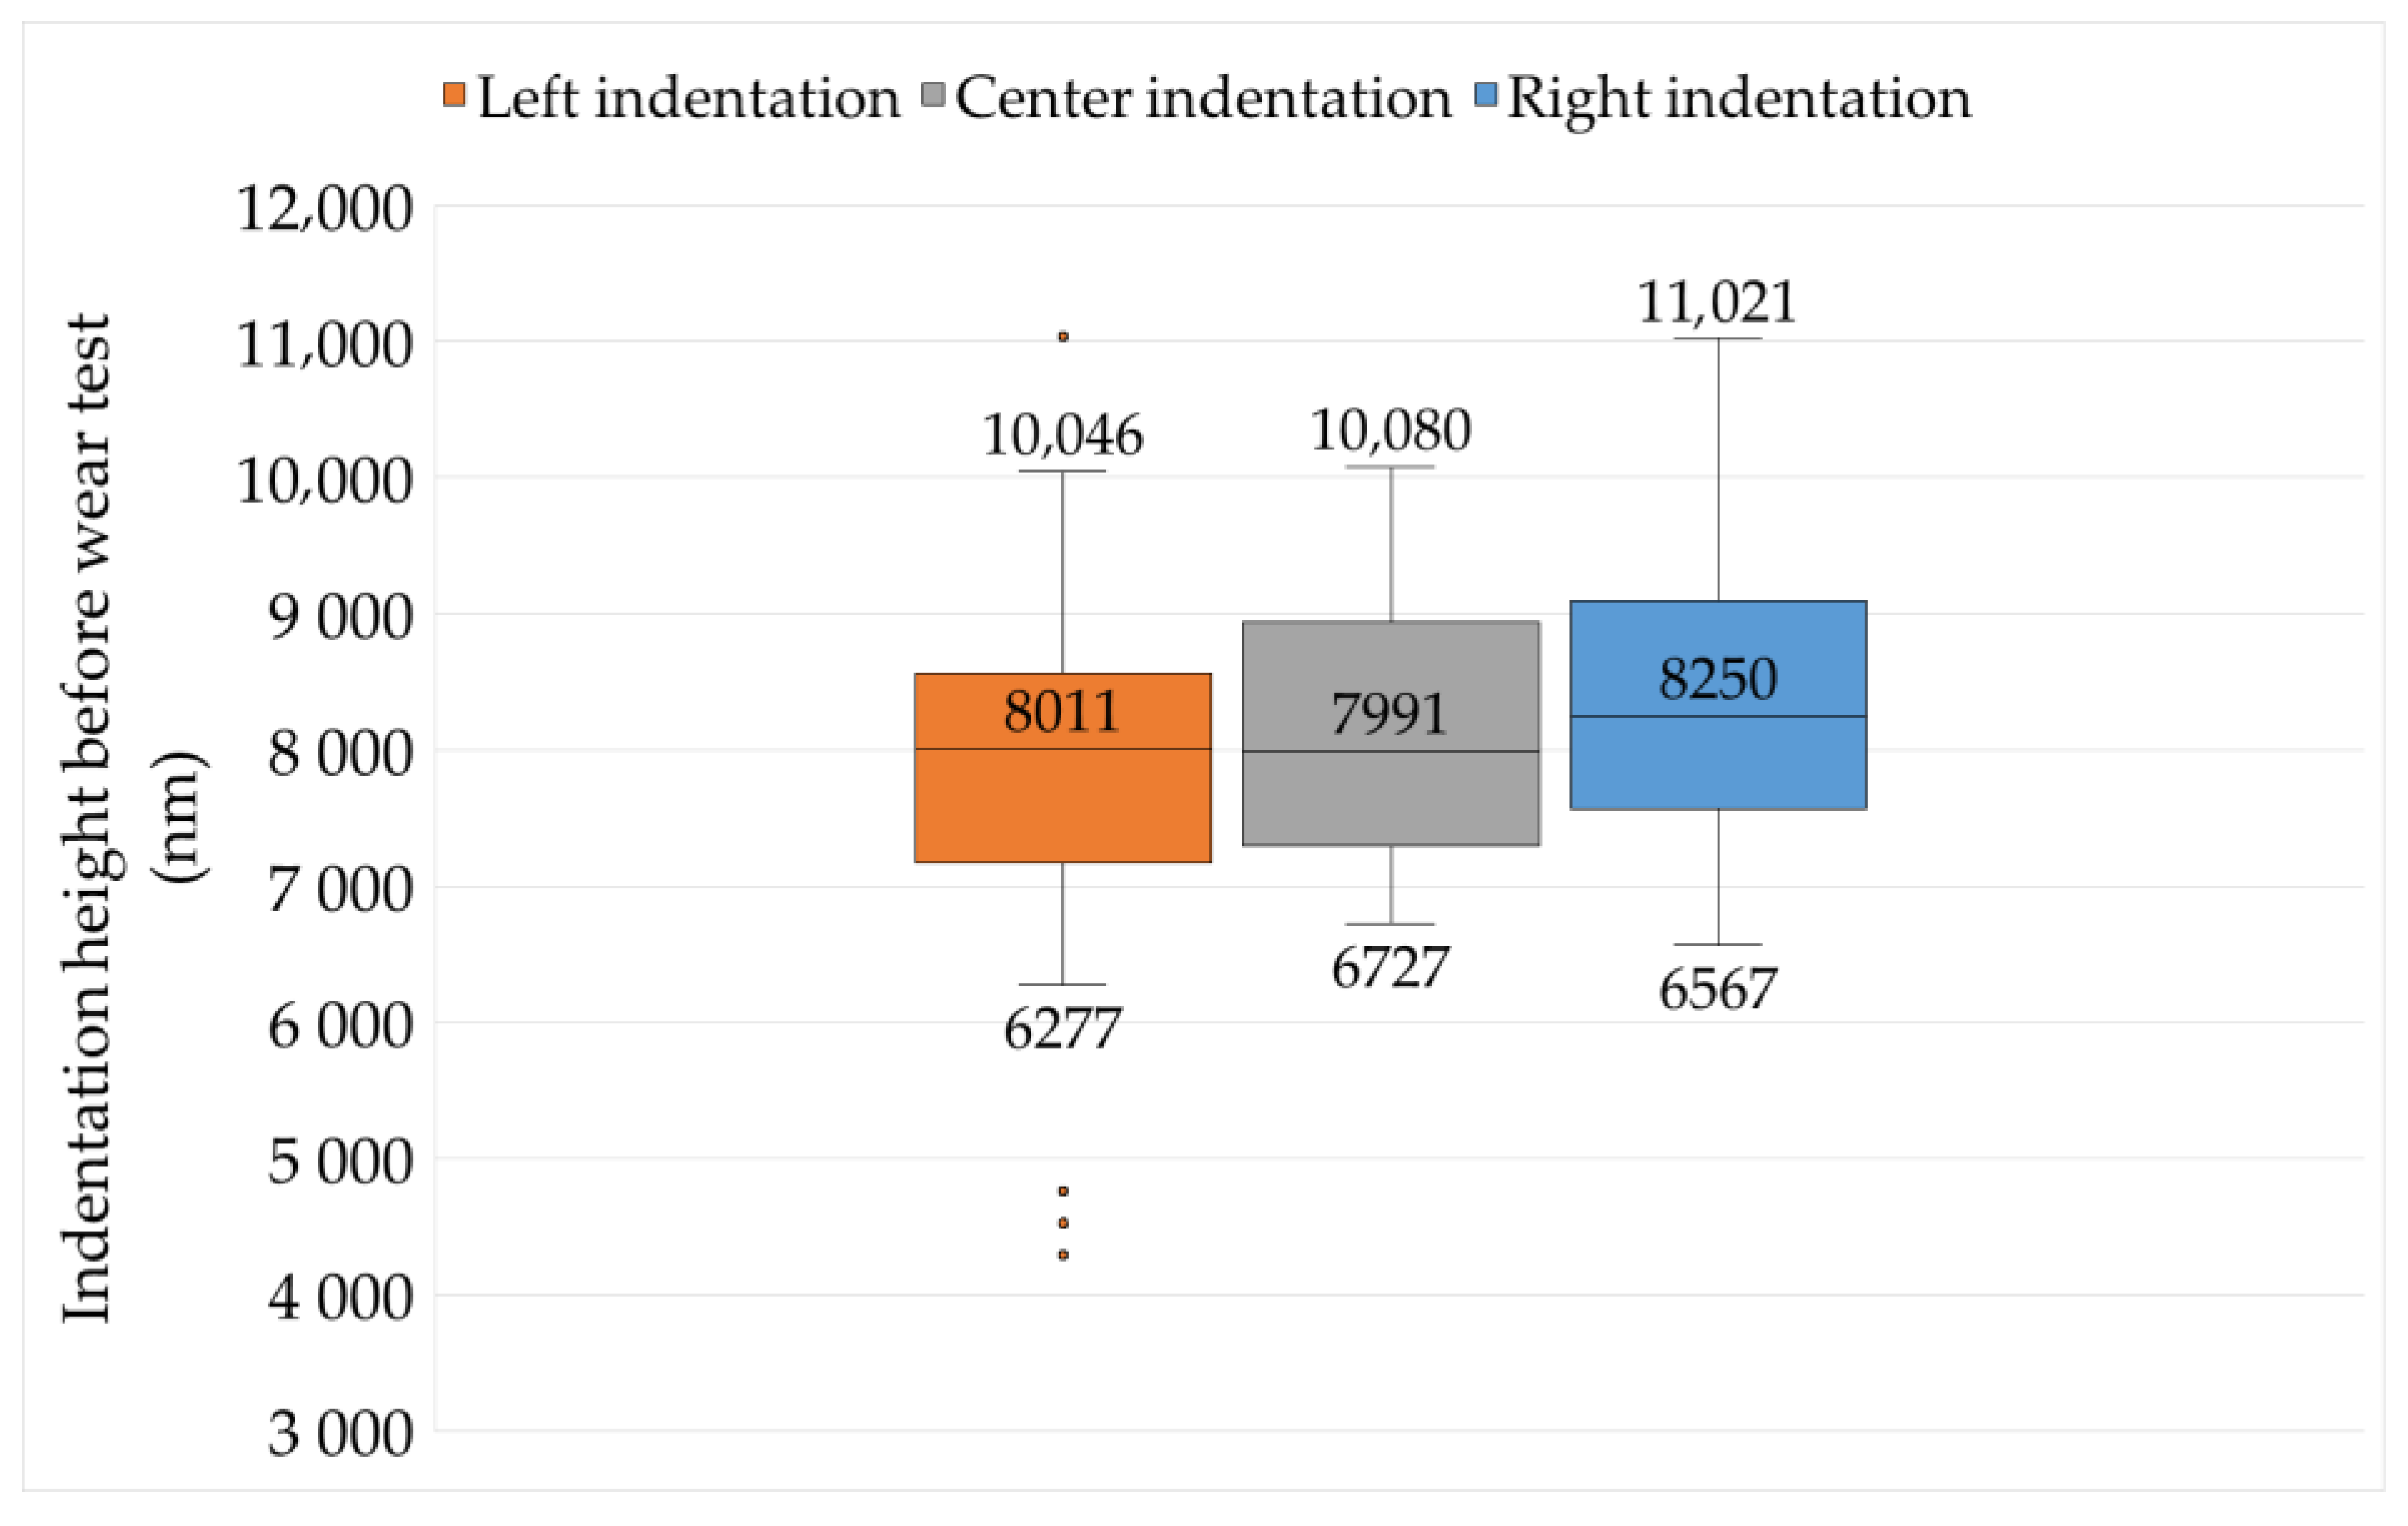
The ANOVA for the variable “height before the wear test” (Figure 12) for the three groups (central, left, and right indentations) yielded a significance value of p = 0.46. As p > 0.05, the null hypothesis was accepted, indicating no statistically significant difference between the groups. Therefore, all indentations can be considered a single group.
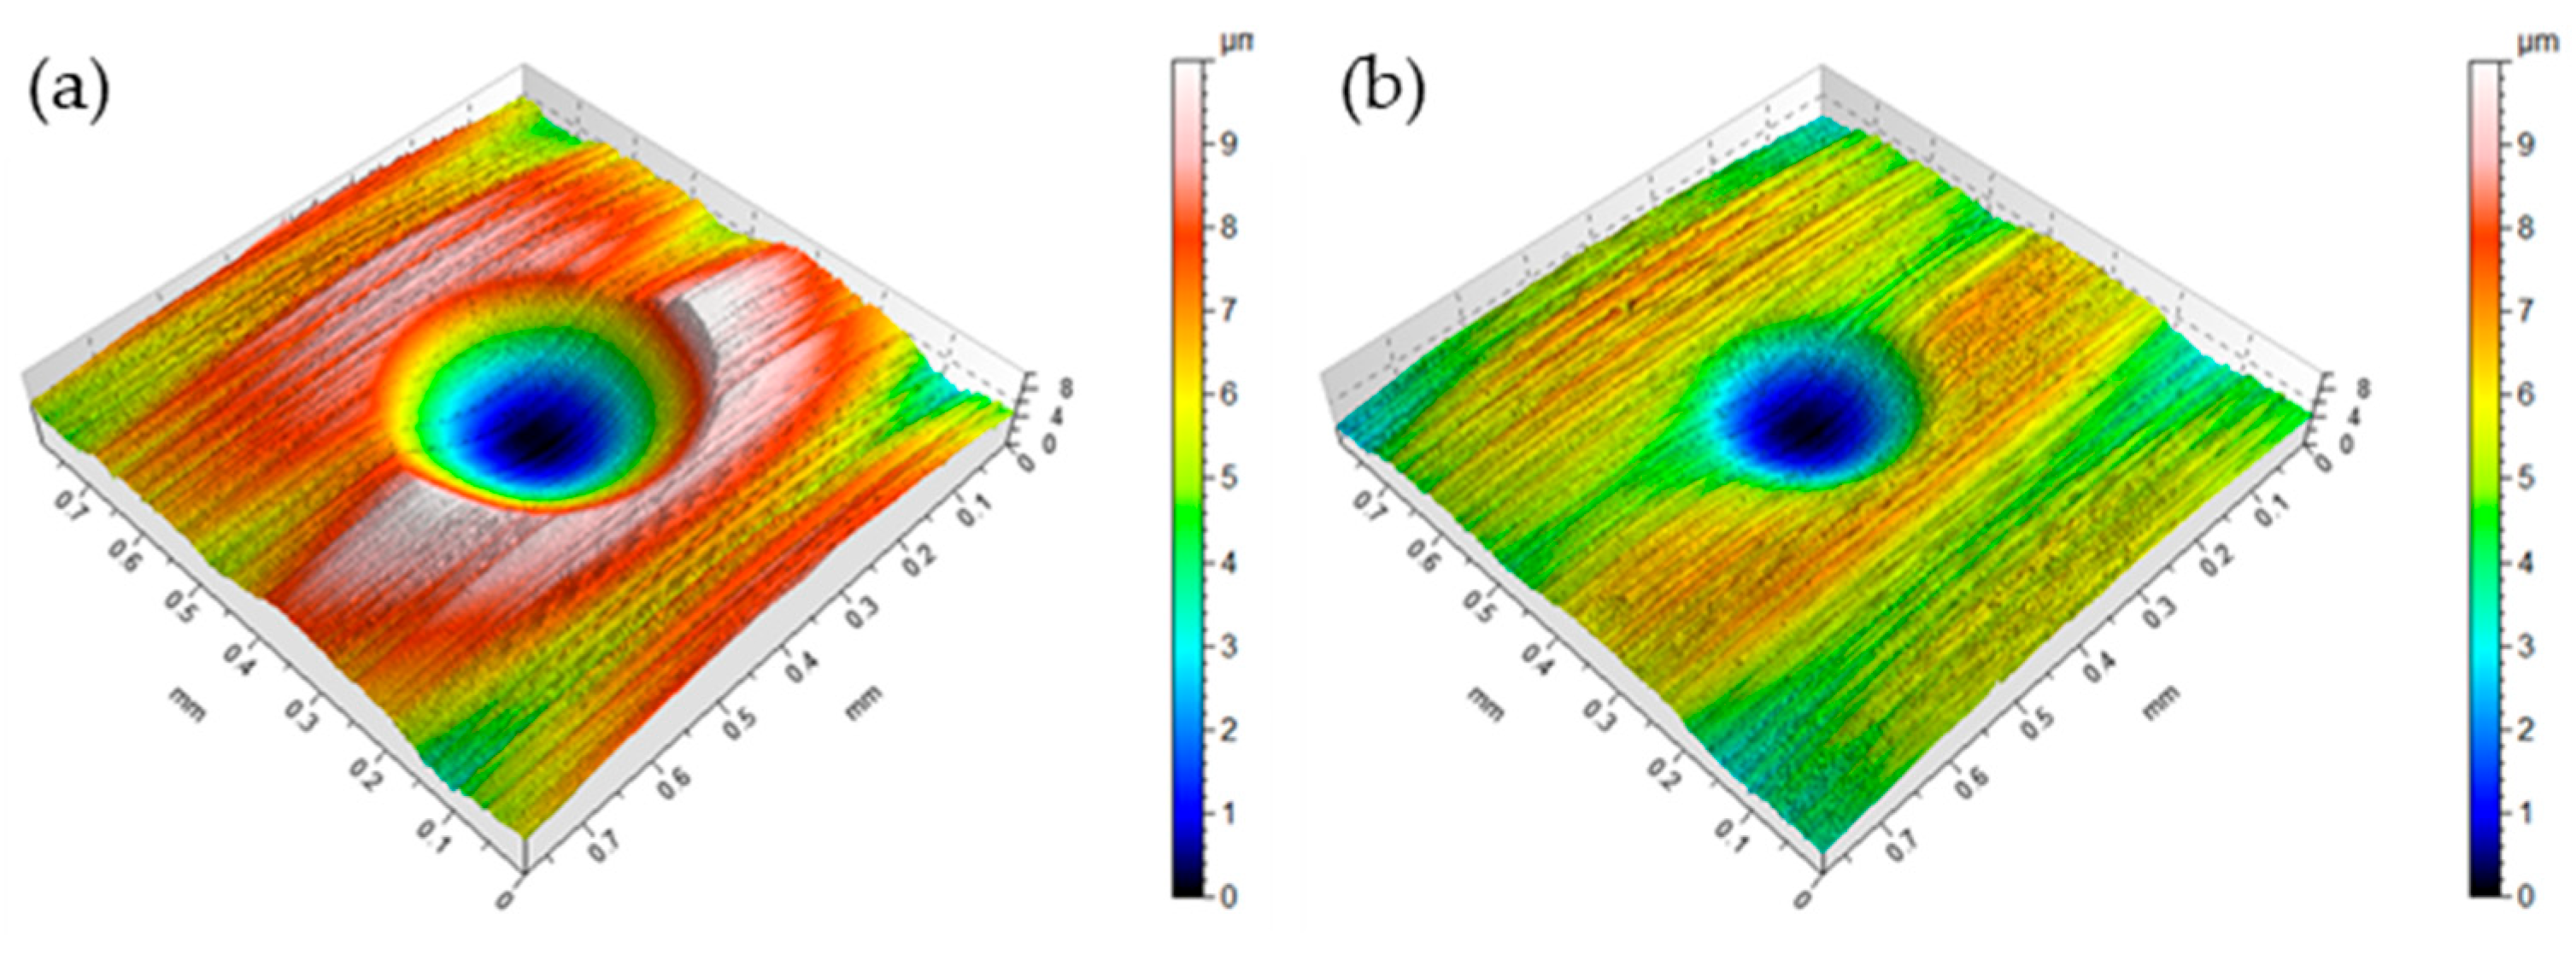
Figure 13 shows a 3D comparison of the indentation heights before the wear test in the same disc sample for the center, left, and right indentations.
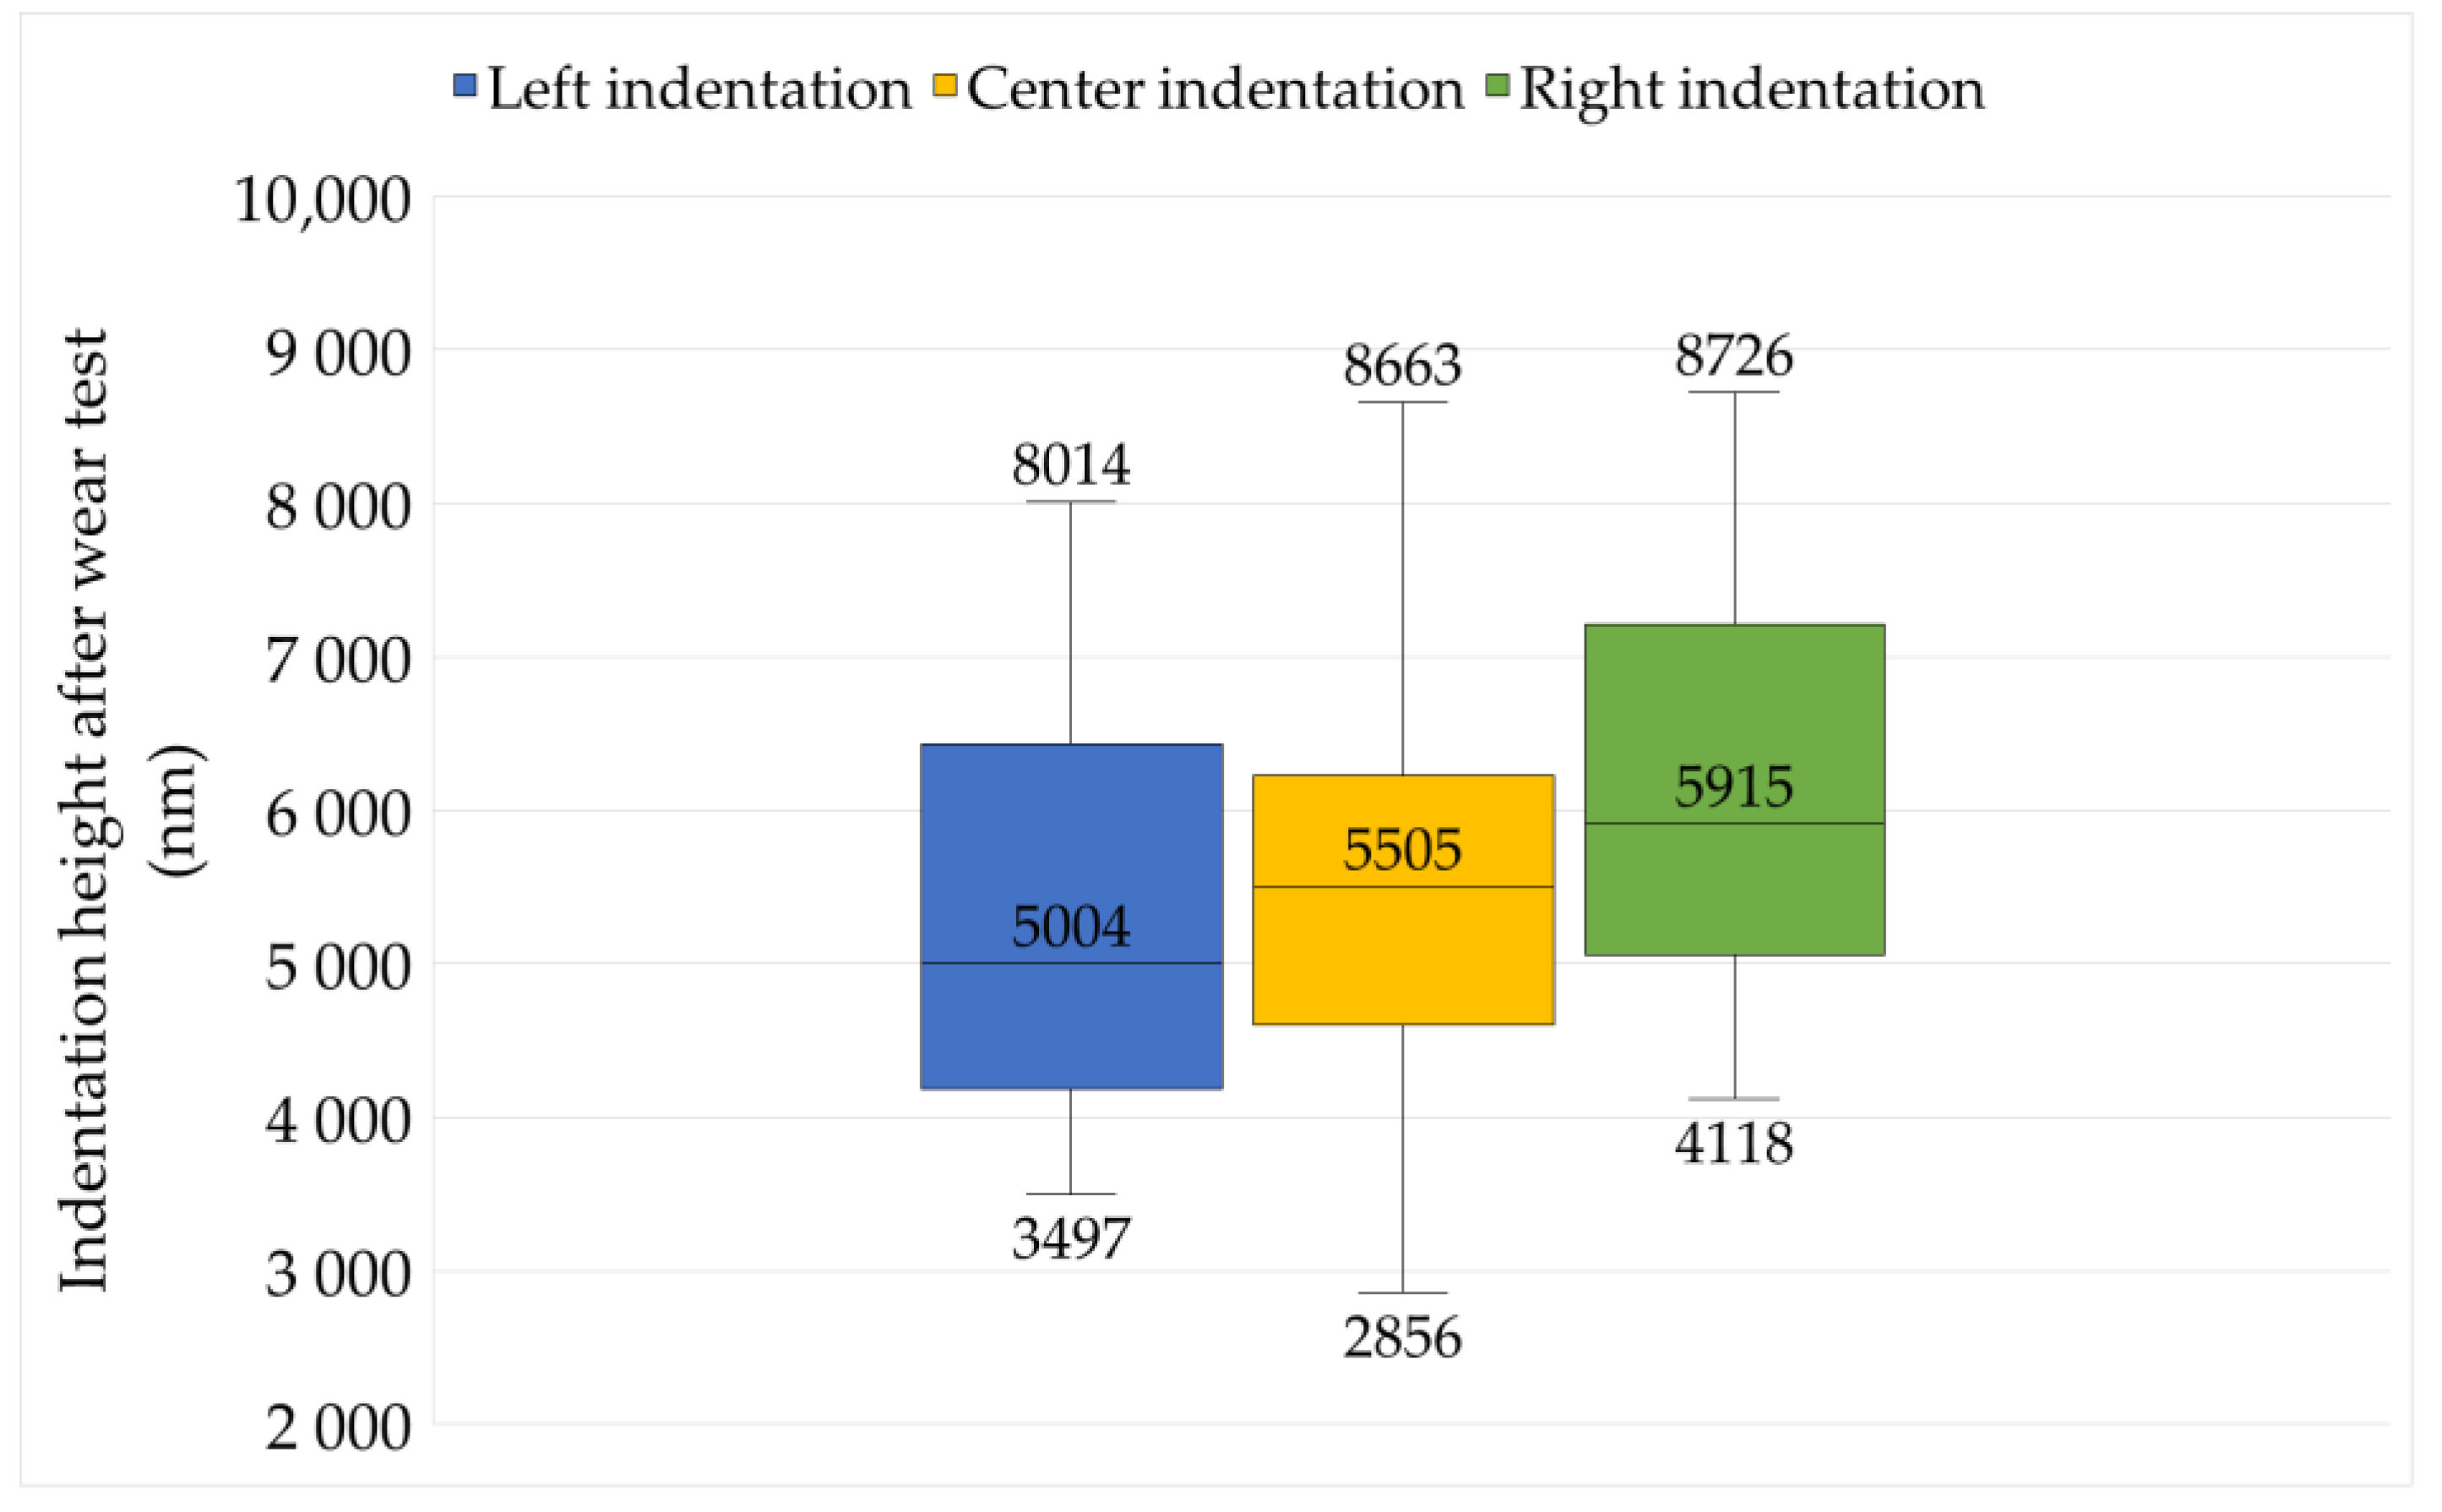
Considering the same three groups, the ANOVA for the variable “height after the wear test” (Figure 14) resulted in a significance level of p = 0.32. As p > 0.05, the null hypothesis was again accepted, confirming no statistically significant difference between the groups after the wear test.
Figure 15 presents a 3D comparison of the center, left, and right indentation heights in the same disc sample after the wear test.
A paired Student’s t-test was conducted to compare the indentation heights before and after the wear test (Figure 16), yielding a significance level of p = 0. As p < 0.05, the null hypothesis was rejected, indicating a statistically significant difference between the indentation heights before and after the wear test.
Figure 17 illustrates a 3D comparison of the same indentation before and after the wear test.

4. Conclusions

This study revisited a methodology for the evaluation of low wear rates in laboratory-scale wear tests. This approach integrates spherical indentation marks as reference points with 3D interferometry to quantify material loss with high precision in order to address the limitations of conventional techniques such as mass loss measurements and AZW methods. Unlike mass loss measurements, which lack sensitivity under low-wear conditions, and AZW, which can suffer from positioning errors, this method offers an accurate and reproducible means of quantifying low amounts of material removal based on widely available and consolidated methods and equipment commonly found in tribology labs.
The limitation of AZW based on surface roughness changes was supported by our findings regarding significant variability in surface topography parameters before and after a wear test, with changes in Ssk ranging from 18% to 1245%. Such variability suggests that the surface roughness is not uniform and predictable, potentially introducing substantial errors in AZW via interferometry measurements only.
The statistical validation confirmed the reproducibility and reliability of the proposed method. The descriptive analysis demonstrated that the sample size was statistically sufficient (>14) and that the indentation height measurements were normally distributed. The hypothesis testing indicated no significant variation between indentation positions (left, center, and right) before or after testing, which confirmed the uniformity of the indentation process and consistency in sample preparation. A paired t-test revealed a statistically significant reduction in indentation height, with an average decrease of approximately 35%, demonstrating the methodology’s effectiveness in detecting subtle wear patterns. Using alumina sandpaper as a counterbody allowed for a controlled environment and simplified the wear conditions for the initial validation of the method. This simplification reduces some of the complexity of real-world TBM operations and helps to achieve the objective of accelerating wear while maintaining an isolated abrasion wear mechanism.
These findings highlight the potential of this lab-scale setup as a robust and precise alternative for quantifying low wear. This method contributes to advancing tribological research and wear analysis by providing a more sensitive and reproducible technique for assessing low wear rates, offering a pathway to improving TBM cutter disc performance, and achieving potential cost savings in industrial applications.

Author Contributions

Conceptualization, G.R.P. and T.M.Z.; methodology, T.M.Z. and J.M.H.-O.; validation, G.R.P., T.M.Z. and J.M.H.-O.; data curation, T.M.Z.; writing—original draft preparation, G.R.P. and G.P.; writing—review and editing, G.R.P. and G.P.; supervision, G.P.; project administration, G.P.; funding acquisition, G.R.P. and G.P. All authors have read and agreed to the published version of the manuscript.

Funding

This research was funded by CNPq (grant numbers 403532/2020-5 and 310523/2020-6).

Data Availability Statement

All acquired data are available in this paper. The data were processed directly without manipulation beyond standard statistical methods to ensure the reliability of the results.

Acknowledgments

The authors acknowledge the CMCM (Multiuser Characterization Center for Materials) at UTFPR for performing the interferometry measurements. They are also grateful to Passarelli Engenharia e Construção Ltda. for supplying the samples.

Conflicts of Interest

The authors declare no conflicts of interest. The funders had no role in the design of the study; in the collection, analyses, or interpretation of the data; in the writing of the manuscript; or in the decision to publish the results.

References

  1. Su, W.; Li, X.; Jin, D.; Yang, Y.; Qin, R.; Wang, X. Analysis and prediction of TBM disc cutter wear when tunneling in hard rock strata: A case study of a metro tunnel excavation in Shenzhen, China. Wear 2020, 446–447, 203190. [Google Scholar] [CrossRef]
  2. Janc, B.; Vižintin, G. Investigation of Disc Cutter Wear in Tunnel-Boring Machines (TBMs): Integration of Photogrammetry, Measurement with a Caliper, Weighing, and Macroscopic Visual Inspection. Appl. Sci. 2024, 14, 2443. [Google Scholar] [CrossRef]
  3. Li, B.; Zhang, B.; Hu, M.; Liu, B.; Cao, W.; Xu, B. Full-scale linear cutting tests to study the influence of pre-groove depth on rock-cutting performance by TBM disc cutter. Tunn. Undergr. Space Technol. 2022, 122, 104366. [Google Scholar] [CrossRef]
  4. Deng, L.; Zhuang, Q.; Li, X.; Yuan, Y. Development and application of a full-scale mechanical rock-cutting platform for measuring the cutting performance of TBM cutter. Measurement 2022, 204, 112036. [Google Scholar] [CrossRef]
  5. Hamzaban, M.; Jamal, R.; Dahl, F.; Francisco, J.; Macias, J. Wear of Cutting Tools in Hard Rock Excavation Process: A Critical Review of Rock Abrasiveness Testing Methods. Rock Mech. Rock Eng. 2022, 56, 1843–1882. [Google Scholar] [CrossRef]
  6. Sun, R.; Mo, J.; Zhang, M.; Su, Y.; Zhou, Z. Cutting performance and contact behavior of partial-wear TBM disc cutters: A laboratory scale investigation. Eng. Fail. Anal. 2022, 137, 106253. [Google Scholar] [CrossRef]
  7. Blau, P.J. Applications of Microindentation Methods in Tribology Research. In Microindentation Techniques in Materials Science and Engineering; STP889-EB; ASTM International: West Conshohocken, PA, USA, 1985. [Google Scholar] [CrossRef]
  8. Ruff, A.W. Wear measurements. In ASM Handbook: Friction, Lubrication, and Wear Technolog; ASM International: Novelty, OH, USA, 1992; Volume 18, pp. 184–190. [Google Scholar]
  9. Valigi, M.C.; Logozzo, S.; Affatato, S. New challenges in tribology: Wear assessment using 3D optical scanners. Materials 2017, 10, 548. [Google Scholar] [CrossRef] [PubMed]
  10. Maculotti, G.; Goti, E.; Genta, G.; Mazza, L.; Galetto, M. Uncertainty-based comparison of conventional and surface topography-based methods for wear volume evaluation in pin-on-disc tribological test. Tribol. Int. 2022, 165, 107260. [Google Scholar] [CrossRef]
  11. Cousseau, T.; Passos, A.G. Methodology for wear mapping error quantification. Ind. Lubr. Tribol. 2020, 72, 1043–1050. [Google Scholar] [CrossRef]
  12. Obara, R.B.; Sinatora, A. Quantification of cylinder bores almost ‘zero-wear’. Wear 2016, 364–365, 224–232. [Google Scholar] [CrossRef]
  13. McKee, A.A. An Indentation Method for Measuring Wear; Research Paper RP1819; U.S. Department of Commerce National Bureau of Standards: Gaithersburg, MD, USA, 1947; Volume 39.
  14. Begelinger, A.; De Gee, A. Wear measurements using Knoop diamond indentations. Wear 1977, 43, 259–261. [Google Scholar] [CrossRef]
  15. Vander Voort, G.F. Operator Errors in the Measurement of Microindentation Hardness; ASTM International: West Conshohocken, PA, USA, 1989. [Google Scholar]
  16. Reichelt, M.; Cappella, B. Comparative analysis of error sources in the determination of wear volumes of oscillating ball-on-plane tests. Front. Mech. Eng. 2020, 6, 25. [Google Scholar] [CrossRef]
  17. She, L.; Zhang, S.R.; Wang, C.; Wu, Z.Q.; Yu, L.C.; Wang, L.X. Prediction model for disc cutter wear during hard rock breaking based on plastic removal abrasiveness mechanism. Bull. Eng. Geol. Environ. 2022, 81, 432. [Google Scholar] [CrossRef]
  18. Milan, J.C.; Carvalho, M.A.; Xavier, R.R.; Franco, S.D.; De Mello, J.D. Effect of temperature, normal load and pre-oxidation on the sliding wear of multi-component ferrous alloys. Wear 2005, 259, 412–423. [Google Scholar] [CrossRef]
  19. ImageJ Web Site. Available online: https://imagej.net/ij/ (accessed on 10 September 2024).
  20. Alcar. Guide Alcar. 2024. Available online: https://alcar.com.br/wp-content/uploads/2024/07/Catalogo_Alcar_NOVO.pdf (accessed on 15 September 2024).
  21. ASTM Standard E10. Standard Test Method for Brinell Hardness of Metallic Materials. 2018. Available online: https://doi.org/10.1520/E0010-18 (accessed on 23 September 2024). [CrossRef]
  22. R Core Team. R: A Language and Environment for Statistical Computing; R Foundation for Statistical Computing: Vienna, Austria, 2019; Available online: www.r-project.org (accessed on 6 July 2024).
  23. Fox, J.; Weisberg, S. An {R} Companion to Applied Regression; Sage: Thousand Oaks, CA, USA, 2019; Available online: https://socialsciences.mcmaster.ca (accessed on 6 July 2024).
  24. Lüdecke, D.; Ben-Shachar, M.S.; Patil, I.; Makowski, D. Extracting, Computing and Exploring the Parameters of Statistical Models using {R}. J. Open Source Softw. 2020, 5, 2445. [Google Scholar] [CrossRef]
  25. Gahlin, R.; Jacobson, S. The particle size effect in abrasion studied by controlled abrasive surfaces. Wear 1999, 224, 118–125. [Google Scholar] [CrossRef]
  26. Mehl, A.C.; Benegra, M.; Pintaude, G. Surface characterization of the seating platform of titanium implant processed with different textures. J. Braz. Soc. Mech. Sci. Eng. 2021, 43, 130. [Google Scholar] [CrossRef]
  27. Duo, Y.; Tang, J.; Zhao, Z.; Shengyu, Y.; Li, G.; Zhu, G. Discrimination of wear performance based on surface roughness parameters arithmetic mean height (Sa) and skewness (Ssk). Wear 2024, 548, 205397. [Google Scholar] [CrossRef]
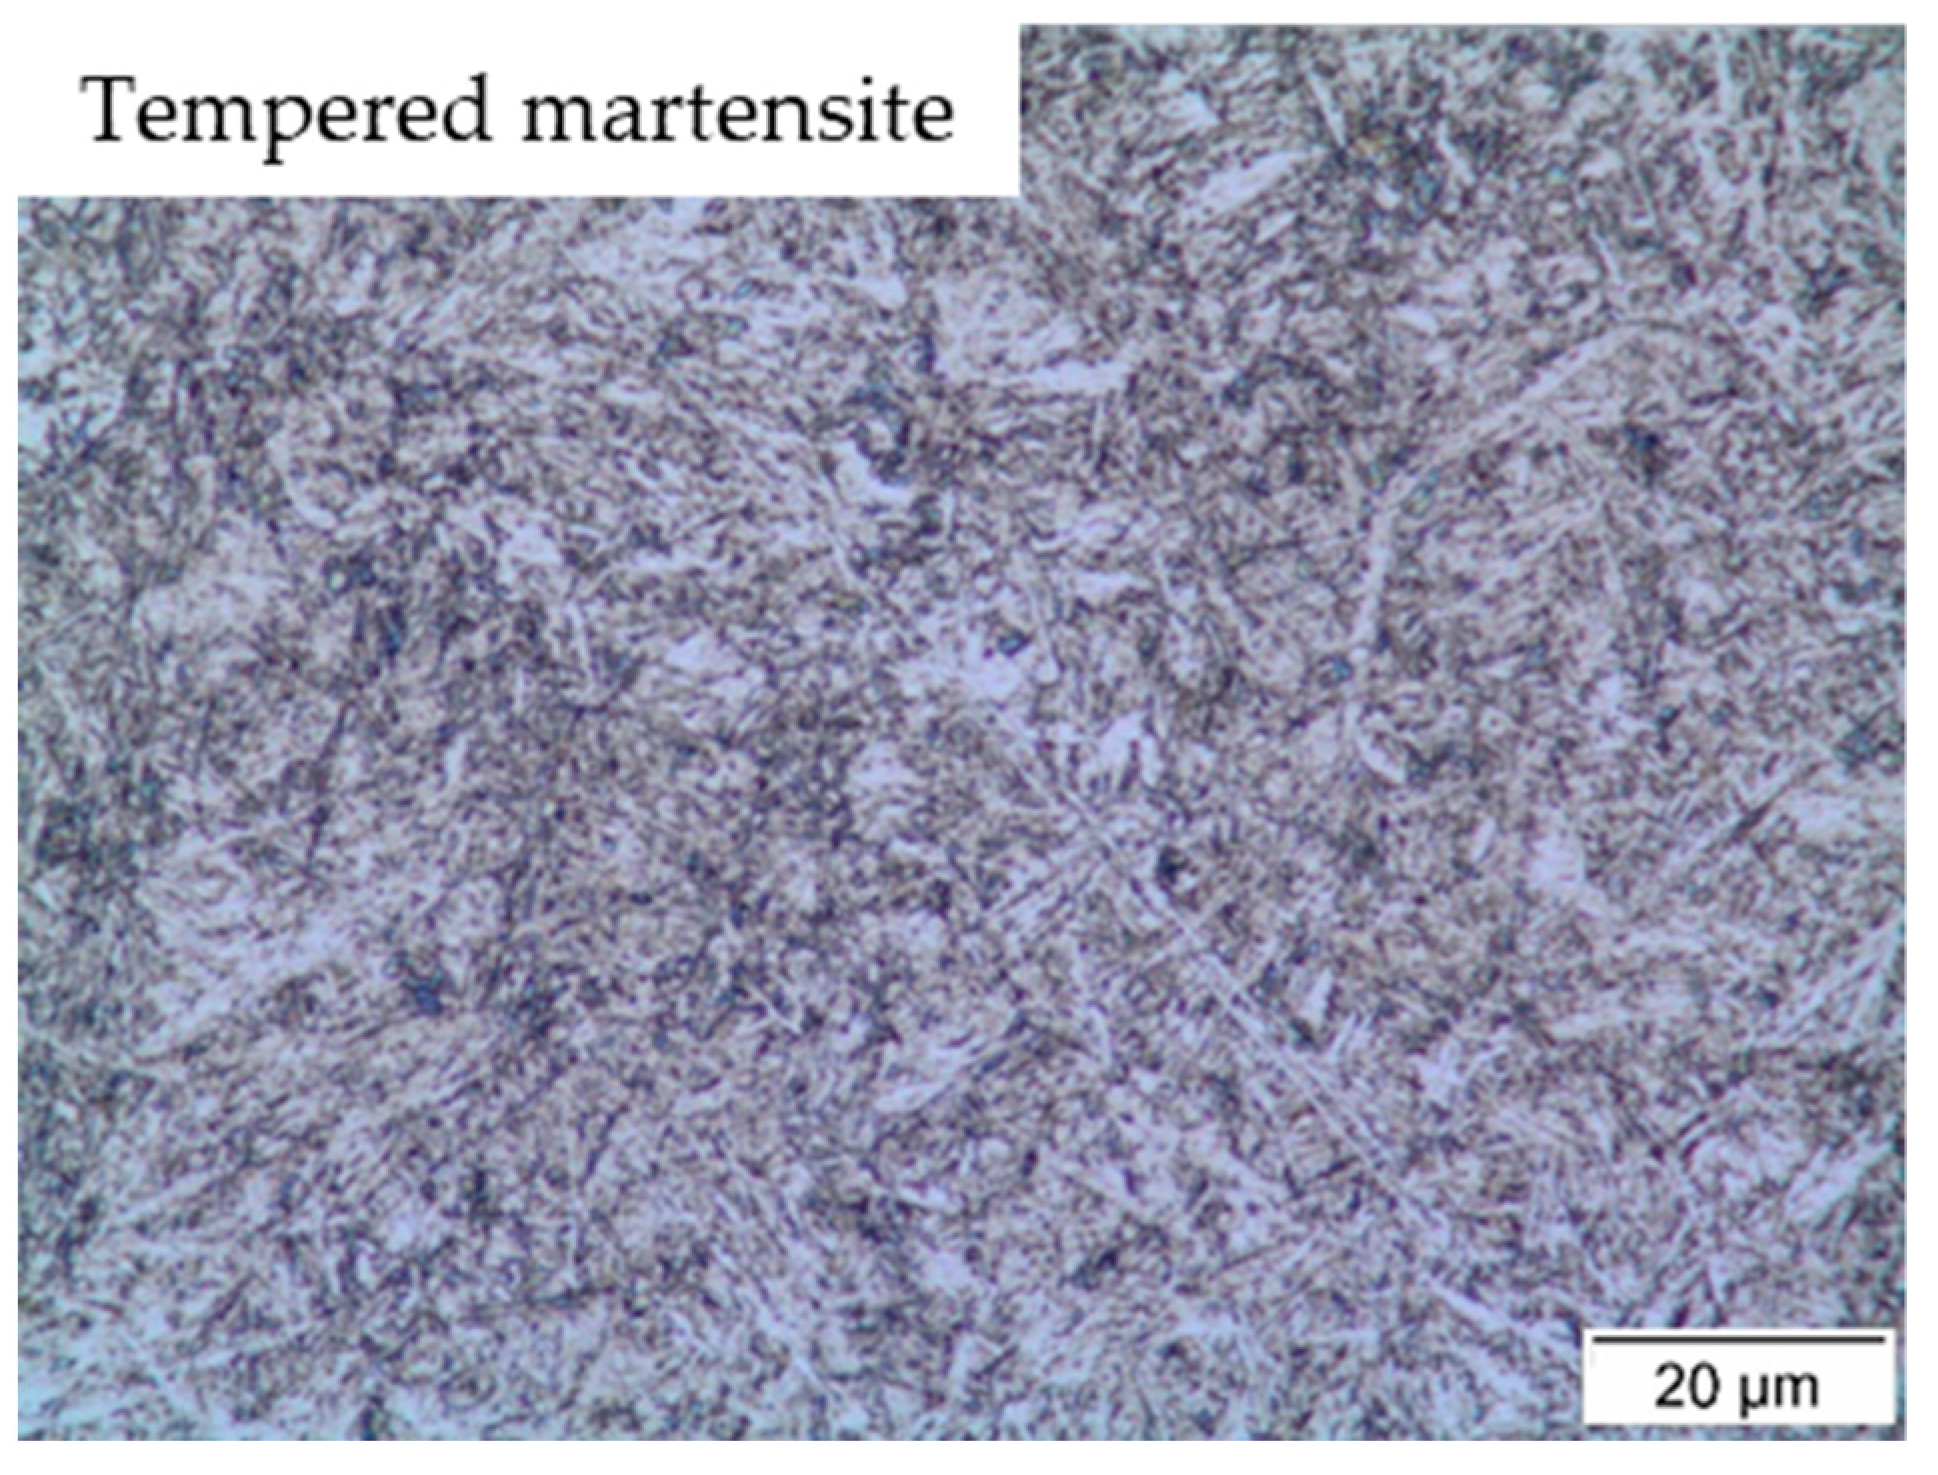
Figure 1. Tempered martensite microstructure of the tool steel of the disc cutter.
Metrology 05 00035 g001
Figure 2. Setup of the reciprocating wear test.
Metrology 05 00035 g002
Figure 3. (a) Geometry of the disc cutter indicating segmentation; (b) details of the disc cutter segment; (c) the final geometry of the sample and identification of the contact area for the wear test.
Metrology 05 00035 g003
Figure 4. SEM image of the alumina sandpaper with 1000× magnification.
Metrology 05 00035 g004
Figure 5. Top view of the disc sample with three indentation marks.
Metrology 05 00035 g005
Figure 6. Three-dimensional topography and profile of indentation marks created with different applied loads: (a) 30 N, (b) 60 N, and (c) 100 N. All images have the same scale.
Metrology 05 00035 g006
Figure 7. (a) Screenshot of the software screen for the determination of the horizontal and vertical cross-sectional areas of an indentation. (b) Mean horizontal profile. (c) Mean vertical profile.
Metrology 05 00035 g007
Figure 8. Determination of the maximum depth of the indentation using the “under the water line” calculation.
Metrology 05 00035 g008
Figure 9. Sandpaper after the wear test.
Metrology 05 00035 g009
Figure 10. Ssk–Sku map for (a) before the wear test and (b) after the wear test.
Metrology 05 00035 g010
Figure 11. Comparison between contact area outside the indentations (a) before the wear test and (b) after the wear test for the sample with the highest Ssk variation (1245%). All images have the same scale.
Metrology 05 00035 g011
Figure 12. Box plot for “indentation height before wear test” for the three groups (left, center, and right).
Metrology 05 00035 g012
Figure 13. Comparison between the (a) left (ID 22), (b) center (ID 24), and (c) right (ID 23) indentations in the same sample before the wear test. All images have the same scale.
Metrology 05 00035 g013
Figure 14. Box plot for “indentation height after wear test” for the three groups (left, center, and right).
Metrology 05 00035 g014
Figure 15. Comparison between the (a) left (ID 1), (b) center (ID 3), and (c) right (ID 2) indentations in the same sample after the wear test. All images have the same scale.
Metrology 05 00035 g015
Figure 16. Box plot for comparison between indentation height before and after the wear test.
Metrology 05 00035 g016
Figure 17. Comparison of the same indentation (ID 48) (a) before and (b) after the wear test. The images have the same scale.
Metrology 05 00035 g017
Table 1. Chemical composition of disc cutter sample * (equivalent to AISI H13 steel), in % wt.
CSiMnCrMoVW
0.4510.9880.3555.4821.1450.8710.149
* Fe: balance; P and S < 0.015.
Table 2. Indentation data, including test parameters and height measurements, were recorded before and after the wear test.
Indentation (ID)Position 1Mean Area (mm2)Applied Force (N)Height Before (nm)Height After (nm)
1L57.0685.6074984668
2R57.0685.6082635847
3C57.0685.6071104996
4L61.2691.8981344585
5R61.2691.8997927921
6C61.2691.8972974701
7L50.6075.9077396530
8R50.6075.9069544709
9C50.6075.9084934760
10L63.0494.5681187886
11R63.0494.5688278726
12C63.0494.5610,0698663
13L56.5384.8042934138
14R56.5384.8010,1604130
15C56.5384.8067275507
16L54.3181.4610,0467539
17R54.3181.4686425177
18C54.3181.4690916562
19L57.9086.8677444648
20R57.9086.8681045982
21C57.9086.8686436342
22L64.2596.3710,0255340
23R64.2596.3777786716
24C64.2596.3790415881
25L51.6377.4447603497
26R51.6377.4465676365
27C51.6377.4473604556
28L60.9391.4099158014
29R60.9391.4091855122
30C60.9391.4072234108
31L57.4886.2245244317
32R57.4886.2267364376
33C57.4886.2210,0167397
34L54.8382.2411,0376156
35R54.8382.2411,0217243
36C54.8382.2410,0802856
37L58.9088.3579033727
38R58.9088.3572227360
39C58.9088.3582586503
40L65.2597.8883157469
41R65.2597.8882375428
42C65.2597.8876775503
43L52.6378.9562773968
44R52.6378.9576977127
45C52.6378.9580165629
46L62.9394.4086435451
47R62.9394.4097787689
48C62.9394.4073124282
49L58.4887.7283235613
50R58.4887.7287764118
51C58.4887.7279665613
52L55.8383.7570593591
53R55.8383.7575215033
54C55.8383.7568164569
1L57.0685.6074984668
2R57.0685.6082635847
3C57.0685.6071104996
4L61.2691.8981344585
5R61.2691.8997927921
6C61.2691.8972974701
7L50.6075.9077396530
8R50.6075.9069544709
9C50.6075.9084934760
10L63.0494.5681187886
11R63.0494.5688278726
12C63.0494.5610,0698663
1 L: left indentation; R: right indentation; C: center indentation.
Table 3. Statistical summary of height measurements before and after the wear test.
VariableMedian (nm)Average (nm)Mode (nm)SD 1 (nm)CV 2CI 3 Min 95%CI Max 95%E 4 (nm)
Before test8110864381261455.217.97737.98514.2776.3
After test5477561356411429.625.35260.06022.7762.6
1 Standard deviation; 2 coefficient of variation; 3 confidence interval; 4 error.
Table 4. Shape analysis of data distribution and distribution classification for height measurements before and after the wear test.
VariableKurtosisSkewnessSig (p)Distribution
Before test0.6117−0.35020.0913Normal
After test−0.68780.37410.1424Normal
Disclaimer/Publisher’s Note: The statements, opinions and data contained in all publications are solely those of the individual author(s) and contributor(s) and not of MDPI and/or the editor(s). MDPI and/or the editor(s) disclaim responsibility for any injury to people or property resulting from any ideas, methods, instructions or products referred to in the content.