Abstract
The structural resolution describes the ability of a measuring device to detect small structures on the surface of a component or test specimen by means of a quantitative value. However, the structural resolution in the computer tomograph depends on the object and must therefore be determined separately for each measurement task. The previous approaches to structural resolution determination are only related to test specimens. In this paper, less discrete approaches based on a circular pattern are presented, which can be integrated into the measured component. A voxel-based methodology as well as two surface-based methodologies are described. The investigation results regarding the effect of the component position on the structural resolution are obtained on the basis of real CT measurements. A comparison is also completed with the well-known hourglass method. The results show that the resolution depends on the object being measured, with similar values being obtained for the same object using different methods.
1. Introduction
The metrological structural resolution (MSR) is known in dimensional metrology as the quantity at which small surface structures can just be detected dimensionally [1,2,3]. Applied to X-ray computed tomography (CT), the MSR describes the smallest dimensionally detectable quantity that can still be determined at the end of the dimensional measurement chain on a test specimen. This measurement chain consists of radiographic imaging, reconstruction, and surface determination. Unlike in the medical field, where the focus is on visual diagnostics, industrial CT usually uses threshold-based surface determination [4], which makes repeatable dimensional measurements on the surface possible. Other resolutions, whose definitions are described in detail in V.-Gomez et al. [5], are defined in the previous steps within the measurement chain. For example, the voxel size, which describes the optical magnification, is determined when the radiographic image is generated. Any limitations within the measurement chain also limit the dimensional detectability and thus the MSR of a CT system. For the determination of the MSR, approaches already exist, such as the detectability of the smallest and shortest sinusoidal structures on an insulated surface [6,7,8]. In the Guideline VDI/VDE 2630 sheet 1.3, which refers to CT-based coordinate measuring systems, the structural resolution is defined as the diameter of the smallest sphere that can just be measured [2]. Another approach based on spheres is proposed by the University of Padova. They use two spheres of equal nominal diameter D touching each other, whereby the diameter d of the extended contact zone resulting in the CT measurements is associated with the structural resolution [9]. This specimen with two spheres is often called an hourglass because of the shape of the reconstructed volume. The analysis method was developed by Carmignato et al. [10] and was also extended to the detectability of the distances between two opposing surfaces and thus interface structural resolution (ISR) [3,11,12] by Zanini and Carmignato [13]. Although various studies exist on defined gap distances [14,15,16,17], it is mainly the hourglass that finds acceptance for the detectability of opposing surfaces. One reason for this is the fact that it is a test specimen, which, due to its continuous surface distances, does not only record discrete resolution values, as is the case when examining individual sphere diameters or different-sized stripe patterns and the simplicity of the material standard. However, the hourglass specimen and the associated evaluation are also viewed critically in the scientific community due to the observable non-negligible dependence of the resolution on the sphere size [18]. Therefore, alternative approaches that also evaluate the surface and intermediate surface detectability using a Siemens star for the purpose of resolution determination are presented below. The Siemens star used is located on the MicroCT-Barpattern-NANO Phantom [19] from QRM GmbH (Möhrendorf, Germany), which was extensively analyzed by Weiss [20] using CT. However, no statement was made on the structural resolution using the Siemens star (Figure 1a).
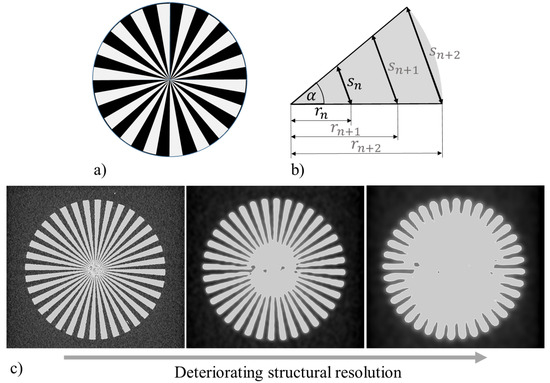
Figure 1.
(a) Siemens star; (b) model of a segment (air or material) of a Siemens star with dimensional dependence of the chord length on the circle angle alpha and the star radius section; (c) sectional view of a Siemens star in CT with deteriorating structural resolution.
2. Materials and Methods
2.1. Determination Approach
In order to test the quality of optical imaging systems, a test pattern and test procedure were developed by the company Siemens in the last century. The Siemens star was originally a two-dimensional test object with alternating white and black sectors of the same angular size in a circle. In surface metrology, three-dimensional Siemens stars have been used to quantify the structural resolution of optical surface measuring devices [21]. Our practical approach is based on the use of a three-dimensional Siemens star (Figure 1a) for the determination of a combined structural resolution depending on the surface contours of the star pattern and thus for both MSR, which refers to a single surface, and ISR, which refers to multiple surfaces. This type of pattern is usually used for the visual assessment of spatial resolution [14,22] and does not exclude the case of several interacting surfaces, as in [8]. Like the hourglass, the test pattern contains continuously increasing upper and intermediate surface distances (Figure 1b), whose recognizability decreases as the structural resolution deteriorates (Figure 1c).
When transferring the resolution definition to the star test pattern, the structural resolution corresponds to the length of the chord s of the circle sector as a function of the used radius r from the star center at which a differentiation between material and air is possible and is calculated according to Equation (1), where is the segment dimension in degrees, which are evenly distributed over 360°.
By using the hourglass method described in [10], two spheres with the diameter D stacked in a tube were measured in the CT system. The point at which the two spheres touch each other is shown larger after the CT measurement and surface determination (Figure 2), which is attributed to the structural resolution of the CT system or the measuring chain. The extent diameter d of the contact point is determined using a Gaussian circle. The actual distance h between the spheres at the position of the diameter is determined according to Equation (2). The hourglass method therefore also follows the approach of calculating the dimension at which a distance h between two surfaces is recognized for the first time.
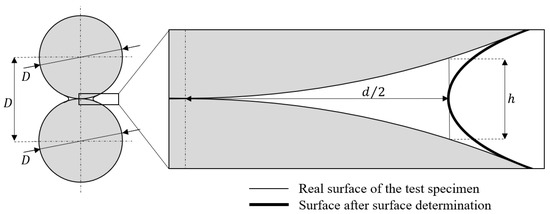
Figure 2.
Expanded zone of the touching point of the two spheres of the hourglass [13].
2.2. Specimen and Setup
2.2.1. Specimen
The test specimen used was the QRM-MicroCT-Barpattern-NANO Phantom (QRM GmbH, Möhrendorf, Germany) in its second version (Figure 3), which is a modified miniturized variant of the form published by Langner et al. [14]. The phantom houses 2 silicon chips, each with the size of 2.96 mm × 2.96 mm × 0.675 mm (Figure 3a). The surface is covered with more lines and point patterns with structure sizes of 1–10 µm by a not homogeneous structure depth of 5–15 µm specified by the manufacturer, presumably due to the technical limitations in manufacturing with the given aspect ratio. Two Siemens stars—36 actinomorphic star test pattern—have a diameter of 400 µm and thus a chord length decreasing from 17.5 µm (Figure 3b). One of these actinomorphic stars was used to determine the resolution. The corresponding line patterns of the test specimen were used for visual comparison of the resolution results.
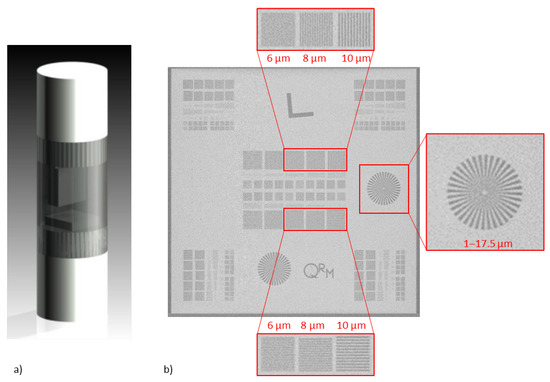
Figure 3.
(a) QRM-MicroCT-Barpattern-NANO Phantom consisting of two silicon chips placed at right angles inside a protective housing (image courtesy of QRM GmbH); (b) reconstructed slice with pattern sizes in µm of the scanned QRM Phantom (CT scan with 3.4 µm voxel size).
2.2.2. XCT System and Settings Used
The specimen was measured in vertical orientation (Figure 3a) using a Carl Zeiss Industrielle Messtechnik GmbH (Oberkochen, Germany) Metrotom 1500 225 kV-CT. For the investigations, we conducted CT scans with the following parameter settings in Table 1.

Table 1.
Experimental settings for the measurements of the specimens.
The measurements were carried out partly at intervals of 4 months and between calibrations, adjustments, and maintenance. Volume alignment and surface determination were carried out in VGStudio MAX 2023.3 (Volume Graphics GmbH, Heidelberg, Germany). Data were further analyzed using the software MATLAB R2022b (The MathWorks, Inc., Natick, MA, USA).
2.3. Methodologies
Three slightly different methods were designed to test the approach. Method 1 uses the voxel information of a single sectional image through the Siemens star, while Method 2 and Method 3 use an extracted surface mesh in Standard Triangulation Language (STL) format [23], which contains the pattern of the Siemens star completely. Various methods were used for surface extraction in order to take this influence on structural resolution into account.
2.3.1. Method 1
The further CT data processing procedure starting from the reconstructed volume data set was divided into several steps (Figure 4). In the first step, the ISO50 threshold [24] was determined, which was obtained from gray value histogram of the reconstructed volume based on the peaks [25]. The specimen was oriented over 3 orthogonally lying surfaces of the vertically oriented chip for fine alignment. The orientated volume data were then exported using DICOM (Digital Imaging and Communications in Medicine [26]) image files, which contain information on the voxel size. For the subsequent evaluation, however, only the image file and thus a single layer were used in which the structures were best visually recognizable. Using the software MATLAB, a square area outlining the Siemens star pattern was identified as the region of interest. Then, a threshold variation between the background peak and material peak was applied, proceeding through the following steps for each threshold used: Calculation of a centroid area of the respective resulting star geometry. Starting from the centroid of the surface, circumferential line profiles (each sampled with 6000 data points) were created over 360° and the number of peaks of the digitized curve was summed, whereby the stopping criterion was set arbitrarily at 34 of 36 peaks (corresponds to a lower detection limit of 94.4%). The resolution for the threshold configuration was set according to Equation (1) and the radius at which the termination criterion applied. Finally, the best possible resolution-describing value from the measurement series was used. This was supplemented by the resolution description obtained using the ISO50 threshold.
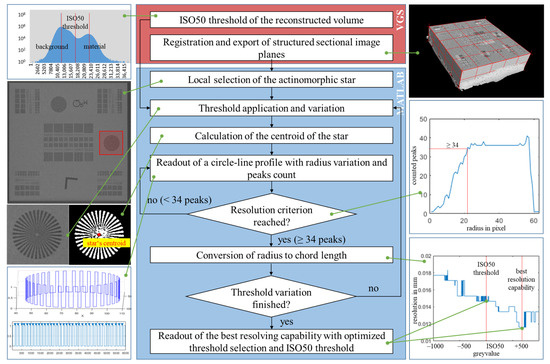
Figure 4.
Schematic procedure for determining the structural resolution according to Method 1.
2.3.2. Method 2
The second method used in this study also includes several steps (Figure 5). Similar to Method 1, surface determination and registration were performed. Subsequently, a cubic region of interest (ROI) containing the Siemens star was extracted. Then, the surface determination was used, which further finalizes the dimensional measurement chain. In this case, surface determination was performed using the ISO50 threshold value. Additionally, an extended gradient-based iterative variant started with ISO50 and utilized a voxel search beam length of 4 voxels. Subsequently, an ROI of the surface was formed and extracted as STL. A grid-based mesh with a resolution of 0.5 µm was created during the investigations. After importing the data into MATLAB, the star was trimmed around the edge areas in a plane and the contour center of gravity was determined layer by layer, from which the radial evaluations were then also determined layer by layer. Since there is no gray value information in Method 2, the transitions of the surfaces were determined circumferentially, 72 for the star. The termination criterion for the detection of transitions was set at a minimum of 68 counted transitions, which also corresponds to 94.4%. In the end, the highest resolution of all layers was used, which was calculated for the found radius according to Equation (1).
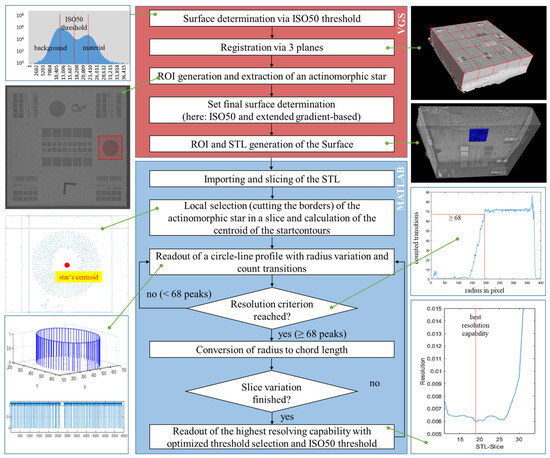
Figure 5.
Schematic procedure for determining the structural resolution according to Method 2.
2.3.3. Method 3
In Method 3 (Figure 6), the first steps are the same as in Method 2, which include importing and separating into individual cross-sections. The center of gravity was also determined by calculating the contour center of gravity, but now one single averaged center of gravity was calculated over all considered slices. All slices were included in which the Siemens star showed minimal to low surface artifacts in the immediate surroundings up to the sectional image in which the resolution visibly degrades. As with Method 2, circular profile lines were drawn for all layers starting from the center of gravity. In order to generate a single slice that contains all the essential information of the slices considered, we started from a slice close to the surface and selected the star-defining edges and thus material transitions where they appear first since the inner, less deep star structures are no longer present in deeper slices. Then, the contours between 2 segments are separated. The distance to the center from the first recognizable structure between the segments can then be determined. The determined length can then be used to determine the unrecognized dimension between the segments using Equation (1). Calculating the average over all calculated values of the 36 intermediate segments provides a stable result, in line with the aim of Method 3 to achieve a consistency similar to that described in [8].
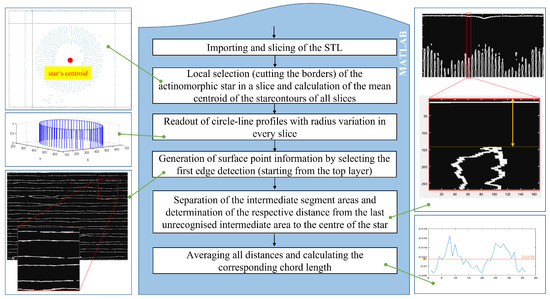
Figure 6.
Schematic procedure for determining the structural resolution according to Method 3.
3. Results
3.1. Resolution Depending on the Voxel Size
Figure 7 shows the relationship between voxel size and resolution as determined by various methods during real CT measurements. In addition, the resolution values for an hourglass with two chromium steel spheres, each with a diameter of 2 mm, were included according to the original simplified method [10], generated with the settings already described above. The individual resolution values determined vary by approximately half a voxel size. Method 1, which is based on voxels, provides the worst resolution values when using the ISO50 method. Although a voxel-based surface extraction in the field of dimensional industrial computed tomography does not correspond to the state of the art anyway, the values for the best possible resolution (best resolution) according to Method 1 are in the range in which the values of the more complex methods are also found. The resolution determinations based on Method 2 and therefore on STL data and thus taking place at subvoxel niveau provide better resolution values in general for identical measurements, whereby the slopes of the regression lines are similar. In comparison to the ISO50 method, the extended gradient-based iterative surface detection shows, for both Method 2 and Method 3, better resolution values. The best resolution values of the three methods are shown by the extended gradient-based method in combination with Method 3. In contrast to the methods using the QRM standard, the resolution values determined using the hourglass method confirm that the measurement system has a resolution capacity below the voxel size, which indicates an object-dependent resolution, as also shown by investigations in [16] on the hourglass.
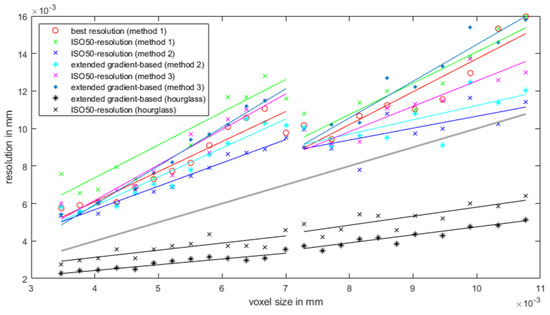
Figure 7.
Resolution values according to the determination method used.
A linear relationship between resolution and voxel size is very likely within the analyzed area (Table 2). For the first test series with a voxel size between 3.4 µm and 7 µm, the regression line’s coefficient of determination R2 is predominantly over 90%. Only Method 1 with ISO50 surface detection performs less efficiently compared to the other methods in this test series. The coefficients of determination of the second test series, spanning voxel sizes from 7 µm to 10.7 µm, show significantly lower values. A reason for this could be a changed X-ray source geometry after the maintenance of the X-ray target. However, as with the first test series, Method 3 performs best with gradient-based surface determination. The determination measures for the resolution values determined with the hourglass method are always below 90%, whereby the values in both test series are the same.

Table 2.
R2 for test series 1 (voxel size 3.4–7 µm) and test series 2 (voxel size 7–10.7 µm).
Overall, there is good correspondence between the resolution values and the visual recognizability of the line pattern on the QRM specimen, although, contrary to the expectations, slightly better resolutions are sometimes achieved for larger voxel sizes (Figure 8).
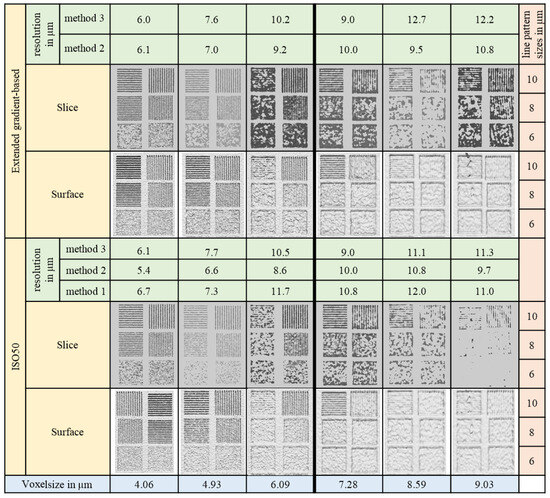
Figure 8.
Comparison of surface structures and a sectional view of the QRM test specimen with voxel sizes and determined resolution values according to the used method.
3.2. Influence of the Test Specimen Position on the Resolution Values
With constant measurement parameters and a voxel size of 6.11 µm, changes in the resolution values can be observed (Figure 9).
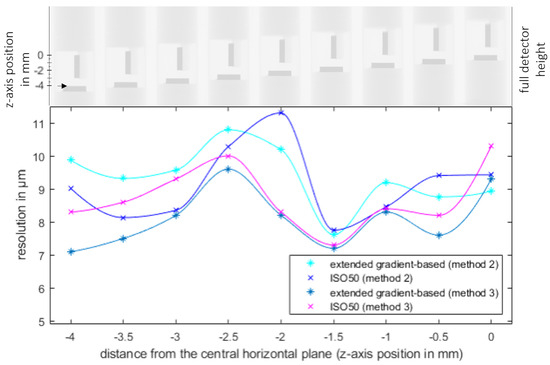
Figure 9.
Resolution values depending on the z-axis position of the horizontal Siemens star.
These are evident both as a function of the determination method and when varying the z-axis position between 0 mm and 4 mm and accordingly the alignment of the Siemens star along the horizontal plane, centered on the rotation axis. However, comparing the methods shows consistent agreement in terms of the resolution values.
4. Discussion and Conclusions
In this study, a practical approach including three methodological implementations for determining the resolution was shown. Method 1, which is based on a voxel section image, presumably shows worse resolution values due to the lack of interpolation between the gray values. However, a better-resolution result can be achieved by varying the threshold value. Method 2, which is based on surface data, includes the entire measurement chain and therefore emulates the actual implementation more closely. Method 3 provides the best resolution values and best demonstrates a linear relationship between voxel size and structural resolution. However, the resolution that can be determined depends on the manufacturing quality of the complex star pattern and can, in principle, be adapted to any component size. Compared to the proposed method, the resolution values of the hourglass are the same in these measurement series but less robust than Method 3 with gradient-based surface determination. The influence of the changed measurement conditions (offset in specimen positioning, temperature, and maintenance distance) appears to be less with the hourglass than with the QRM standard (Figure 7). However, while the hourglass is applied as both the measurement object and resolution specimen simultaneously, the defined structural resolution becomes unverifiable. It is proposed that the Siemens star pattern be integrated into any measurement object so that other features can also be analyzed, e.g., on QRM specimen by which the line patterns can be evaluated at the same time. An aspect that can lead to deviations within the methods for determining the resolution can be the identification of a surface or contour center of gravity [27]. For the rather coarse Method 1 in which only a single cross-sectional image is analyzed, there is only a slight displacement of the calculated center of gravity in the subvoxel area on the abscissa (Figure 10a) and ordinate axis (Figure 10b) around the ISO50 value and thus the relevant threshold value range. The same applies to Method 2, in which a center of gravity was determined for each sectional view on the basis of the used surface determination. In Method 2, only the resolution values of one sectional view are taken into account for the final resolution determination. Figure 11 presents a curve example where the centers of gravity, used in Method 2 and averaged across the sectional views in Method 3, fluctuate by less than 1 µm. Also, the selection of the cross-sectional images to be considered when varying the z-axis position was not always trivial due to artifacts occurring.
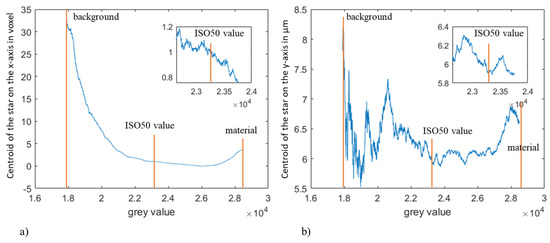
Figure 10.
Exemplary development of values of the center of gravity of the star as a function of the threshold value used in (a) the abscissa axis and (b) ordinate axis.
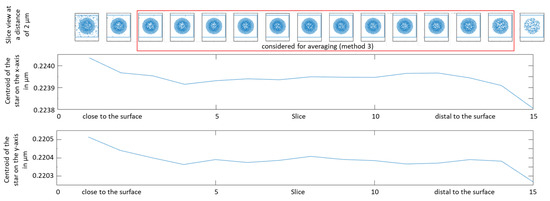
Figure 11.
Exemplary development of values of the center of gravity of the star as a function of the slice used in Method 2 and Method 3.
In principle, the even spacing of the pattern of the Siemens star and thus of the areas with and without material could also be viewed critically as no direct distinction between the MSR and ISR is possible and an overlapping of their properties cannot be ruled out. When using the methods presented, the structural resolution depends on the voxel size. The results also differ between the QRM and hourglass test specimens, which indicates a structural resolution dependency on the test object and supports the application of a pattern on the test object. All the approaches also harbor the risk of artifacts and poorly recognized contours leading to incorrect surface centers of gravity or their material transitions being included in the resolution evaluation. Figure 6 (top right and bottom right) shows that the resolution is also influenced by the directional dependence, as described by Weiss [20]. It can also be deduced from the results of Figure 7 that the capability of detecting small features also depends on the test object. The hourglass approach, based on the previously described method, provides significantly better resolution values below the voxel size. As a result, it is not consistent with the methods using the QRM standard. Nevertheless, it has been shown that, with the very different approaches and resolution criteria, similar statements on structural resolution are possible, which can also be achieved with the line pattern in the measurement scenarios.
Author Contributions
Conceptualization, M.B.; methodology, M.B.; software, M.B.; validation, T.H. and M.B.; formal analysis, M.B.; investigation, M.B.; resources, T.H.; data curation, M.B.; writing—original draft preparation, M.B.; writing—review and editing, T.H.; visualization, M.B.; supervision, T.H.; project administration, T.H.; funding acquisition, T.H. and M.B. All authors have read and agreed to the published version of the manuscript.
Funding
This research was funded by Deutsche Forschungsgemeinschaft (DFG, German Research Foundation)—TRR 285/2—Project-ID 418701707, subproject C05.
Data Availability Statement
The data presented in this study are available upon request from the corresponding author.
Conflicts of Interest
The authors declare no conflicts of interest.
References
- VDI/VDE 2617 Part 6.1:2021-11; Accuracy of Coordinate Measuring Machines, Characteristics and Their Testing, Code of Practice for the Application of DIN EN ISO 10360-7 for Coordinate Measuring Machines Equipped with Imaging Probing Systems. VDI Association of German Engineers: Düsseldorf, Germany, 2021.
- VDI/VDE 2630 Part 1.3:2011-12; Computed Tomography in Dimensional Measurement—Guideline for the Application of DIN EN ISO 10360 for Coordinate Measuring Machines with CT-Sensors. VDI Association of German Engineers: Düsseldorf, Germany, 2011.
- Bartscher, M.; Neuschaefer-Rube, U.; Illemann, J.; Borges de Oliveira, F.; Stolfi, A.; Carmignato, S. Qualification and Testing of CT Systems. In Industrial X-ray Computed Tomography; Springer International Publishing: Cham, Switzerland, 2017; pp. 185–228. [Google Scholar] [CrossRef]
- Heinzl, C.; Amirkhanov, A.; Kastner, J. Processing, Analysis and Visualization of CT Data. In Industrial X-ray Computed Tomography; Springer International Publishing: Cham, Switzerland, 2017; pp. 99–142. [Google Scholar] [CrossRef]
- Villarraga-Gómez, H.; Körner, L.; Leach, R.; Smith, S.T. Amplitude-wavelength maps for X-ray computed tomography systems. Precis. Eng. 2020, 64, 228–242. [Google Scholar] [CrossRef]
- Fleßner, M.; Vujaklija, N.; Helmecke, E.; Hausotte, T. Determination of Metrological Structural Resolution of a CT System Using the Frequency Response on Surface Structures; Technical Report; Physikalisch-Technische Bundesanstalt (PTB): Braunschweig, Germany, 2015. [Google Scholar] [CrossRef]
- Wohlgemuth, F.; Fleßner, M.; Hausotte, T. Determination of Metrological Structural Resolution using an Aperiodic Spatial Frequency Standard. In Proceedings of the International Symposium on Digital Industrial Radiology and Computed Tomography—DIR2019, Furth, Germany, 2–4 July 2019. [Google Scholar]
- Laquai, R.; Illemann, J.; Bartscher, M.; Neuschaefer-Rube, U. The metrological structural resolution for dimensional X-ray CT: Analysis of the comparability between the CEB and the PBS method. Meas. Sci. Technol. 2023, 34, 084002. [Google Scholar] [CrossRef]
- Carmignato, S.; Pierobon, A.; Rampazzo, P.; Parisatto, M.; Savio, E. CT for Industrial Metrology—Accuracy and Structural Resolution of CT Dimensional Measurements. In Proceedings of the 4th Conference on Industrial Computed Tomography (iCT), Wels, Austria, 19–21 September 2012. [Google Scholar]
- Carmignato, S.; Rampazzo, P.; Balcon, M.; Parisatto, M. Practical method for determining the metrological structure resolution of dimensional CT. In Proceedings of the 13th EUSPEN International Conference, Berlin, Germany, 27–31 May 2013. [Google Scholar]
- Dewulf, W.; Bosse, H.; Carmignato, S.; Leach, R. Advances in the metrological traceability and performance of X-ray computed tomography. CIRP Ann. 2022, 71, 693–716. [Google Scholar] [CrossRef]
- Höger, K.; Schild, L.; Weiser, L.; Lanza, G. Performance parameters for evaluating pore detection ability of computed tomography systems. In Proceedings of the 12th Conference on Industrial Computed Tomography (iCT) 2023, Fürth, Germany, 27 February–2 March 2023. [Google Scholar] [CrossRef]
- Zanini, F.; Carmignato, S. Two-spheres method for evaluating the metrological structural resolution in dimensional computed tomography. Meas. Sci. Technol. 2017, 28, 114002. [Google Scholar] [CrossRef]
- Langner, O.; Karolczak, M.; Rattmann, G.; Kalender, W.A. Bar and Point Test Patterns Generated by Dry-Etching for Measurement of High Spatial Resolution in Micro-CT. In World Congress on Medical Physics and Biomedical Engineering, 7–12 September 2009, Munich, Germany; Springer: Berlin/Heidelberg, Germany, 2009; pp. 428–431. [Google Scholar] [CrossRef]
- Hermanek, P.; Borges de Oliveira, F.; Bartscher, M.; Carmignato, S. Experimental investigation of new multi-material gap reference standard for testing computed tomography systems. In Proceedings of the 7th Conference on Industrial Computed Tomography, Leuven, Belgium, 7–9 February 2017. [Google Scholar]
- Busch, M.; Hausotte, T. Determination of the Interface Structural Resolution of an Industrial X-ray Computed Tomograph Using a Spherical Specimen and a Gap Specimen Consisting of Gauge Blocks; Trans Tech Publications, Ltd.: Zurich, Switzerland, 2021; Volume 883, pp. 41–48. [Google Scholar] [CrossRef]
- Busch, M.; Hausotte, T. Simulation-based investigation of the metrological interface structural resolution capability of X-ray computed tomography scanners. J. Sens. Sens. Syst. 2023, 12, 1–8. [Google Scholar] [CrossRef]
- Laquai, R.; Neuschaefer-Rube, U.; Bartscher, M.; Illemann, J. A critical assessment of the “improved two-spheres method” [1] for the determination of a structrural resolution for dXCT. In Proceedings of the 5th Annual Dimensional X-ray Computed Tomography Conference (dXCT), Online, 17–19 May 2021. [Google Scholar]
- MicroCT Bar Pattern NANO V2 Phantom 3 × 3 mm2 Chip; QRM GmbH: Moehrendorf, Germany. Available online: https://www.qrm.de/en/products/micro-ct-bar-pattern-phantoms?downloadfile=1701&type=3451&cHash=fb1b0c0839bd1544c51304076f0a7883 (accessed on 1 July 2024).
- Weiss, D.; Shi, Q.; Kuhn, C. Measuring the 3D resolution of a micro-focus X-ray CT setup. In Proceedings of the 4th Conference on Industrial Computed Tomography (iCT), Wels, Austria, 19–21 September 2012. [Google Scholar]
- Tan, O. Characterization of Micro- and Nanometer Resolved Technical Surfaces with Function-Oriented Parameters. Ph.D. Thesis, FAU, Erlangen, Germany, 2012. [Google Scholar]
- Thompson, A.; Rodriguez Sanchez, A.; Senin, N.; Eifler, M.; Hering, J.; Leach, R. Calibration of X-ray computed tomography for surface topography measurement using metrological characteristics. In Proceedings of the 21st International Conference of the European Society for Precision Engineering and Nanotechnology, EUSPEN 2021, Virtual, 7–10 June 2021; pp. 287–290. [Google Scholar]
- Stroud, I.; Xirouchakis, P. STL and extensions. Adv. Eng. Softw. 2000, 31, 83–95. [Google Scholar] [CrossRef]
- Borges de Oliveira, F.; Stolfi, A.; Bartscher, M.; De Chiffre, L.; Neuschaefer-Rube, U. Experimental investigation of surface determination process on multi-material components for dimensional computed tomography. Case Stud. Nondestruct. Test. Eval. 2016, 6, 93–103. [Google Scholar] [CrossRef]
- Kittler, J.; Illingworth, J. On threshold selection using clustering criteria. IEEE Trans. Syst. Man Cybern. 1985, SMC-15, 652–655. [Google Scholar] [CrossRef]
- Mustra, M.; Delac, K.; Grgic, M. Overview of the DICOM standard. In Proceedings of the 50th International Symposium ELMAR, 2008, Zadar, Croatia, 10–12 September 2008; IEEE: Piscataway, NJ, USA, 2008. [Google Scholar]
- Birch, G.C.; Griffin, J.C. Sinusoidal Siemens star spatial frequency response measurement errors due to misidentified target centers. Opt. Eng. 2015, 54, 074104. [Google Scholar] [CrossRef]
Disclaimer/Publisher’s Note: The statements, opinions and data contained in all publications are solely those of the individual author(s) and contributor(s) and not of MDPI and/or the editor(s). MDPI and/or the editor(s) disclaim responsibility for any injury to people or property resulting from any ideas, methods, instructions or products referred to in the content. |
© 2024 by the authors. Licensee MDPI, Basel, Switzerland. This article is an open access article distributed under the terms and conditions of the Creative Commons Attribution (CC BY) license (https://creativecommons.org/licenses/by/4.0/).