
Article

Spatiotemporal Surveillance of SARS-CoV-2 in Wastewater: Comparative Analysis of Viral Loads in Sewer and Treatment Plant Samples from Las Heras, Mendoza, Argentina (2020–2025)


by
Israel Anibal Vega
1,2,3,* and
Maximiliano Giraud-Billoud
1,2,4,*
1
Instituto de Fisiología, Facultad de Ciencias Médicas, Universidad Nacional de Cuyo, Mendoza 5500, Argentina
2
Instituto de Histología y Embriología (IHEM, CONICET), Universidad Nacional de Cuyo, Mendoza 5500, Argentina
3
Área de Biología, Facultad de Ciencias Exactas y Naturales, Universidad Nacional de Cuyo, Mendoza 5500, Argentina
4
Departamento de Ciencias Básicas, Escuela de Ciencias de la Salud-Medicina, Universidad Nacional de Villa Mercedes, San Luis 5730, Argentina
*
Authors to whom correspondence should be addressed.
COVID 2026, 6(2), 31; https://doi.org/10.3390/covid6020031
Submission received: 20 December 2025 / Revised: 13 February 2026 / Accepted: 15 February 2026 / Published: 19 February 2026
(This article belongs to the Special Issue COVID and Public Health)

Abstract

Wastewater-Based Epidemiology (WBE) has emerged as a critical tool for monitoring SARS-CoV-2 circulation at the community level. This study assessed spatiotemporal viral dynamics in Las Heras, Mendoza, Argentina, by comparing wastewater samples from six sewer maintenance holes and three wastewater treatment plants (WWTPs) between January and June 2021, and by conducting long-term surveillance at Campo Espejo WWTP during epidemic (2020–2021) and endemic (2024–2025) phases of COVID-19. Viral particles from sewer manholes and WWTPs samples were concentrated by polyethylene glycol precipitation or aluminum polychloride adsorption–precipitation methods, and then SARS-CoV-2 RNA was quantified by reverse transcription quantitative polymerase chain reaction targeting N1 and N2 nucleocapsid viral markers. Results showed consistent detection of viral RNA across all sites, with peaks in wastewater preceding diagnosed COVID-19 cases increases, confirming WBE as an early-warning system. Localized sewer sampling identified urban hotspots, while WWTPs monitoring captured broader epidemiological trends. Recently, COVID-19 surveillance showed lower and intermittent viral loads, decoupled from diagnosed cases, compared to epidemic phase, indicating a transition to endemic circulation. Overall, combining upstream and downstream WBE enhanced spatial and temporal resolution, demonstrating its utility for public health monitoring during both epidemic and endemic phases.

1. Introduction

Wastewater-Based Epidemiology (WBE), also referred as sewage-based or wastewater surveillance, has rapidly evolved into a multidisciplinary approach for assessing community health, environmental exposures, and lifestyle patterns [1,2]. The central concept underlying WBE is that many endogenous biomarkers, microorganisms, pharmaceuticals or xenobiotics associated with human health, personal care or life style can be metabolized or directly excreted in human urine or feces [3,4]. These excreted products, carried through the sewer network, can thus reflect the overall health and habits of the contributing population [5].
WBE offers an indirect and non-invasive tool of monitoring population health, providing real-time data across geographic and temporal scales that can support informed decision-making and more efficient resource allocation [6,7]. The COVID-19 pandemic brought WBE to the forefront as a critical tool for public health surveillance. Monitoring wastewater for SARS-CoV-2 identification enabled the detection of outbreaks and emerging viral variants and lineages [8,9]. A key advantage of this approach is that SARS-CoV-2 RNA can often be detected in wastewater several days before reported diagnosed cases are confirmed [10], serving as a sensitive early-warning system [11,12,13,14,15,16]. Furthermore, WBE gives epidemiological information at the population level that helps to understand viral transmission dynamics, including asymptomatic or untested cases [6], with a lower cost of clinical surveillance.
The WBE strategy can be implemented at different spatial scales. Monitoring at wastewater treatment plants (WWTPs) provides a broad, population-wide overview, whereas more localized surveillance, conducted at sub-sewer catchments and maintenance holes, provides a higher spatial resolution and allows for the identification of local infection clusters [17]. Sampling from sewer maintenance holes facilitates the detection of “hotspots” within urban areas and shows a consistent alignment between wastewater viral loads and reported diagnosed cases. Nonetheless, several studies have demonstrated a strong concordance between clinical data and viral loads measured at the WWTP level, sometimes even stronger than those obtained from upstream sewersheds [18].
Argentina has a population of over 45 million people. This country is organized into 23 geopolitical provinces distributed across an extensive territory, with varying levels of access to sanitation systems. While some places have flush toilets connected to public sewerage networks, others rely on septic tanks. During the SARS-CoV-2 pandemic, Argentina established different epidemiological surveillance strategies in the six provinces with the highest population density, namely Buenos Aires, Córdoba, Santa Fe, Mendoza, Tucumán, and Salta. These provinces applied several mixed-scale approaches, including combined surveillance from WWTPs and sewersheds in Córdoba and Buenos Aires [19,20]; sewershed-based sampling in Salta and Tucumán [21,22]; WWTP-focused monitoring in Mendoza, Santa Fe and Córdoba [23,24,25]; and surface water contaminated with wastewater in Buenos Aires [26]. All of these studies showed high effectiveness for epidemiological surveillance, independently of the strategies and methodologies applied [19,20,21,22,23,24,25,26].
We implemented WBE to monitor SARS-CoV-2 RNA in the metropolitan region of Mendoza, Argentina, an area serving approximately 1.2 million residents, between July 2020 and January 2021 [23]. Our findings demonstrated that WBE is a reliable epidemiological indicator for tracking SARS-CoV-2 circulation and anticipating the trajectory of the epidemic through wastewater analysis from WWTP. Over 26 weeks of monitoring, the detection and increases in the number of copies of SARS-CoV-2 nucleocapsid genetic markers in wastewater consistently preceded rises in clinically confirmed COVID-19 cases by 3 to 6 days [23]. Likewise, the copies of the SARS-CoV-2 molecular markers follow similar patterns to the increase, plateau, and decrease in the number of people with a confirmed COVID-19 diagnosis and the number of reported deaths. However, to date there is no other epidemiological surveillance study in Mendoza that provides viral circulation information at smaller scales using the sewer system, and its comparison with WWTPs. The implementation of this focalized strategy could be useful in places when herd community immunity is difficult to achieve due to cultural practices and traditions or even access to high-complexity hospitals is limited.
This work is focused on the unknown aspects of WBE application in Mendoza. Specifically, the main objectives were (a) to compare the SARS-CoV-2 viral load at Campo Espejo WWTP and at specific points of the sewer maintenance holes that feeds it, and represents geographically well-defined populations during the second COVID-19 epidemic wave; (b) to assess the viral load in Uspallata, a crucial Andean border town where numerous Latin-American truck drivers wait for the opening of the Los Libertadores International Crossing, particularly during winter; and (c) to evaluate temporal changes in viral load during the initial epidemic waves (July 2020–January 2021) and the endemic phase of COVID-19 (April 2024 to September 2025) in Mendoza.

2. Materials and Methods

2.1. Wastewater Sampling

The province of Mendoza is located in central-west Argentina. Within its jurisdiction, the department of Las Heras stand out, housing approximately 200,000 inhabitants. The municipality has a high percentage of homes connected to the sewer system, which is important because sewage effluent samples are highly representative of processes occurring at homes.
The wastewater surveillance strategy was implemented through strategic punctual sampling, designed to capture the municipality’s geographic and demographic diversity. This sampling approach focused in (a) six strategic sewer points from the sewage network of the metropolitan region (Supplementary Figure S1), which reflect areas of high population density, (b) two small local WWTPs, called El Algarrobal and Uspallata, which serve localized populations, and (c) a regional WWTP named Campo Espejo, that receives influents not only from Las Heras but also from the neighboring municipalities of Mendoza City and Godoy Cruz (together serving an estimated population of 470,000 inhabitants). The WWTPs are identified in Supplementary Figure S2.
The samples from different manholes points of Las Heras were manually collected between 11:00 AM and 1:00 PM, from 1 January to 17 June 2021, coinciding with the second wave of COVID-19 infections occurred in Mendoza. In addition, SARS-CoV-2 viral loads were compared between the epidemic phase (2020–2021) and the endemic period (2024–2025). At Campo Espejo WWTP, composite samples were collected using an automatic flow-proportional sampler (Sigma SD900, Hach Company, Loveland, CO, USA). The autosampler was programmed to collect 1 L of influent every 60 min over a 24 h period.
To determine community circulation of SARS-CoV-2 during the early pandemic, sampling frequency was higher than in subsequent endemic years. During the first COVID-19 wave, samples were taken every two weeks from July 2020 to January 2021, whereas during the endemic phase, composite samples were collected monthly from April 2024 to September 2025. All sampling were conducted by the Mendoza Water Management and Sanitation Company (AYSAM S.A., Ciudad de Mendoza, Argentina). Immediately after collection, all samples were stored at 4 °C and transported to our laboratory for heat inactivation at 60 °C for 90 min [23]. Duplicate 300 mL aliquots were then stored at −20 °C for a maximum of 72 h before further processing for viral concentration and RNA extraction.

2.2. Wastewater Concentration and SARS-CoV-2 RNA Extraction and Quantification

As previously described [23], two viral particles concentration methods were applied: polyethylene glycol (PEG) precipitation and aluminum polychloride (PAC) adsorption–precipitation.
For samples to compare the SARS-CoV-2 viral load at Campo Espejo WWTP and at specific points of the sewer maintenance holes from Las Heras (grab samples), the PEG method was applied, yielding 2 mL of concentrate from 300 mL of raw wastewater [23]. For samples to evaluate temporal changes in viral load during epidemic and endemic phases of COVID-19 (composite samples), the PAC method was used, obtaining 2.5 mL of concentrate from 300 mL of sample [23]. Viral RNA extraction from PEG-concentrated samples was performed using the NucleoZOL® (Macherey-Nagel, Düren, Germany) reagent. After lysis and removal of DNA and proteins, the supernatant was mixed with binding buffer to allow RNA binding to the silica membrane of the NucleoSpin® RNA Set column (Macherey-Nagel, Düren, Germany). Two washing steps were carried out, and RNA was finally eluted with 60 µL of RNase-free water.
For PAC-concentrated samples, 220 µL of concentrate were processed using NucleoZOL® (Macherey-Nagel, Germany) and lysis buffer according to the manufacturer’s instructions (NucleoSpin® RNA Stool kit, Macherey-Nagel, Düren, Germany). Samples were mixed with ceramic beads and lysed by shaking for 10 min. After centrifugation at 10,000× g for 15 min, the supernatant was passed through an Inhibitor Removal Column to eliminate substances that could interfere with RT-qPCR. Nucleic acids were then retained on a silica column, washed to remove contaminants, and treated with rDNase. Total RNA was eluted with 80 µL of RNase-free water.
The extracted RNA was quantified using a NanoDrop spectrophotometer, aliquoted, and stored at −20 °C until Reverse Transcription quantitative Polymerase Chain Reaction (RT-qPCR) analysis.
SARS-CoV-2 RNA quantification was performed by RT-qPCR using the iTaq Universal Probe One-Step Kit (BioRad Life Science, Hercules, CA, USA). The N1 and N2 regions of the viral nucleocapsid gene were targeted using the 2019-nCoV CDC EUA Kit (IDT #10006606, Lot #0000512209, Newark, NJ, USA). The SARS-CoV-2 nucleocapsid (N) gene was selected as the primary target because it is highly expressed during viral replication and it has high abundance in infected individuals. Consequently, N1 and N2 markers were selected due to their high analytical sensitivity, robustness across different wastewater matrices, and widespread validation in wastewater-based epidemiology studies [27,28]. Both targets have been previously evaluated in wastewater samples from Mendoza during the early epidemic period [23], demonstrating consistent detection and reliable correspondence with epidemiological trends. The simultaneous quantification of both markers was therefore retained to enhance detection reliability, reduce the risk of false-negative results, and account for potential differential degradation or amplification efficiency in complex sewage matrices [17,27,29,30]. Five microliters of RNA template were used in a final reaction volume of 20 µL. Positive controls (RNA from COVID-19 patients) and negative controls (nuclease-free water) were included. All reactions were performed in duplicate, and potential RT-qPCR inhibition was assessed by testing 1:5 sample dilutions. This study did not experimentally assess recovery efficiency, which could represent a limitation and may introduce uncertainty in the absolute quantification of viral loads. However, the epidemiological relevance of the data lies primarily in comparative temporal trends rather than absolute concentrations. Viral RNA quantification was based on standard curves generated using synthetic RNA, following previously validated protocols reported by our research group [23], in which recovery efficiency was experimentally evaluated. Results were manually calculated and expressed as the number of viral copies per 100 mL of wastewater (copies/100 mL). RT-qPCR assays were performed on a BioRad CFX96 thermal cycler (BioRad, Hercules, CA, USA), using the following program: 50 °C for 10 min, 95 °C for 3 min, followed by 45 cycles of 95 °C for 15 s and 60 °C for 50 s. Data were analyzed with CFX Maestro software (BioRad, Hercules, CA, USA), with the fluorescence threshold set at 75.
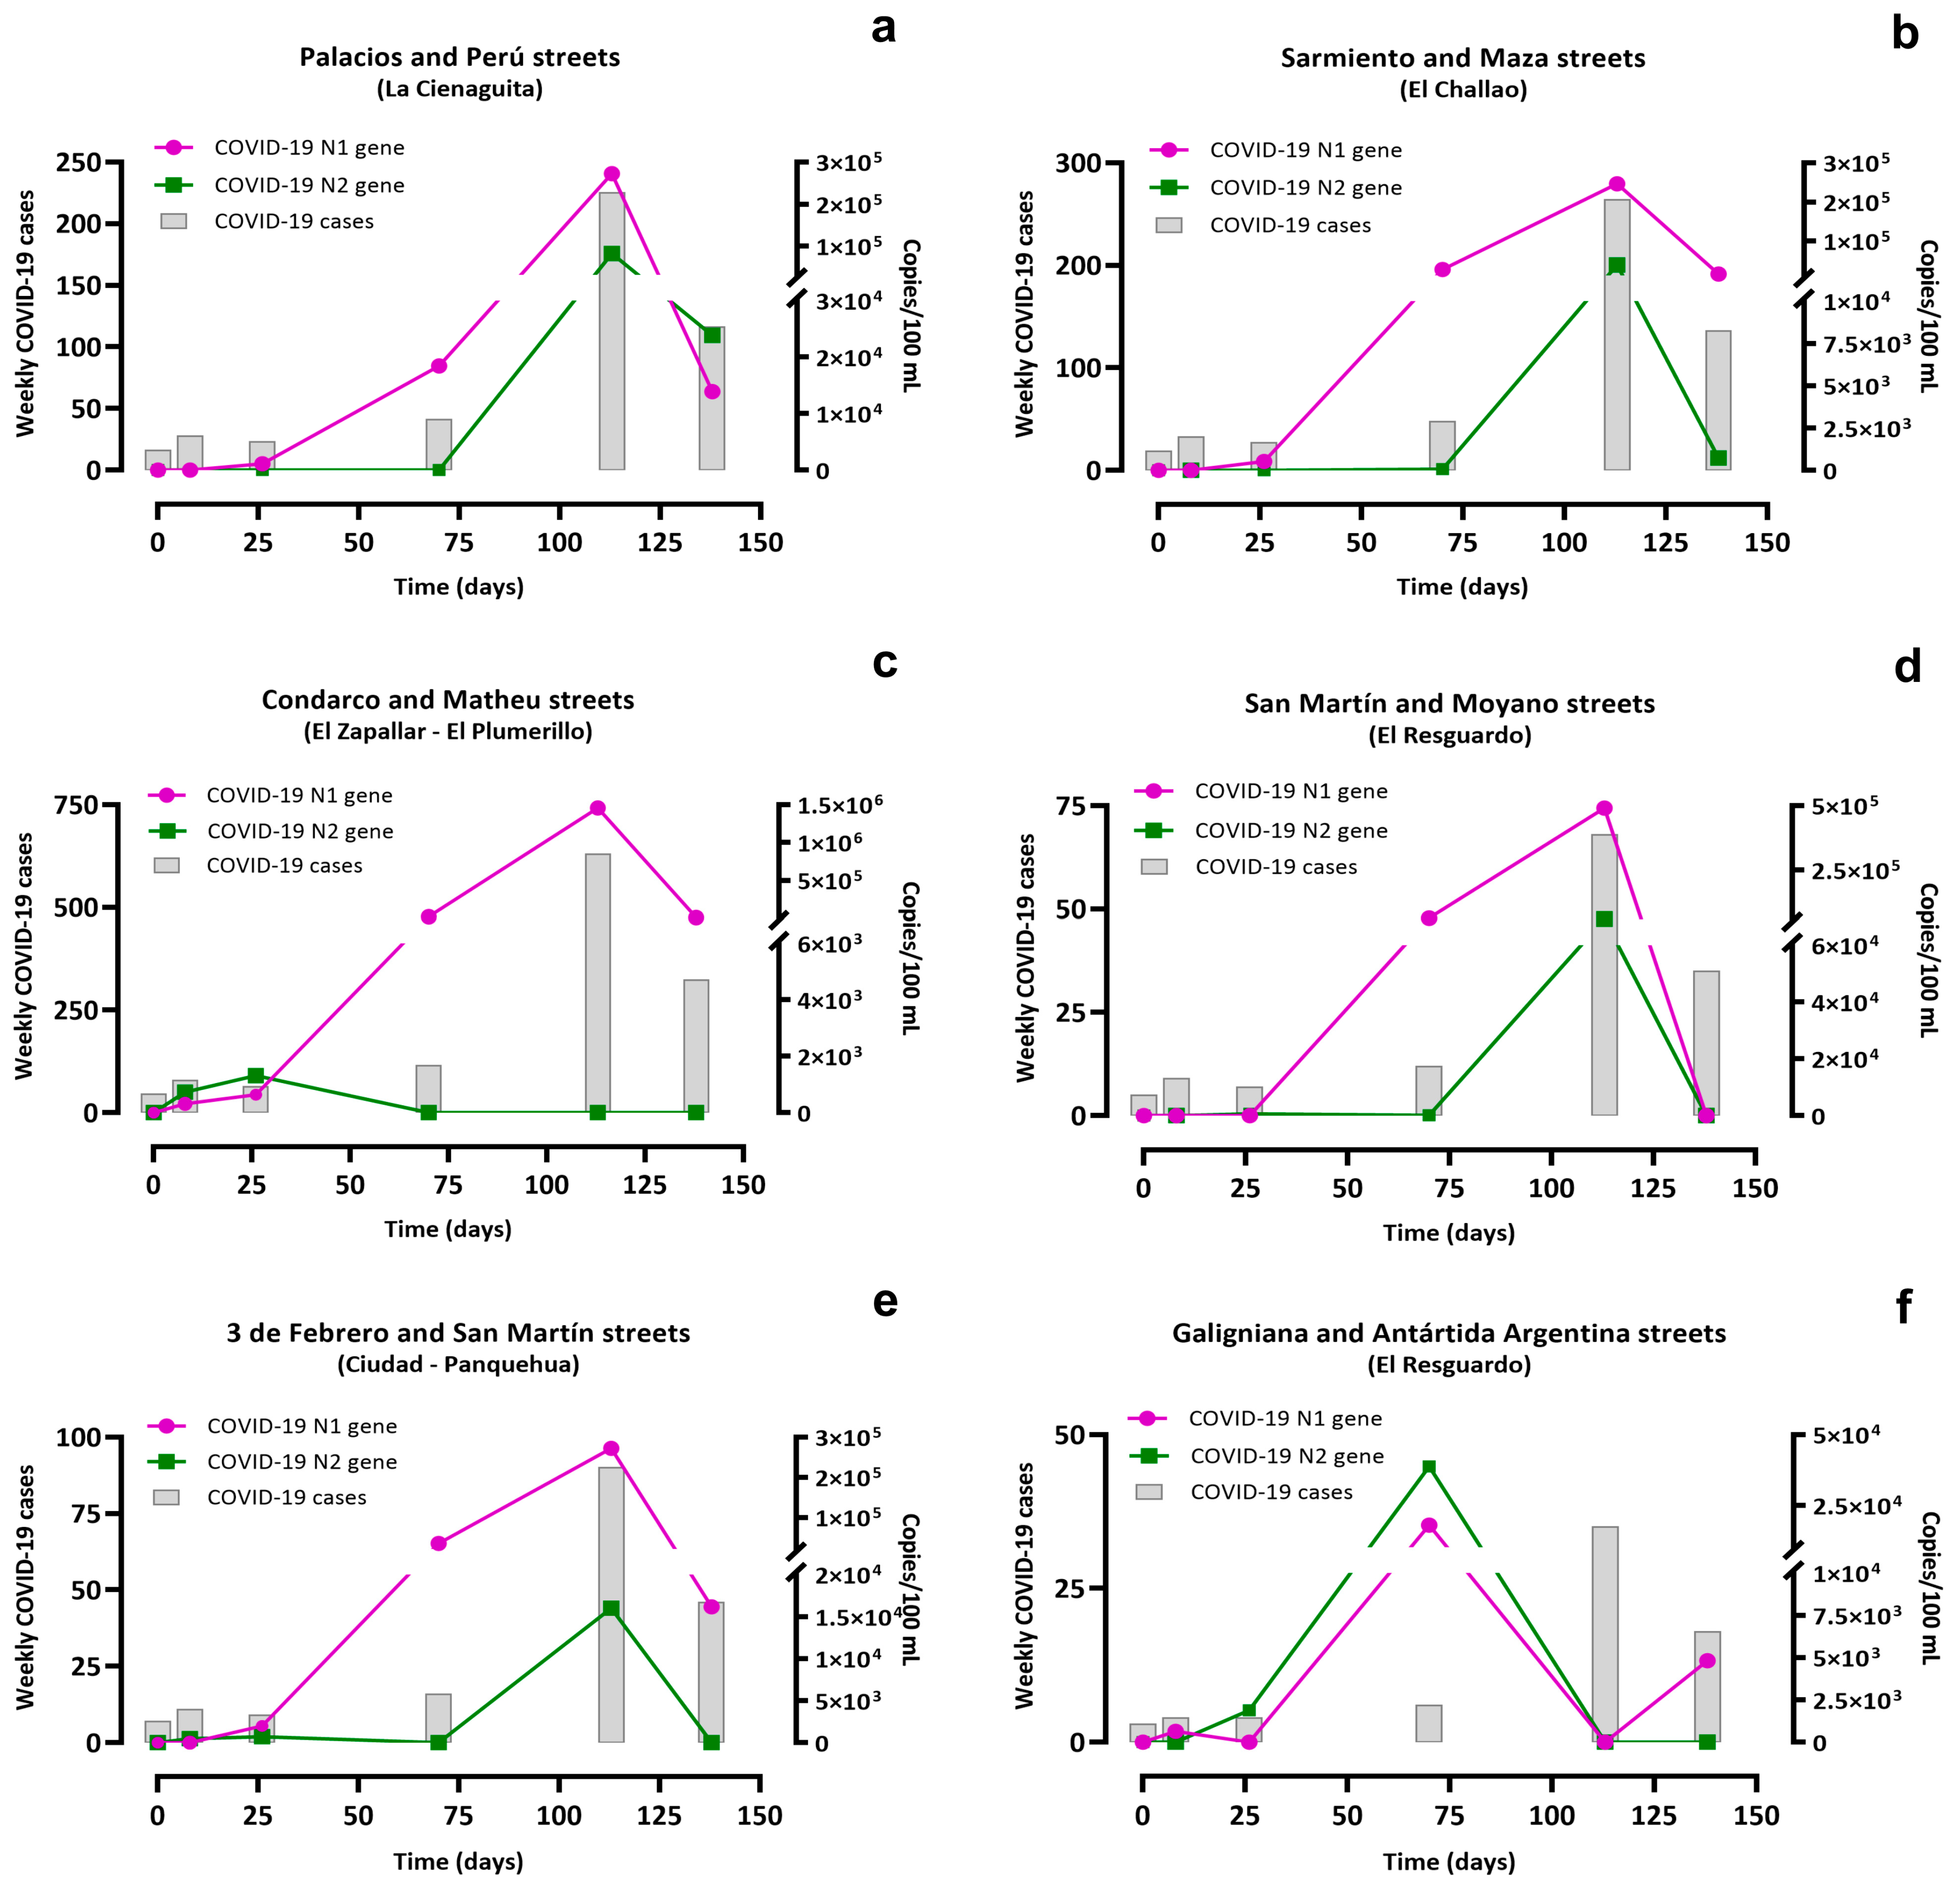
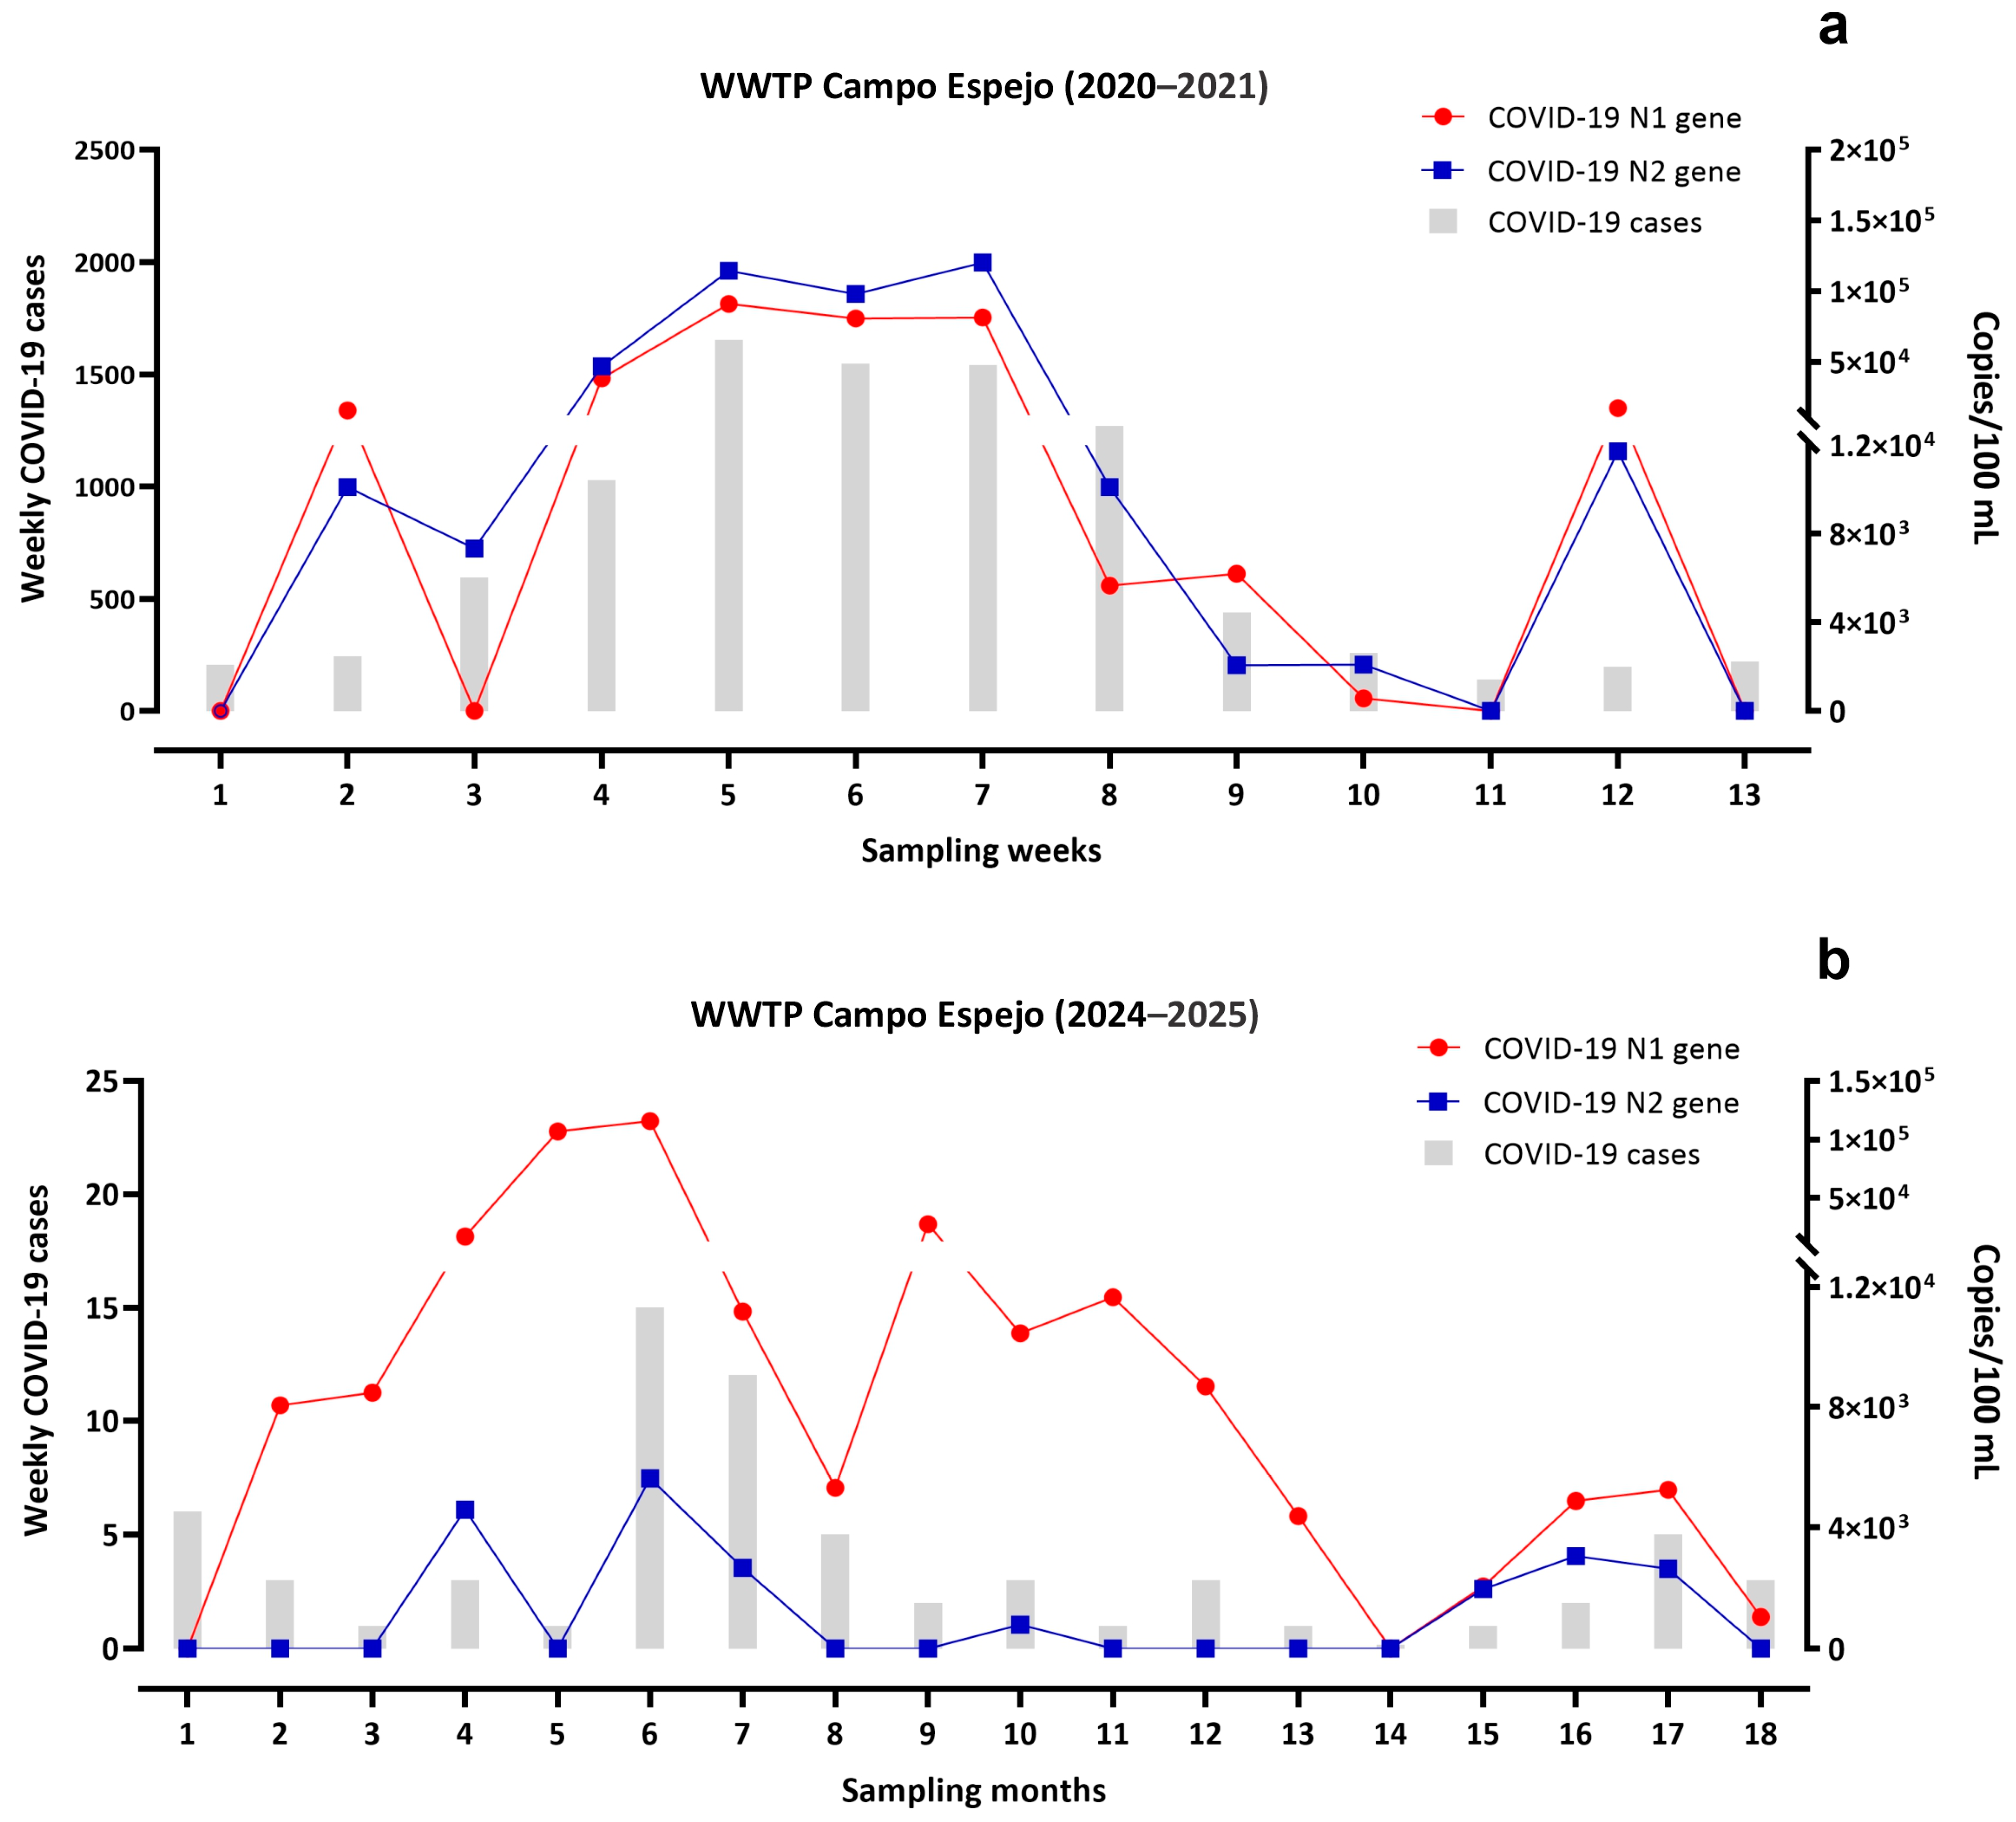
To examine the temporal relationship between diagnosed cases and viral load, COVID-19 case counts were calculated as the sum of cases diagnosed and reported by the Ministry of Health of the Mendoza Government during the seven days preceding each wastewater sampling date. These data are presented as “weekly COVID-19 cases” in Figures 1–3, while the specific sampling dates and numerical values are provided in Supplementary Tables S1–S3.

2.3. Epidemiological Data About SARS-CoV-2 Variants Circulating Between 2021 and 2025

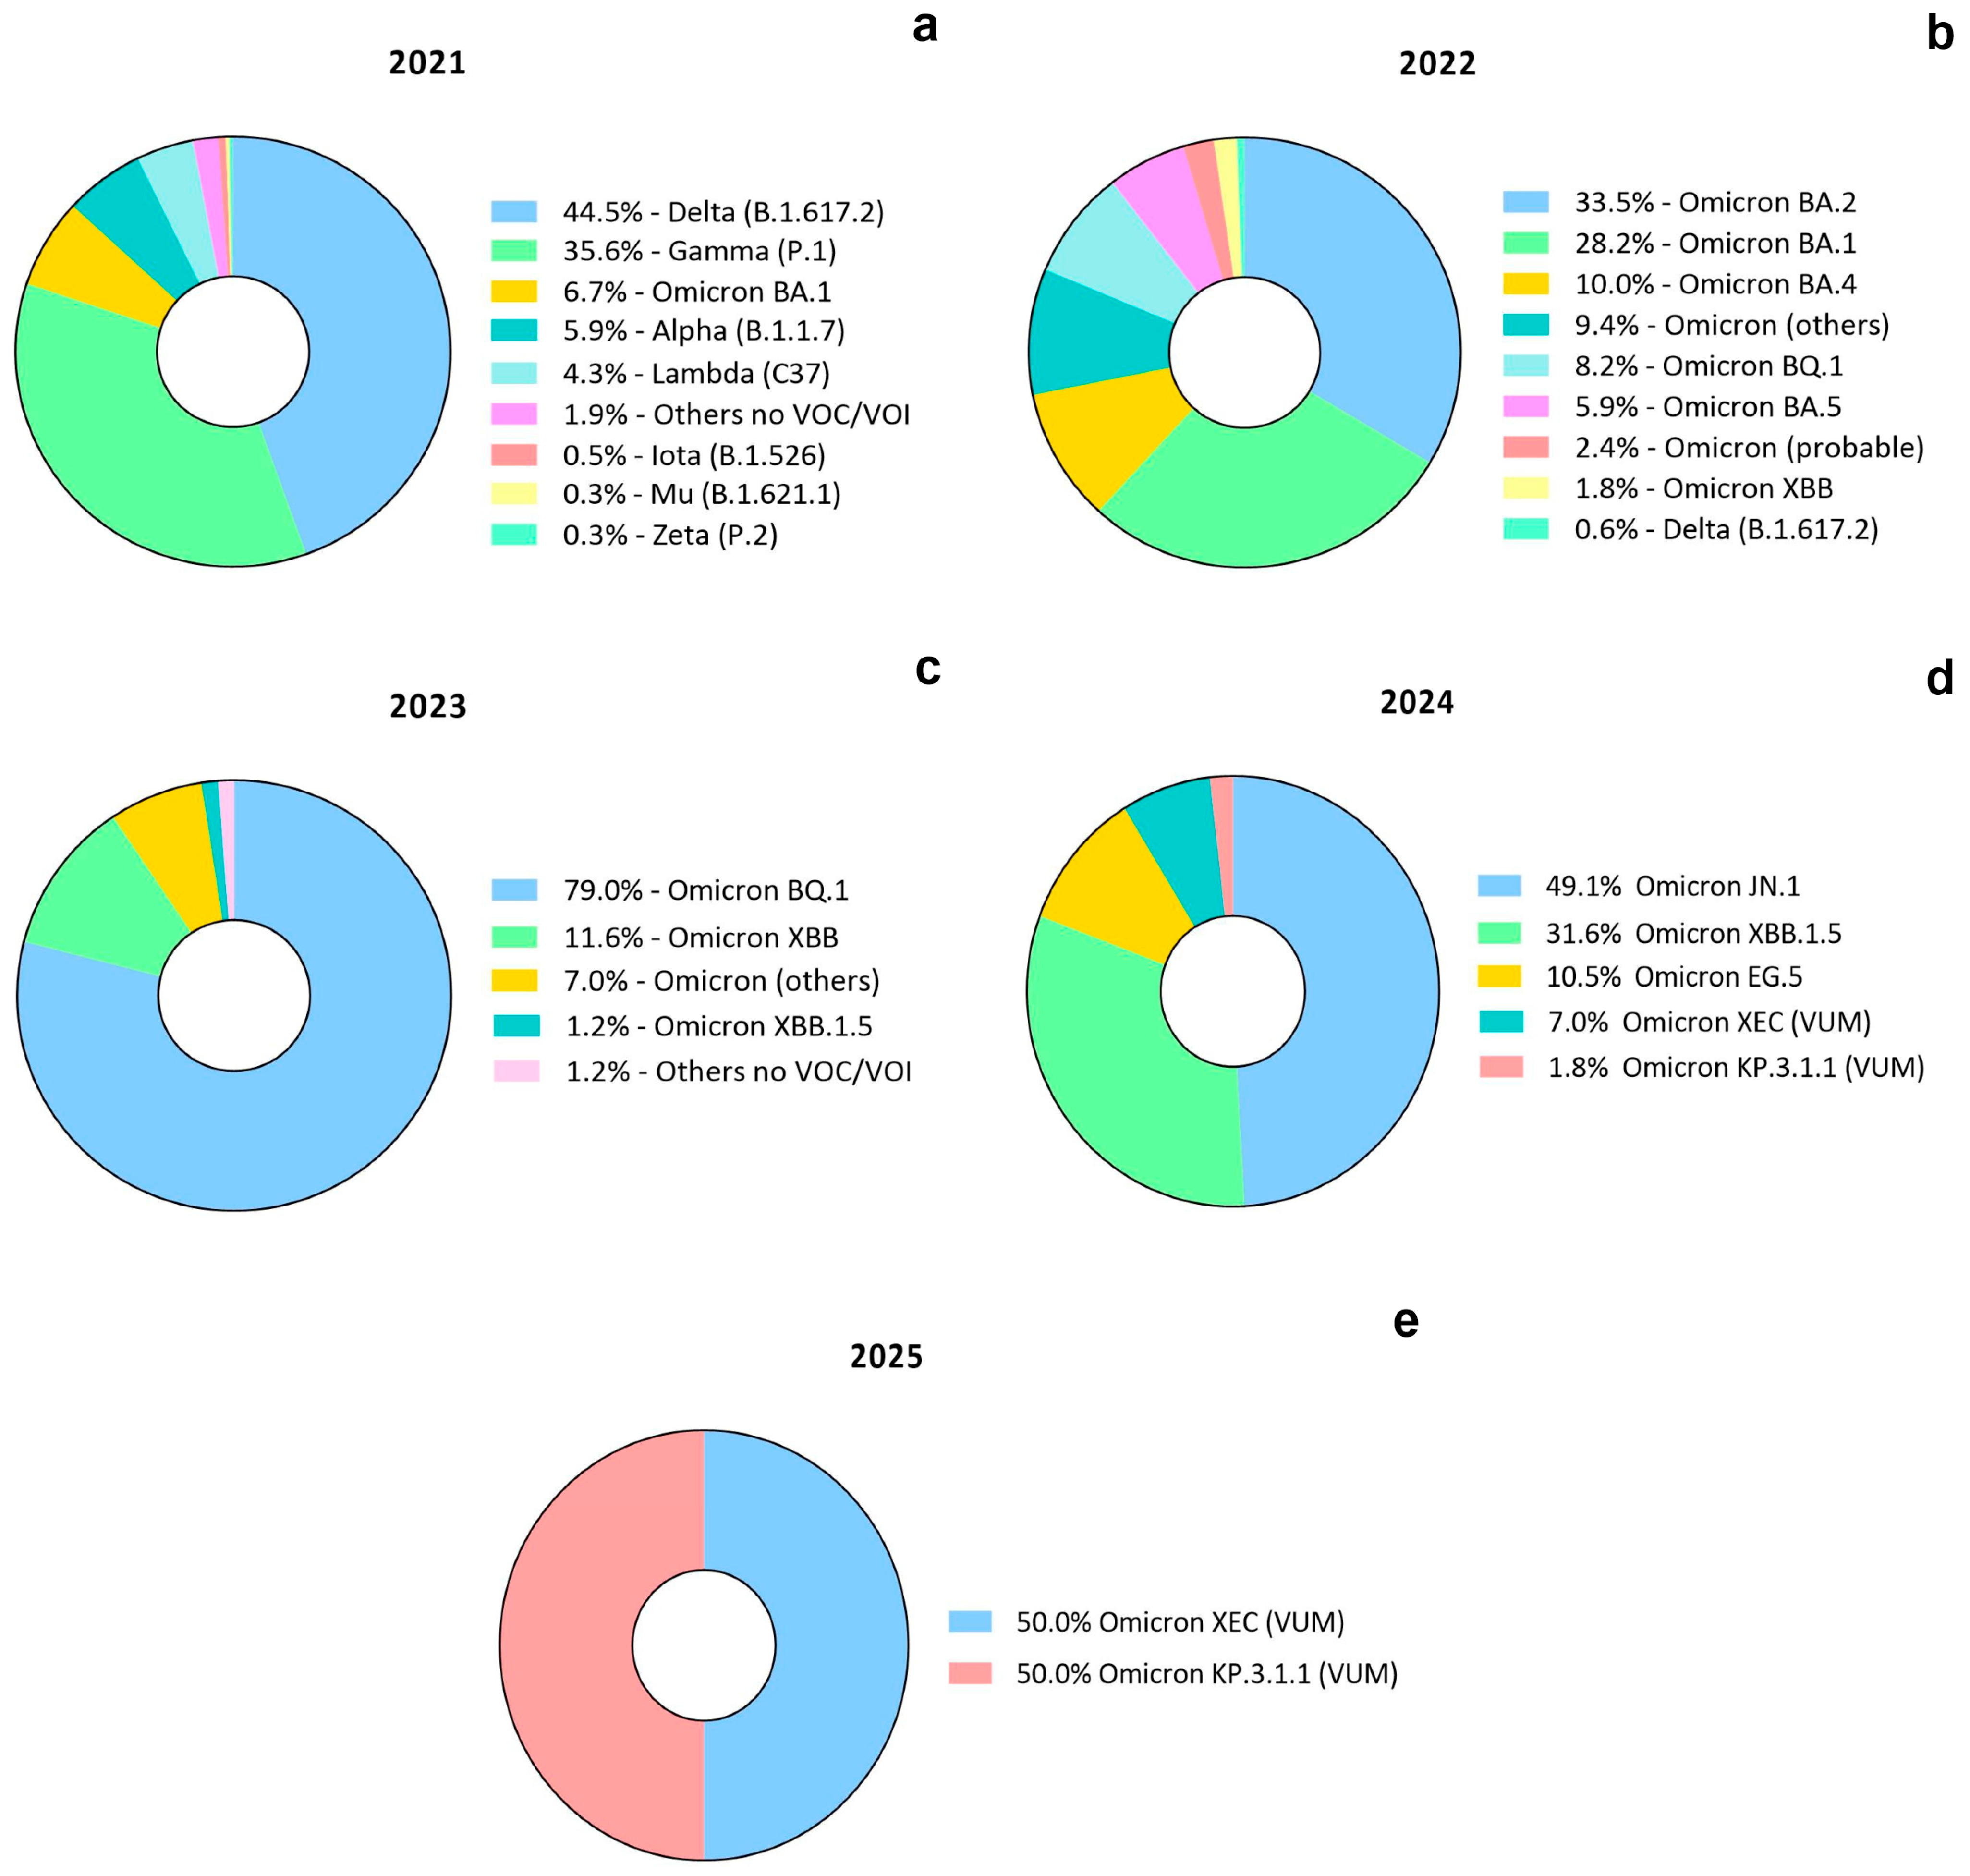
Secondary data on the SARS-CoV-2 virus variants that circulated in the Mendoza province was provided by the Health Ministry, Mendoza Government. Genomic identification of viral RNA was performed on 373 samples in 2021, 170 in 2022, 86 in 2023, 57 in 2024, and 24 in 2025. All of them correspond to human biological samples obtained by nasopharyngeal swab or lung aspirate.

2.4. Statistical Analysis

Data were processed and analyzed using descriptive statistics. All wastewater samples were processed in duplicated (two independent concentrates) and RT-qPCR determinations for each molecular marker (N1 and N2) were performed in duplicate (n = 2). The mean values of these replicates were used for data presentation and trend analysis. Results are reported as absolute concentrations (copies/100 mL) to illustrate spatiotemporal variations of SARS-CoV-2 RNA in wastewater. Statistical analyses and graphical representations were performed using GraphPad Prism® ver. 8.0.1 (San Diego, CA, USA) software.

3. Results

3.1. Spatiotemporal Variation of SARS-CoV-2 RNA in Sewer Maintenance Holes

SARS-CoV-2 RNA was detected in all six sewer manholes areas of Las Heras throughout the monitoring period (January–June 2021) (Figure 1). Both N1 and N2 genetic markers showed a similar temporal pattern, with a sharp increase in viral RNA markers concentrations, coinciding with the peak of confirmed COVID-19 cases by Health Ministry (Mendoza, Argentina), during the fifth sampling event (May 2021). However, N1 copy numbers exceeded those of N2 by one to two orders of magnitude (Figure 1 and Supplementary Table S1) in these sewer holes.
The highest viral concentrations were observed in two sewer maintenance holes located at Condarco–Matheu (Figure 1b) and San Martín–Moyano (Figure 1e) streets, reaching N1 values of 1.5 × 10⁶ copies/100 mL and 4.9 × 10⁵ copies/100 mL, respectively. At Palacios–Perú streets (Figure 1a), a moderate increase in the N1 marker was recorded during the fourth sampling event, while more pronounced increases were detected at San Martín–Moyano (Figure 1d) and Condarco–Matheu (Figure 1c) streets. Across all the three locations, maximum N1 concentrations were reached at the fifth sampling. However, at Condarco–Matheu streets, N2 levels remained below the limit of detection during the final sampling events, whereas peak N2 levels at Palacios–Perú and San Martín–Moyano streets occurred during the fifth sampling. In contrast, at Galigniana–Antártida Argentina streets (Figure 1f), a sharp increase in both molecular markers were observed during the fourth sampling, with N2 reaching its maximum concentration (3.9 × 10⁴ copies/100 mL).
In general, SARS-CoV-2 RNA levels rose in all grab samples several days before diagnosed cases of COVID-19 were confirmed, showing a clear temporal offset between wastewater detection and reported infections. Following the epidemiological peak, a progressive decline in both genetic markers paralleled the reduction in new COVID-19 cases by the sixth sampling.

3.2. Load Viral Comparison Between Local Sewers and Wastewater Treatment Plants

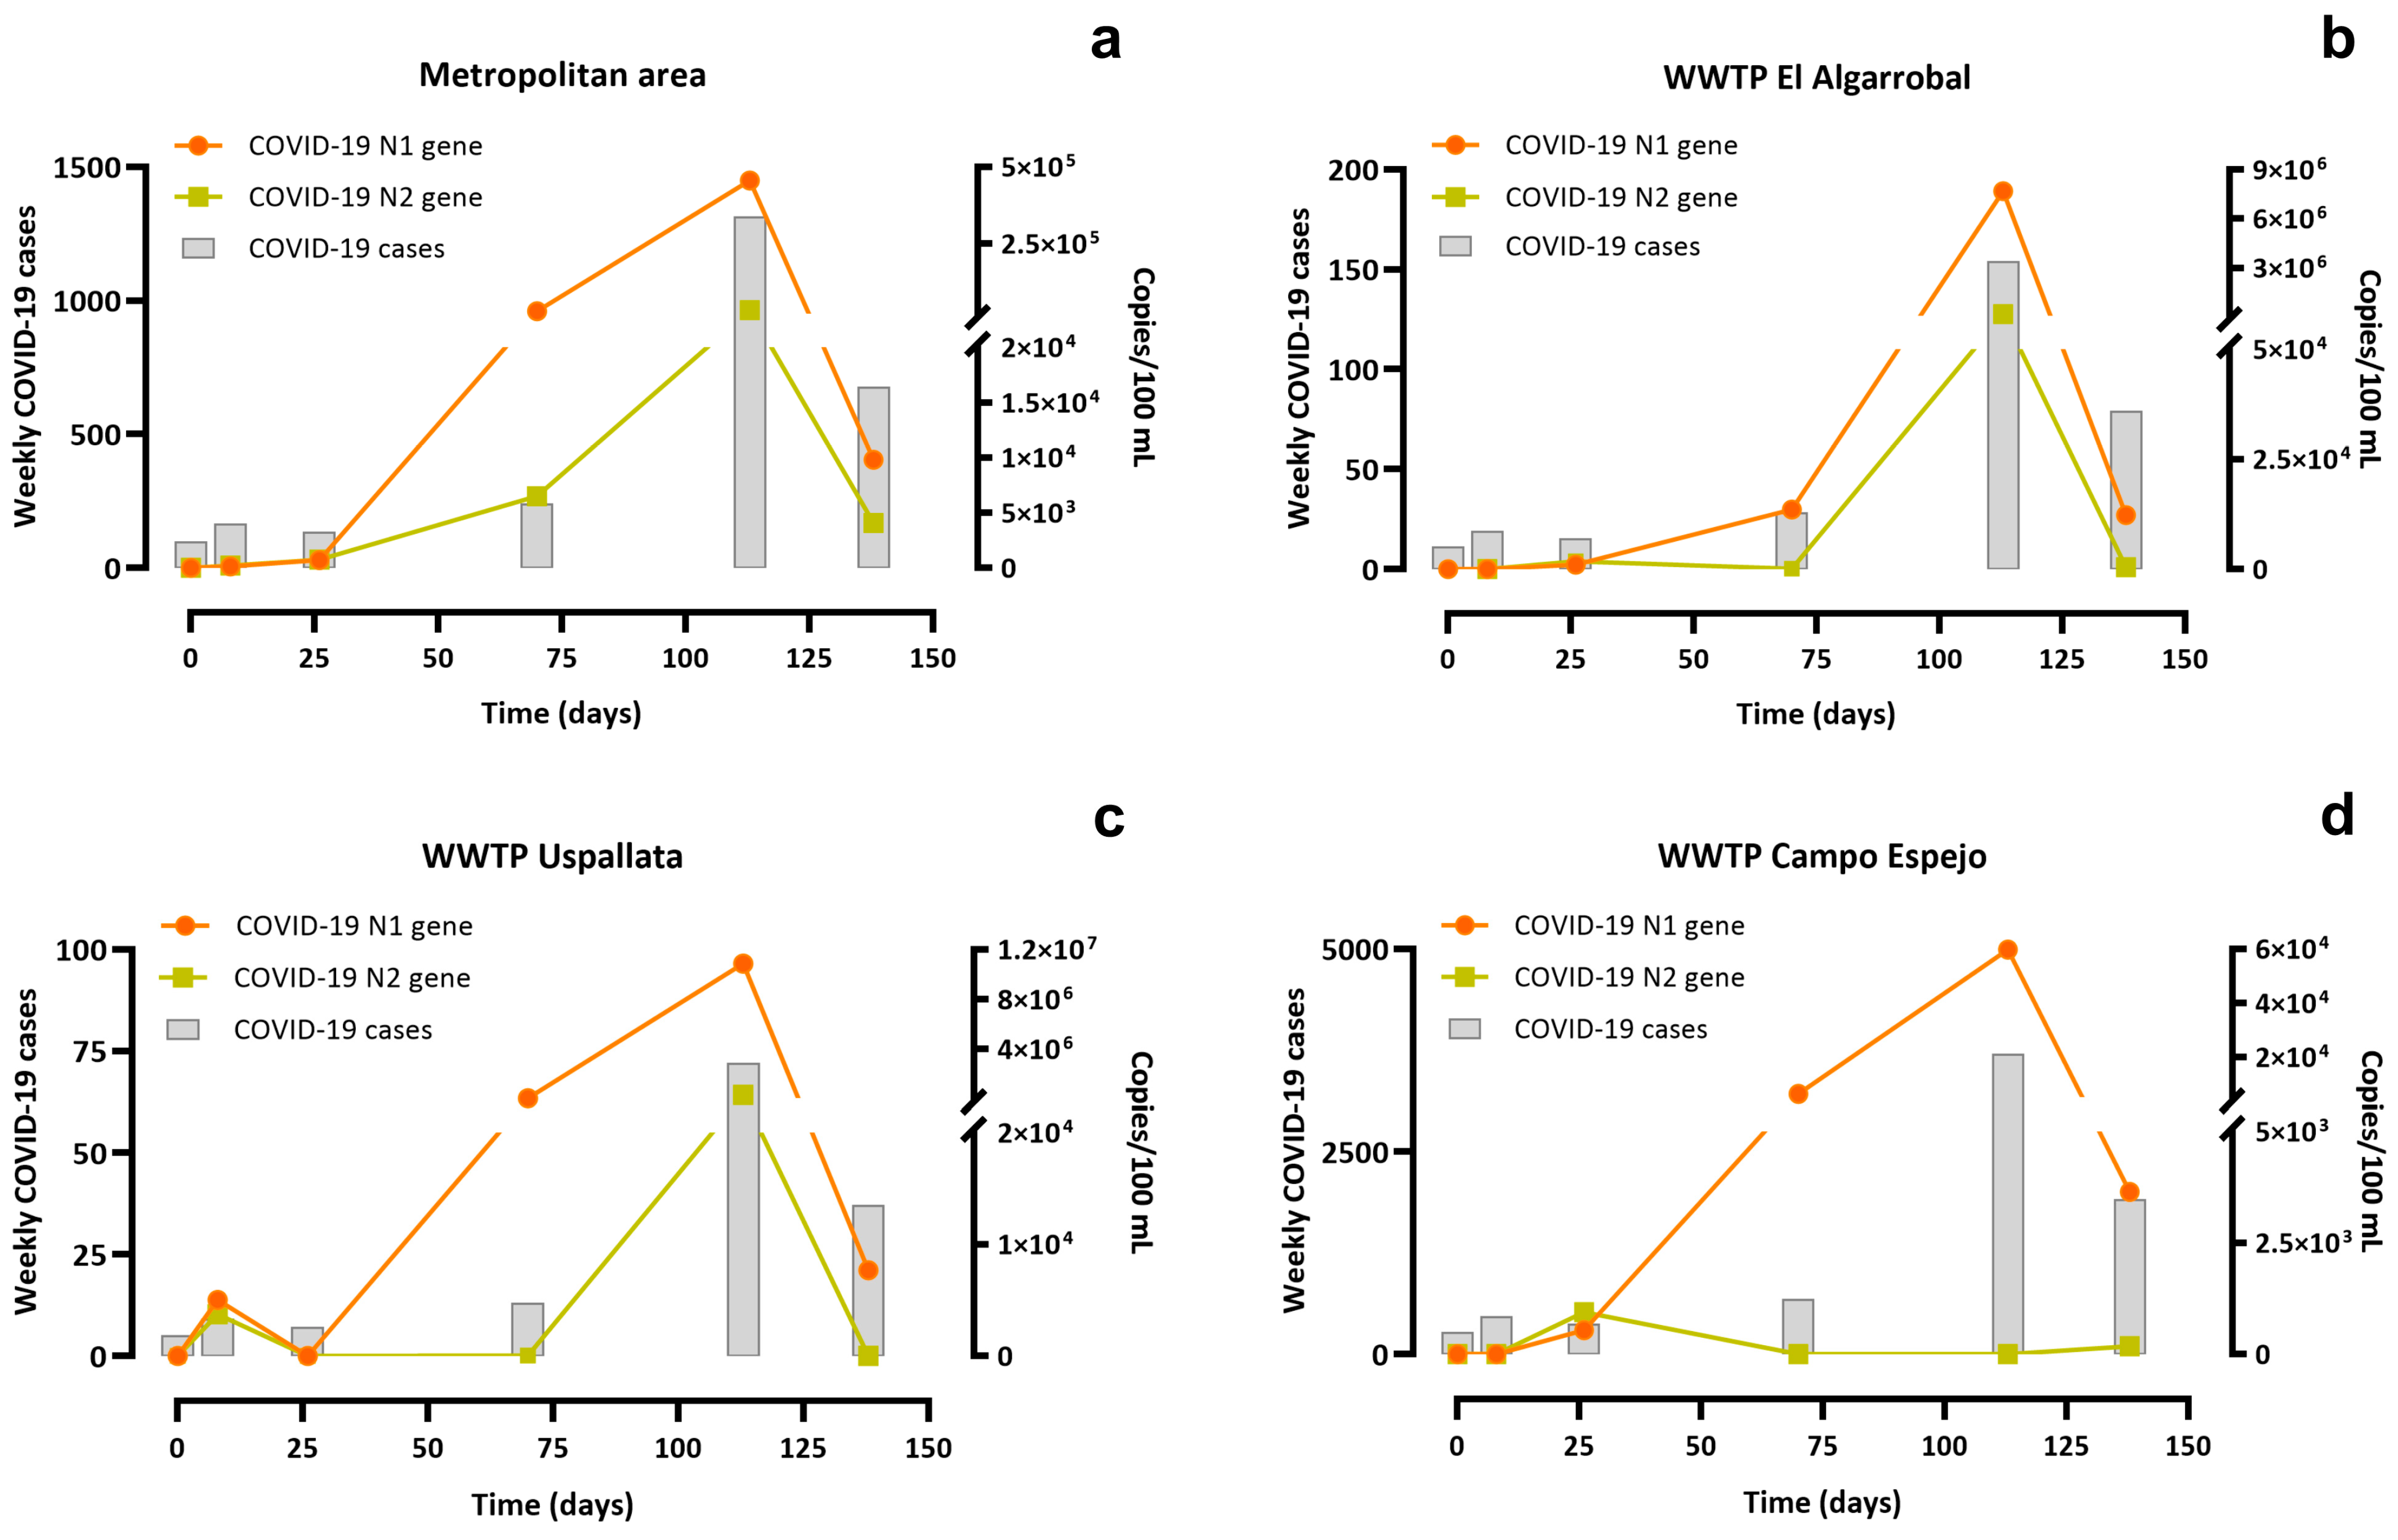
The viral RNA dynamics in sewer maintenance holes were mirrored by the findings at the three WWTPs (Figure 2 and Supplementary Table S2). The highest viral loads in the metropolitan area’s sewer system were recorded during fifth sampling, with a mean value across the six sampling points of 4.6 × 10⁵ copies/100 mL for N1 and 3.3 × 10⁴ copies/100 mL for N2 (Figure 2a). These peaks coincided with the weekly highest number of COVID-19 cases reported (1313 cases). Analysis of the local WWTPs revealed similar pattern. El Algarrobal WWTP showed an elevated viral load during the fifth sampling, in line with the increase in confirmed COVID-19 cases in its corresponding area (Figure 2b). Likewise, Uspallata WWTP displayed the highest viral RNA concentration on the same date (1.1 × 10⁷ copies/100 mL for N1 and 3.0 × 10⁵ copies/100 mL for N2). This high viral load was evidenced at the time when 72 confirmed COVID-19 cases were reported at local level (Figure 2c). Campo Espejo WWTP, which integrates influents from Las Heras, Mendoza City, and Godoy Cruz, exhibited a maximum N1 detection of 6.0 × 10⁴ copies/100 mL during the fifth sampling, once again preceding the regional epidemiological peak (Figure 2d). However, in Campo Espejo WWTP, N2 genetic marker detection remained at basal levels throughout the sampling period (Figure 2d).

3.3. Temporal Variations in Viral Load Across the First Epidemic Waves and the Subsequent Endemic Phase of COVID-19

Long-term surveillance at Campo Espejo WWTP revealed differential viral dynamics between the first epidemic waves (2020–2021) and the subsequent variations in viral load during the endemic phase of the disease (2024–2025) (Figure 3 and Supplementary Table S3). During the initial wave, SARS-CoV-2 RNA concentrations exhibited a sharp increase between the third and fifth sampling (Figure 3a). Notably, in the early stages of the pandemic, the viral loads detected in the second sampling were markedly higher than the reported clinical cases. Nonetheless, between the second and third samplings, the number of diagnosed COVID-19 cases nearly doubled, making the levels of viral load observed epidemiologically expected. In the fifth sampling, both markers N1 and N2, reached their maximum values (9.1 × 10⁴ and 1.2 × 10⁵ copies/100 mL, respectively), coincident with the maximum number of weekly COVID-19 cases reported by the local Health Ministry (approximately 1500 individuals) (Supplementary Table S3). Viral RNA persisted in wastewater for six weeks after the maximum weekly reported cases, suggesting prolonged viral shedding within the monitored population (Figure 3a). Similarly, the viral load peak observed at sampling 12 was clearly higher than the reported clinical cases. It coincided with the Holidays season (summer in Mendoza) and can be explained by an influx of a non-resident floating population, often not captured by local clinical registries (Figure 3a and Supplementary Table S3).
On the other hand, SARS-CoV-2 RNA concentrations exhibited sporadic fluctuations during the endemic phase of the disease. Overall, N1 peaks were particularly pronounced in sampling months 4, 5, 6, 9, 11, 16, and 17, whereas increases in the N2 marker were detected in months 4, 6, 15, and 16. Notably, these increases in viral load in wastewater samples preceded the rise in clinically diagnosed cases of COVID-19, which became evident in months 6, 7, 17, and 18; however, the reported case counts remained low relative to the magnitude of the viral loads observed (Figure 3b).

3.4. SARS-CoV-2 Variants Circulating in Mendoza, Argentina

Between 2021 and 2025, successive changes of circulating SARS-CoV-2 variants were observed in Mendoza (Figure 4). In 2021 there was a dominancy of Delta (44.5%) and Gamma (35.6%) variants and lower percentage of Lambda, Alpha, and Iota (Figure 4a). During 2022, there was an abrupt transition toward to the Omicron variants, being the most prevalent BA.2 (33.5%) and BA.1 (28.2%), alongside the emergence of sublineages such as BA.4, BA.5, and BQ.1 (Figure 4b). By 2023, circulation became almost monodominant, with Omicron BQ.1 accounting 79.0% followed of XBB as the second most frequent lineage (Figure 4c). In 2024, the diversification process within Omicron continued, although community transmission was clearly dominated by JN.1 (49.1%) and secondarily by XBB.1.5 (31.6%), followed by moderate levels of EG.5, XEC and KP.3.1.1 (Figure 4d). In 2025, community circulation was almost entirely restricted to Omicron two variants under monitoring (VUM) XEC and KP.3.1.1, showed similar percentages (Figure 4e), indicating a trend toward highly derived Omicron lineages and the near-complete replacement of earlier variants.

4. Discussion

4.1. WBE as a Predictive Early-Warning System

The consistent detection of both molecular markers N1 and N2 of SARS-CoV-2 virus across all monitored sewer maintenance holes in Las Heras, throughout the studied period, firmly establishes WBE as a leading indicator system for the second epidemiological wave reported by Health Ministry of Mendoza, Argentina. Viral RNA loads consistently rose days preceding the increase in clinically confirmed COVID-19 cases, as was reported in other districts from Argentina [19,21,22]. This clear temporal offset is highly valuable, providing public health authorities with a critical early-warning window to implement targeted interventions before the epidemiological peak, thereby allowing for real-time tracking of local disease dynamics. These findings align with previous studies, reinforcing the role of WBE as a robust predictor of community transmission [31,32,33,34,35].

4.2. Utility of Spatially Targeted Surveillance

Targeted surveillance at strategic sewer nodes validated the utility of sewershed-level monitoring for detecting clear patterns of SARS-CoV-2 circulation within geographically circumscribed urban areas. The high viral levels observed in the sewer manholes from Zapallar-Plumerillo, La Cienaguita and El Challao (Figure 1 and Supplementary Table S1) reflect metropolitan areas characterized by high population density, intense community activities, or even pronounced demographic heterogeneity [19]. In specific instances, such as El Resguardo (Figure 1f), we observed high viral loads that did not correspond with the low number of reported cases in the fourth sampling. In this context, WBE provides critical public health insights, as it likely identifies a potential contagion hotspot or highlights gaps in reported diagnosed cases. As evidenced by several studies [23,25,36,37], high viral concentrations in wastewater often diverge from clinical case counts. Such inconsistencies are largely attributable to epidemiological variables, specifically diagnostic infrastructure limitations, testing throughput, clinical registration protocols, and patient access to health services. These findings underscore the high sensitivity of WBE as a “silent sentinel” during periods of low clinical surveillance enabling the detection of localized outbreaks even before they are captured by formal health records and providing a level of spatial resolution unattainable through composite treatment plant sampling.

4.3. Genetic Marker Performance and Quantification Reliability

Both nucleocapsid gene targets consistently demonstrated high sensitivity across samplings, affirming their status as reliable molecular indicators of viral presence in this complex matrix, in agreement with international reports [17,27,29,30]. While a clear temporal correspondence was observed between viral load peaks and rising clinical confirmed COVID-19 cases, the quantification of genetic markers of SARS-CoV-2 by RT-qPCR was characterized by notable stochastic variability, particularly reflected in the one- to two-order of magnitude difference often observed between N1 and N2 copy numbers. This inter-marker fluctuation underscores the necessity of utilizing both N1 and N2 targets systematically for robust quantification. The lower and more variable signal observed for the N2 target, compared to N1 (see Figure 1c, Figure 2d and Figure 3b) may reflect the differential lability and degradation rates of SARS-CoV-2 RNA fragments within the complex wastewater matrix, as previously reported [38,39]. Environmental stressors, such as pH fluctuations and enzymatic activity, may preferentially affect certain genomic regions, which could partly explain the consistently higher levels of the N1 target compared with N2 observed in our study. Relying on a single target under these conditions risks producing underestimations or false-negative interpretations [27] and emphasizes the complexity of accurately modeling viral shedding variability within localized sewage systems.

4.4. Data Harmonization Across Monitoring Scales and Disease Burden Assessment

The observed harmonization in viral RNA dynamics between local sewer systems and the WWTPs confirms that WBE provides a scalable and hierarchical assessment of disease burden (Figure 2). In this study, El Algarrobal and Campo Espejo WWTPs offer an aggregated view of community prevalence, while sampling at maintenance holes allows for the identification of localized infection hotspots. The exceptionally high viral concentration observed at the Uspallata WWTP, despite a low number of diagnosed cases (72 cases), is particularly noteworthy. This discrepancy suggests a potential underestimation of epidemiological prevalence in the local population, a high rate of asymptomatic individuals, or variations in viral shedding. Uspallata receives substantial transit from long-distance truck drivers traveling between Chile and Argentina. This influx increases the likelihood of subclinical or undiagnosed infections contributing viral RNA to the sewage system and the treatment plant, which in this case provided timely evidence prompting governmental authorities to deploy an air ambulance for patients with severe complications. This was particularly relevant because this high-altitude region lacks high-complexity hospital and was not equipped to manage a substantial increase in clinically severe cases, especially those with respiratory compromise or comorbidities associated with increased health risk. The value of WBE is further reinforced by the regional Campo Espejo WWTP, where maximum detection preceded the clinical peak, demonstrating its utility in monitoring metropolitan-wide trends (Las Heras, Mendoza City, and Godoy Cruz).
Consequently, local sewer systems exhibit high sensitivity to abrupt shifts in viral dynamics enabling the detection of epidemiological fluctuations that might otherwise be diluted in larger-scale treatment facilities [17,18]. Nevertheless, Campo Espejo accurately mirrored the epidemic trajectory within the broader Mendoza metropolitan area, reinforcing the role of regional WWTP are as critical nodes for large-scale population monitoring [17].
The strong agreement between mean values from the six sewer maintenance holes and the viral load detected at Campo Espejo WWTP further supports the integrative capacity of centralized treatment plants. This consistency persists even when demographic density, wastewater flow, or industrial inputs vary considerably across the contributing catchments.

4.5. Epidemic vs. Endemic Phases of COVID-19 in Mendoza, Argentina

Human shedding of SARS-CoV-2 through excretions and secretions is well established [40,41], with viral genetic material in wastewater originating from symptomatic, pre-symptomatic, or asymptomatic individuals [42,43]. Long-term surveillance at the regional WWTP Campo Espejo revealed a fundamental shift in the viral load and dynamics in wastewater between the epidemic and endemic phases. The epidemic phase (2020–2021) included a high viral load where the first increase was followed by prolonged temporal persistence likely due to extended viral shedding among infected individuals (Figure 3a). Conversely, the high concentration of both markers N1 and N2 (Figure 3b) during July–August 2024 and December 2024–March 2025, without a corresponding increase in reported cases, suggests a state of viral endemicity. This pattern indicates that factors such as widespread population immunity (resulting from natural infection and vaccination), the emergence of different variants, and substantial changes in testing strategies, contributes to the decoupling of viral RNA presence in sewage from reported diagnosed cases. This decoupling suggests that while community circulation persists, a large proportion of infections may be asymptomatic or mild, therefore remaining undetected by formal health surveillance [44,45]. These findings show that WBE is a robust epidemiological strategy to detect viral circulation even under low-incidence conditions where tradition clinical surveillance loses sensitivity.
Data obtained in 2024 and 2025 reflect the transition of COVID-19 from epidemic scenario, characterized by widespread susceptibility, limited prior immunity, and intensive testing, to an endemic phase [44]. In the later phase, the population immunity, the circulation of different viral variants, and changes in testing strategies plays a major role in shaping the observed data [44,45].
WBE complements effectively the clinical genomic surveillance made in Mendoza hospitals, which documented a rapid and successive replacement of variants (from Delta/Gamma to dominant Omicron sub-lineages like JN.1 and BQ.1). Such monitoring is crucial for anticipating the circulation of emerging Variants Under Monitoring (VUM) such as XEC and KP.3.1.1, which may carry implications for vaccine effectiveness or transmissibility. However, genomic surveillance studies in wastewater have shown that shifts in dominant variants do not substantially alter the overall detectability of SARS-CoV-2 [46]. This pattern is mirrored in Mendoza, where viral loads between 2024 and 2025 likely reflect the co-circulation of multiple Omicron variants.
By examining the temporal fluctuations in SARS-CoV-2 viral loads (Figure 3a,b) with circulating viral clades in Argentina from 2020 to 2025 (https://covariants.org/per-country?region=World&country=Argentina, accessed on 26 January 2026), we observed that the initial viral detection in late July 2020 coincided with the predominance of clade 20A. Subsequent peaks of August and September were mainly associated with clades 20A and 20B, reflecting sustained circulation of early pandemic lineages. By late October 2020, elevated viral loads aligned with the persistence of these clades and the emergence of clade 21G (Lambda), indicating increased viral diversity. The major peak observed between late December 2020 and early 2021 was characterized by the co-circulation of multiple clades, including 20A, 20B, 21G, and the introduction of clade 20I (Alpha), suggesting enhanced transmissibility and complex epidemic dynamics during the second wave. Furthermore, during the transition toward the endemic phase, viral load increases in 2024 and 2025 were consistently associated with Omicron-derived clades. Specifically, the peak detected in May 2024 coincided with clade 24A, while sustained high viral loads during mid-2024 were dominated by clade 24E, followed by 24F in December 2024. In early 2025, viral load increases were associated with clades 24H and 25A, with the latter remaining predominant through mid-2025. Collectively, these findings indicate that wastewater viral load dynamics reflect not only changes in infection intensity and the sequential replacement of SARS-CoV-2 clades as the virus transitioned from pandemic to endemic circulation (sources: https://covariants.org/per-country?region=World&country=Argentina, accessed on 26 January 2026, and National Health Ministry, Argentina).
Notably, even in the absence of exhaustive genomic analyses, the recurrent detection of N1 and N2 markers suggests that WBE performance for SARS-CoV-2 does not depend strictly on the specific variant in circulation (see Figure 4), but rather on the underlying epidemiological phenomenon of continued community transmission, even when symptoms are mild or absent.

5. Conclusions

Our results demonstrate that SARS-CoV-2 RNA in wastewater closely reflected the epidemiological situation in Las Heras and consistently precedes by several days the increase in COVID-19 cases reported by the Health Ministry. Surveillance conducted at sewer maintenance holes provided high spatial resolution, enabling the identification of localized transmission peaks that were not always evident in clinical records. Concurrently, WWTPs effectively captured broader community trends, and the concordance between both scales confirms the reliability of WBE across different levels of population aggregation. The comparative analysis between local sewers and WWTPs show that upstream monitoring is more sensitive to abrupt, small-scale fluctuations, whereas plant-level surveillance integrates signals from larger urban catchments. The exceptionally high viral loads detected in Uspallata, a region characterized by low residential density but high cross-border mobility, highlight the utility of WBE in areas where clinical surveillance may considerably underestimate actual transmission rates.
Long-term monitoring revealed distinct changes in viral dynamics: the initial epidemic waves showed sustained and high viral loads with high number of diagnosed cases, whereas the endemic phase was characterized by low and intermittent detections, with a weakened correspondence to diagnosed cases. These patterns indicate persistent but low-intensity viral circulation in a population that has attained high immunity levels. Finally, the detection of viral RNA across 2024–2025, even in the absence of major clinical outbreaks, suggests that wastewater surveillance remains effective regardless of circulating variants, and reflects generalized community transmission rather than variant-specific behavior.
From a public health perspective, these findings demonstrate that integrating upstream sewer-level sampling with WWTP surveillance provides an actionable framework for early outbreak detection, hotspot identification, and continuous monitoring of viral circulation during endemic periods. This approach can inform timely, spatially targeted interventions, such as focused testing, risk communication, and healthcare resource allocation, thereby strengthening disease prevention strategies and enhancing preparedness for future resurgences or emerging pathogens.

Supplementary Materials

The following supporting information can be downloaded at: https://www.mdpi.com/article/10.3390/covid6020031/s1. Figure S1: Sewer manholes used for granular sampling in the metropolitan area of Las Heras, Mendoza, Figure S2: Population-level sampling obtained from treatment plants, compared to granular sampling from the metropolitan area of Las Heras, Mendoza, Table S1: Clinical cases diagnosed with COVID-19 and viral load from SARS-CoV-2 N1 and N2 markers in the granular sampling areas in the department of Las Heras, Mendoza, 2020-2021, Table S2: Clinical cases diagnosed with COVID-19 and viral load measured (N1 and N2 markers) in the WWTPs sampling in the department of Las Heras, Mendoza, 2020-2021, Table S3: Weekly COVID-19 cases and viral load based on SARS-CoV-2 N1 and N2 markers, based on the population served by the Campo Espejo WWTP, Mendoza. The data have been divided into two periods, epidemic and endemic phases.

Author Contributions

Conceptualization, M.G.-B. and I.A.V.; methodology, M.G.-B. and I.A.V.; software, M.G.-B.; validation, I.A.V.; formal analysis, M.G.-B. and I.A.V.; investigation, M.G.-B. and I.A.V.; resources, I.A.V. and M.G.-B.; data curation, M.G.-B.; writing—original draft preparation, M.G.-B.; writing—review and editing, I.A.V.; visualization, M.G.-B.; supervision, M.G.-B. and I.A.V.; project administration, M.G.-B.; funding acquisition, M.G.-B. and I.A.V. All authors have read and agreed to the published version of the manuscript.

Funding

This research was supported by Universidad Nacional de Cuyo, grants number 06/80020240300140UN and 06/80020240400082UN and DICyT, Ministerio de Salud y Deportes, Gobierno de Mendoza to M.G.-B. The APC was covered through full waiver of the journal.

Data Availability Statement

The data supporting the conclusions of this article will be made available by the authors upon request.

Acknowledgments

We thank the staff of the AYSAM company for providing the wastewater samples and the staff of the Health Ministry, Mendoza government and the municipality of Las Heras, who provided clinical-epidemiological data.

Conflicts of Interest

The authors declare no conflicts of interest.

Abbreviations

The following abbreviations are used in this manuscript:
WBEWastewater-Based Epidemiology
WWTPWastewater treatment plant
PEGPolyethylene glycol
PACAluminum polychloride
RT-qPCRReverse Transcription quantitative Polymerase Chain Reaction
VUMVariants under monitoring

References

  1. Lorenzo, M.; Picó, Y. Wastewater-based epidemiology: Current status and future prospects. Curr. Opin. Environ. Sci. Health 2019, 9, 77–84. [Google Scholar] [CrossRef]
  2. National Academies of Sciences, Engineering, and Medicine; Health and Medicine Division; Board on Population Health and Public Health Practice; Division on Earth and Life Studies; Water Science and Technology Board; Committee on Community Wastewater-based Infectious Disease Surveillance. Increasing the Utility of Wastewater-Based Disease Surveillance for Public Health Action: A Phase 2 Report; National Academies Press: Washington, DC, USA, 2024. [Google Scholar]
  3. Vitale, D.; Suárez-Varela, M.M.; Picó, Y. Wastewater-based epidemiology, a tool to bridge biomarkers of exposure, contaminants, and human health. Curr. Opin. Environ. Sci. Health 2021, 20, 100229. [Google Scholar] [CrossRef]
  4. Proctor, K.; Altamirano, J.; Kasprzyk-Hordern, B. Chemicals of emerging concern in wastewater treatment plants from Mendoza: Environmental study in a semiarid region of Argentina. J. Hazard. Mater. Adv. 2025, 18, 100662. [Google Scholar] [CrossRef]
  5. Mao, K.; Zhang, K.; Du, W.; Ali, W.; Feng, X.; Zhang, H. The potential of wastewater-based epidemiology as surveillance and early warning of infectious disease outbreaks. Curr. Opin. Environ. Sci. Health 2020, 17, 1–7. [Google Scholar] [CrossRef] [PubMed]
  6. Bowes, D.A. Towards a precision model for environmental public health: Wastewater-based epidemiology to assess population-level exposures and related diseases. Curr. Epidemiol. Rep. 2024, 11, 131–139. [Google Scholar] [CrossRef]
  7. Yang, F.; Jin, F.; Song, N.; Jiang, W.; Bai, M.; Fu, C.; Lu, J.; Li, Y.; Li, Z. Research Progress and Perspectives on Wastewater-Based Epidemiology: A Bibliometric Analysis. Water 2024, 16, 1743. [Google Scholar] [CrossRef]
  8. Diamond, M.B.; Keshaviah, A.; Bento, A.I.; Conroy-Ben, O.; Driver, E.M.; Ensor, K.B.; Halden, R.U.; Hopkins, L.P.; Kuhn, K.G.; Moe, C.L. Wastewater surveillance of pathogens can inform public health responses. Nat. Med. 2022, 28, 1992–1995. [Google Scholar] [CrossRef]
  9. Yousif, M.; Rachida, S.; Taukobong, S.; Ndlovu, N.; Iwu-Jaja, C.; Howard, W.; Moonsamy, S.; Mhlambi, N.; Gwala, S.; Levy, J.I. SARS-CoV-2 genomic surveillance in wastewater as a model for monitoring evolution of endemic viruses. Nat. Commun. 2023, 14, 6325. [Google Scholar] [CrossRef]
  10. Westhaus, S.; Weber, F.-A.; Schiwy, S.; Linnemann, V.; Brinkmann, M.; Widera, M.; Greve, C.; Janke, A.; Hollert, H.; Wintgens, T. Detection of SARS-CoV-2 in raw and treated wastewater in Germany–suitability for COVID-19 surveillance and potential transmission risks. Sci. Total Environ. 2021, 751, 141750. [Google Scholar] [CrossRef]
  11. Ciannella, S.; Gonzalez-Fernandez, C.; Gomez-Pastora, J. Recent progress on wastewater-based epidemiology for COVID-19 surveillance: A systematic review of analytical procedures and epidemiological modeling. Sci. Total Environ. 2023, 878, 162953. [Google Scholar] [CrossRef]
  12. Li, X.; Zhang, S.; Sherchan, S.; Orive, G.; Lertxundi, U.; Haramoto, E.; Honda, R.; Kumar, M.; Arora, S.; Kitajima, M.; et al. Correlation between SARS-CoV-2 RNA concentration in wastewater and COVID-19 cases in community: A systematic review and meta-analysis. J. Hazard. Mater. 2023, 441, 129848. [Google Scholar] [CrossRef]
  13. Antkiewicz, D.S.; Janssen, K.H.; Roguet, A.; Pilch, H.E.; Fahney, R.B.; Mullen, P.A.; Knuth, G.N.; Everett, D.G.; Doolittle, E.M.; King, K. Wastewater-based protocols for SARS-CoV-2: Insights into virus concentration, extraction, and quantitation methods from two years of public health surveillance. Environ. Sci. Water Res. Technol. 2024, 10, 1766–1784. [Google Scholar] [CrossRef]
  14. Mohring, J.; Leithäuser, N.; Wlazło, J.; Schulte, M.; Pilz, M.; Münch, J.; Küfer, K.-H. Estimating the COVID-19 prevalence from wastewater. Sci. Rep. 2024, 14, 14384. [Google Scholar] [CrossRef]
  15. Munteanu, V.; Saldana, M.A.; Dreifuss, D.; Ouyang, W.O.; Ferdous, J.; Mohebbi, F.; Roseberry, J.S.; Ciorba, D.; Bostan, V.; Gordeev, V.; et al. SARS-CoV-2 wastewater genomic surveillance: Approaches, challenges, and opportunities. Genome Biol. 2026, 27, 1. [Google Scholar] [CrossRef]
  16. Clark, J.R.; Maresso, A.W. Sewers to Solutions: A Guide to Wastewater Pathogen Monitoring. Annu. Rev. Med. 2025, 77, 493–508. [Google Scholar] [CrossRef]
  17. Parkins, M.D.; Lee, B.E.; Acosta, N.; Bautista, M.; Hubert, C.R.; Hrudey, S.E.; Frankowski, K.; Pang, X.-L. Wastewater-based surveillance as a tool for public health action: SARS-CoV-2 and beyond. Clin. Microbiol. Rev. 2024, 37, e00103-22. [Google Scholar] [CrossRef] [PubMed]
  18. Acosta, N.; Bautista, M.A.; Waddell, B.J.; McCalder, J.; Beaudet, A.B.; Man, L.; Pradhan, P.; Sedaghat, N.; Papparis, C.; Bacanu, A. Longitudinal SARS-CoV-2 RNA wastewater monitoring across a range of scales correlates with total and regional COVID-19 burden in a well-defined urban population. Water Res. 2022, 220, 118611. [Google Scholar] [CrossRef] [PubMed]
  19. Masachessi, G.; Castro, G.M.; Marinzalda, M.d.l.A.; Cachi, A.M.; Sicilia, P.; Prez, V.E.; Martínez, L.C.; Giordano, M.O.; Pisano, M.B.; Ré, V.E. Unveiling the silent information of wastewater-based epidemiology of SARS-CoV-2 at community and sanitary zone levels: Experience in Córdoba City, Argentina. J. Water Health 2024, 22, 2171–2183. [Google Scholar] [CrossRef] [PubMed]
  20. Barrio, A.; Borro, V.; Cicchino, M.; Morón, A.; Coronel, L.; Vuolo, J.; Mayón, P.; Moroz, A.; Maisa, P.; Alcántara, S. Detección de SARS-CoV-2 en aguas residuales como alerta temprana en el Área Metropolitana de la Ciudad de Buenos Aires (BAMA). Ribagua 2023, 10, 48–57. [Google Scholar] [CrossRef]
  21. Cruz, M.C.; Sanguino-Jorquera, D.; González, M.A.; Irazusta, V.P.; Poma, H.R.; Cristóbal, H.A.; Rajal, V.B. Sewershed surveillance as a tool for smart management of a pandemic in threshold countries. Case study: Tracking SARS-CoV-2 during COVID-19 pandemic in a major urban metropolis in northwestern Argentina. Sci. Total Environ. 2023, 862, 160573. [Google Scholar] [CrossRef]
  22. D’arpino, M.C.; Sineli, P.E.; Goroso, G.; Watanabe, W.; Saavedra, M.L.; Hebert, E.M.; Martínez, M.A.; Migliavacca, J.; Gerstenfeld, S.; Chahla, R.E. Wastewater monitoring of SARS-CoV-2 gene for COVID-19 epidemiological surveillance in Tucumán, Argentina. J. Basic Microbiol. 2024, 64, e2300773. [Google Scholar] [CrossRef]
  23. Giraud-Billoud, M.; Cuervo, P.; Altamirano, J.C.; Pizarro, M.; Aranibar, J.N.; Catapano, A.; Cuello, H.; Masachessi, G.; Vega, I.A. Monitoring of SARS-CoV-2 RNA in wastewater as an epidemiological surveillance tool in Mendoza, Argentina. Sci. Total Environ. 2021, 796, 148887. [Google Scholar] [CrossRef]
  24. Reno, U.; Regaldo, L.; Ojeda, G.; Schmuck, J.; Romero, N.; Polla, W.; Kergaravat, S.V.; Gagneten, A.M. Wastewater-based epidemiology: Detection of SARS-CoV-2 RNA in different stages of domestic wastewater treatment in Santa Fe, Argentina. Water Air Soil Pollut. 2022, 233, 372. [Google Scholar] [CrossRef] [PubMed]
  25. Masachessi, G.; Castro, G.; Cachi, A.M.; de los Ángeles Marinzalda, M.; Liendo, M.; Pisano, M.B.; Sicilia, P.; Ibarra, G.; Rojas, R.M.; López, L. Wastewater based epidemiology as a silent sentinel of the trend of SARS-CoV-2 circulation in the community in central Argentina. Water Res. 2022, 219, 118541. [Google Scholar] [CrossRef] [PubMed]
  26. Iglesias, N.G.; Gebhard, L.G.; Carballeda, J.M.; Aiello, I.; Recalde, E.; Terny, G.; Ambrosolio, S.; L’Arco, G.; Konfino, J.; Brardinelli, J.I. SARS-CoV-2 surveillance in untreated wastewater: Detection of viral RNA in a low-resource community in Buenos Aires, Argentina. Rev. Panam. De Salud Pública 2021, 45, e137. [Google Scholar] [CrossRef]
  27. Hart, J.J.; Jamison, M.N.; McNair, J.N.; Szlag, D.C. Frequency and degradation of SARS-CoV-2 markers N1, N2, and E in sewage. J. Water Health 2023, 21, 514–524. [Google Scholar] [CrossRef] [PubMed]
  28. Thakali, O.; Mercier, É.; Eid, W.; Wellman, M.; Brasset-Gorny, J.; Overton, A.K.; Knapp, J.J.; Manuel, D.; Charles, T.C.; Goodridge, L. Real-time evaluation of signal accuracy in wastewater surveillance of pathogens with high rates of mutation. Sci. Rep. 2024, 14, 3728. [Google Scholar] [CrossRef]
  29. Zhang, S.; Li, X.; Shi, J.; Sivakumar, M.; Luby, S.; O’Brien, J.; Jiang, G. Analytical performance comparison of four SARS-CoV-2 RT-qPCR primer-probe sets for wastewater samples. Sci. Total Environ. 2022, 806, 150572. [Google Scholar] [CrossRef]
  30. Mashau, F.; Dada, A.C.; Msolo, L.; Ebomah, K.E.; Ekundayo, T.C.; Iwu, C.D.; Nontongana, N.; Okoh, A.I. Factors affecting detection and estimation of SARS-CoV-2 RNA concentration of COVID-19 positive cases in wastewater influent: A systematic review. Public Health 2024, 237, 167–175. [Google Scholar] [CrossRef]
  31. Carmo dos Santos, M.; Cerqueira Silva, A.C.; dos Reis Teixeira, C.; Pinheiro Macedo Prazeres, F.; Fernandes dos Santos, R.; de Araújo Rolo, C.; de Souza Santos, E.; Santos da Fonseca, M.; Oliveira Valente, C.; Saraiva Hodel, K.V.; et al. Wastewater surveillance for viral pathogens: A tool for public health. Heliyon 2024, 10, e33873. [Google Scholar] [CrossRef]
  32. Zhao, L.; Faust Russell, A.; David Randy, E.; Norton, J.; Xagoraraki, I. Tracking the Time Lag between SARS-CoV-2 Wastewater Concentrations and Three COVID-19 Clinical Metrics: A 21-Month Case Study in the Tricounty Detroit Area, Michigan. J. Environ. Eng. 2024, 150, 06023004. [Google Scholar] [CrossRef]
  33. Helm, B.; Geissler, M.; Mayer, R.; Schubert, S.; Oertel, R.; Dumke, R.; Dalpke, A.; El-Armouche, A.; Renner, B.; Krebs, P. Regional and temporal differences in the relation between SARS-CoV-2 biomarkers in wastewater and estimated infection prevalence—Insights from long-term surveillance. Sci. Total Environ. 2023, 857, 159358. [Google Scholar] [CrossRef] [PubMed]
  34. Schill, R.; Nelson, K.L.; Harris-Lovett, S.; Kantor, R.S. The dynamic relationship between COVID-19 cases and SARS-CoV-2 wastewater concentrations across time and space: Considerations for model training data sets. Sci. Total Environ. 2023, 871, 162069. [Google Scholar] [CrossRef]
  35. López-Peñalver, R.S.; Cañas-Cañas, R.; Casaña-Mohedo, J.; Benavent-Cervera, J.V.; Fernández-Garrido, J.; Juárez-Vela, R.; Pellín-Carcelén, A.; Gea-Caballero, V.; Andreu-Fernández, V. Predictive potential of SARS-CoV-2 RNA concentration in wastewater to assess the dynamics of COVID-19 clinical outcomes and infections. Sci. Total Environ. 2023, 886, 163935. [Google Scholar] [CrossRef]
  36. Ahmed, W.; Tscharke, B.; Bertsch, P.M.; Bibby, K.; Bivins, A.; Choi, P.; Clarke, L.; Dwyer, J.; Edson, J.; Nguyen, T.M.H. SARS-CoV-2 RNA monitoring in wastewater as a potential early warning system for COVID-19 transmission in the community: A temporal case study. Sci. Total Environ. 2021, 761, 144216. [Google Scholar] [CrossRef]
  37. Randazzo, W.; Truchado, P.; Cuevas-Ferrando, E.; Simón, P.; Allende, A.; Sánchez, G. SARS-CoV-2 RNA in wastewater anticipated COVID-19 occurrence in a low prevalence area. Water Res. 2020, 181, 115942. [Google Scholar] [CrossRef] [PubMed]
  38. Korajkic, A.; McMinn, B.R.; Pemberton, A.C.; Kelleher, J.; Ahmed, W. The comparison of decay rates of infectious SARS-CoV-2 and viral RNA in environmental waters and wastewater. Sci. Total Environ. 2024, 946, 174379. [Google Scholar] [CrossRef]
  39. Bitter, L.C.; Kibbee, R.; Garant, T.; Örmeci, B. Impact of wastewater characteristics and weather events on the N2 and N1 gene target ratios during wastewater surveillance of SARS-CoV-2 at five treatment plants and an upper sewershed location. Sci. Total Environ. 2025, 981, 179592. [Google Scholar] [CrossRef] [PubMed]
  40. Prasek, S.M.; Pepper, I.L.; Innes, G.K.; Slinski, S.; Betancourt, W.Q.; Foster, A.R.; Yaglom, H.D.; Porter, W.T.; Engelthaler, D.M.; Schmitz, B.W. Variant-specific SARS-CoV-2 shedding rates in wastewater. Sci. Total Environ. 2023, 857, 159165. [Google Scholar] [CrossRef]
  41. Puhach, O.; Meyer, B.; Eckerle, I. SARS-CoV-2 viral load and shedding kinetics. Nat. Rev. Microbiol. 2023, 21, 147–161. [Google Scholar] [CrossRef]
  42. Cevik, M.; Tate, M.; Lloyd, O.; Maraolo, A.E.; Schafers, J.; Ho, A. SARS-CoV-2, SARS-CoV, and MERS-CoV viral load dynamics, duration of viral shedding, and infectiousness: A systematic review and meta-analysis. Lancet Microbe 2021, 2, e13–e22. [Google Scholar] [CrossRef]
  43. Bertels, X.; Demeyer, P.; Van den Bogaert, S.; Boogaerts, T.; van Nuijs, A.L.; Delputte, P.; Lahousse, L. Factors influencing SARS-CoV-2 RNA concentrations in wastewater up to the sampling stage: A systematic review. Sci. Total Environ. 2022, 820, 153290. [Google Scholar] [CrossRef] [PubMed]
  44. Nesteruk, I. Endemic characteristics of SARS-CoV-2 infection. Sci. Rep. 2023, 13, 14841. [Google Scholar] [CrossRef] [PubMed]
  45. WHO. End-to-End Integration of SARS-CoV-2 and Influenza Sentinel Surveillance: Revised Interim Guidance, 31 January 2022; World Health Organization: Geneva, Switzerland, 2022. [Google Scholar]
  46. Tiwari, A.; Adhikari, S.; Zhang, S.; Solomon, T.B.; Lipponen, A.; Islam, M.A.; Thakali, O.; Sangkham, S.; Shaheen, M.N.F.; Jiang, G.; et al. Tracing COVID-19 Trails in Wastewater: A Systematic Review of SARS-CoV-2 Surveillance with Viral Variants. Water 2023, 15, 1018. [Google Scholar] [CrossRef]
Figure 1. SARS-CoV-2 levels (RNA copies/100 mL) and COVID-19 cases identified across six sewershed sampling places (af) from Las Heras, Mendoza, Argentina, between 1 January and 17 June 2021. Sampling dates were January 1–3 (day 0), January 8–12 (≈day 7), January 26–27 and February 3 (≈day 25), March 11–15 (≈day 70), April 20–23 (≈day 110) and June 14–17 (≈day 140).
Covid 06 00031 g001
Figure 2. Mean viral levels and confirmed COVID-19 cases in the metropolitan area’s sewer system of Las Heras (a), compared with data from local WWTPs El Algarrobal (b) and Uspallata (c), and the regional Campo Espejo WWTP (d). Sampling dates were January 1–3 (day 0), January 8–12 (≈day 7), January 26–27 and February 3 (≈day 25), March 11–15 (≈day 70), April 20–23 (≈day 110) and June 14–17 (≈day 140).
Covid 06 00031 g002
Figure 3. Long-term surveillance at Campo Espejo WWTP. Dynamic temporal of SARS-CoV-2 during (a) the initial epidemic waves (2020–2021) and (b) the endemic phase (2024–2025) in Mendoza. Sampling was carried out every two weeks from December 2020 to June 2021, while the sampling was monthly from April 2024 to September 2025. In both panels, clinical data (gray bars) represent the aggregate number of reported COVID-19 cases during the seven days preceding each wastewater sampling date.
Covid 06 00031 g003
Figure 4. Circulation of SARS-CoV-2 variants in Mendoza province, Argentina, between 2021 and 2025 (Data provided by the Health Ministry, Government of Mendoza). Values are expressed as the percentage of each variant calculated from the total number of sequencing tests performed annually on clinical patient samples: (a) 2021 (n = 373); (b) 2022 (n = 170); (c) 2023 (n = 86); (d) 2024 (n = 57); (e) 2025 (n = 24).
Covid 06 00031 g004
Disclaimer/Publisher’s Note: The statements, opinions and data contained in all publications are solely those of the individual author(s) and contributor(s) and not of MDPI and/or the editor(s). MDPI and/or the editor(s) disclaim responsibility for any injury to people or property resulting from any ideas, methods, instructions or products referred to in the content.