Abstract
High-throughput biological and chemical assays increasingly require parallel sample manipulation using arrays of micronozzle apertures. Liquid-to-liquid ejection avoids air–liquid interfaces, thereby reducing sample evaporation and mechanical stress while simplifying device operation. However, existing microfluidic platforms for parallel handling suffer from high dead volume, limited optical access, and poor scalability due to thick structural layers. Here, we present a transparent three-layer 4 × 4 micronozzle array with 40 μm diameter openings and a photolithographically fabricated SU-8 membrane. Our sacrificial layer process yields a 30 µm SU-8 membrane—approximately a 70% reduction in thickness—thereby lowering vertical channel dead volume and eliminating the need for costly glass etching. The resulting architecture enables parallel particle and nanoliter liquid manipulation with real-time optical clarity and enables water-to-water ejection, avoiding air–liquid interfaces. This work demonstrates the water-to-water ejection of 0.5–10 µm microparticles using a transparent, low-dead volume SU-8/PDMS micronozzle array and provides a basis for future studies on substrate deposition and cell handling workflows.
1. Introduction
Single-cell manipulation and nanoliter liquid handling are fundamental technologies for cell biology, biochemistry, and biomedical engineering. Conventional fluidic and cell manipulation is typically performed in closed microfluidic systems; however, open microfluidic systems have recently emerged as powerful alternatives [1]. Open microfluidics brings advantages such as the ability to access a fluid at any point and the simplification of manufacturing techniques and surface modification. Single cells and picoliter to nanoliter volumes of liquid were manipulated in open space with a glass capillary [2,3], a probe with an aperture [4,5,6], an inkjet-like printer [7,8,9,10,11,12], electro-kinetic pumps [13], dispensers [14,15,16,17,18,19], and printed droplet microfluidics [20,21]. These manipulation methods provided sufficient versatility and accessibility compared with conventional closed systems. A key operating mode in open systems is ejection into a liquid phase across a liquid–liquid interface, which reduces sample evaporation, minimizes mechanical stress, and simplifies ejection mechanisms. Efficient transport between the interior and exterior of microfluidic systems often relies on arrays of microholes. Transparency is desirable to visualize internal flows and to align samples with substrates.
Microholes have been traditionally fabricated from inorganic materials such as glass [22,23], silicon [14,15,24,25,26,27,28,29], silicon nitride film [30,31], and metal [32,33]. Among various removal processes of inorganic materials, wet and dry etching are primary approaches because of their scalability and compatibility with microfabrication. The etching methods for silicon are established, but its opacity makes it difficult to observe the internal structure of a device. Silicon nitride films should be supported by other materials, such as silicon, and two-step etching is needed. Glass has transparency and it is suitable for the internal observation of a device. However, glass presents challenges for wet and dry etching [34]. The rate of glass dry etching is 0.5–0.7 μm/min, which is relatively slow, and wet etching also struggles to achieve aspect ratios greater than one, making it difficult to create high-aspect ratio structures.
Microholes have been made in organic materials such as polymethyl methacrylate (PMMA) [35,36], polydimethylsiloxane (PDMS) [13,37,38], and SU-8 [6,12,16,17,39,40]. Organic materials can be processed under milder conditions than inorganic materials and often do not require expensive equipment. SU-8 is an epoxy-based negative photoresist and can be easily patterned by photolithography; thus, this simple processing is promising for a wide range of research. In addition, SU-8 is transparent and its structure does not hinder the internal observation of the device. In previous studies, SU-8 structures were typically thicker than 100 µm to withstand processing-induced deformation; however, such thicknesses increased the dead volume of microchannels and through-holes. This thickness increase was required because the Young’s modulus of SU-8 is on the order of gigapascals [41], making the handling of thin SU-8 substrates challenging. Thin SU-8 structures require support from other substrates, and it is necessary to develop a new process to make the membrane thinner.
This study presents the fabrication of an SU-8-based transparent micronozzle array for parallel manipulation. The thickness of an SU-8 structure is reduced by placing it on a sacrificial layer and a supporting substrate, before bonding and releasing. The sacrificial layer is dissolved after bonding SU-8 and PDMS. PDMS exhibits flexibility and is suitable for bonding. This method enables the use of a thinner SU-8 membrane and reduces the dead volume of vertical microchannels. Water-to-water ejection is demonstrated, and particle movement and ejection—together with flows of cell-sized particles—are characterized to establish device function.
2. Materials and Methods
2.1. Design of the Micronozzle Array
We designed a 4 × 4 micronozzle array to enable the parallel manipulation of particles ranging from 0.5 to 10 μm, encompassing typical cell-sized applications. The design approach prioritized three key functional requirements: (1) reliable particle passage through individual nozzles, (2) precise alignment between flow and pneumatic control layers, (3) scalable parallel operation across the entire array.
To achieve this parallel ejection, we designed the array in three separate layers bonded together by plasma treatment. These layers consist of (1) a flow channel fabricated in negative epoxy photoresist SU-8 3050, (2) a pneumatic channel, (3) a PDMS membrane. The holes in the flow channel discharge particles and/or liquids from the openings. The order of layer placement is shown in Figure 1a.
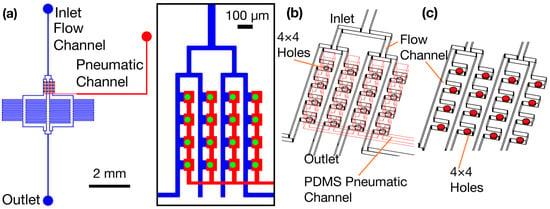
Figure 1.
The design of the 4 × 4 micronozzle array. (a) Top view of micronozzle array showing a PDMS pneumatic channel and the SU-8 flow channels and holes. (b) 3-dimensional view of a flow channel along with a superimposed pneumatic channel. (c) Each opening in the flow channel has a separate chamber in a pneumatic channel.
A thin PDMS membrane separates the flow channel and pneumatic channel. When pneumatic pressure is applied, this membrane works as a pneumatic valve for openings (Figure 1b). The three-dimensional relationship between the flow channels and superimposed pneumatic channels is illustrated in Figure 1b, showing how the layers are integrated for parallel operation.
Each opening in the flow channel has a separate chamber under a pneumatic channel (Figure 1b), enabling the individual control of each nozzle. To facilitate the flow of particles and efficient trapping, we designed the flow channel to accommodate particles that are near cell size for discharge. We selected a 40 µm opening diameter and a 30 µm opening height to accommodate the target particle sizes. The distance between the centers of two consecutive openings is 120 μm. The width of the connecting channel is 30 μm, and the distance between two consecutive chambers is 90 μm (Figure 1c).
2.2. Fabrication of the Micronozzle Array
The fabrication method presented here is applicable to both multi-nozzle arrays for parallel throughput and single-nozzle designs for high-precision applications.
2.2.1. Microholes and Flow Channels
Microholes and flow channels were fabricated in SU-8 (Figure 2a,b). A 4-inch Si wafer was cleaned with acetone and isopropyl alcohol (IPA) and blown with nitrogen gas. The Si wafer was coated with a sacrificial layer of OmniCoat (Kayaku Advanced Materials, Westborough, MA, USA) (Figure 2a). A solution of OmniCoat was spin-coated (1H-DX2, MIKASA Co., Ltd., Tokyo, Japan) with a ramp for 5 s, at 500 rpm for 20 s, a ramp for 5 s, rotation at 1200 rpm for 60 s, and finally a ramp for 10 s. It was baked at 190 °C for 1 min.
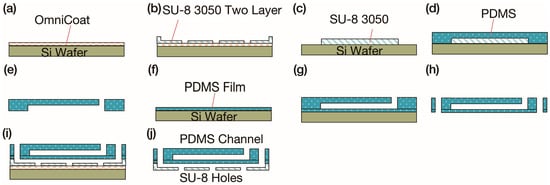
Figure 2.
Fabrication process of the micronozzle array. (a) OmniCoat sacrificial layer coating on Si wafer. (b) Two-layer SU-8 patterning for flow channels and microholes. (c) SU-8 mold preparation for PDMS pneumatic channels. (d) PDMS molding and degassing. (e) PDMS pneumatic channel demolding and punching. (f) Thin PDMS membrane fabrication by spin coating. (g) Plasma bonding of pneumatic channel and membrane. (h) Hole punching in bonded PDMS layers. (i) SU-8/PDMS plasma bonding and alignment. (j) NMD-3 dissolution of OmniCoat sacrificial layer for device release.
The first layer of SU-8 3050 (Kayaku Microchem) was spin-coated onto the OmniCoat layer with the following parameters: a ramp for 5 s, rotation at 500 rpm for 20 s, a ramp for 5 s, rotation at 5000 rpm for 60 s, and finally a ramp for 10 s. The wafer was prebaked at 65 °C for 2 min, then at 95 °C for 15 min, followed by at 65 °C for 2 min, and finally at room temperature for 5 min. The wafer was exposed to UV with a light integral of 2500 mJ/cm2 through an i-line filter with a mask aligner (PEM-800, UNION OPTICAL Co. LTD., Tokyo, Japan). It was post-baked at 65 °C for 2 min, then at 95 °C for 5 min, followed by 65 °C for 2 min, and then at room temperature for 5 min.
The second layer of SU-8 3050 was coated under the following conditions: a ramp for 5 s, rotation at 500 rpm for 20 s, a ramp for 5 s, rotation at 3000 rpm for 60 s, and finally a ramp for 10 s. The second layer was exposed to UV light with an integral of 2500 mJ/cm2 through the i-line filter. It was post-baked at 65 °C for 2 min, then at 95 °C for 5 min, followed by 65 °C for 2 min, and finally at room temperature for 5 min. The SU-8 was developed in 2-methoxy-1-methylethyl acetate (PGMEA, FUJIFILM Wako Pure Chemical Corporation, Osaka, Japan) for 10 min.
2.2.2. Pneumatic Channel
Patterned SU-8 was prepared and used as a mold for PDMS molding (Figure 2c). A 4-inch Si wafer was cleaned similarly, and a layer of SU-8 3050 was spin-coated on the Si wafer with a spin coater (a ramp for 5 s, rotation at 500 rpm for 20 s, a ramp for 5 s, rotation at 2000 rpm for 60 s, and finally a ramp for 10 s). It was pre-baked at 65 °C for 2 min, then at 95 °C for 15 min, followed by 65 °C for 2 min, and finally at room temperature for 5 min. This pattern was transferred to a silicon wafer that was already coated with a layer of SU-8 3050. The wafer was then exposed to UV light with a total dose of 2500 mJ/cm2 for 170 s through the mask aligner. It was post-baked at 65 °C for 2 min, then at 95 °C for 5 min, followed by 65 °C for 2 min, and finally at room temperature for 5 min. The SU-8 was developed in PGMEA for 10 min.
PDMS (Silpot 184, Toray Dow Corning Co., Ltd., Tokyo, Japan) was prepared by mixing the main agent and curing agent in a 10:1 ratio. The PDMS mixture was poured over the mold, and bubbles were removed (Figure 2d). The PDMS was cured at room temperature for 48 h. The final shape was cut out with a scalpel, and the PDMS chips were punched (Figure 2e).
2.2.3. PDMS Membrane and Bonding
A 4-inch Si wafer was cleaned and silanized with trichloro (1H,1H,2H,2H-perfluorooctyl) silane (PFOCTS, Tokyo Chemical Industry Co., Ltd. (TCI), Chuo-ku, Tokyo, Japan). The PDMS mixture was stirred in a vacuum to eliminate air bubbles and was spin-coated (Figure 2d) over the Si wafer with the following conditions: a ramp for 5 s, rotation at 500 rpm for 20 s, a ramp for 5 s, rotation at 3000 rpm for 60 s, and a ramp for 10 s. The PDMS was cured at 80 °C for 40 min.
The PDMS membrane and PDMS pneumatic channel were bonded after air plasma activation (Figure 2g). Both samples were placed in a vacuum desktop plasma machine (PIB-20, Vacuum Device Co., Ltd., Mito, Ibaraki, Japan) and treated. The bonded chips were baked at 80 °C for 20 min, and holes were punched (Figure 2h). SU-8/PDMS bonding [42] was employed to bond the SU-8 structure to the PDMS chips (Figure 2i). The PDMS chips were treated in PIB-20 with a nitrogen gas flow rate of 10 sccm, pressure of 50 Pa, and current of 20 mA for 2 min 30 s. The SU-8 microholes were then aligned with the PDMS features under a stereomicroscope. It was baked at 120 °C for 15 min to complete the fabrication of the micronozzle array. The OmniCoat layer was dissolved in NMD-3 (TMAH 2.38% solution, Tokyo Oka Kogyo Co., Ltd., Kawasaki, Japan) for 2 h to release the chips (Figure 2j).
2.3. Bonding Strength of PDMS and SU-8 3050
Since the basis of the fabrication of the micronozzle array device is bonding SU-8 3050 to PDMS, we measured the bonding strength to ensure that the device would not break down or malfunction under the application of excess flow and pneumatic pressure. During device operation, the maximum internal pressure during operation is approximately 180 kPa due to the applied pneumatic pressure, requiring a bonding strength that exceeds this threshold. A simple experimental setup was developed to evaluate the bonding strength between SU-8 and PDMS using pressurized air testing.
We prepared 1 × 1 × 0.5 cm3 PDMS pieces with punched holes for pneumatic introduction and used three separate conditions by varying current during the N2 plasma bonding process. The current values used were 10, 20, and 30 mA. The nitrogen gas flow rate was 10 sccm, the pressure during plasma processing was 50 Pa, and the processing time was 2 min and 30 s. These conditions were kept constant for all current values used. After plasma treatment, PDMS was bonded to SU8-3050 within 60–90 s and baked at 120 °C for 15 min to complete the bonding process.
To evaluate the bond strength, we connected a 6 mL syringe to the PDMS piece using the experimental setup and applied pneumatic pressure using a syringe pump at a flow rate of 0.1 mL/s. The pressure at which delamination began at the bonding interface was measured to determine the bonding strength. This testing protocol provided quantitative data on the maximum pressure each plasma current condition could withstand before bond failure occurred.
2.4. Flow Characterization
Figure 2j shows a schematic cross-sectional representation of the device architecture at the release step. An air pressure inlet was placed on the top layer (pneumatic channel), and an exit was placed on the bottom layer (flow channel). PDMS was used for the fabrication of the pneumatic channel layer. PDMS is a transparent silicone that provides high mold transfer accuracy and air permeability. All flow experiments were conducted in an aqueous environment, and ejection was performed water-to-water without introducing an air–liquid interface. The detailed flow analysis and theoretical modeling are presented in subsequent sections.
The device comprises four parallel flow channels, each with four openings. For imaging and quantification, we analyzed the third channel from the top. Openings along this channel were labeled A–D in order from the inlet (upstream) toward the outlet (downstream) (Figure 3a). Particle ejection through these openings was observed (Figure 3b).
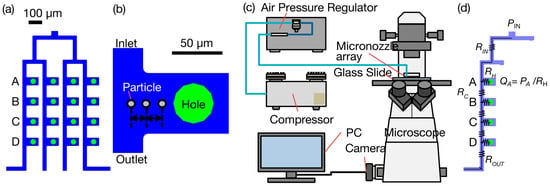
Figure 3.
Experimental and theoretical setup for underwater flow characterization. (a) Top-view schematic of the 4 × 4 micronozzle array flow channels, indicating the four outlets (A, B, C, D) in one channel selected for analysis. Scale bar: 100 µm. (b) Close-up schematic of a section of the flow channel near a hole opening. Scale bar: 50 µm. (c) Schematic of the experimental observation setup for liquid-to-liquid ejection, including a microscope, a high-speed camera, an air pressure regulator, a compressor, and a PC for controlling inlet pressure and recording particle movement. (d) An equivalent fluidic resistance circuit model used for theoretical analysis. PIN denotes input pressure, RIN, RC, RH, and ROUT denote fluidic resistances, PA to PD denote node pressures, and QA to QD denote calculated hole flow rates.
The flow through a nozzle array was measured using tracer latex beads (L4530, carboxylate-modified polystyrene, fluorescent yellow–green, a solid composition of 2.5%, SIGMA-Aldrich, St. Louis, MO, USA). The average particle size was about 0.5 µm, and the excitation wavelength was 470 nm. The experiment was repeated using tracer particles of size 2 µm at varying applied pressures. The motion of 5 particles was tracked for one value of applied pressure to calculate the flow velocity and volumetric flow rate through the openings. Furthermore, 10 µm particles were used at a constant applied pressure to check if the fabricated device dispensed particles with a near-cell diameter. Compressed air was supplied to the pneumatic channel in the nozzle array through a pressure control device (Figure 3c). Observations were made with an inverted microscope (Eclipse Ti-U, Nikon, Tokyo, Japan) and a digital camera (DIGITAL SIGHT DS-QiMc, Nikon) or a high-speed camera (HAS-D71, DITECT Co., Ltd., Tokyo, Japan). For high-speed imaging, the image size was 640 × 480 pixels with frame rates of 500 and 1000 frames per second (fps).
2.5. Modified Nodal Analysis (MNA)
This section details the mathematical model used to simulate the pressure distribution and flow rates within the micronozzle array, based on an analogy to electrical circuits [43,44] and employing Modified Nodal Analysis (MNA) [45,46]. Our model corresponds to the experimental liquid-to-liquid ejection configuration, with no gas–liquid interface present.
We used design dimensions to calculate the effective flow resistances (Figure 3d). The channels for the particles/cells were designed with four equal channel resistances, and the discharge of the four particles in parallel is equal. The hydraulic resistance of a rectangular microchannel is
where R = Δp/Q and μ, L, w, h denote dynamic viscosity, channel length, width, and height, respectively (units of R: Pa·s·m−3). The relationship between the input pressure (PIN) and the pressures at the internal nodes (A, B, C, D) is determined by solving a system of linear equations. This system is derived by applying conservation of flow (analogous to Kirchhoff’s Current Law) at each internal node. The system can be expressed in matrix form as
where is the coefficient matrix derived from the fluidic resistances of the circuit components. is the vector of unknown variables, representing the pressures at the internal nodes. is the source vector, representing the known input pressure source.
The coefficient matrix encapsulates the connectivity and resistance values of the fluidic network. Based on the circuit derived from the micronozzle geometry and the defined resistances (), the matrix A is constructed as follows:
The diagonal elements represent the sum of conductances (inverse of resistances) connected to node i.
The off-diagonal elements represent the negative conductance between node i and node j.
The resistance to the main outlet
is assumed to be infinite, meaning its conductance () is zero. This simplifies the last diagonal element.
The resulting matrix is
The unknown vector contains the pressures at the internal nodes A, B, C, and D, which are the values we aim to solve for
The source vector b represents the input conditions. In this model, there is an input pressure source PIN, connected to node A through the input resistance RIN. The source vector b accounts for the 4-way branching flow distribution from the inlet: All other nodes have no direct input source. This modification reflects the physical reality that the total input flow rate, PIN/RIN is equally distributed among four parallel flow channels, resulting in an effective source flow rate of PIN/4RIN at the primary node, consistent with conservation of mass at the inlet junction.
Solving the linear system for yields the pressures at each internal node for a given input pressure PIN. This is computationally performed using numerical methods, such as the numpy.linalg.solve function in Python 3.11, which efficiently finds without explicitly calculating the inverse matrix .
Once the node pressures are known, the flow rate through each outlet hole (), connected via resistance RH, can be calculated using the fluidic equivalent of Ohm’s Law as follows:
This mathematical description, derived from MNA, forms the basis for the simulation results presented, linking the physical design parameters (resistances derived from dimensions listed in Section 3.2) to the observable pressures and flow rates within the micronozzle array.
3. Results and Discussion
3.1. Fabrication Process and Success Rate
Figure 4 shows a micronozzle array after fabrication. The nozzle array was made of PDMS and SU-8, which are transparent materials suitable for observation. It was composed of the top structure of PDMS and the bottom structure of SU-8 photoresist. The device architecture consisted of three distinct layers bonded together through plasma treatment: a flow channel fabricated in negative epoxy photoresist SU-8 3050, a pneumatic channel layer made from PDMS, and a thin PDMS membrane separating the two functional layers.
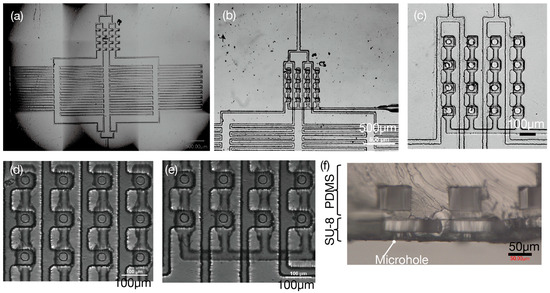
Figure 4.
Fabrication results of micronozzle array. (a) An entire microchip. (b) Central region of microchip. (c) Close-up view of 4 × 4 micronozzles. (d) 3 rows of micronozzles, where the pneumatic channels, the openings, and flow channels are aligned. (e) 2 rows of micronozzles, where the pneumatic channels, the openings, and flow channels are aligned. (f) Cross-sectional view of the micronozzle showing different layers used for thickness measurement.
Figure 4a presents the entire microchip showing the two-layer SU-8 structure. The SU-8 was patterned onto a Si substrate coated with OmniCoat as a sacrificial layer. The sacrificial layer approach proved highly effective, enabling the production of ultra-thin SU-8 structures while maintaining structural integrity during fabrication and handling processes. The SU-8 membrane was bonded to the PDMS after treating the PDMS with amino groups by N2 plasma treatment. This plasma treatment created functional amino groups on the PDMS surface, facilitating strong chemical bonding with the epoxy groups present in the SU-8 material.
NMD-3 was used to dissolve the OmniCoat sacrificial layer. The dissolution process was conducted for 2 h, allowing the complete removal of the sacrificial material without damage to the bonded structure. The fabrication process demonstrated exceptional reproducibility and reliability, with 10/10 chips successfully separated from the OmniCoat layer. This 100% success rate validates the robustness of the proposed sacrificial layer approach and demonstrates the scalability of the manufacturing process.
Figure 4b shows the central region of the microchip, while Figure 4c displays a close-up view of the 4 × 4 micronozzles. The misalignment of the SU-8 and PDMS layers was within 5 μm, and the accuracy was sufficient for operation. This high alignment precision was achieved through careful stereomicroscope-guided positioning during the bonding process. The successful alignment is evident in Figure 4d,e, which show proper alignment between pneumatic channels, openings, and flow channels across multiple rows of micronozzles, with Figure 4d displaying three rows and Figure 4e showing two rows.
Figure 4d,e demonstrate the successful fabrication of the multi-row micronozzle arrays with high structural integrity and precise inter-layer alignment. The fabricated devices clearly show the intended three-layer architecture with proper bonding between all interfaces, confirming the effectiveness of the plasma treatment process. Figure 4f provides a cross-sectional view of the micronozzle structure, enabling the precise thickness measurement and validation of the achieved dimensional accuracy across all fabricated layers.
3.2. Dimensional Accuracy and Material Advantages
The dimensions of the major structures of the micronozzle array are shown in Figure 5. Through-holes were created on the bottom SU-8 structure, and the diameter of the holes was 39.0 ± 1.4 μm (n = 16). This represents only a 2.5% deviation from the target design value of 40 μm, demonstrating the precision of the photolithography process. The hole diameter was set to be larger than single cells. Figure 4f is a cross-sectional view of the microfluidic transport structure. The height of the pneumatic channel was 51.4 ± 0.4 μm (n = 4). The height of the microholes was 18.4 ± 0.4 μm (n = 4). The height of the two SU-8 layers was 27.4 ± 0.5 μm (n = 4).
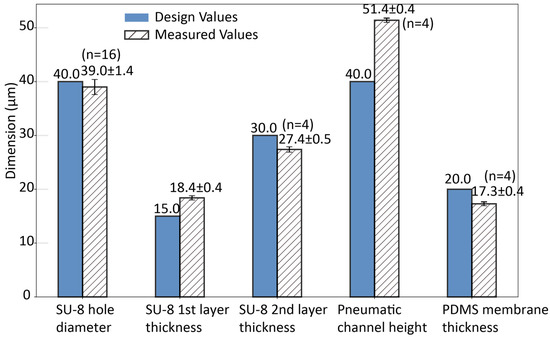
Figure 5.
Dimensional accuracy of micronozzle array structures: comparison between design and measured values.
We obtained a pore diameter of 39 µm and an opening height of 18.4 µm, yielding an aspect ratio of 0.5. The ratio of the nozzle hole diameter to the hole depth, i.e., the thickness of the structure where the hole is open, or the aspect ratio, should be less than 1 to decrease the flow resistance of the nozzle and place cells or liquid with higher precision. This decrease in flow resistance is also beneficial for the fast response of a flow. The low-aspect ratio design significantly contributes to the device performance by minimizing pressure losses and enabling more precise control over particle ejection dynamics.
The previous fabrication methods [6,12,16,17,39,40] needed the thickness of SU-8 to be more than 100 μm. A ~30 μm thick substrate was supported on a silicon wafer during the handling of SU-8 substrates, which reduced the SU-8 membrane thickness. This represents a significant advancement over conventional approaches, achieving a thickness reduction of approximately 70% compared with traditional methods. The reduced thickness significantly minimizes the dead volume in vertical microchannels, improving precision for nanoliter-scale liquid handling applications.
Our polymer-based approach eliminates the need for glass substrates and complex etching processes. The combination of transparent PDMS and SU-8 materials enables real-time optical monitoring while the photolithography-based fabrication provides high mold transfer accuracy. This method produces straight, vertical hole profiles that enhance flow characteristics and reduce flow resistance, contrasting with the angled profiles typically resulting from etching processes.
Beyond these technical advantages, the fabrication approach offers significant practical benefits. The room-temperature PDMS curing process (48 h) and relatively low-temperature processing (maximum 190 °C for OmniCoat) make the process accessible to laboratories without specialized high-temperature equipment. This accessibility and cost-effectiveness make the technology suitable for widespread adoption in research and, potentially, commercial applications.
3.3. Bonding Strength Evaluation Between SU-8 and PDMS
The bonding strength between SU-8 3050 and PDMS was evaluated as a function of plasma treatment conditions using a PIB-20 plasma treatment device (Vacuum Device Co., Ltd.) to ensure reliable device operation. The PIB-20 is a multi-purpose plasma ion bombarder that generates AC plasma for surface modification applications. For all experiments, the nitrogen gas flow rate was maintained at 10 sccm, the pressure was set at 50 Pa, and the processing time was 2 min and 30 s.
The bonding strength was dependent on the plasma current used during the bonding process. When a plasma current of 10 mA was applied using the PIB-20 device, the bond strength between SU-8 3050 and PDMS was 416 ± 189 kPa. When a 20 mA plasma current was used, the bond strength was 609 ± 271 kPa, representing a 46% improvement in bonding performance. At 30 mA, the values exceeded the measurement capability of the syringe pump system, indicating bonding strengths exceeding 800 kPa. The large deviations may be attributed to variations in the delay between plasma treatment and PDMS placement on the SU-8 3050 layer, which was performed manually, introducing variability in surface activation and bond formation.
Since these bonding strengths were much higher than the operating pressure limit (about 180 kPa), the SU-8 3050 proved suitable for fabricating the particle flow channel. The bonding strength achieved at 20 mA plasma current provides a safety factor of 3.4 times the maximum operating pressure, ensuring reliable sealing during device operation. The PIB-20 plasma treatment creates amino functional groups on the PDMS surface through nitrogen plasma exposure, which form strong chemical bonds with the epoxy groups present in the SU-8 material.
3.4. Device Functionality and Integrity Verification
To verify the practical performance and structural integrity of the bonded devices, functional testing was conducted using compressed air introduction through the inlet of the micronozzle array while submerged in water. Bubble generation was observed from all 16 apertures, confirming both the structural integrity of the microhole array and the absence of interfacial leakage between the PDMS and SU-8 layers. This consistent bubble formation across all apertures demonstrated the quality of the bonding process and validated the fabrication approach for subsequent flow and particle manipulation experiments.
3.5. Characterization of Flow with Tracer Particles
The device was fabricated in the transparent materials of PDMS and SU-8 3050, which allowed real-time monitoring and effective control over particle movement and ejection. To demonstrate the versatility and precision of the micronozzle array across different particle sizes relevant to biological applications, three types of particles with diameters of (1) 0.5 µm, (2) 2 µm, (3) 10 µm were used to demonstrate ejection. All ejection experiments in this section were performed by discharging into water under aqueous immersion.
3.5.1. φ0.5 µm Beads
The 0.5 µm carboxylate-modified polystyrene particles labeled with fluorescent yellow–green were used for qualitative flow characterization through the micronozzle array. These submicron particles exhibited a uniform distribution across all 16 micronozzles, with smoothly directed flows from upstream to downstream. Individual particle tracking confirmed ejection through each nozzle opening, as documented in Figure 6 and Supplementary Movie S1. The transparent PDMS and SU-8 3050 materials enabled the real-time fluorescence monitoring of particle trajectories, allowing the precise characterization of flow dynamics at the nanoliter scale.
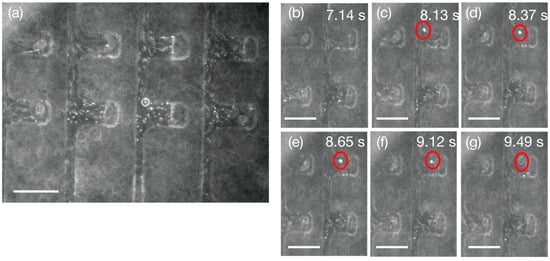
Figure 6.
Fluorescent microscope images of liquid-to-liquid ejection with 0.5 µm particles through a micronozzle array. (a) 2 × 4 micronozzles showing underwater particle flow. (b–g) Ejection of an individual observed fluorescent imaging confirming the ejection. 2 × 2 micronozzles are shown here. Red circles mark the same representative 0.5-µm particle tracked across frames, with timestamps indicating elapsed time from actuation. The movie is available as Movie S1. Scale bars: 100 µm.
The comparison between flow-driven and Brownian motion conditions revealed the device’s capability to overcome thermal fluctuations for controlled particle manipulation. Supplementary Movie S2 demonstrates the random Brownian motion of 0.5 µm particles under no-pressure conditions, contrasting sharply with the directed flow behavior observed during pressure-driven ejection. This size range is particularly relevant for biological applications involving exosomes, small extracellular vesicles, and bacterial detection, where the precise manipulation of submicron entities is critical for advanced microfluidic applications.
3.5.2. φ2 µm Beads
Next, 2 µm particles were used for quantitative flow characterization through the micronozzle array. Figure 7a shows the ejection and trajectory of a single particle through opening C, with successful ejection demonstrated at both 1 kPa (Movie S3) and 5 kPa (Movie S4) under bright-field microscopy. Due to the high particle velocities, tracking was challenging and required high-speed imaging at 500 fps. Movie S5 was obtained at 500 fps and an applied pressure of 1 kPa, while Movie S6 shows multiple ejections through all four openings at a higher applied pressure of 5 kPa, also observed at 500 fps. The focus was placed on the channel in the second row from the left, as the transparent SU-8 and PDMS materials enabled the direct visualization of particle flow through the channels, confirming successful particle passage and discharge from the apertures.
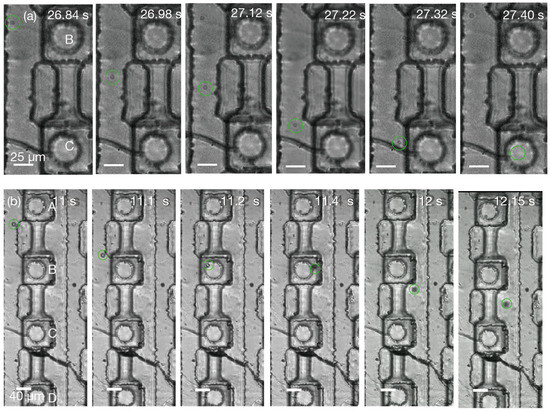
Figure 7.
Underwater particle ejection through micronozzle openings into aqueous phase. Openings A–D denote the four micronozzle openings in one unit cell, labeled from top to bottom as A, B, C, and D. (a) Ejection of a 2 µm particle through opening C (Movie S5). (b) Sequential ejection of a 10 µm tracer particle through opening B. Particle ejection was observed through changes in the focal plane. Green circles mark the same representative tracer particle tracked across frames; timestamps indicate elapsed time from actuation.
Flow rates were calculated through particle velocity measurements from high-speed videos, enabling the quantification of ejection performance across openings A, B, C, and D (defined from the upstream side). Figure 8 demonstrates the relationship between applied pressure and flow rate. The quantitative analysis revealed strong linear relationships: opening A, Q = 1011P (R2 = 0.9926); B, Q = 627 P (R2 = 0.9871); C, Q = 301 P (R2 = 0.9968); D, Q = 60 P (R2 = 0.9923), where Q represents flow rate (pL/s) and P is the pressure (kPa).
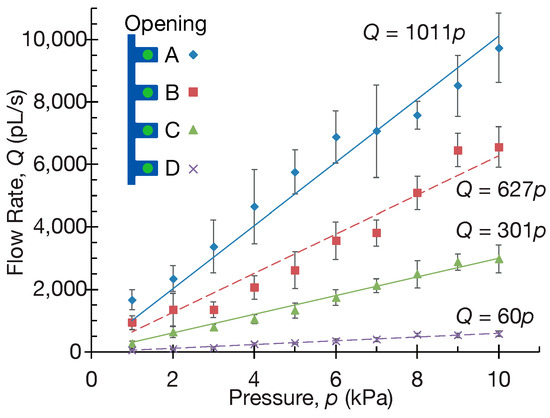
Figure 8.
Linear pressure–flow relationships demonstrate hierarchical flow distribution across micronozzle openings A–D. Flow rates were measured using 2 μm tracer particles (n = 5 per opening) across a pressure range of 0–10 kPa through high-speed imaging at 500 fps during liquid-to-liquid particle transfer.
The results show that flow rate increases proportionally to applied pressure, with upstream apertures exhibiting higher flow rates than downstream apertures. This systematic reduction in flow rate from A to D occurs due to a progressive pressure drop through the serial channel network. As fluid flows from the inlet through the connecting channels, pressure is sequentially lost at each node due to flow resistance. Since the flow resistance of the connecting channels is higher than that of the individual openings, a significant pressure drop occurs between nodes, resulting in a progressively lower driving pressure available at downstream openings (A > B > C > D). Consequently, each downstream opening operates at a reduced pressure differential, leading to correspondingly lower flow rates.
3.5.3. φ10 µm Beads
The third stage of characterization was performed using tracer particles 10 µm in size to demonstrate near-cell diameter particle dispensing. The ejection of a single 10 µm particle can be seen in Figure 7b. We applied a constant pressure of 3 kPa and observed the ejection at rates of 500 fps (Movie S7) and 1000 fps (Movie S8). Ejection was achieved without applying pneumatic actuation. We observed multiple ejections through all four selected openings. We tracked the ejection of five such particles through each opening to calculate the velocity. Under a constant inlet pressure and without pneumatic actuation, we observed single 10 µm particles traversing selected openings in a continuous aqueous phase (n = 5 per opening); future work will quantify inter-arrival variability, velocity distributions, and throughput limits of continuous-phase operation.
3.6. Theoretical Model Validation and Flow Analysis
The theoretical analysis employed a simplified Modified Nodal Analysis (MNA) model with a modified source vector accounting for four-way pressure branching b = [PIN/(4 × RIN), 0, 0, 0] and measured dimensions after fabrication. At 1 kPa input pressure, the model predicted linear flow rate relationships: node A: 2946 pL/s (QA = 2946 × P); node B: 244 pL/s (QB = 244 × P); node C: 20.2 pL/s (QC = 20.2 × P); and node D: 1.81 pL/s (QD = 1.81 × P). The experimental measurements revealed flow rates of 1011, 627, 301, and 60 pL/s for outlets A, B, C, and D, respectively, at the same 1 kPa input pressure.
While individual particle tracking videos were obtained at specific pressures (1 kPa for Movie S5 and 5 kPa for Movies S4 and S6), the quantitative flow analysis encompassed the complete 0–10 kPa range to establish reliable pressure–flow correlations. Although the model reproduced the upstream-to-downstream hierarchy (A > B > C > D), it overestimated A (~3×) and underestimated B–D (~2.5–15×), indicating unmodeled entrance/exit losses, membrane compliance, and wetting-induced nonlinearities.
The simplified MNA model with four-way branching captures the basic flow distribution but does not account for entrance/exit losses at microholes, pressure-induced deformation of the PDMS membrane, nonlinear resistance at finite Reynolds numbers, surface tension and wetting effects at nanoliter scales, or dynamic boundary condition shifts caused by incomplete pressure recovery at microscale apertures.
A critical examination of the boundary condition assumptions reveals a fundamental limitation in the MNA model. The theoretical framework assumes atmospheric pressure conditions at each outlet (Pi = 0). However, experimental observations revealed persistent fluid flow downstream of the physical aperture boundaries. This phenomenon suggests that effective pressure recovery extends beyond the geometric boundaries of the hole, challenging the circuit analogy’s assumption of instantaneous pressure equilibration. The incomplete pressure recovery at outlet boundaries may explain why actual driving pressure differentials exceed the theoretical ΔP = Pi − Patm calculations, particularly affecting the systematic underestimation of downstream nodes B, C, and D.
For microfluidic applications, the pressure recovery length becomes comparable to inter-hole spacing (120 μm), creating pressure field interference between adjacent outlets that violates the circuit model’s independence assumption. The theoretical and experimental flow rate graphs follow the same trend across the 0–10 kPa range, confirming the successful functioning of the designed micronozzle array and validating that the flow channel for cells performs as designed, with cells being preferentially placed from the upstream opening when dispensed. However, future theoretical improvements should incorporate variable boundary conditions and coupled momentum–pressure analysis to capture the complex microscale physics governing precision microfluidic networks.
4. Conclusions
We developed a 4 × 4 micronozzle array using a novel sacrificial layer fabrication method based on the SU-8 photoresist that significantly reduces structural thickness while maintaining high fabrication success rates. Our approach enables the production of 30 μm transparent membranes, achieving a 70% reduction in thickness compared with conventional SU-8 fabrication techniques that require structures exceeding 100 μm. The sacrificial layer method demonstrated exceptional reproducibility, achieving a 100% success rate (10/10 chips) in OmniCoat layer release, thereby validating the robustness and scalability of the manufacturing process. The combination of PDMS and SU-8 achieved bonding strengths exceeding 600 kPa at 20 mA plasma treatment, providing sufficient structural integrity for operation at pressures up to 10 kPa. The transparent polymer-based approach eliminates the need for expensive glass substrates and complex etching processes, while enabling the real-time optical monitoring of particle manipulation.
The device operates through liquid-to-liquid ejection, which eliminates air–liquid interfaces and provides superior sample preservation compared with conventional air-based systems. The device manipulated particles ranging from 0.5 to 10 μm through purely hydrodynamic forces without external actuation, providing conditions conducive to cell preservation and experimental flexibility. Although theoretical flow analysis based on Hagen–Poiseuille principles and Modified Nodal Analysis captured the basic upstream-to-downstream flow distribution pattern (A > B > C > D), significant discrepancies were observed between predicted and experimental flow rates. The theoretical model overestimated upstream flows and underestimated downstream flows by factors of approximately 2.5× to 15×. These discrepancies highlight the complexity of microscale flow phenomena, including entrance and exit effects, membrane deformation, and surface tension effects, which require further investigation.
These results establish a platform for future studies on single-particle/cell handling and on-demand deposition. Advancing to cell printing applications will require demonstrating substrate deposition with quantified per-ejection volume, spot morphology/placement accuracy and frequency control, and, for cells, viability and single-cell occupancy. The scalable design allows the expansion of micronozzle arrays based on specific application requirements, providing researchers with a versatile tool for biological assays and precise microscale liquid handling.
Supplementary Materials
The following supporting information can be downloaded at: https://www.mdpi.com/article/10.3390/micro5030042/s1. Movie S1: Fluorescent microscope images showing ejection of 0.5 μm particles through micronozzle array; Movie S2: Brownian motion of 0.5 μm particles under no-pressure conditions; Movie S3: Ejection of 2 μm particle at 1 kPa applied pressure; Movie S4: Ejection of 2 μm particle at 5 kPa applied pressure; Movie S5: High-speed imaging (500 fps) of 2 μm particle ejection at 1 kPa; Movie S6: Multiple ejections through four openings at 5 kPa (500 fps); Movie S7: Ejection of 10 μm particle at 500 fps; Movie S8: Ejection of 10 μm particle at 1000 fps.
Author Contributions
Conceptualization, M.N.; methodology, M.N.; software, M.N.; validation, M.N., S.K. and K.T.; formal analysis, A.T. and M.N.; investigation, K.T. and S.K.; resources, M.N.; data curation, M.N.; writing—original draft preparation, K.T. and A.T.; writing—review and editing, A.T., S.O., T.S., T.S.S. and M.N.; visualization, M.N.; supervision, M.N.; project administration, M.N.; funding acquisition, M.N. All authors have read and agreed to the published version of the manuscript.
Funding
This work was supported by JSPS KAKENHI Grant Numbers 20H02115, 20K20961, 23H00168, 23KK0070, and 24KF0227, and MEXT Leading Initiative for Excellent Young Researchers.
Data Availability Statement
The data that support the findings of this study are available from the corresponding author upon reasonable request.
Acknowledgments
The authors thank Miyuki Okuda for her valuable contributions to the device fabrication process.
Conflicts of Interest
The authors declare no conflicts of interest.
References
- Berthier, E.; Dostie, A.M.; Lee, U.N.; Berthier, J.; Theberge, A.B. Open Microfluidic Capillary Systems. Anal. Chem. 2019, 91, 8739–8750. [Google Scholar] [CrossRef] [PubMed]
- Wilson, C.F.; Simpson, G.J.; Chiu, D.T.; Stromberg, A.; Orwar, O.; Rodriguez, N.; Zare, R.N. Nanoengineered Structures for Holding and Manipulating Liposomes and Cells. Anal. Chem. 2001, 73, 787–791. [Google Scholar] [CrossRef]
- Nagai, M.; Kato, K.; Oohara, K.; Shibata, T. Pick-and-Place Operation of Single Cell Using Optical and Electrical Measurements for Robust Manipulation. Micromachines 2017, 8, 350. [Google Scholar] [CrossRef] [PubMed]
- Han, H.N.; Martinez, V.; Aebersold, M.J.; Luchtefeld, I.; Polesel-Maris, J.; Voros, J.; Zambelli, T. Force Controlled SU-8 Micropipettes Fabricated with a Sideways Process. J. Micromech. Microeng. 2018, 28, 095015. [Google Scholar] [CrossRef]
- Martinez, V.; Forro, C.; Weydert, S.; Aebersold, M.J.; Dermutz, H.; Guillaume-Gentil, O.; Zambelli, T.; Voros, J.; Demko, L. Controlled Single-Cell Deposition and Patterning by Highly Flexible Hollow Cantilevers. Lab Chip 2016, 16, 1663–1674. [Google Scholar] [CrossRef]
- Kim, A.A.; Kustanovich, K.; Baratian, D.; Ainla, A.; Shaali, M.; Jeffries, G.D.M.; Jesorka, A. SU-8 Free-Standing Microfluidic Probes. Biomicrofluidics 2017, 11, 014112. [Google Scholar] [CrossRef]
- Gross, A.; Schondube, J.; Niekrawitz, S.; Streule, W.; Riegger, L.; Zengerle, R.; Koltay, P. Single-Cell Printer: Automated, on Demand, and Label Free. J. Lab. Autom. 2013, 18, 504–518. [Google Scholar] [CrossRef]
- Yusof, A.; Keegan, H.; Spillane, C.D.; Sheils, O.M.; Martin, C.M.; O’Leary, J.J.; Zengerle, R.; Koltay, P. Inkjet-like Printing of Single-Cells. Lab Chip 2011, 11, 2447–2454. [Google Scholar] [CrossRef]
- Xu, T.; Jin, J.; Gregory, C.; Hickman, J.J.; Boland, T. Inkjet Printing of Viable Mammalian Cells. Biomaterials 2005, 26, 93–99. [Google Scholar] [CrossRef]
- Kacarevic, Z.P.; Rider, P.M.; Alkildani, S.; Retnasingh, S.; Smeets, R.; Jung, O.; Ivanisevic, Z.; Barbeck, M. An Introduction to 3D Bioprinting: Possibilities, Challenges and Future Aspects. Materials 2018, 11, 2199. [Google Scholar] [CrossRef]
- Wang, Y.; Wang, X.; Pan, T.; Li, B.; Chu, J. Label-Free Single-Cell Isolation Enabled by Microfluidic Impact Printing and Real-Time Cellular Recognition. Lab Chip 2021, 21, 3695–3706. [Google Scholar] [CrossRef]
- Bsoul, A.; Pan, S.; Cretu, E.; Stoeber, B.; Walus, K. Design, Microfabrication, and Characterization of a Moulded PDMS/SU-8 Inkjet Dispenser for a Lab-on-a-Printer Platform Technology with Disposable Microfluidic Chip. Lab Chip 2016, 16, 3351–3361. [Google Scholar] [CrossRef]
- Nagai, M.; Kato, K.; Soga, S.; Santra, T.S.; Shibata, T. Scalable Parallel Manipulation of Single Cells Using Micronozzle Array Integrated with Bidirectional Electrokinetic Pumps. Micromachines 2020, 11, 442. [Google Scholar] [CrossRef]
- Steinert, C.P.; Goutier, I.; Gutmann, O.; Sandmaier, H.; Daub, M.; de Heij, B.; Zengerle, R. A Highly Parallel Picoliter Dispenser with an Integrated, Novel Capillary Channel Structure. Sens. Actuators A Phys. 2004, 116, 171–177. [Google Scholar] [CrossRef]
- Koltay, P.; Steger, R.; Bohl, B.; Zengerle, R. The Dispensing Well Plate: A Novel Nanodispenser for the Multiparallel Delivery of Liquids (DWP Part I). Sens. Actuators A Phys. 2004, 116, 483–491. [Google Scholar] [CrossRef]
- Xu, B.; Lee, Y.-K.; Jin, Q.; Zhao, J.; Ho, C.-M. Multilayer SU-8 Based Microdispenser for Microarray Assay. Sens. Actuators A Phys. 2006, 132, 714–725. [Google Scholar] [CrossRef]
- Xu, B.; Jin, Q.; Zhao, J. Multi-Layer SU-8 Based Micro Dispensing System for Microarray Immunoassay. Sens. Actuators A Phys. 2007, 135, 292–299. [Google Scholar] [CrossRef]
- Demirci, U.; Montesano, G. Single Cell Epitaxy by Acoustic Picolitre Droplets. Lab Chip 2007, 7, 1139–1145. [Google Scholar] [CrossRef]
- Maqbool, M.A.; Okamoto, S.; Shibata, T.; Subhra Santra, T.; Nagai, M. Self-Regulating Pen-Needle-Based Micronozzle for Printing Array of Nanoliter Droplets under Fluorinated Liquid. Instrum. Sci. Technol. 2025, 53, 332–350. [Google Scholar] [CrossRef]
- Nan, L.; Lai, M.Y.A.; Tang, M.Y.H.; Chan, Y.K.; Poon, L.L.M.; Shum, H.C. On-Demand Droplet Collection for Capturing Single Cells. Small 2020, 16, e1902889. [Google Scholar] [CrossRef]
- Cole, R.H.; Tang, S.Y.; Siltanen, C.A.; Shahi, P.; Zhang, J.Q.; Poust, S.; Gartner, Z.J.; Abate, A.R. Printed Droplet Microfluidics for on Demand Dispensing of Picoliter Droplets and Cells. Proc. Natl. Acad. Sci. USA 2017, 114, 8728–8733. [Google Scholar] [CrossRef] [PubMed]
- Hof, L.A.; Abou Ziki, J. Micro-Hole Drilling on Glass Substrates—A Review. Micromachines 2017, 8, 53. [Google Scholar] [CrossRef]
- Chung, C.K.; Lin, S.L. CO2 Laser Micromachined Crackless through Holes of Pyrex 7740 Glass. Int. J. Mach. Tools Manuf. 2010, 50, 961–968. [Google Scholar] [CrossRef]
- Wang, L.; Stevens, R.; Malik, A.; Rockett, P.; Paine, M.; Adkin, P.; Martyn, S.; Smith, K.; Stark, J.; Dobson, P. High-Aspect-Ratio Silica Nozzle Fabrication for Nano-Emitter Electrospray Applications. Microelectron. Eng. 2007, 84, 1190–1193. [Google Scholar] [CrossRef]
- Jae-Duk, L.; Jun-Bo, Y.; Jae-Kwan, K.; Hoon-Ju, C.; Choon-Sup, L.; Hi-Deok, L.; Ho-Jun, L.; Choong-Ki, K.; Chul-Hi, H. A Thermal Inkjet Printhead with a Monolithically Fabricated Nozzle Plate and Self-Aligned Ink Feed Hole. J. Microelectromech. Syst. 1999, 8, 229–236. [Google Scholar] [CrossRef]
- Lehnert, T.; Gijs, M.A.M.; Netzer, R.; Bischoff, U. Realization of Hollow SiO2 Micronozzles for Electrical Measurements on Living Cells. Appl. Phys. Lett. 2002, 81, 5063–5065. [Google Scholar] [CrossRef]
- Demirci, U. Acoustic Picoliter Droplets for Emerging Applications in Semiconductor Industry and Biotechnology. J. Microelectromech. Syst. 2006, 15, 957–966. [Google Scholar] [CrossRef]
- Nagai, M.; Oohara, K.; Kato, K.; Kawashima, T.; Shibata, T. Development and Characterization of Hollow Microprobe Array as a Potential Tool for Versatile and Massively Parallel Manipulation of Single Cells. Biomed. Microdevices 2015, 17, 41. [Google Scholar] [CrossRef]
- Pan, Y.; Chen, X.; Zeng, L.; Huang, Y.; Yin, Z. Fabrication and Evaluation of a Protruding Si-Based Printhead for Electrohydrodynamic Jet Printing. J. Micromech. Microeng. 2017, 27, 125004. [Google Scholar] [CrossRef]
- Phan, H.V.; Coşkun, M.B.; Şeşen, M.; Pandraud, G.; Neild, A.; Alan, T. Vibrating Membrane with Discontinuities for Rapid and Efficient Microfluidic Mixing. Lab Chip 2015, 15, 4206–4216. [Google Scholar] [CrossRef]
- Górzny, M.Ł.; Opara, N.L.; Guzenko, V.A.; Cadarso, V.J.; Schift, H.; Li, X.D.; Padeste, C. Microfabricated Silicon Chip as Lipid Membrane Sample Holder for Serial Protein Crystallography. Micro Nano Eng. 2019, 3, 31–36. [Google Scholar] [CrossRef]
- Rhim, S.H.; Son, Y.K.; Oh, S.I. Punching of Ultra Small Size Hole Array. CIRP Ann. 2005, 54, 261–264. [Google Scholar] [CrossRef]
- Zhao, W.; Shen, X.; Liu, H.; Wang, L.; Jiang, H. Effect of High Repetition Rate on Dimension and Morphology of Micro-Hole Drilled in Metals by Picosecond Ultra-Short Pulse Laser. Opt. Lasers Eng. 2020, 124, 105811. [Google Scholar] [CrossRef]
- Iliescu, C.; Taylor, H.; Avram, M.; Miao, J.; Franssila, S. A Practical Guide for the Fabrication of Microfluidic Devices Using Glass and Silicon. Biomicrofluidics 2012, 6, 016505. [Google Scholar] [CrossRef]
- Fan, J.; Men, Y.; Hao Tseng, K.; Ding, Y.; Ding, Y.; Villarreal, F.; Tan, C.; Li, B.; Pan, T. Dotette: Programmable, High-Precision, Plug-and-Play Droplet Pipetting. Biomicrofluidics 2018, 12, 034107. [Google Scholar] [CrossRef]
- Mansoor, I.; Hafeli, U.O.; Stoeber, B. Hollow Out-of-Plane Polymer Microneedles Made by Solvent Casting for Transdermal Drug Delivery. J. Microelectromech. Syst. 2012, 21, 44–52. [Google Scholar] [CrossRef]
- Zhou, K.; Zhu, X.G.; Li, Y.; Liu, J. Fabrication of PDMS Micro Through-Holes Using Micromolding in Open Capillaries. RSC Adv. 2014, 4, 31988–31993. [Google Scholar] [CrossRef]
- Muluneh, M.; Issadore, D. Hybrid Soft-Lithography/Laser Machined Microchips for the Parallel Generation of Droplets. Lab Chip 2013, 13, 4750–4754. [Google Scholar] [CrossRef] [PubMed]
- Mansoor, I.; Liu, Y.; Häfeli, U.O.; Stoeber, B. Arrays of Hollow Out-of-Plane Microneedles Made by Metal Electrodeposition onto Solvent Cast Conductive Polymer Structures. J. Micromech. Microeng. 2013, 23, 085011. [Google Scholar] [CrossRef]
- Park, J.Y.; Lee, D.H.; Lee, E.J.; Lee, S.-H. Study of Cellular Behaviors on Concave and Convex Microstructures Fabricated from Elastic PDMS Membranes. Lab Chip 2009, 9, 2043–2049. [Google Scholar] [CrossRef] [PubMed]
- Chung, S.; Park, S. Effects of Temperature on Mechanical Properties of SU-8 Photoresist Material. J. Mech. Sci. Technol. 2013, 27, 2701–2707. [Google Scholar] [CrossRef]
- Sivakumar, R.; Lee, N.Y. Microfluidic Device Fabrication Mediated by Surface Chemical Bonding. Analyst 2020, 145, 4096–4110. [Google Scholar] [CrossRef]
- Bhardwaj, R.; Gupta, H.; Pandey, G.; Ryu, S.; Shibata, T.; Santra, T.S.; Nagai, M. Single-Cell Manipulation. In Handbook of Single Cell Technologies; Santra, T.S., Tseng, F.-G., Eds.; Springer: Singapore, 2020; pp. 1–26. ISBN 978-981-10-4857-9. [Google Scholar]
- Loudon, C.; McCulloh, K. Application of the Hagen-Poiseuille Equation to Fluid Feeding through Short Tubes. Ann. Entomol. Soc. Am. 1999, 92, 153–158. [Google Scholar] [CrossRef]
- Brambilla, A.; Premoli, A.; Storti-Gajani, G. Recasting Modified Nodal Analysis to Improve Reliability in Numerical Circuit Simulation. IEEE Trans. Circuits Syst. I 2005, 52, 522–534. [Google Scholar] [CrossRef]
- Takken, M.; Wille, R. Accelerated Computational Fluid Dynamics Simulations of Microfluidic Devices by Exploiting Higher Levels of Abstraction. Micromachines 2024, 15, 129. [Google Scholar] [CrossRef] [PubMed]
Disclaimer/Publisher’s Note: The statements, opinions and data contained in all publications are solely those of the individual author(s) and contributor(s) and not of MDPI and/or the editor(s). MDPI and/or the editor(s) disclaim responsibility for any injury to people or property resulting from any ideas, methods, instructions or products referred to in the content. |
© 2025 by the authors. Licensee MDPI, Basel, Switzerland. This article is an open access article distributed under the terms and conditions of the Creative Commons Attribution (CC BY) license (https://creativecommons.org/licenses/by/4.0/).