Article

Nano-Biomechanical Analysis of a Corticosteroid Drug for Targeted Delivery into the Alveolar Air—Water Interface Using Molecular Dynamics Simulation

by
Zohurul Islam
1,*,
Khalid Bin Kaysar
1,
Shakhawat Hossain
2,
Akram Hossain
1,
Suvash C. Saha
3,
Toufik Tayeb Naas
4 and
Kwang-Yong Kim
5,*
1
High-Performance Computing (HPC) Laboratory, Department of Mathematics, Jashore University of Science and Technology, Jashore 7408, Bangladesh
2
Department of Industrial and Production Engineering, Jashore University of Science and Technology, Jashore 7408, Bangladesh
3
School of Mechanical and Mechatronic Engineering, University of Technology Sydney, Sydney, NSW 2007, Australia
4
Gas Turbine Joint Research Team, University of Djelfa, Djelfa 17000, Algeria
5
Department of Mechanical Engineering, Inha University, Incheon 22212, Republic of Korea
*
Authors to whom correspondence should be addressed.
Micro 2025, 5(4), 44; https://doi.org/10.3390/micro5040044
Submission received: 8 July 2025 / Revised: 19 September 2025 / Accepted: 23 September 2025 / Published: 25 September 2025

Abstract

The enhancement of drug delivery into the lung surfactant is facilitated by research on the interaction between drugs and the lung surfactant. Drug designers must have a thorough theoretical understanding of a drug before performing clinical tests to reduce the experimental cost. The current study uses a coarse-grained molecular dynamics (MD) approach with the MARTINI force field to parameterize the corticosteroid drug mometasone furoate, which is used to treat lung inflammation. Here, we investigate the accurate parametrization of drug molecules and validate the parameters with the help of umbrella sampling simulations. A collection of thermodynamic parameters was studied during the parametrization procedure. The Gibbs free energy gradient was used to calculate the partition coefficient value of mometasone furoate, which was approximately 10.49 based on our umbrella sampling simulation. The value was then matched with the experimental and predicted the partition coefficient of the drug, showing good agreement. The drug molecule was then delivered into the lung surfactant monolayer membrane at the alveolar air–water interface, resulting a concentration-dependent drop in surface tension while controlling the underlying continual compression–expansion of alveoli that maintains the exhalation–inhalation respiratory cycle. The dynamical properties of the monolayer demonstrate that the drug’s capacity to diffuse into the monolayer is considerably diminished in larger clusters, and this effect is intensified when there are more drug molecules present in the monolayer. The monolayer microstructure analysis shows that the drug concentration controls monolayer morphology. The results of this investigation may be helpful for corticosteroid drug delivery into the lung alveoli, which can be applied to comprehend how the drug interacts with lung surfactant monolayers or bilayers.

1. Introduction

Numerous lung illnesses, such as asthma, chronic obstructive pulmonary disease (COPD), bronchitis, emphysema, and respiratory allergies, are treated with glucocorticoids [1]. When glucocorticoids are administered topically, intravenously, or orally, they may have numerous side effects since the medication reaches the bloodstream through the systemic pathway [2]. In order to prevent the systemic adverse effects of corticosteroid medicine, inhaling the substance into the lung airway is the ideal method for treating lung illness. To evaluate innovative delivery methods, such as aerosol inhalation, clinical studies are being performed [3].
Corticosteroids can decrease inflammatory responses in the conducting region of the distal lung airways and the microphagic domain at the alveoli [4,5,6]. These drugs reduce inflammation in various ways, including binding to glucocorticoid receptors, which have intracellular impacts on the cells, and interacting with lung surfactants at the alveolar air–water interface. A spectroscopy-based investigation provides insight into how inhaled corticosteroids collaborate with human serum albumin [7]. Inhaled corticosteroids (ICSs) continue to be the most efficacious anti-inflammatory medication for treating persistent asthma [8,9]. It has long been understood that even slight chemical changes to the corticosteroid core molecule can produce significant differences in potency, which are usually measured by how well the corticosteroid binds to the glucocorticoid receptor [10]. Examining the mechanisms of drug–receptor or drug–membrane interactions is essential to comprehending how drugs affect the ability to bind with glucocorticoid receptors. Such interaction plays a key role in the kinetic and dynamic studies of the drug. They affect how quickly the drug spreads and accumulates; only non-binding drugs can be transported to reach a targeted region through some biological reactions.
The spatial distribution of active concentrations of several corticosteroid drugs supplied to the alveolar surface of the lung is greatly influenced by their binding affinity for the protein human serum albumin (HSA). Drug binding to HSA prolongs the drug’s half-life and decreases free drugs in the bloodstream, making it crucial for therapeutic treatment [7]. However, the inhalation technique enables the drugs to be quickly disseminated throughout the surface of the lung surfactant into the targeted area, where they act locally to reduce inflammation. It is the suggested non-systemic route for corticosteroid delivery into the lung airways as opposed to oral and intravenous drug delivery [11,12]. According to clinical studies, inhaled corticosteroids significantly lower airway hyperresponsiveness, effectively halt acute exacerbations, improve lung function, and lessen symptom severity [13]. Apart from their role in other physiological processes, corticosteroids also influence the respiratory system’s release of inflammatory mediators, such as those made by mast cells, eosinophils, lymphocytes, and macrophages [14]. The pharmacokinetic characteristics and related pharmacodynamic effects of the medication have an impact on the effectiveness profile of inhaled corticosteroids [15]. It is possible for freely circulating inhaled corticosteroids to attach to non-pulmonary glucocorticoid receptors and cause adverse effects, including decreased hypothalamic–pituitary–adrenal (HPA) axis activity and developmental impairment [16].
Mometasone furoate (MF) can help to lessen its adverse effects by extensive protein binding with the corticosteroid, which assists in inhibiting the specificity/selectivity of the drug to the membrane. Extensive research is required to monitor the pharmacokinetic and pharmacodynamic mechanisms of the corticosteroid medicine in order to comprehend drug–protein/membrane interactions. The protein binding affinities of various inhaled corticosteroids, such as betamethasone, flunisolide, prednisolone, and triamcinolone, were determined using spectroscopy by Pontremoli et al. [7] in order to observe the pharmacokinetic characteristics of the corticosteroids. As a result, it is crucial to comprehend how corticosteroids interact with, accumulate in, and propagate through lung surfactants. These molecular-level interactions can be investigated by atomistic or coarse-grained (CG) in silico studies [17,18,19]. In order to investigate length and time scales beyond what is possible with atomistic or all-atom models, the incorporation of CG models in MD simulations is crucial [20,21,22]. Atoms are grouped to form supra-atomic fragments, or beads, in CG structures. In addition to expanding the range of spatio-temporal scales, these models can offer a more informative view than atomistic ones due to the lower degrees of freedom that provide a more straightforward representation of the system. The CG simulations are therefore a vital tool to support experimental approaches in the investigation of phenomena, including host–guest interaction, domain creation, spontaneous self-assembly, and phase transition. This study is aimed at understanding the effect of the corticosteroid drug MF on the lung surfactant monolayer that forms at the air–water interface in the alveoli. Before investigating the interaction mechanism, MF’s coarse-grained structure needs to be parameterized by calculating the partition coefficient of the drug molecule. The spreading and interaction mechanism of the drug molecule with the lung surfactant monolayer will also be investigated in this study.

2. Methodology of the Study

2.1. Drug Parameterization and Umbrella Sampling Simulation

It is possible to classify CG models primarily based on either a building block method or a systematic (sometimes known as hierarchical) approach [22,23]. The basic atomistic structural information can be precisely reproduced by models based on the initial assumption; nevertheless, this atomistic approach necessitates more time to reparameterize whenever a condition changes, compared to the CG approach of parameterization. Furthermore, the necessary potential structure of the molecules is frequently complicated, which may lead to poorer performance and, hence, less sampling. Conversely, models created using the building block technique are less expensive components and employ a simpler structure. A second benefit of the building block method is the transferability of the models, which allows them to be used as components of comparable moieties in various compounds. These benefits, nonetheless, come at the expense of a reduced level of structural fidelity because building block-based CG models always portray atomistic information in a sub-optimal way. The Martini CG force field [24] is one of the fundamental approaches to coarse-graining MD simulation that has gained a lot of attention recently because of its success in characterizing a variety of biomolecular complexes [25]. It has been observed that the force field, which was initially designed for biomolecular simulations, has been effectively utilized to depict systems with soft materials. Examples of these systems include organic semiconductors, self-assembled supramolecular materials, and polymers [26]. The Martini model’s widespread application, however, brought to light several drawbacks, most notably in the characterization of structures that are modelled with a finer resolution than the typical resolution of four non-hydrogen atoms per bead (4-to-1) [27,28,29]. More accurate 3-to-1 or 2-to-1 mappings are necessary for modelling ring-like structures [24] for maintaining the polymer’s repeating unit homogeneity [30]. “Small” [24] and then even smaller, “tiny” beads [31] were introduced for such precise mappings. In CG molecular dynamics simulations, the drug molecules are structured by splitting into the building blocks to CG beads, which is performed through experience, chemical knowledge, and a trial-and-error basis. The bead mapping of the mometasone furoate CG model is given in Table 1 and detailed mapping is also presented in Supplementary Section S1.1. The method used for this mapping procedure is followed by the MARTINI model of small molecule parameterization [32]. Table S1 shows the construction and presentation of the MF coarse-grained bead mapping. The 4-to-1, 3-to-1, and 2-to-1 mappings are considered regular (R), small (S), and tiny (T) beads for the underlying atoms with some advanced mapping rules. According to the other steroid drug (mometasone) structure [33], a coarse-grained model for MF was designed, and MARTINI bead structures [34] were used to model the drug structure. Once the stable coarse-grained model of the MF was established, the partitioning free energy was determined using umbrella sampling (US) simulation. In order to confirm the mometasone furoate CG parameter, the partition coefficient (logP value) of MF was derived from the Gibbs free energy difference. The resulting value was then compared with the experimental, predicted, and simulated partition coefficient of MF. The observed logP value also contrasts with anticipated logP values from the mometasone furoate drug data bank at various scales.
First of all, the umbrella sampling model was prepared by placing a drug at the centre of mass with a box size 5 × 5 × 7 nm3 to optimize the structural parameters of the drug molecule. Then, the parameters were set up by guessing (with proper chemical knowledge) for MD simulation and updating the parameters (bond length, bond angle, dihedral angle) to obtain optimized bond length, bond angle, and dihedral angle for the stable structure of the drug molecule. For each case, the simulation was conducted with 100 ns for equilibration and another 100 ns for production-run simulation in both systems (drug-in-water and drug-in-octanol mediums) by applying NVT and NPT ensembles, respectively. From these simulations, the bonded parameters, including bond length, bond angle, and dihedral angle, were monitored.
In the US technique, the potential mean force (PMF) of the drug molecule from the octanol medium (hydrophobic medium) into the water medium (hydrophilic medium) was calculated [35,36] by using pull simulation. An octanol–water configuration was built with a box size 5 × 5 × 21 nm3. The coarse-grained parameters for octanol molecules were chosen from the Taddese and DeBolt study [37,38] and for water from the Martini model [34]. A single drug molecule was introduced into the centre of mass of the octanol phase to start simulations (Figure 1). Employing a potential, Vus, which is specified by zi, at pulling time, the space between the centres of mass of the drug and the solvent is determined using the equation below (Equation (1)).
V u s = 1 2 k u s z z i 2
where kus is the harmonic force constant, which fluctuates from 100 to 2000 kJ mol−1 nm−2. The steepest descent algorithm was employed until the highest energy gradient was less than 100 kJ mol−1 nm−1 to escape the interactions among the drug, water, or octanol [39]. We performed an NPT ensemble for 100 ns using Berendsen pressure coupling [40] at 1.0 bar with semi-isotropic pressure. We started the final run for 100 ns, employing a velocity rescaling thermostat [41] at the same temperature with Parrinello–Rahman pressure coupling [42]. The trajectories were collected to evaluate PMF over a total of 35 windows separated by 0.2 nm. Finally, the Gibbs free energy was estimated by applying the weighted histogram analysis method (WHAM) [35].

2.2. System Simulation and Underlying Conditions

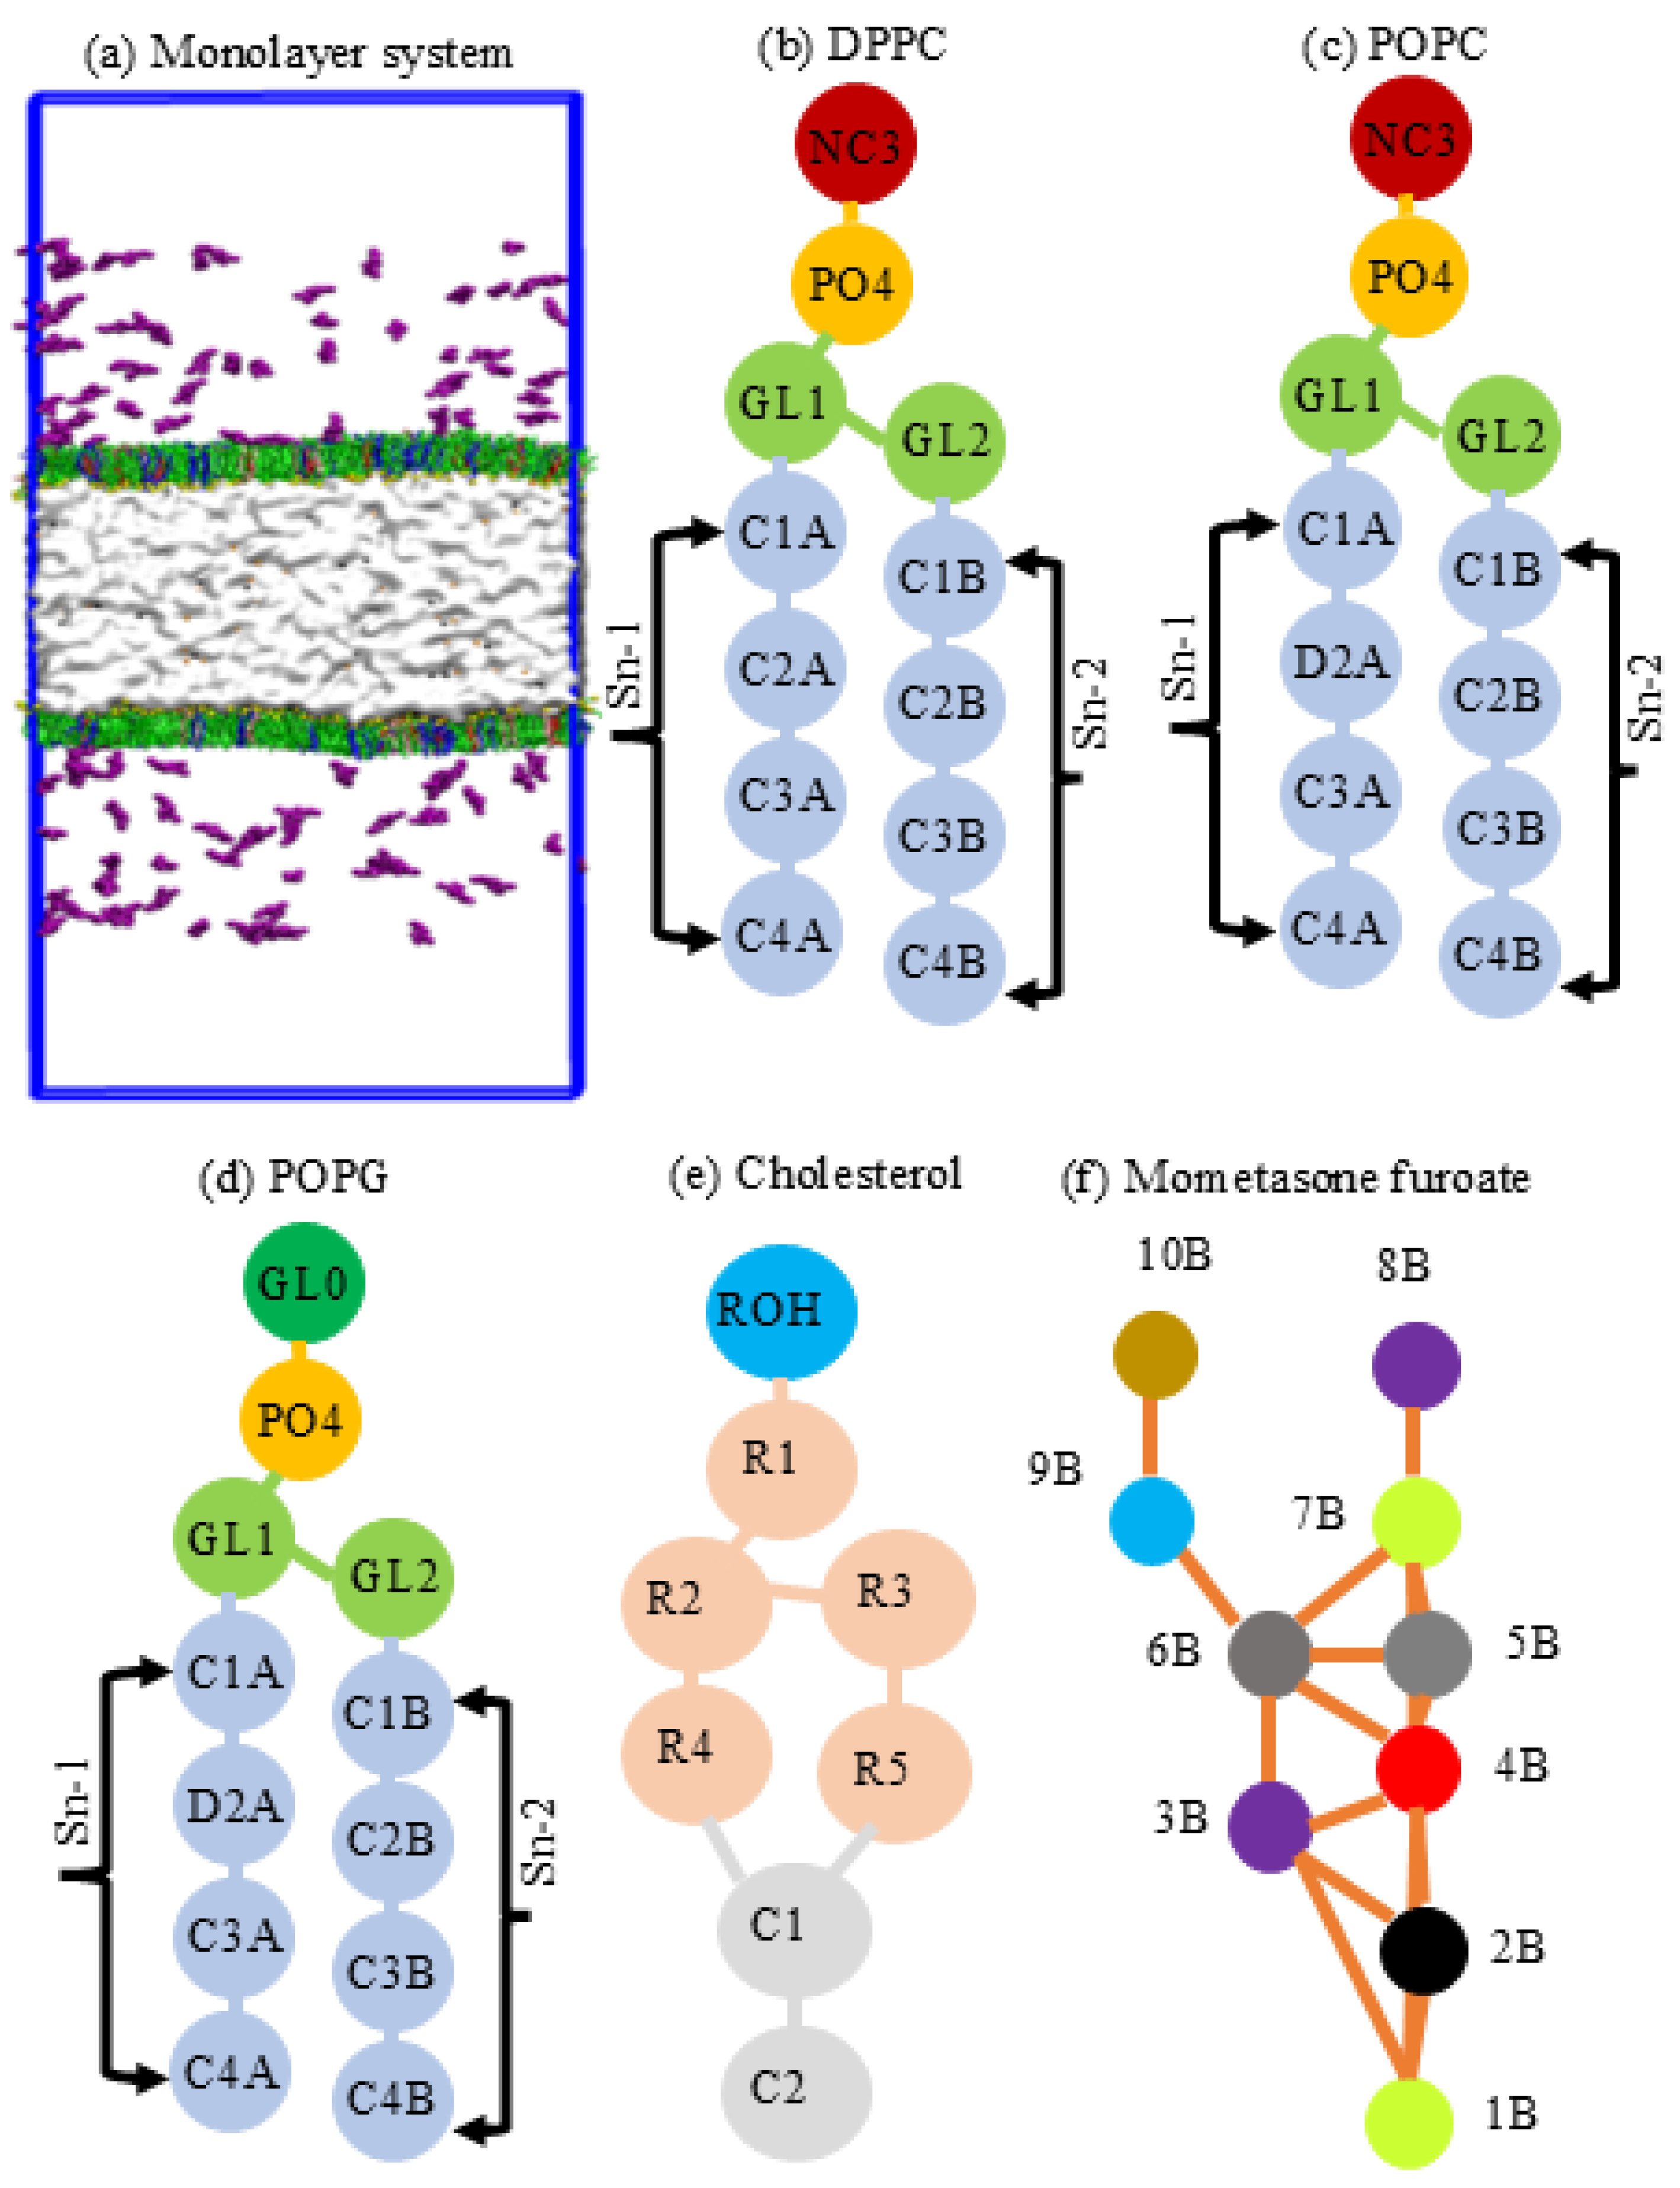
Forty-eight models were created (Table S2, in Supplementary Section S1.3) for MD simulation. Each of the 48 systems is simulated at a range of area per lipid (APL) values starting from 0.47 nm2 to 0.61 nm2 in order to represent compressed (mimicking exhale breathing) and expanded (representing inhale breathing) states of breathing cycles, respectively [43]. The detailed step-by-step procedure of monolayer construction can be found in our book chapter published in Springer [44]. System-I serves as the main reference system, and it comprises DPPC-POPC-POPG-CHOL, 60:20:10:10 mol %. Mometasone furoate at five different concentrations was incorporated (Systems II-a to II-e). The structure of monolayer constituents (DPPC-POPC-POPG-CHOL) is illustrated in Figure 2. The quantity of drug utilized in the models is equivalent to a single inhalation of a dry powder inhaler. Supplementary Document S1.4 provides detailed information on the calculation for translating a standard ICS dosage into various compounds utilized in this investigation.
A base drug-free model (Table S2) constructed by mixed lipids (DPPC:POPC:POPG:CHOL, 60:20:10:10) was run with the NPγT (constant number of particles, constant surface tension and temperature) ensemble, employing Pγ values (0 to 60 mNm−1) with a step of 10 mNm−1 to replicate compressed (~0 mNm−1) to expanded (~60 mNm−1) states of surfactant models. From the NPγT ensemble simulation, eight different systems were extracted whose APLs are 0.47, 0.49, 0.51, 0.53, 0.55, 0.57, 0.59, and 0.61 nm2. These systems were incorporated into a box with dimensions of 24.90 × 24.90 nm2, 24.49 × 24.49 nm2, 24.10 × 24.10 nm2, 23.64 × 23.64 nm2, 23.21 × 23.21 nm2, 22.77 × 22.77 nm2 and 22.32 × 22.32 nm2, respectively, to maintain a constant area of the monolayer during the NVT (constant number of particles, constant volume and temperature) ensemble study. All the prepared models (System-I and System-II) were run for 500 ns to obtain the stable model, and then, again, a 2 µs production run simulation was simulated to store the data in the same NVT ensemble. Five distinct systems were built as a base model for studying the mometasone furoate-containing monolayer, and then the drug molecules were introduced to ensure the required drug concentrations. Supplemental Section S1.4 explains the reasoning for selecting this range of drug concentrations to determine an average drug dose of ICS. GROMACS version 2021.4 [45] was chosen to conduct the simulation. Each of these models was energy-minimized using the steepest descent algorithm. The leapfrog algorithm [46] with a 20 fs time step was applied. Martini standard cut-off for the Coulomb interaction potential and the Lennard-Jones interaction potential were considered. Monolayer constituents (lipids and cholesterol), water and ions, and the drug were coupled independently at a temperature of 310 K with a V-rescale thermostat [41] and a time constant of τ = 1.0 ps. The neighbour lists were stored after 20 steps every time.

3. Results and Discussion

3.1. Bond Distribution Analysis of the Drug Molecules

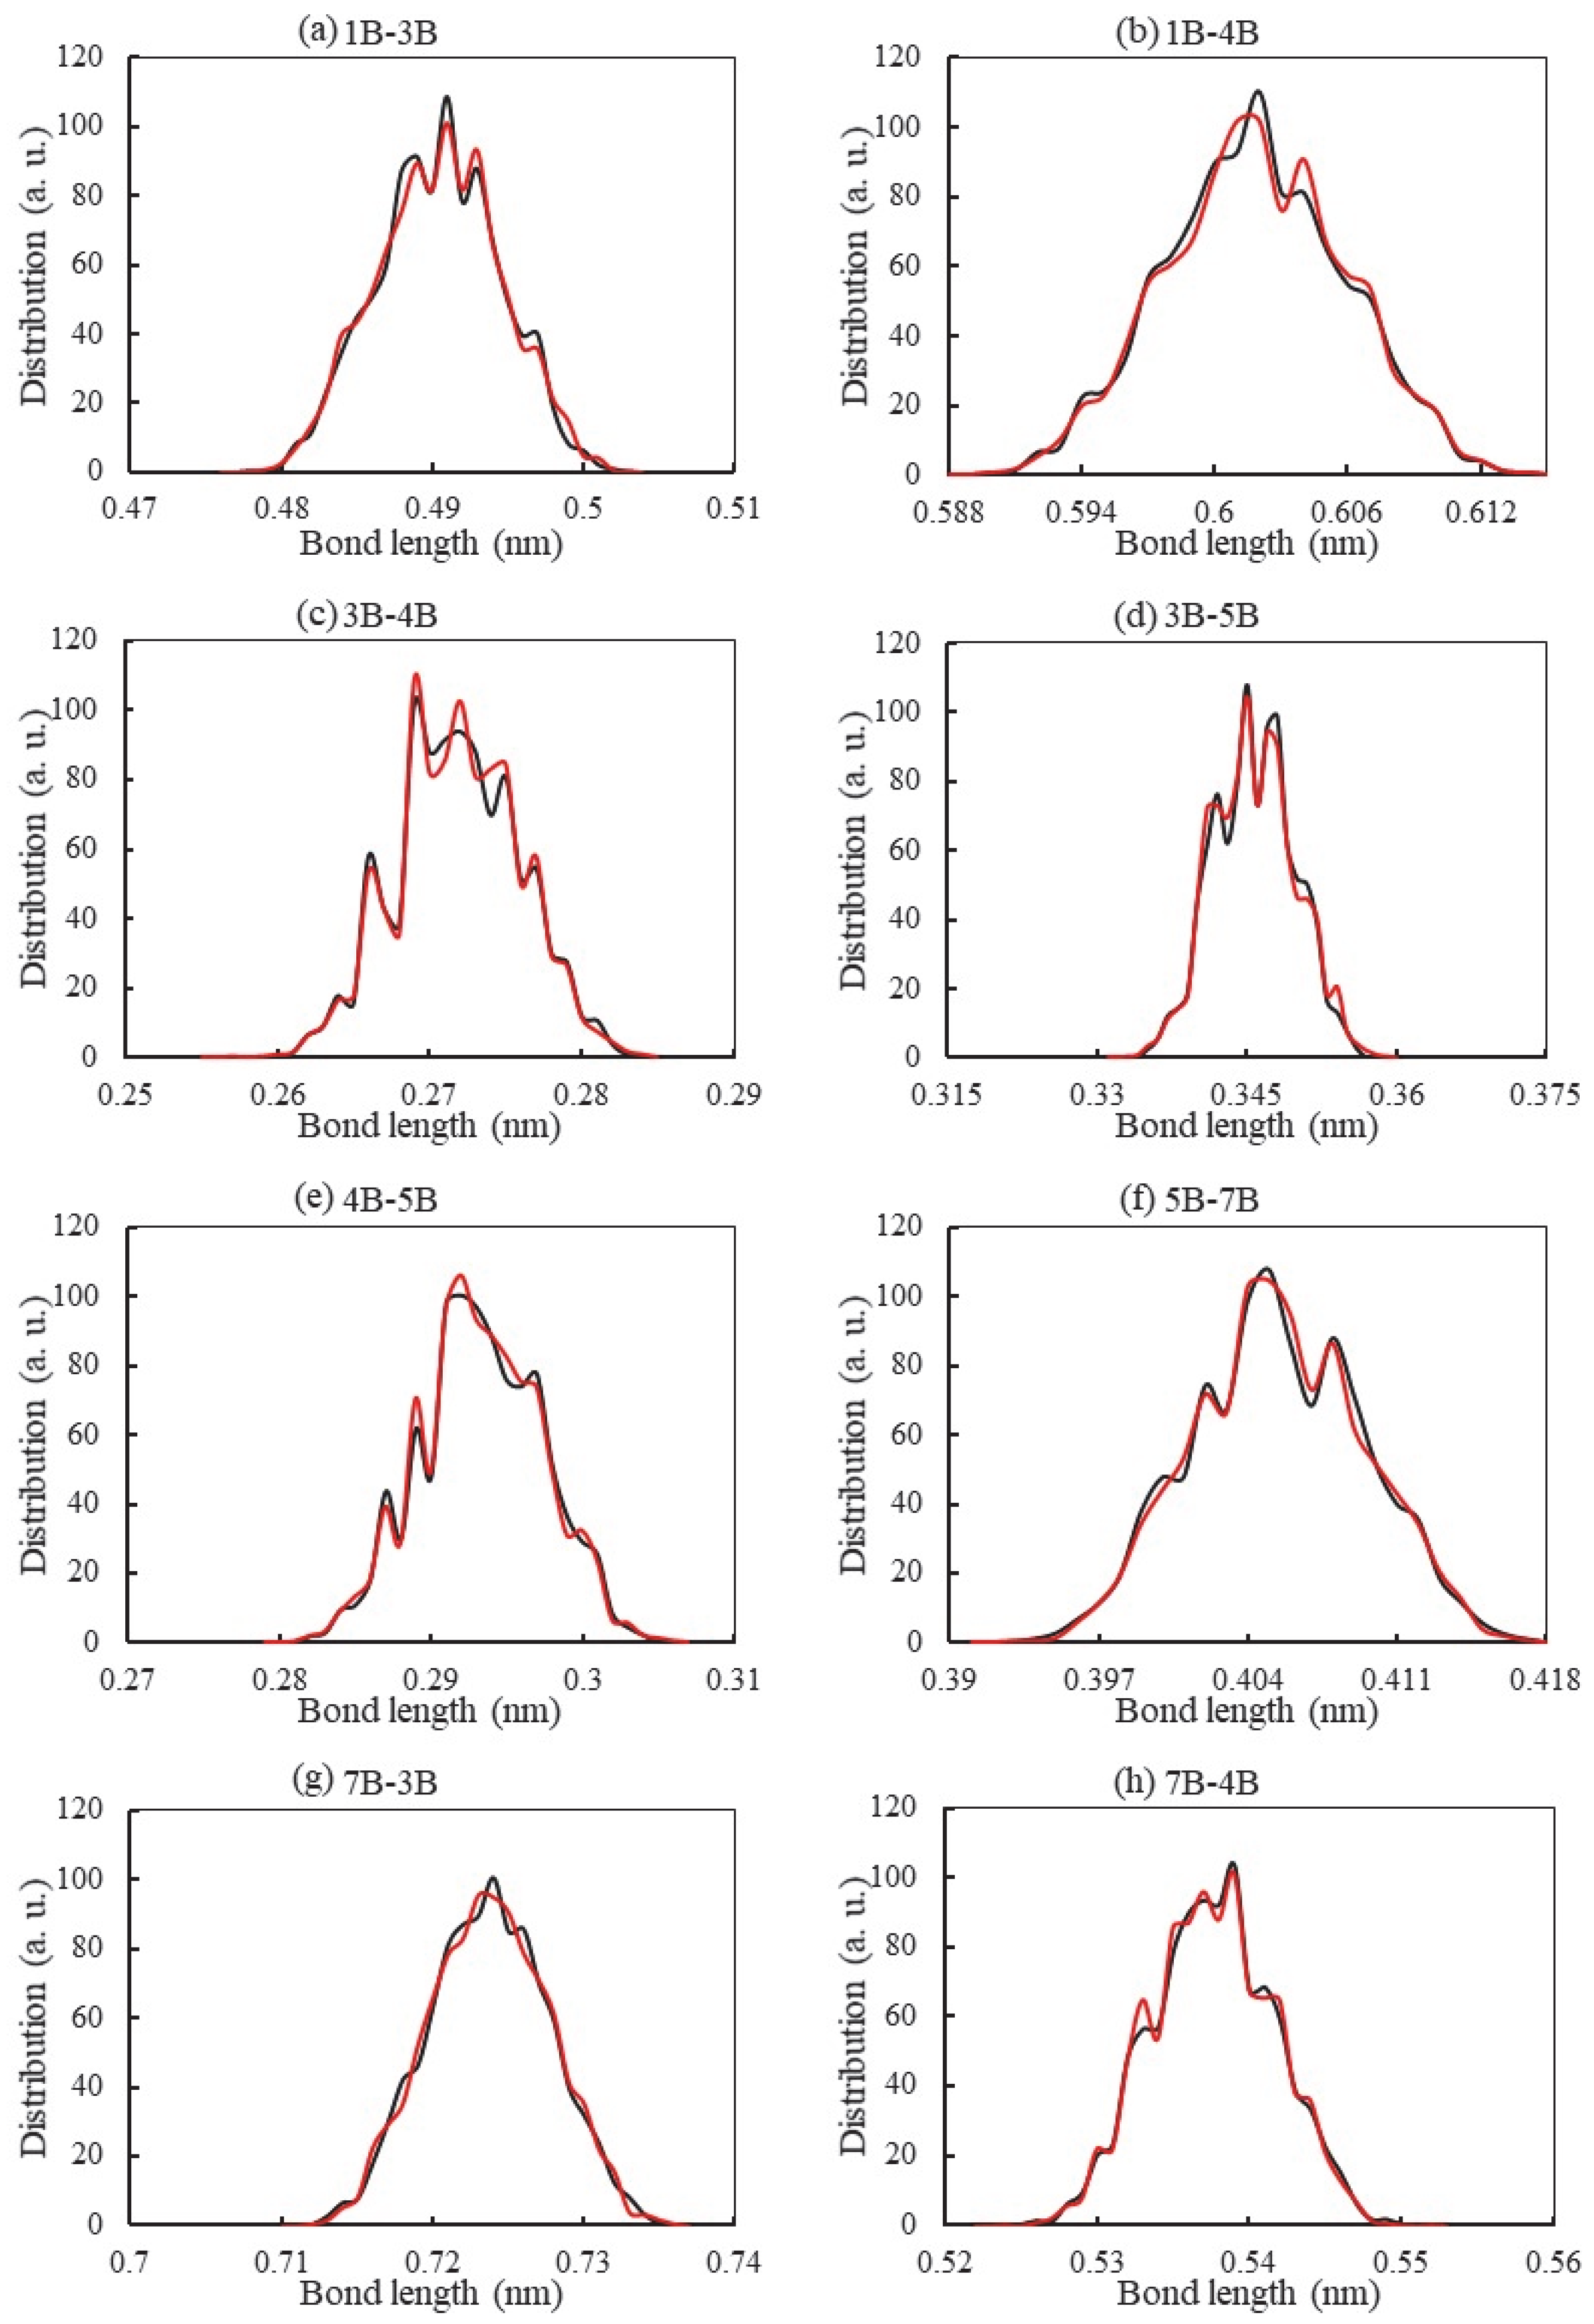
In order to match the bonded distribution of the CG beads of the mometasone furoate drug molecules, the various bond length distributions between two coarse-grained beads, bond angles between three beads, and dihedral angles between four beads were calculated and are plotted in Figure 3 and Figure S1. On a repeated trial-and-error basis, the bonded parameters of the mometasone furoate were optimized by employing the better approximation of the bonded parameters. The obtained results were compared for different bonded parameters such as bond length (Figure 3), bond angle (Figure S1a,b), and dihedral angle (Figure S1c). As is observed in Figure 3, the bond length distribution between any two beads is illustrated.
The overall comparison of the bond distribution in the two computational scales is comparable. The maximum average bond length was found to be ~0.49 nm for the 1B—3B bead, ~0.60 nm for 1B—4B, ~0.27 nm for 3B—4B, ~0.34 nm for 3B—5B, ~0.29 nm for 4B—5B, ~0.40 nm for 5B—7B, ~0.72 nm for 7B—3B, and ~0.54 nm for 7B—4B. In the case of bond angle calculations, the estimated bond angle between any three beads has been determined and presented in Figure S1a,b. The maximum distribution of the average bond angle is gauged at approximately 150° for beads 4B—7B—8B and approximately 60° for beads 4B—7B—8B, which is very stable. Eventually, the findings from both simulations (atomistic simulation indicated by a “black” curve and coarse-grained simulation indicated by a “red” curve) show a similar trend of bond angle distribution. We have also analyzed the dihedral angle between the four beads 1B—3B—4B—7B, and similar findings are observed for both the cases as presented in Figure S1c. The findings from the calculation as mentioned above show very good agreement, which indicates that the structure and parameters of the mometasone furoate molecule are stable. Additionally, for more validation of the coarse-grained molecular structure of drug molecules, the octanol–water partition coefficient has also been determined.

3.2. Calculation of the Partition Coefficient of the Drug Molecule

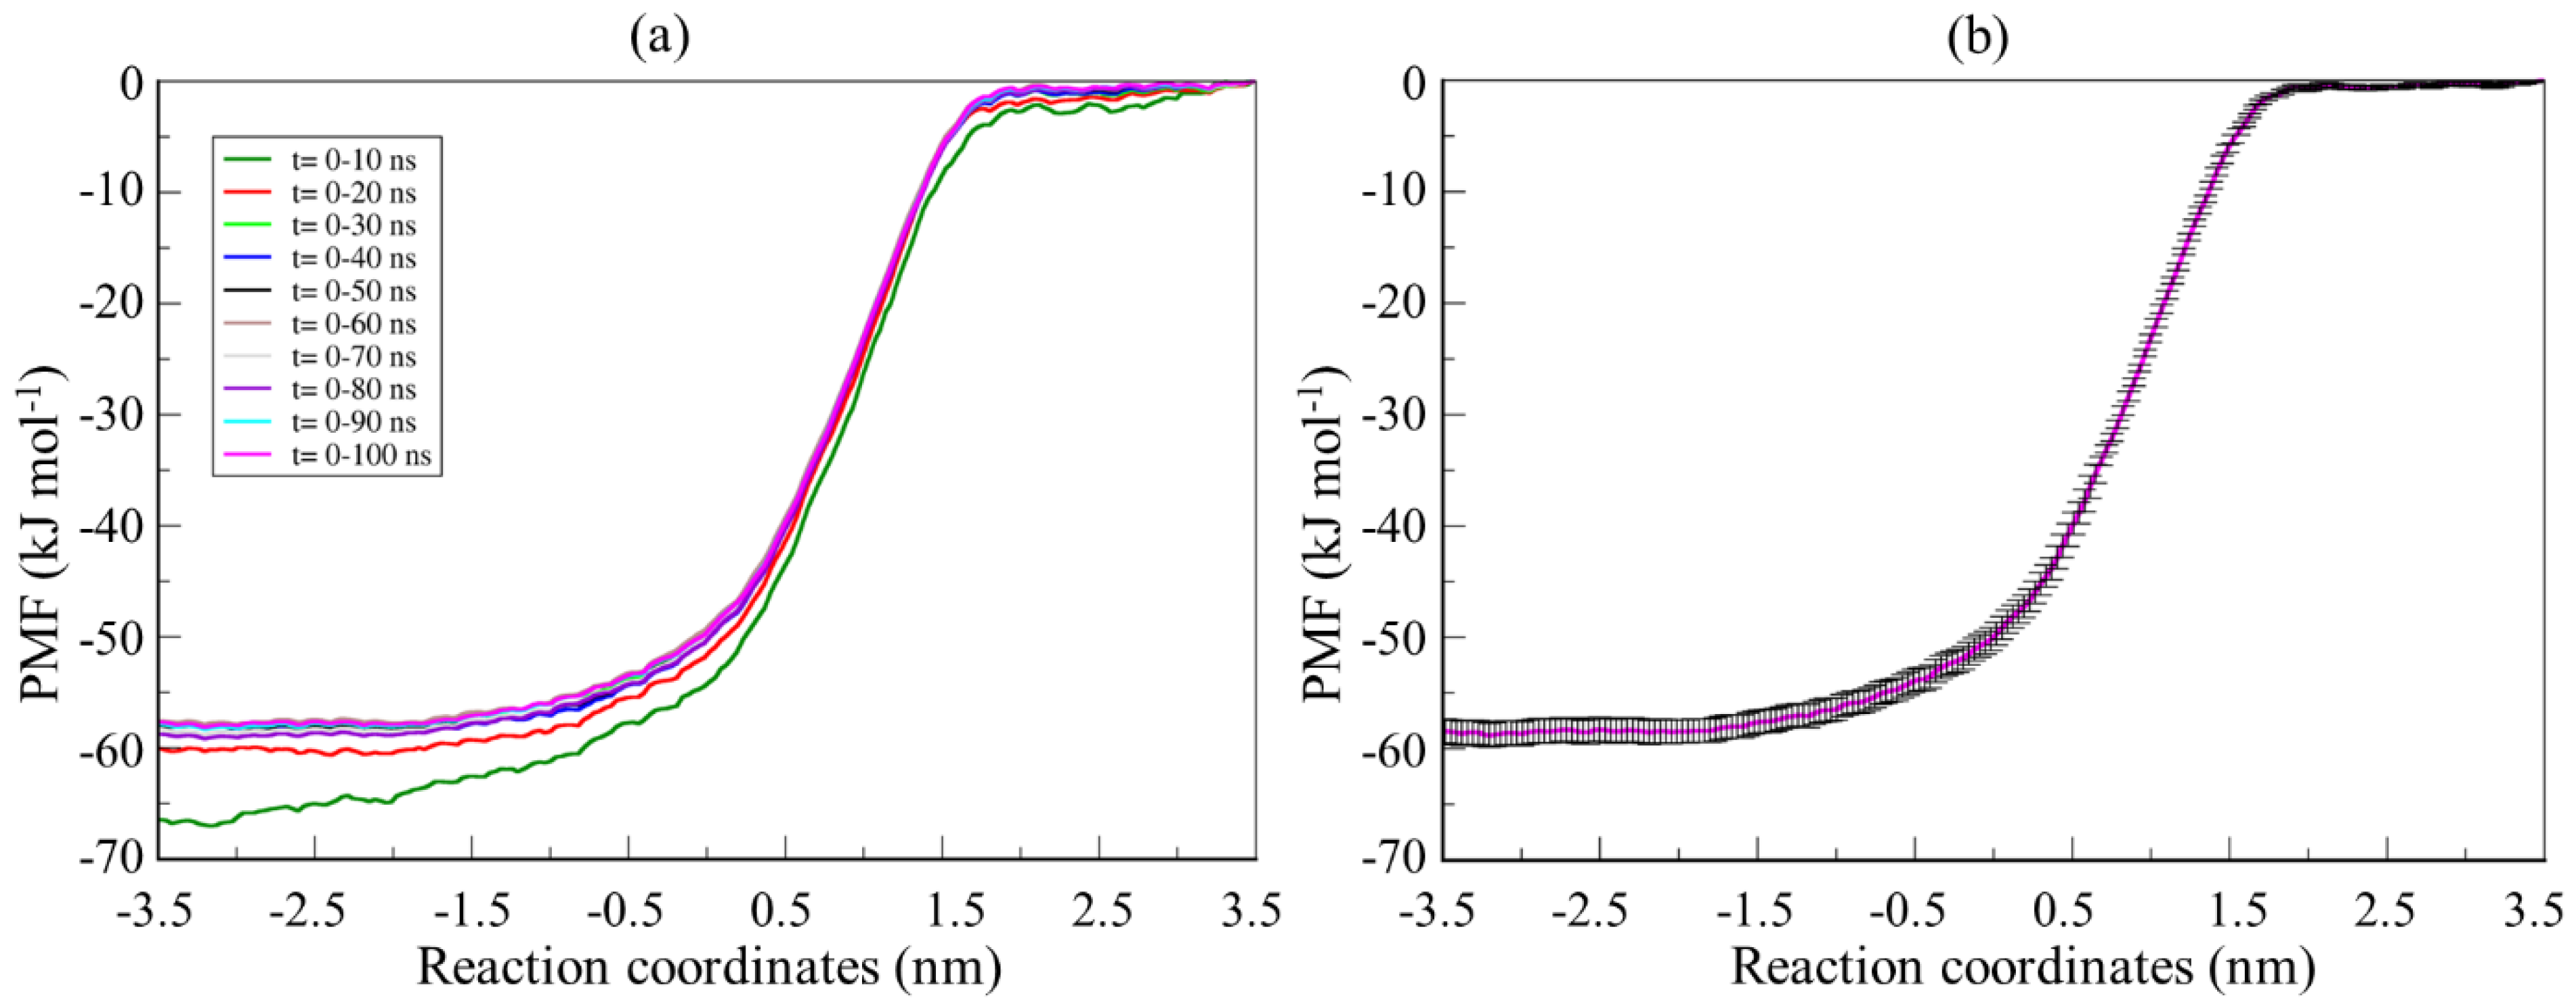
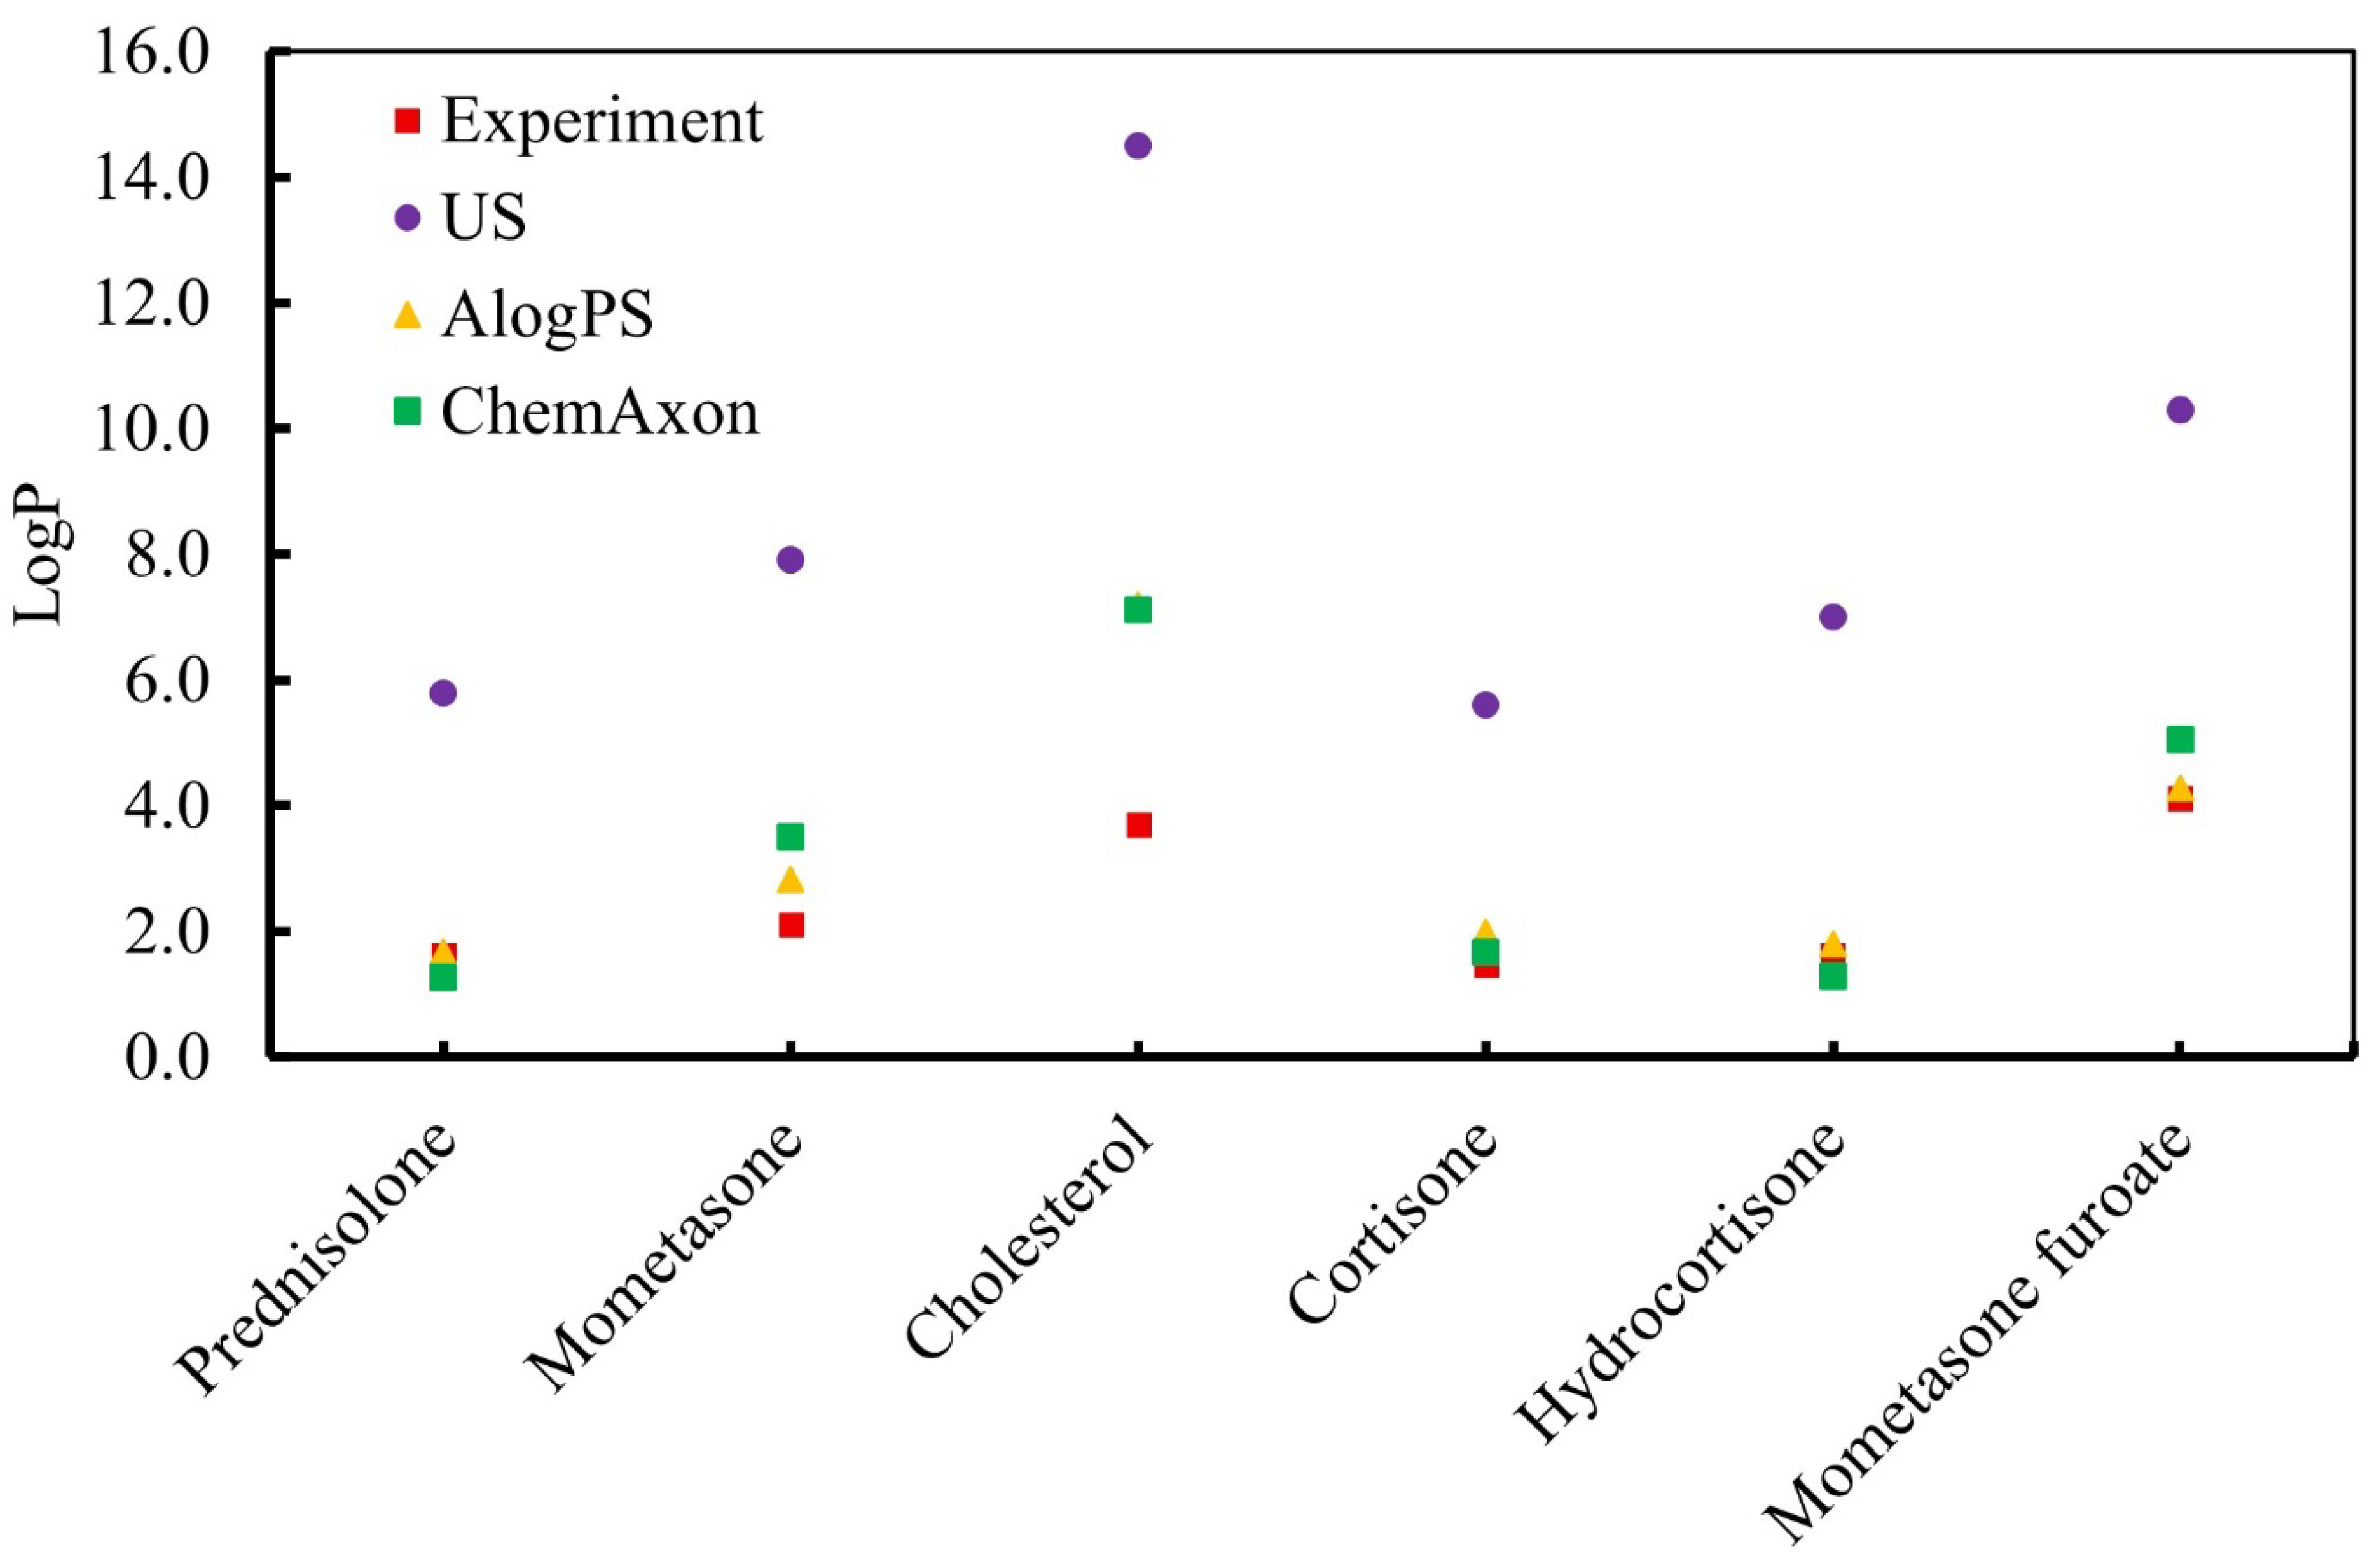
The trustworthy partition coefficient of the drug molecule is obtained from the Gibbs free energy gradient using Equation (2), and the PMF is calculated from umbrella sampling simulation at various simulation time frames (for convergence test, Figure 4). The obtained logP value was then compared with the experimental and predicted partition coefficient by cheminformatic techniques for mometasone furoate and other corticosteroids as illustrated in Figure 5.
logP octanol water m o m e t a s o n e   f u r o a t e = G o c t a n o l w a t e r 2.303   R T
where R is the molar gas constant. The weighted histogram analysis method (WHAM) [35,47] was applied to recalculate the free energy (Figure 4), which had fluctuation errors computed with the help of the bootstrapping method [48]. The PMF produced from steadily longer trajectory lengths served as a measure of convergence of the results. The calculated free energy difference G o c t a n o l w a t e r was found to be −58.65 kJ mol−1 (Figure 4b), and the subsequent logP value of mometasone furoate was found to be 10.29. Although the logP value is overstated, the comparative logP values for other corticosteroids (prednisolone, mometasone, cortisone, hydrocortisone, and cholesterol) are reasonable, and our values are comparable to earlier simulations of CG models that mimic similar corticosteroid drugs [49] as presented in Figure 5.
The common logarithm value of partition coefficient P (logP) is a constant that explains different physical phenomena, including the physicochemical property of a drug compound (lipophilicity). If the value of logP is negative, then the compounds are hydrophilic (i.e., have a higher affinity for the aqueous phase). On the other hand, a positive value of the logP refers to the molecule as a lipophilic compound (i.e., a higher affinity for the lipid/organic solvent phase). If the logP value is zero (0), the molecule is equally partitioned between lipid and aqueous phases. As we obtained a positive logP value (10.29) from the US simulation, mometasone furoate is a lipophilic drug compound. This means that the drug is soluble in the lipid subphase. LogP is an important characteristic that affects how a medicine interacts with the lung surfactant monolayer and how well it will be absorbed, transported, and disseminated. Mometasone furoate is more hydrophobic than other corticosteroid drugs, as illustrated in Figure 5. As a result, this drug might have a strong interaction with the lung surfactant lipid components, which will help to explain the accumulation and spreading mechanism of the drug molecule on the lung surfactant monolayer.

3.3. Monolayer Surface Tension Analysis

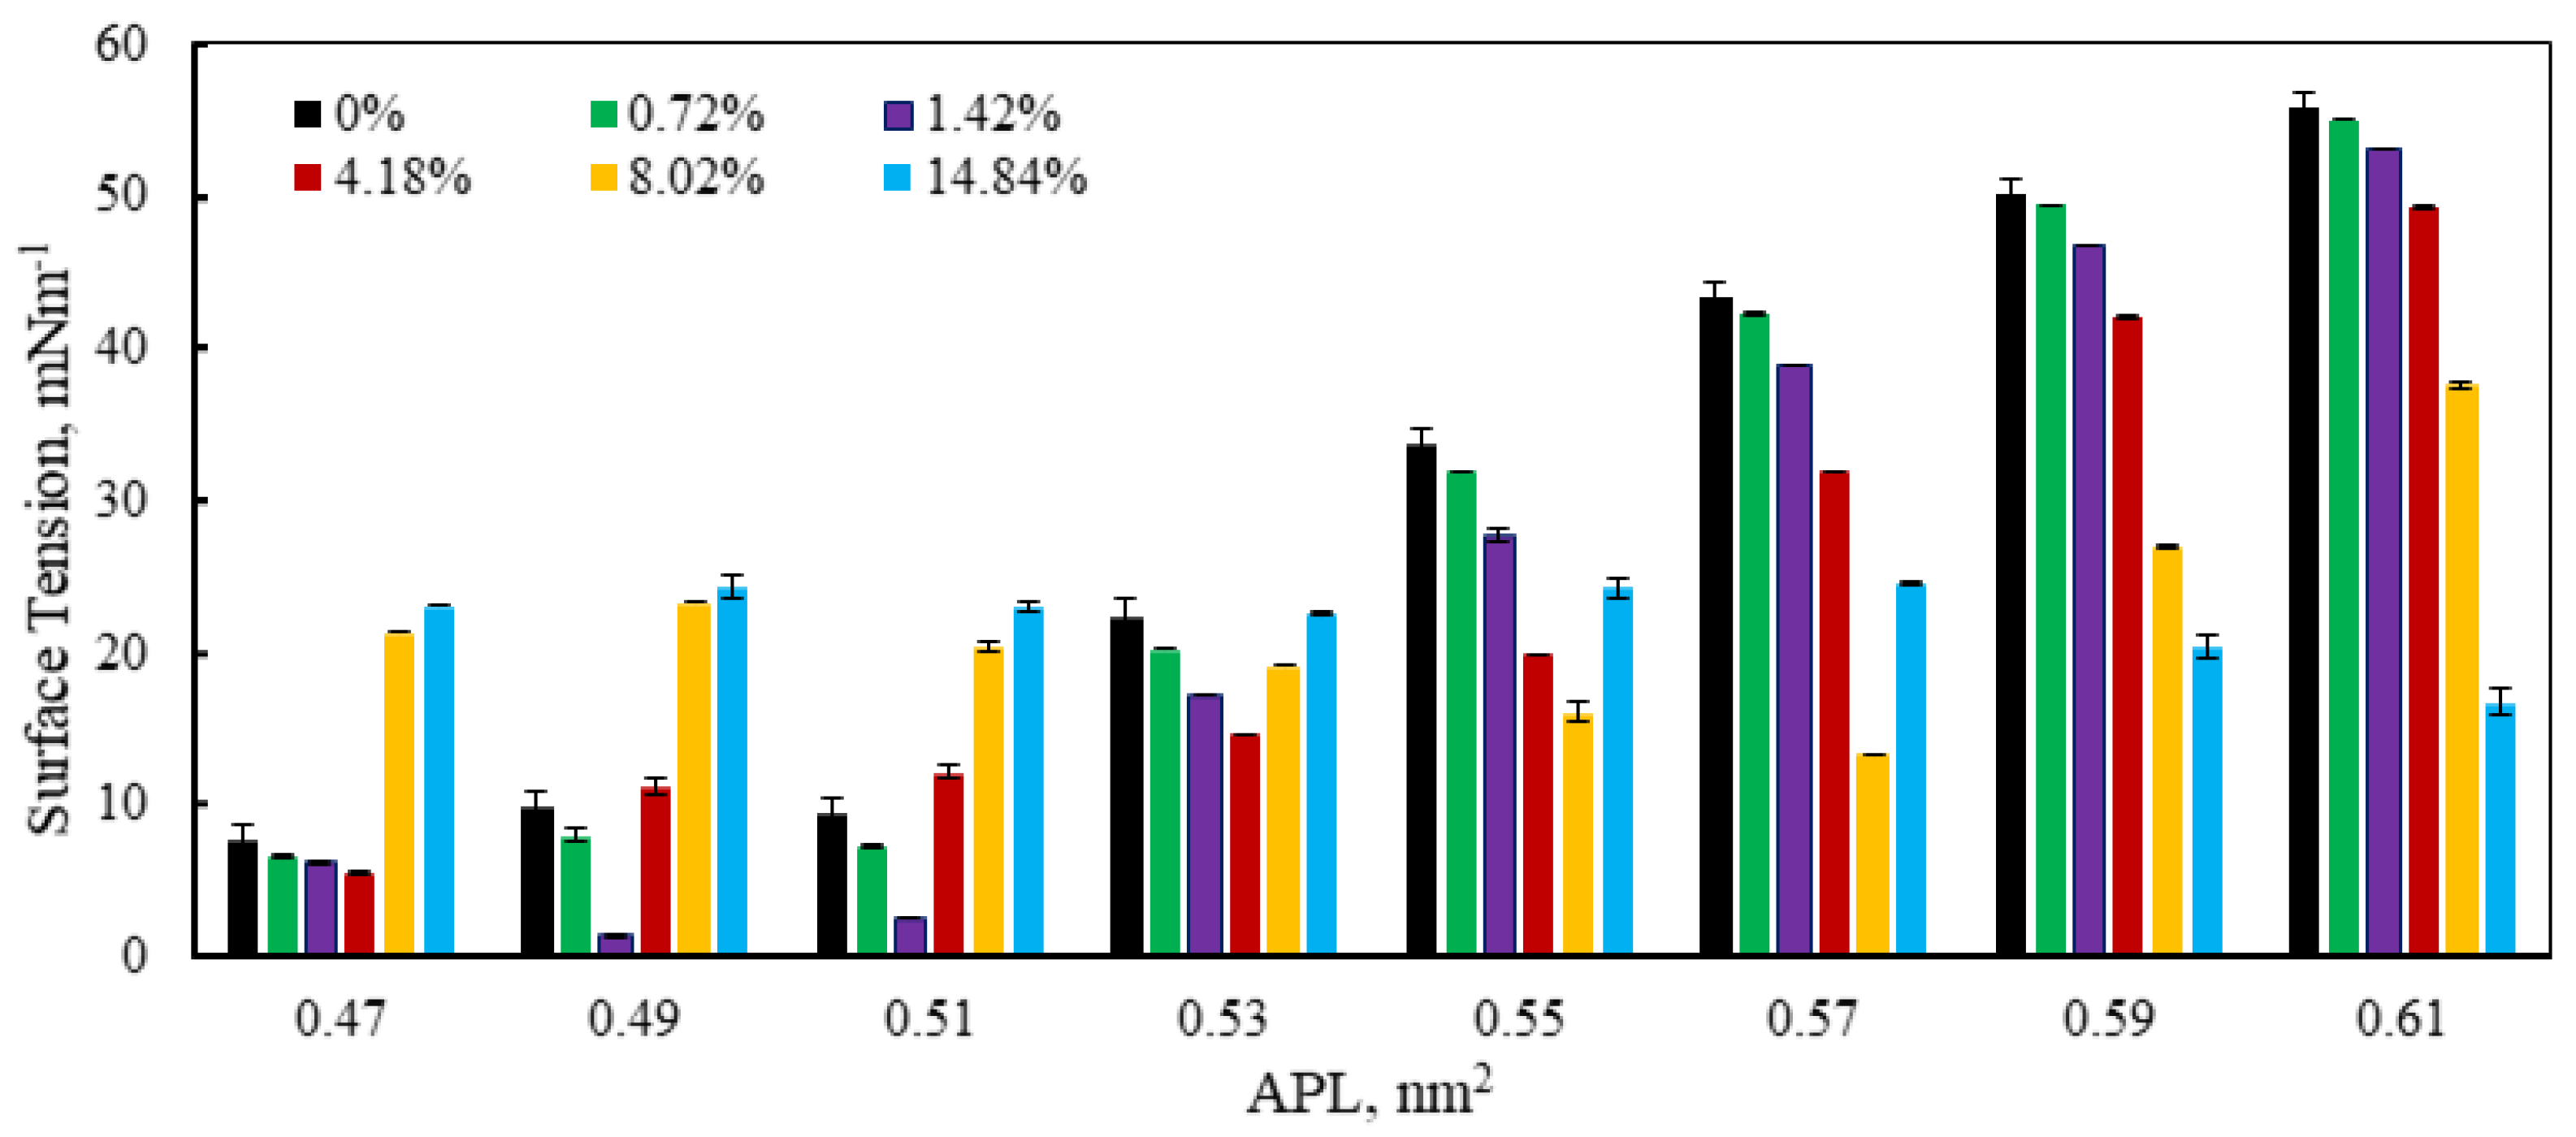
After obtaining the stable structure of the drug (mometasone furoate) molecule, the MD simulation was run at constant APL values ranging from 0.47 nm2 (highly compressed monolayer) to 0.61 nm2 (highly expanded monolayer) with an equally spaced molecular area of 0.02 nm2. From these simulations, the surface tension was monitored at various drug concentrations, as presented in Figure 6. The surface tension was estimated with the help of Equation (3s) in the Supplementary Section S1.5. At lower APL values (0.47 nm2) representing the exhalation breathing estimates, the surface tension was ~7.50 mNm−1 (in the control system, with no drug), which can be aligned with the experimental results for the other corticosteroid drug, hydrocortisone [60].
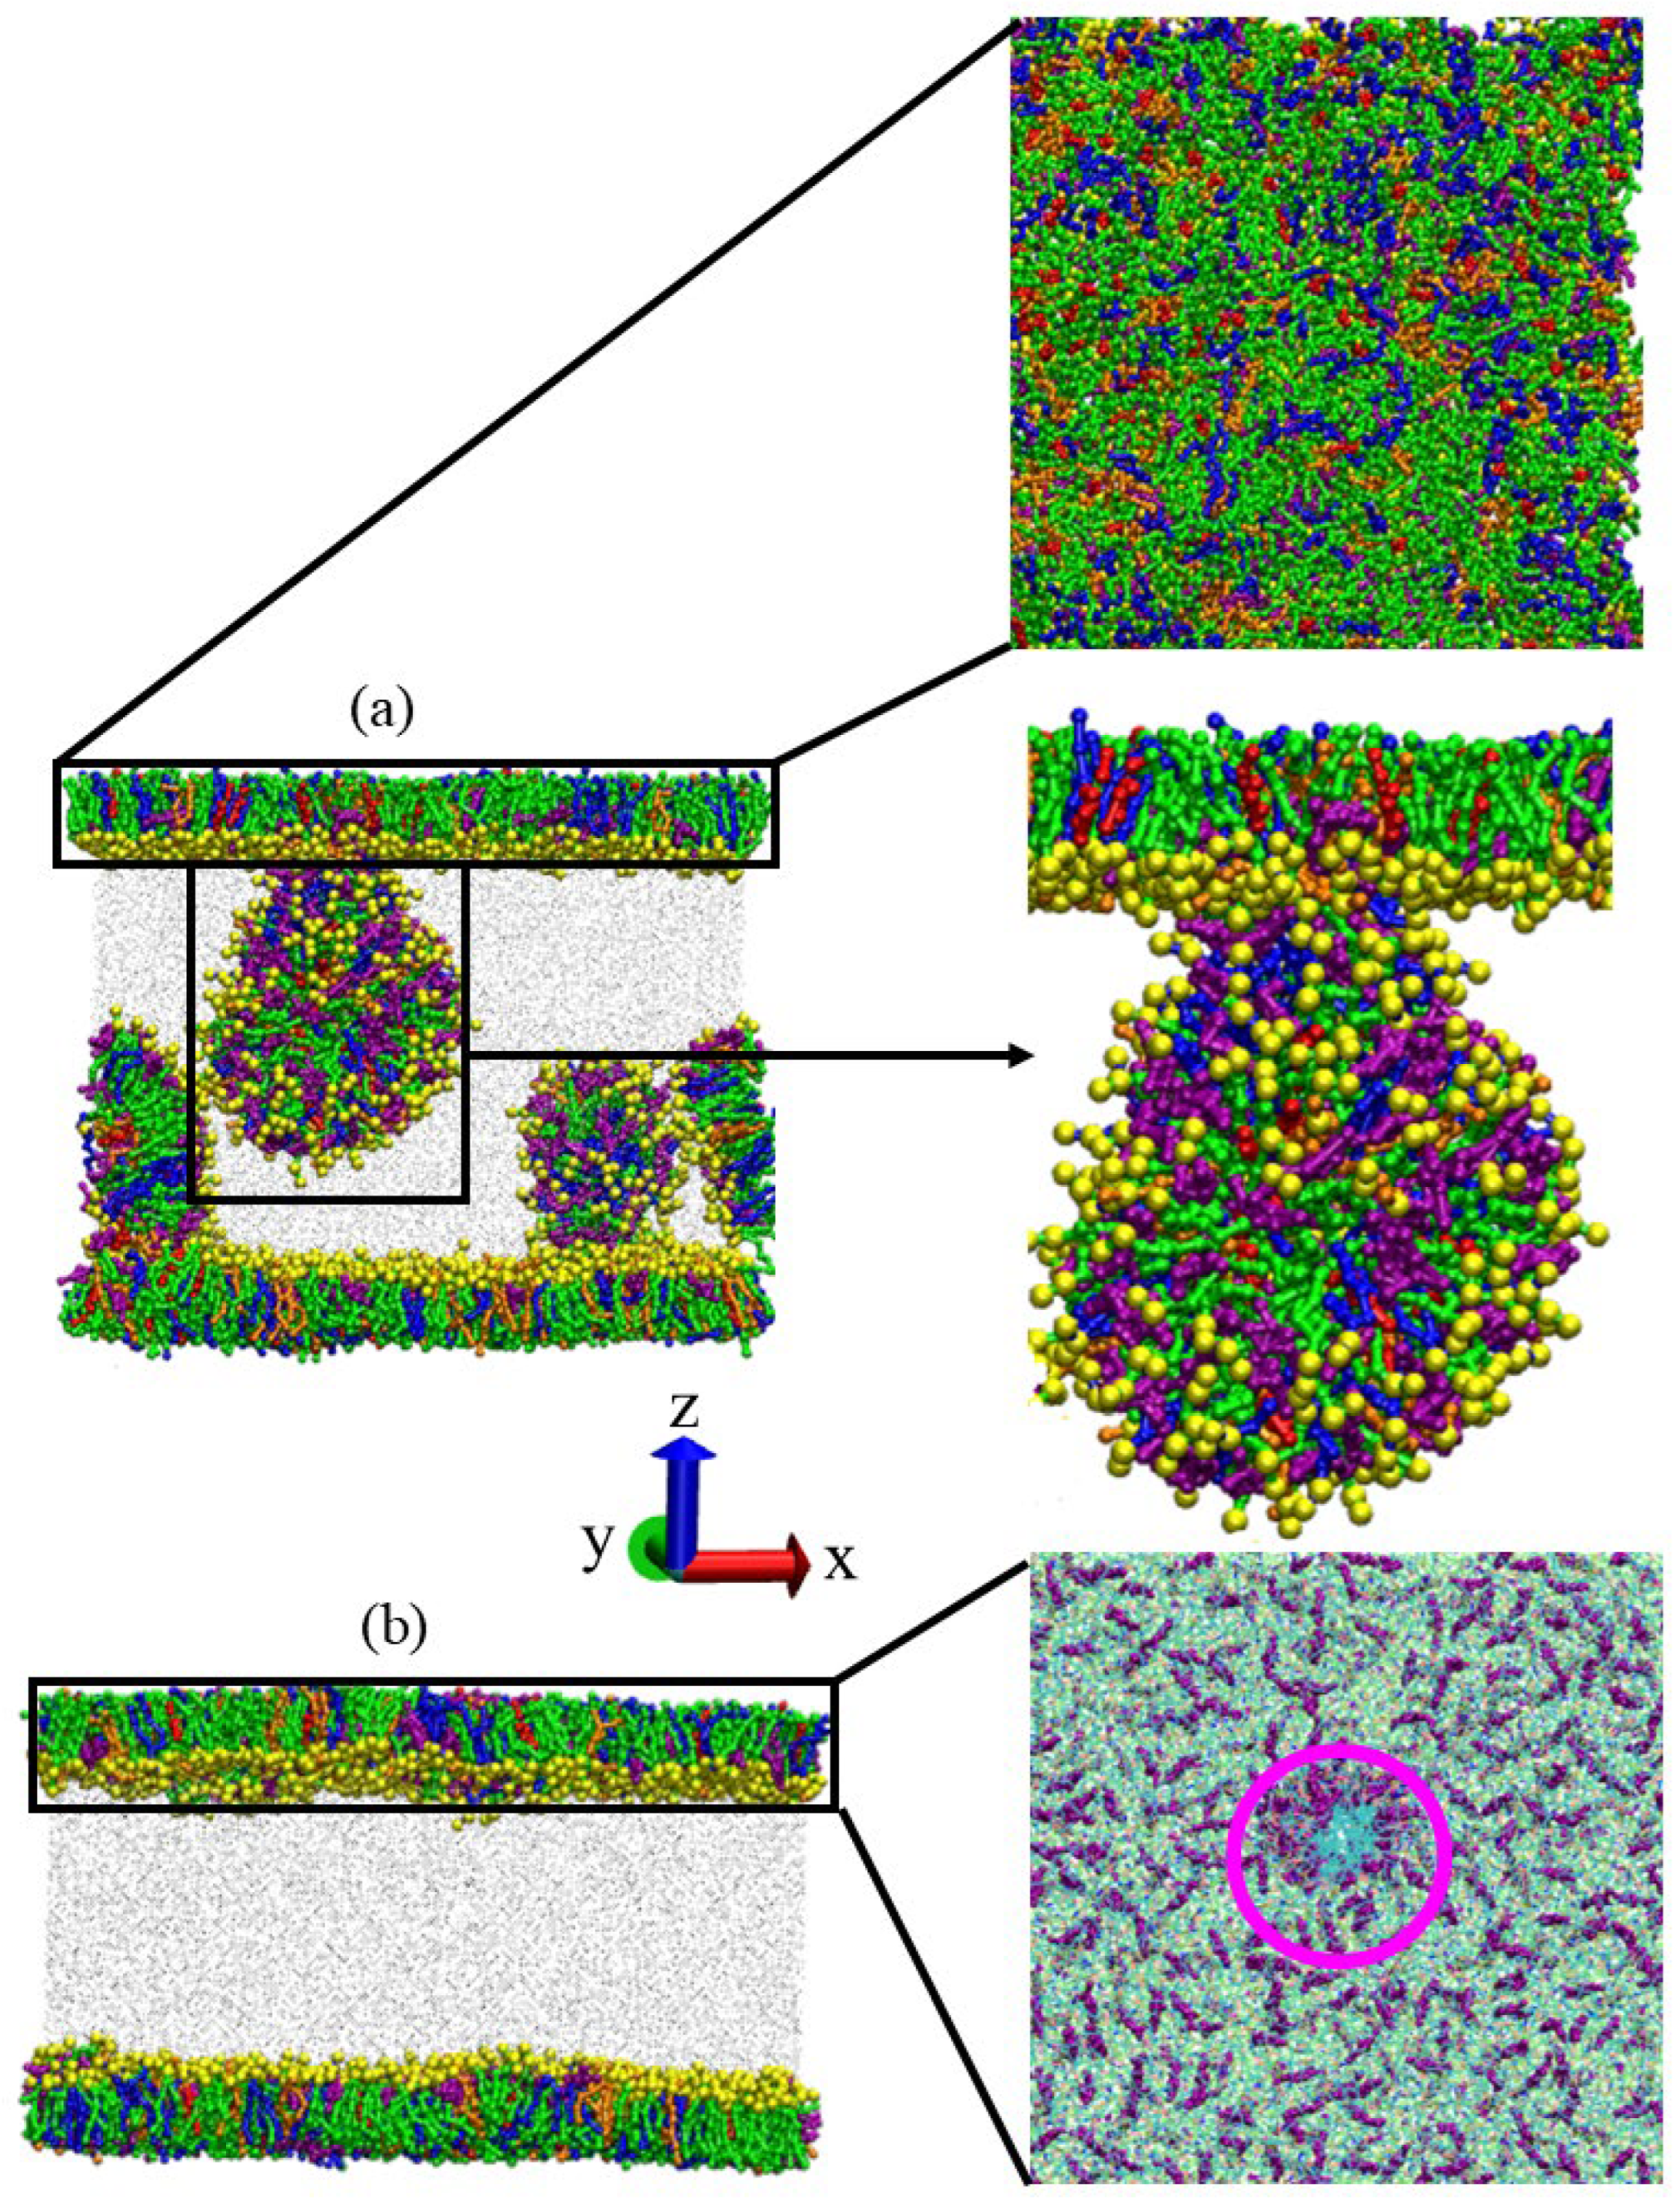
After introducing the drug molecules into the system, the surface tension starts declining with the increase in drug concentrations by ~6.5 mNm−1 (0.72% w/w), ~6.2 mNm−1 (1.42% w/w), and ~5.5 mNm−1 (4.18% w/w) (Figure 6). This behaviour of the monolayer is seen for a certain drug concentration of 4.18% w/w (~5.5 mNm−1). Then, a dramatic increase in surface tension is observed for drug concentrations of 8.02% w/w (~21.3 mNm−1) and 14.84% w/w (~23.0 mNm−1). It is well known that pure phospholipid combinations make up lung surfactants, which cover the surface of the alveoli. These films prevent alveoli from collapsing by reducing the surface tension of the alveolar fluid to a low value (<~5 mNm−1) [61]. The drug molecules show a crucial effect on the monolayer stability by balancing the surface tension and surface pressure up to the drug concentration (<8.02% w/w) at a highly compressed monolayer. In contrast to the reduction in surface tension, the monolayer reveals a sudden rise in surface tension ~21.3 mNm−1 (8.02% w/w) once the drug concentration exceeds the critical value 8.02% w/w and causes instability of the monolayer (Figure 7) which induces the lung surfactant monolayer to collapse at the low mean molecular area.
A similar trend of surface tension has been observed up to the monolayer mean molecular area of 0.51 nm2 for the drug concentration of 1.42% w/w. The opposite scenario was observed when the mean area per lipid increased from APL = 0.53 nm2 to APL = 0.61 nm2 for all drug concentrations except 8.02% w/w and 14.84% w/w at APL values 0.59 nm2 and 0.61 nm2, showing comparatively higher surface tension at the 8.02% w/w (~27 mNm−1 at APL = 0.59 nm2 and ~37.5 mNm−1 at APL = 0.61 nm2) drug concentration compared to 14.84% w/w (~20.4 mNm−1 at APL = 0.59 nm2 and ~16.7 mNm−1 at APL = 0.61 nm2). Beyond the critical concentration, a higher drug concentration causes higher film fluidization, which induces the surfactant film to collapse earlier at lower APL values. On the other hand, at a higher APL value, the drug causes microstructure pore formation in the monolayer (Figure 7b), which supports interaction of the other corticosteroid drug (hydrocortisone) with the lung surfactant monolayer [49]. Due to high surface tension, the monolayer experiences a huge interfacial force that helps to split the monolayer components from the surface, causing pore formation, which is highly influenced by the maximum drug concentration. As can be seen from Figure 7b, a pore has been created, and it is found that in the size of the pore is increasing as the drug concentration raises. The mechanism of such pore formation can be found in a study by Fangsheng et al. [62]. The overall findings from this investigation are that at low APL (<0.47 nm2), the phospholipid mixed monolayers collapse (Figure 7a) as drug concentration rises by fracturing the microstructure of the monolayer, while at high APL values (more than 0.61 nm2), a nanopore forms in the monolayer (Figure 7b). This is because of the inability of the drug to spread at low molecular areas, causing the monolayer to collapse. In contrast, the imbalance of high interfacial pressure over the monolayer surface induces the splitting of the lipid molecules from the monolayer surface, causing the formation of nanopores on the monolayer.

3.4. Monolayer Phase Analysis by Density Calculation

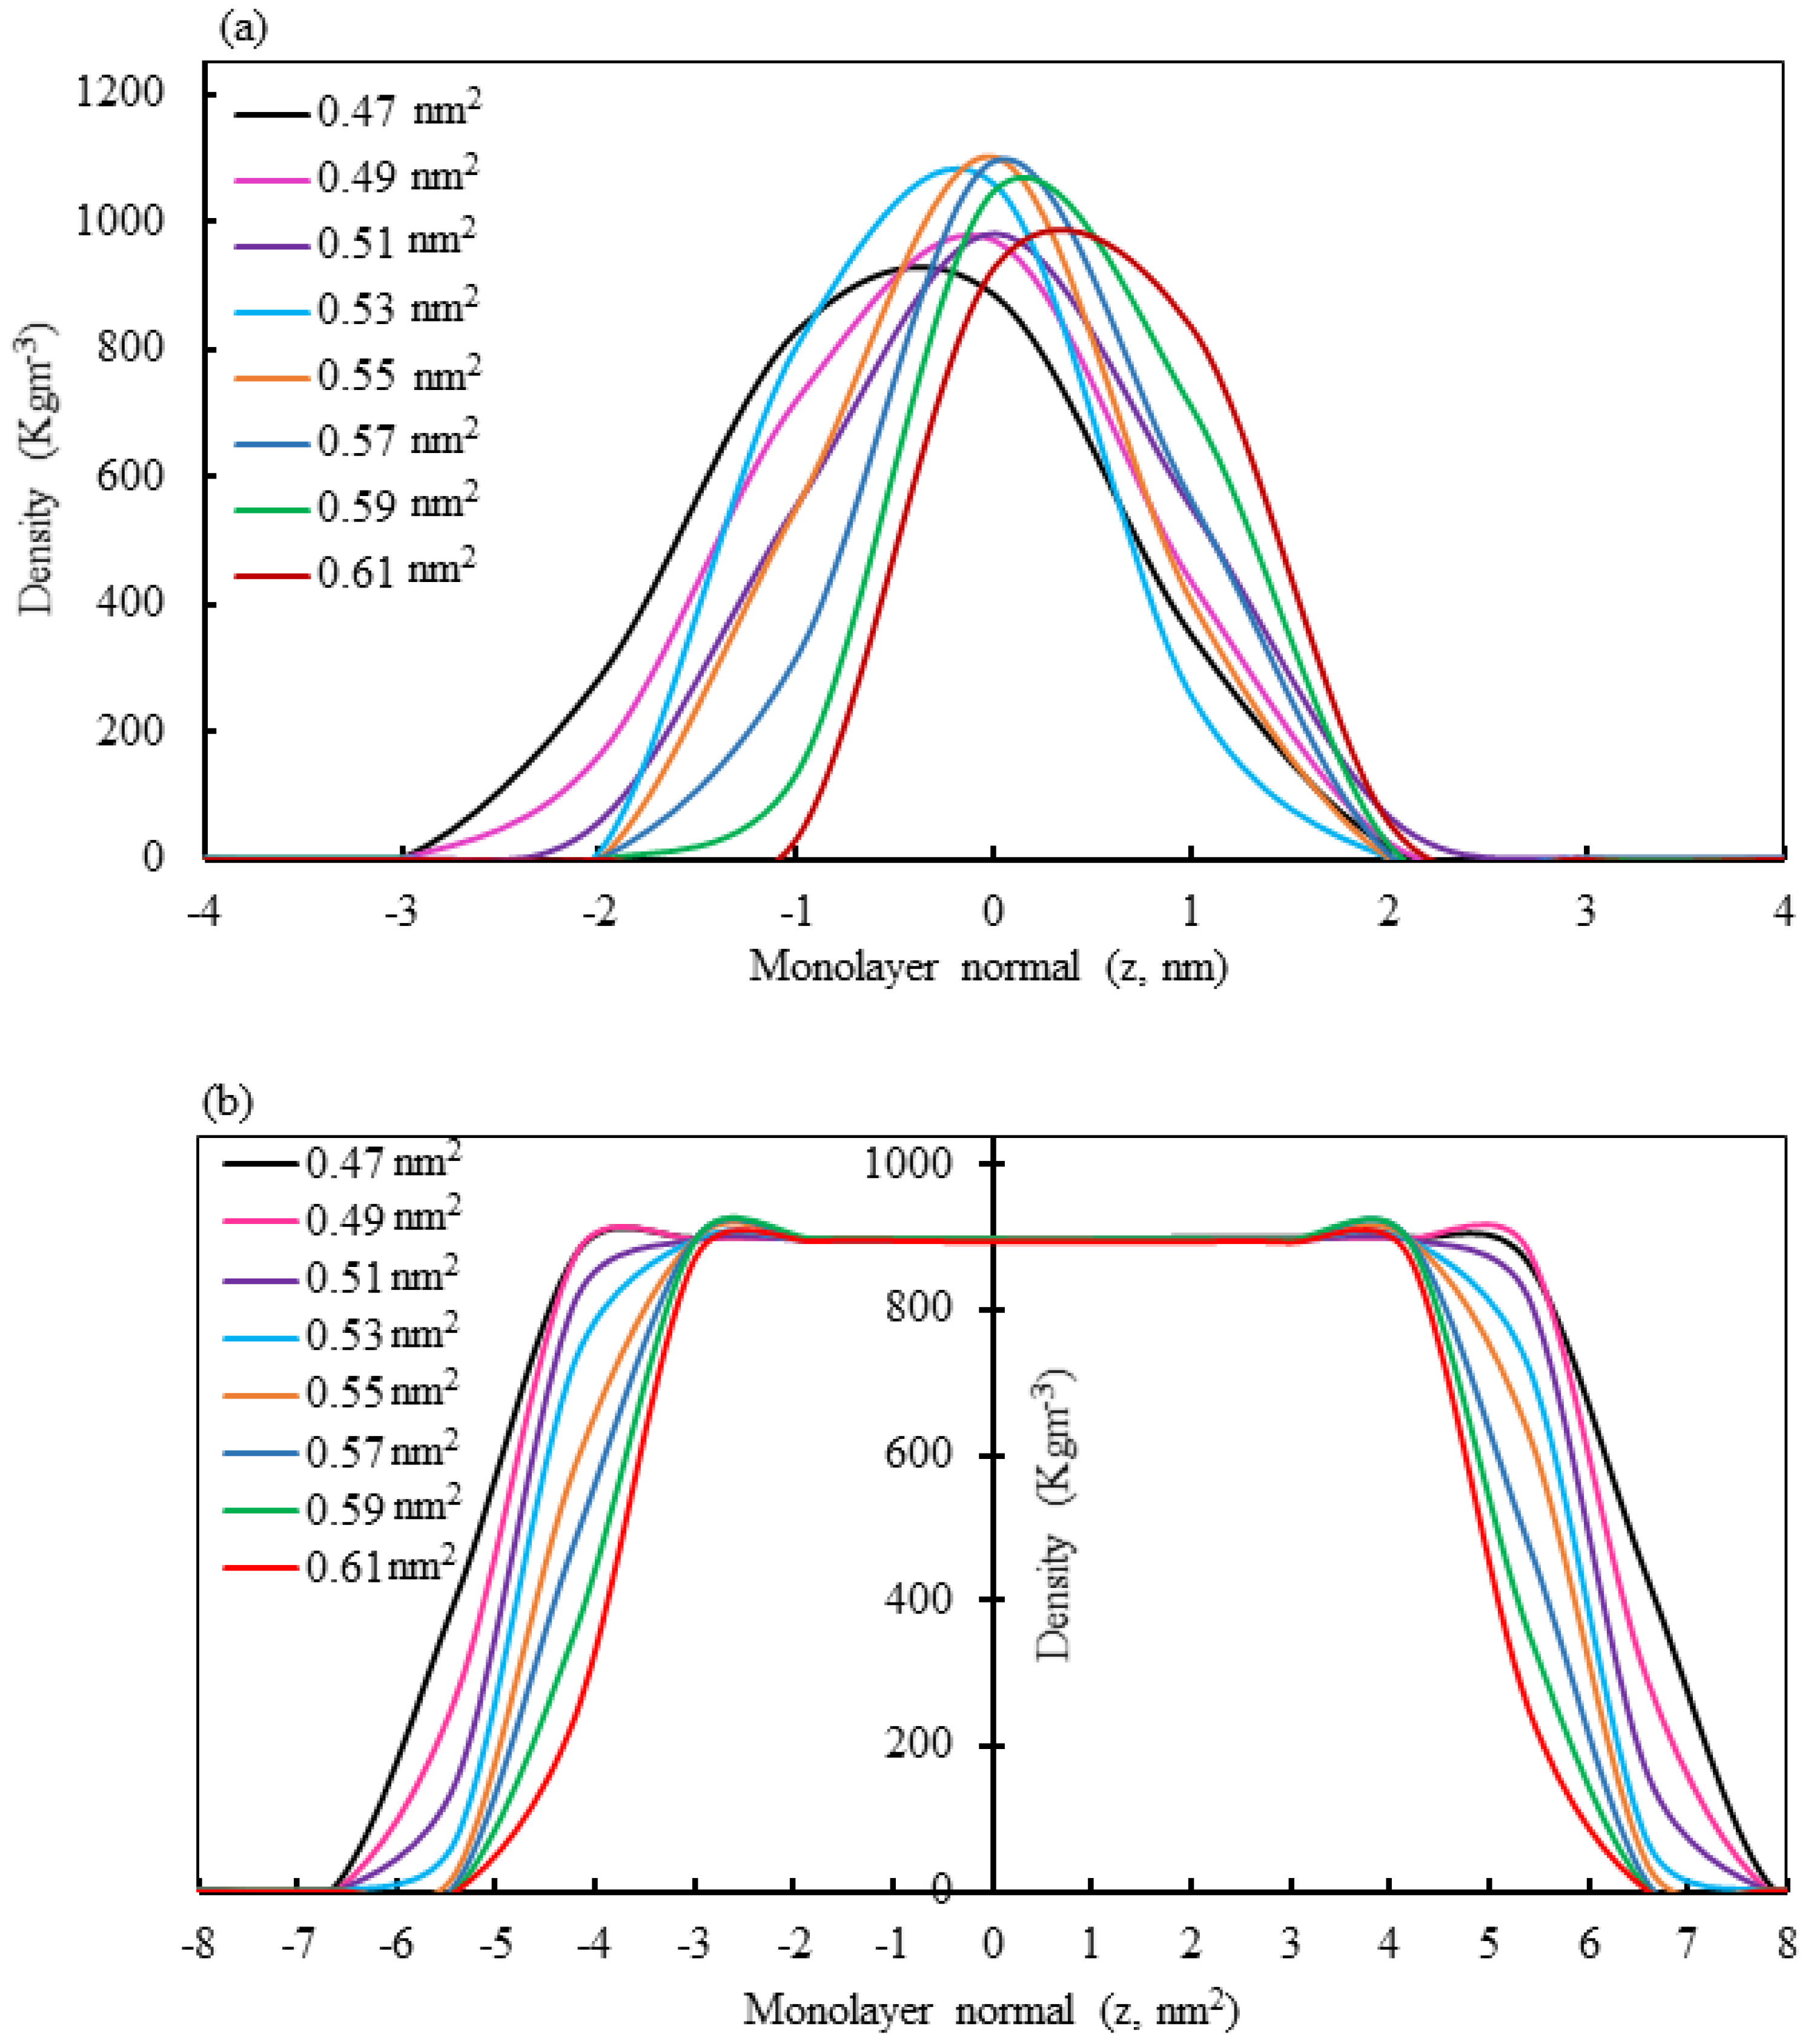
Mass density profiles of the monolayer components, along the monolayer, normal direction can be calculated to see whether the lung surfactant monolayer is losing thickness or not, as well as the lipids that make up the monolayer to be displaced toward or away from the lipid–water or lipid–air interface. Figure 8 displays the mass density profiles for the phospholipids and water from simulations at different molecular areas in the presence of 1.42% w/w mometasone furoate. The comparison of average mass density curves of phospholipids at the different APL values reveals that the maximum peak heights of density profile (~1100 Kgm−3) are observed between the APL values 0.53–0.59 nm2 from the monolayer centre, while peak heights (~900 Kgm−3) at the compressed monolayer (<0.53 nm2) and expanded monolayer (>0.59 nm2) are the nearest to the centre of the monolayer. These findings provide information on the phase behaviours of the phospholipid’s mixed monolayer, whether it is liquid-condensed (LC), liquid-expanded (LE), or phase co-existence (LC-LE). At the LC phase, the calculated surface tension lies between 5.53 and 9.51 mNm−1 (at APL: 0.47–0.51 nm2) for all the drug concentrations (Figure 8a). In this situation, the monolayer lipid molecules are perpendicularly aligned with the monolayer surface, ensuring the higher-order parameter of lipid tails [63].
If the number of drug molecules gradually increases, then the monolayer collapses due to the inability to spread the capacity of the drug molecules over the monolayer surface. The hydrophobicity of the drug molecule influences the drug–drug, drug–lipid, and lipid–lipid interactions within the lower molecular area by producing a nanocluster of drug molecules on the monolayer (Figure 7a). This form of monolayer collapse has also been seen in the studies conducted by Lopez et al. [58] and Islam et al. [64]. On the other hand, phospholipid phase co-existence (LC-LE) has been observed between the APL values of 0.53 and 0.55 nm2, producing surface tension between 22.44 and 33.65 mNm−1. In this intermediate stage of the monolayer, the lipid molecules have space to move, which contributes to reducing the lipid tails’ order parameter. As a result, the drug molecules can spread easily over the monolayer surface by breaking down the nano-drug cluster without causing the monolayer to collapse. The following section will discuss such accumulation and splitting mechanisms in detail. These spreading behaviours of the drug molecule might also be found up to the APL value of 0.59 nm2 for the underlying drug concentrations. If the APL value exceeds 0.61 nm2, then the monolayer exists in the liquid-expanded (LE) state, where lipid molecules may move frequently from their origin over the monolayer surface. In this case, the phospholipid density peak has been calculated at ~900 kgm−3 after a slight decrease in the density profile curve (Figure 8). This is because of the formation of the nanopore on the monolayer surface by displacing the monolayer components due to the additional pressure that the hydrophobic drug molecules might induce, according to the density data, which showed monolayer expansion due to the increasing drug presence on the monolayer. These alterations point to a minor membrane thinning. Another critical effect on the monolayer is the shifting of the membrane to the monolayer centre (as presented in Figure 8b) when the APL is increased by reducing the water density from 1000 kgm−3 to 900 kgm−3. These changes in the monolayer’s location imply that it is expanded at a high mean molecular area compared to a low mean molecular area, which aligns with the APL and surface tension data. Therefore, the density profiles of lipids and water molecules control the monolayer phase behaviour and drug distribution over the monolayer surface.

3.5. Drug Distribution by Clustering Analysis

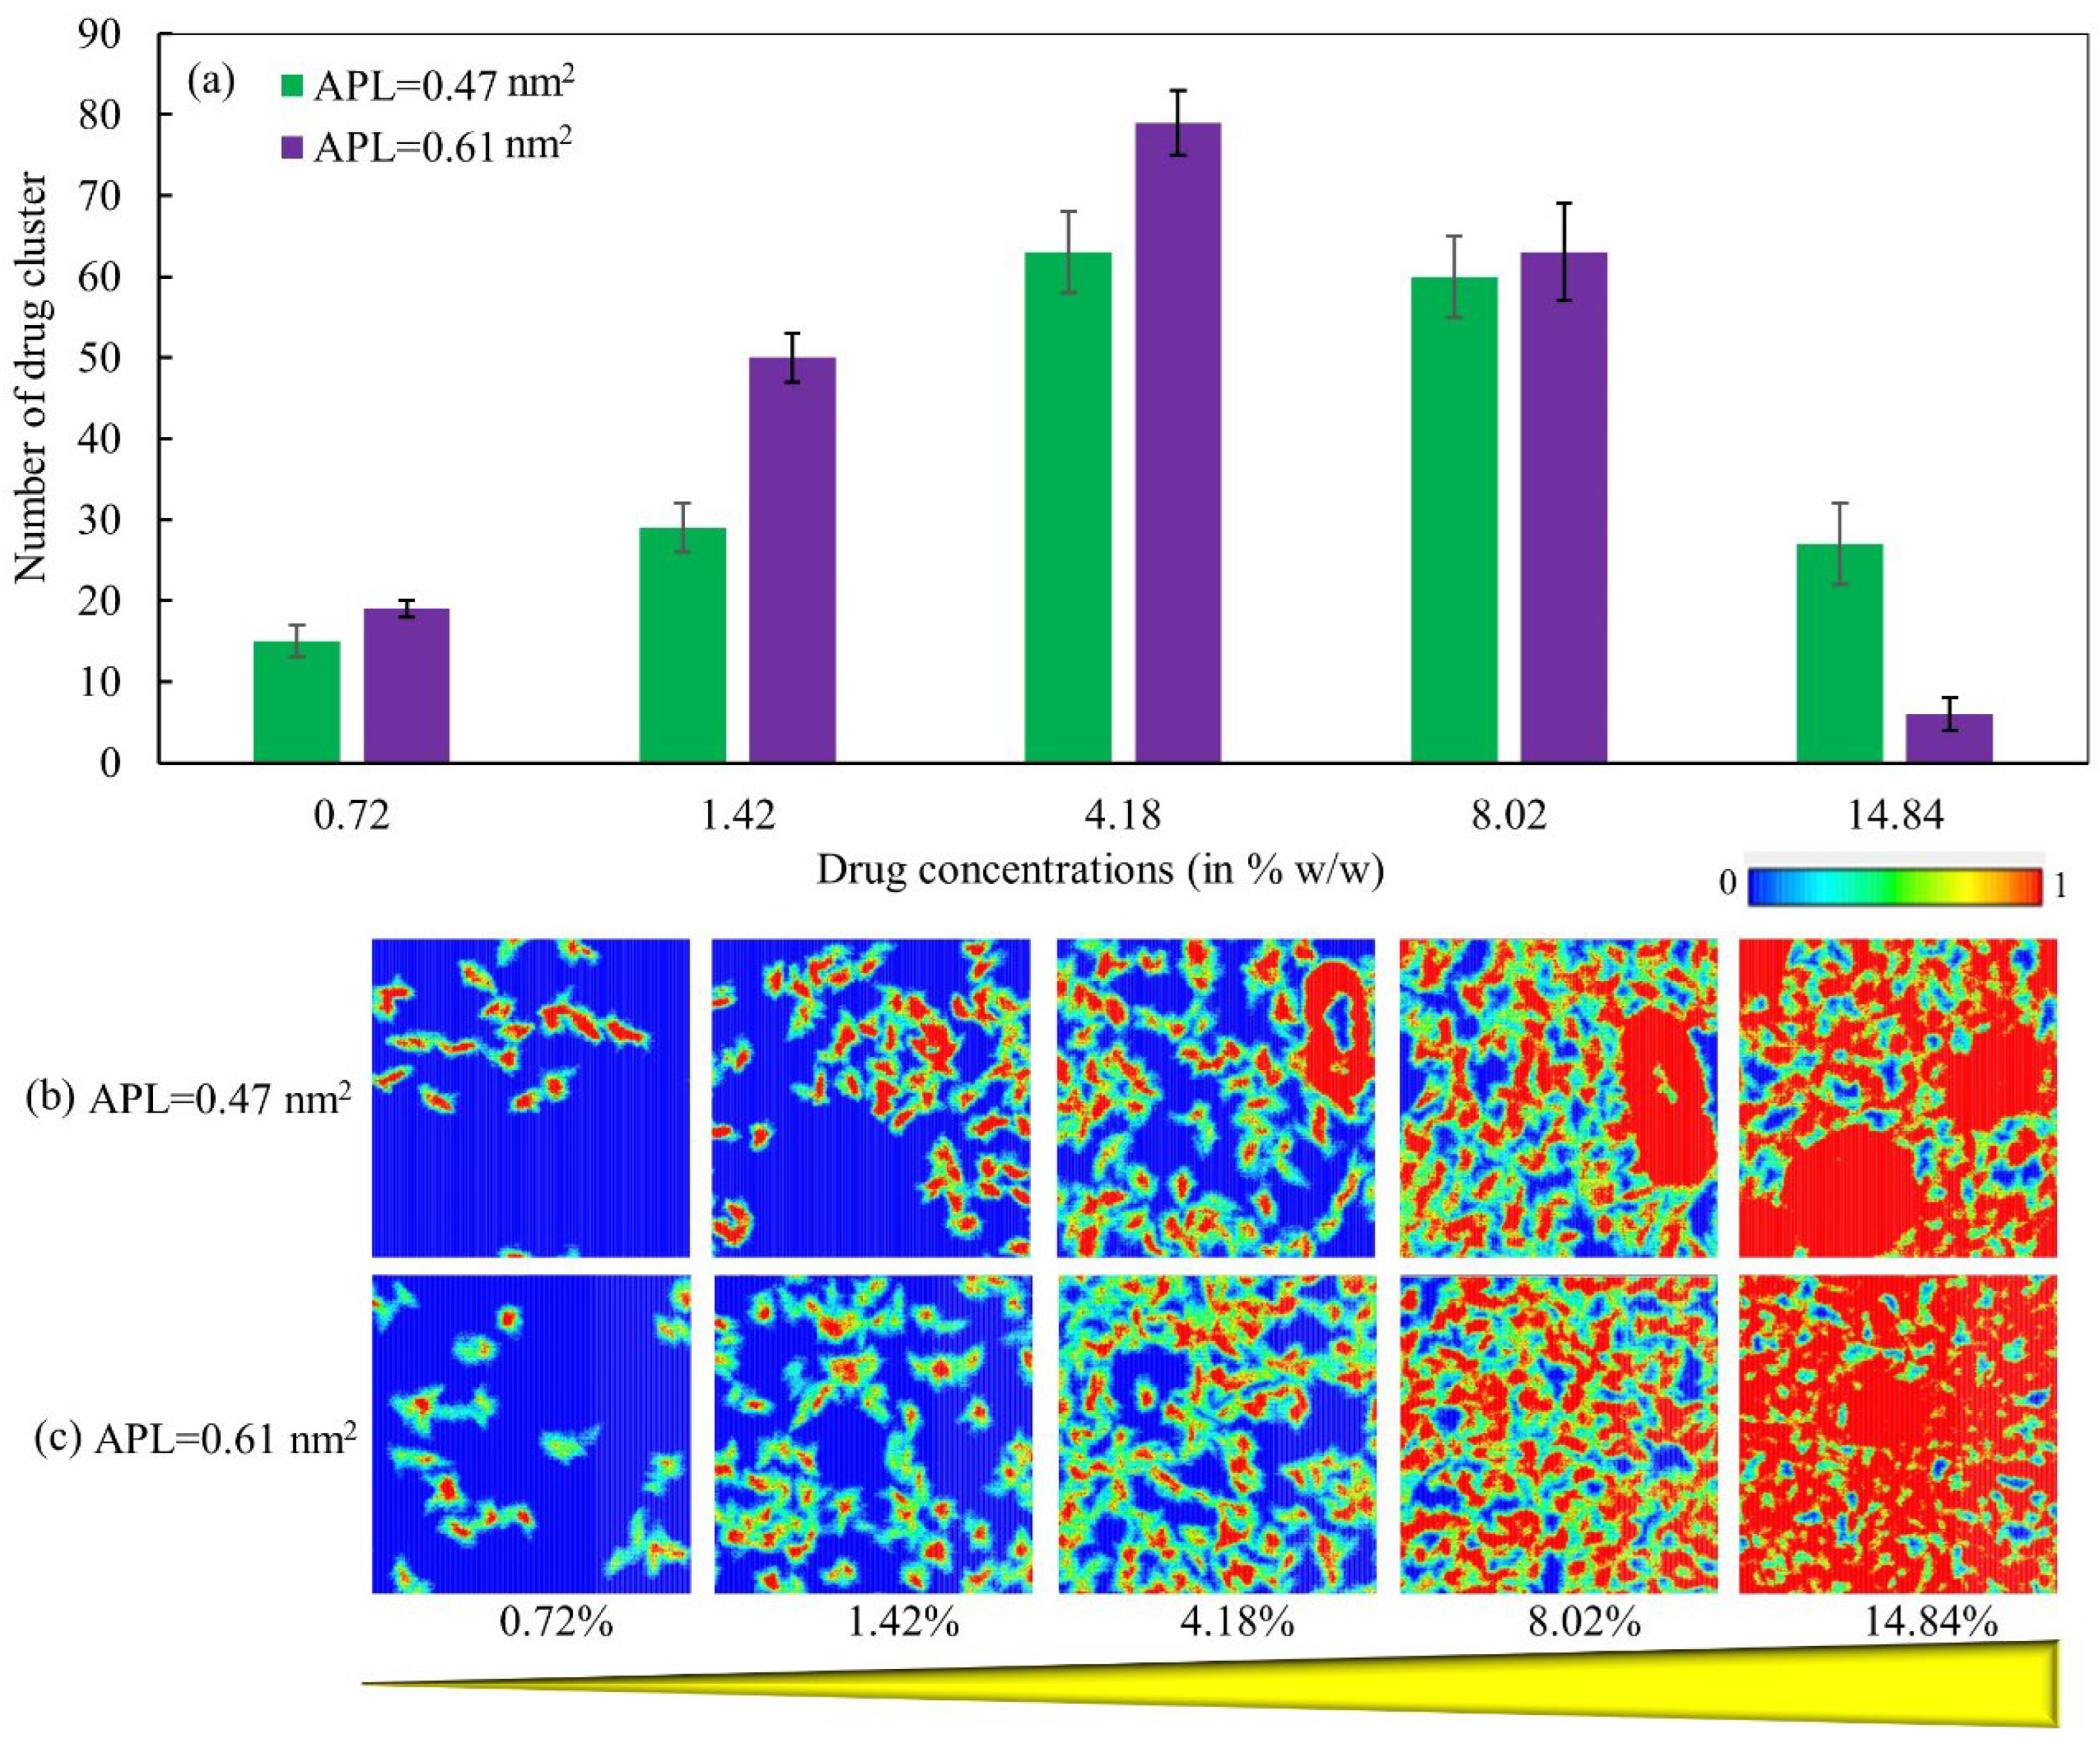
Organizing a collection of molecules in the same category (referred to as a cluster) makes them more similar to each other than those in other groups. It is a primary function of the exploratory analysis of data and a widely used statistical data analysis technique in various fields, including bioinformatics, biophysics, and molecular biology. Drug molecules may adsorb into the monolayer by inducing cluster formation. The cluster formation criterion is configured in such a way that the drug molecules are said to be in a cluster if the distance between any two drug molecules is less than 1.20 nm. A cluster size analysis of mometasone furoate was performed for a range of drug concentrations at two different states of the monolayer, the expanded monolayer (LE phase, APL = 0.61 nm2) and the compressed monolayer (LC phase, APL = 0.47 nm2), to examine the effect of drug concentrations on the formation of the drug clusters. To do so, the relevant number of drug molecules (20 drugs for 0.72% w/w, 60 drugs for 1.42% w/w, 120 drugs for 4.18% w/w, 240 drugs for 8.02% w/w, and 480 drugs for 14.84% w/w) were introduced into the monolayer (Figure 9a).
Time evolution of the number of drug cluster formations for the mixed-lipid DPPC-POPC-POPG-CHOL monolayer, maintaining a ratio of 60:20:10:10, was determined for APL = 0.47 nm2 and APL = 0.61 nm2 as illustrated in Figure S2. The calculated time-averaged numbers of drug clusters were 15, 29, 63, 60, and 27 for APL = 0.47 nm2 and 19, 50, 79, 63, and 6 for APL = 0.61 nm2 at the respective drug concentrations 0.72% w/w, 1.42% w/w, 4.18% w/w, 8.02% w/w, and 14.84% w/w (Figure 9a). Figure 9a shows that cluster formation progressively rises with drug concentration up to a specific point (4.18% w/w), after which it precisely decreases with increasing drug concentration. The drug on the monolayer surface determines the hydrophobic drug–drug interaction, which is maximal at a specific critical drug concentration (4.18% w/w). However, drug interactions are less prominent at other drug concentrations than at this threshold drug concentration (4.18%). Initially, the drug molecules accumulate together to form different large clusters that stay on top of the lipid tails of the monolayer before entering the monolayer surface.
These big drug clusters fragment as time passes and then start splitting the drug molecules into several smaller nanoclusters (Figure 9b). The distribution of the drug molecules has also relied on the monolayer state. Highly compressed monolayer components (lipid molecules) may prevent the drug molecules from spreading at low APL values, which could lead to the monolayer collapsing (Figure 7), which supports another study conducted by Islam et al. [64] for the corticosteroid drug prednisolone. Figure 9b illustrates such a collapsing mechanism at higher drug concentrations. A small-sized lipid protrusion formation has been seen in the monolayer once the drug concentration exceeds 4.18% w/w and gradually increases in size. This protrusion induces the lipid monolayer to transform into a monolayer–bilayer structure and, finally, causes monolayer collapse, which is supported by some existing experimental [65,66,67] and computational [68,69,70] studies. In contrast to low APL values, the opposite scenario is observed for higher APL values. At high APL values, the drug molecules have more space to transport over the monolayer surface due to the reduced number of drug–lipid clashes in the highly expanded lipid monolayer. In this case, the drug clusters might quickly break down and have more space to move over the monolayer surface by maintaining stability of the monolayer (Figure 9c). But if we further increase the APL values (APL ≥ 0.61 nm2), then the monolayer demonstrates pore formation due to the extremely high surface pressure, which was also observed by another study [49].

4. Conclusions

The present study has been conducted to parameterize the corticosteroid drug mometasone furoate utilizing a molecular dynamics simulation, as well as to determine the effect of drug concentration on monolayer morphology. The logP value of mometasone furoate was determined from the Gibbs free energy gradient, which was found to be 10.49. The value was then matched with the experimental and predicted partition coefficients of mometasone furoate, which shows good agreement. The optimized structure of the drug has been used to study the concentration effect of mometasone furoate on the lung surfactant. Using coarse-grained modelling of the drug, it was possible to efficiently test the stability of the lung surfactant monolayer and identify the critical corticosteroid drug concentration (4.18% w/w). This coarse-grained structure of the drug molecule may also provide information to conduct in silico, in vitro, and in vivo studies to identify the optimized drug dose for dry powder inhalers.
Fixed-APL simulation results reveal a concentration-dependent drop in surface tension for all APL simulations at a critical drug concentration and the underlying continuous compression–expansion simulation represents the exhalation–inhalation breathing cycle of the alveoli. The monolayer components may pack closer together at a highly compressed monolayer as a result of an intercalating effect that could happen when the drug intercalates between the phospholipid head groups compared to the lipid tail groups. For exhalation breathing, the drug-induced collapse was found at a higher drug dose (>4.18%). In contrast, drug-induced pore formation was noticed on the monolayer surface at a higher drug concentration (>8.02% w/w) for inhalation breathing. The results of the dynamic characteristics of the model show that the drug’s ability to diffuse into the monolayer is significantly reduced in larger clusters, and this effect is exacerbated when the system contains more drug molecules on the monolayer. The overall findings from this study show that pharmaceutical companies and wet lab scientists will be able to establish the appropriate corticosteroid dosage for lung disorders by conducting in silico, in vitro, and in vivo studies, which may contribute to a better understanding of the mechanism of interaction between inhaled corticosteroids and lung surfactant at the alveoli.

Supplementary Materials

The following supporting information can be downloaded at: https://www.mdpi.com/article/10.3390/micro5040044/s1, Figure S1: Optimization of coarse-grained bonded parameters for various bond angles (a,b) and dihedral angle (c) distributions between different coarse-grained beads. (a) beads: 4B-7B-8B, (b) beads: 7B-9B-10B, (c) beads: 1B-3B-4B-7B. The “black” colour indicates atomistic simulations, and the “red” colour refers to coarse-grained simulations; Figure S2: Time evolution of the number of drug cluster formation for the monolayer comprised of the mixed lipids DPPC-POPC-POPG-CHOL maintain a ratio of 60:20:10:10. Number of drug cluster for APL = 0.47 nm2 (a) and for APL = 0.61 nm2 (b). Table S1: Coarse-grained bead mapping of the mometasone furoate. A group of three or four atoms has been considered a single heavy atom, known as a coarse-grained bead. The 4-to-1, 3-to-1 and 2-to-1 mappings are considered regular (R), small (S), and tiny (T) beads for the underlying atoms. Table S2: Summary of the 48 simulation systems for lung surfactant monolayer models composed of DPPC-POPC-POPG-CHOL (60:20:10:10) in the absence (System I) and presence of mometasone furoate (MF) drug molecules (System II-a to II-e). Each System is simulated at a range of APL values from 0.47 nm2 to 0.61 nm2. At least two repeated runs were conducted for each of the simulations. In certain circumstances, the simulation has been run three times to obtain trustworthy outcomes [71,72,73,74,75,76].

Author Contributions

Z.I. developed the study concept and model, performed the simulations and formal data analysis, and drafted the original manuscript. K.B.K. participated in data analysis and edited the manuscript. A.H. and S.H. participated in data curation and edited the manuscript. S.C.S., T.T.N. and K.-Y.K. all critically revised and edited the manuscript. All authors gave final approval for publication and agreed to be held accountable for the work performed therein. All authors have read and agreed to the published version of the manuscript.

Funding

This research was jointly funded by Research Cell, Jashore University of Science and Technology (JUST), Jashore-7408, Bangladesh [grant number: 24-FoS-02] and University Grants Commission of Bangladesh [grant number: Physical Science-2022–2023 (14); Serial no.-07]. The APC was funded by Kwang-Yong Kim.

Acknowledgments

This research was accompanied by funding from Research Cell, Jashore University of Science and Technology (JUST), Jashore-7408, Bangladesh [Funding ID: 24-FoS-02] for the fiscal year 2024 to 2025 and the University Grants Commission of Bangladesh (Grant no. Physical Science-2022–2023 (14); Serial no.-07). The High-Performance Computing (HPC) Laboratory, Department of Mathematics, Jashore University of Science and Technology (JUST), Jashore-7408, Bangladesh, supported the computational facilities. Some simulations have also been simulated with the help of the High-Performance Computing Cluster (HPCC) Lab at the University of Technology Sydney (UTS), Sydney, Australia.

Conflicts of Interest

The authors declare that they have no known competing financial interests or personal relationships that could have appeared to influence the work reported in this paper.

References

  1. Chung, K.F.; Caramori, G.; Adcock, I.M. Inhaled corticosteroids as combination therapy with β-adrenergic agonists in airways disease: Present and future. Eur. J. Clin. Pharmacol. 2009, 65, 853–871. [Google Scholar] [CrossRef]
  2. Schäcke, H.; W.-Döcke, D.; Asadullah, K. Mechanisms involved in the side effects of glucocorticoids. Pharmacol. Ther. 2002, 96, 23–43. [Google Scholar] [CrossRef]
  3. Barnes, P.J. Inhaled glucocorticoids for asthma. N. Engl. J. Med. 1995, 332, 868–875. [Google Scholar] [CrossRef]
  4. Chrystyn, H. Methods to identify drug deposition in the lungs following inhalation. Br. J. Clin. Pharmacol. 2001, 51, 289–299. [Google Scholar] [CrossRef]
  5. Dani, C.; Corsini, I.; Burchielli, S.; Cangiamila, V.; Longini, M.; Paternostro, F.; Buonocore, G.; Rubaltelli, F.F. Natural surfactant combined with beclomethasone decreases oxidative lung injury in the preterm lamb. Pediatr. Pulmonol. 2009, 44, 1159–1167. [Google Scholar] [CrossRef]
  6. Raissy, H.H.; Kelly, H.W.; Harkins, M.; Szefler, S.J. Inhaled corticosteroids in lung diseases. Am. J. Respir. Crit. Care Med. 2013, 187, 798–803. [Google Scholar] [CrossRef] [PubMed]
  7. Pontremoli, C.; Barbero, N.; Viscardi, G.; Visentin, S. Insight into the interaction of inhaled corticosteroids with human serum albumin: A spectroscopic-based study. J. Pharm. Anal. 2018, 8, 37–44. [Google Scholar] [CrossRef]
  8. Heffler, E.; Madeira, L.N.G.; Ferrando, M.; Puggioni, F.; Racca, F.; Malvezzi, L.; Passalacqua, G.; Canonica, G.W. Inhaled corticosteroids safety and adverse effects in patients with asthma. J. Allergy Clin. Immunol. Pract. 2018, 6, 776–781. [Google Scholar] [CrossRef] [PubMed]
  9. Ye, Q.; He, X.-O.; D’Urzo, A. A review on the safety and efficacy of inhaled corticosteroids in the management of asthma. Pulm. Ther. 2017, 3, 1–18. [Google Scholar] [CrossRef]
  10. Kelly, H.W. Comparison of inhaled corticosteroids: An update. Ann. Pharmacother. 2009, 43, 519–527. [Google Scholar] [CrossRef]
  11. Casale, T.B.; Corbridge, T.; Germain, G.; Laliberté, F.; MacKnight, S.D.; Boudreau, J.; Duh, M.S.; Deb, A. Real-world association between systemic corticosteroid exposure and complications in US patients with severe asthma. Allergy Asthma Clin. Immunol. 2024, 20, 1–13. [Google Scholar] [CrossRef]
  12. Gaucher, L.; Adda, L.; Séjourné, A.; Joachim, C.; Chaby, G.; Poulet, C.; Liabeuf, S.; Gras-Champel, V.; Masmoudi, K.; Moreira, A. Impact of the corticosteroid indication and administration route on overall survival and the tumor response after immune checkpoint inhibitor initiation. Ther. Adv. Med. Oncol. 2021, 13, 1–18. [Google Scholar] [CrossRef]
  13. Georgitis, J.W. The 1997 asthma management guidelines and therapeutic issues relating to the treatment of asthma. Chest 1999, 115, 210–217. [Google Scholar] [CrossRef]
  14. Barnes, P. Effect of corticosteroids on airway hyperresponsiveness. Am. Rev. Respir. Dis. 1990, 141, 70–76. [Google Scholar]
  15. Derendorf, H. Pharmacokinetic and pharmacodynamic properties of inhaled corticosteroids in relation to efficacy and safety. Respir. Med. 1997, 91, 22–28. [Google Scholar] [CrossRef] [PubMed]
  16. Wolthers, O.D.; Honour, J.W.; Path, F. Measures of hypothalamic-pituitary-adrenal function in patients with asthma treated with inhaled glucocorticoids: Clinical and research implications. J. Asthma 1999, 36, 477–486. [Google Scholar] [CrossRef] [PubMed]
  17. Parrow, A.; Larsson, P.; Augustijns, P.; Bergström, C.A. Molecular dynamics simulations on interindividual variability of intestinal fluids: Impact on drug solubilization. Mol. Pharm. 2020, 17, 3837–3844. [Google Scholar] [CrossRef]
  18. Ortiz-Collazos, S.; Estrada-López, E.D.; Pedreira, A.A.; Picciani, P.H.; Oliveira, O.N., Jr.; Pimentel, A.S. Interaction of levofloxacin with lung surfactant at the air-water interface. Colloids Surf. B Biointerfaces 2017, 158, 689–696. [Google Scholar] [CrossRef]
  19. Ortiz-Collazos, S.; Picciani, P.H.; Oliveira, O.N., Jr.; Pimentel, A.S.; Edler, K.J. Influence of levofloxacin and clarithromycin on the structure of DPPC monolayers. Biochim. Et Biophys. Acta (BBA)-Biomembr. 2019, 1861, 182994. [Google Scholar] [CrossRef]
  20. Ingólfsson, H.I.; Lopez, C.A.; Uusitalo, J.J.; de Jong, D.H.; Gopal, S.M.; Periole, X.; Marrink, S.J. The power of coarse graining in biomolecular simulations. Wiley Interdiscip. Rev. Comput. Mol. Sci. 2014, 4, 225–248. [Google Scholar] [CrossRef]
  21. Saunders, M.G.; Voth, G.A. Coarse-graining methods for computational biology. Annu. Rev. Biophys. 2013, 42, 73–93. [Google Scholar] [CrossRef]
  22. Noid, W.G. Perspective: Coarse-grained models for biomolecular systems. J. Chem. Phys. 2013, 139, 090901. [Google Scholar] [CrossRef]
  23. Voth, G.A. Coarse-Graining of Condensed Phase and Biomolecular Systems; CRC Press: Boca Raton, FL, USA, 2008. [Google Scholar]
  24. Souza, P.C.T.; Alessandri, R.; Barnoud, J.; Thallmair, S.; Faustino, I.; Grünewald, F.; Patmanidis, I.; Abdizadeh, H.; Bruininks, B.M.H.; Wassenaar, T.A. Martini 3: A general purpose force field for coarse-grained molecular dynamics. Nat. Methods 2021, 18, 382–388. [Google Scholar] [CrossRef]
  25. Marrink, S.J.; Tieleman, D.P. Perspective on the Martini model. Chem. Soc. Rev. 2013, 42, 6801–6822. [Google Scholar] [CrossRef]
  26. Alessandri, R.; Grünewald, F.; Marrink, S.J. The martini model in materials science. Adv. Mater. 2021, 33, 2008635. [Google Scholar] [CrossRef] [PubMed]
  27. Alessandri, R.; Souza, P.C.T.; Thallmair, S.; Melo, M.N.; de Vries, A.H.; Marrink, S.J. Pitfalls of the Martini Model. J. Chem. Theory Comput. 2019, 15, 5448–5460. [Google Scholar] [CrossRef] [PubMed]
  28. Melo, M.; Ingólfsson, H.I.; Marrink, S.J. Parameters for Martini sterols and hopanoids based on a virtual-site description. J. Chem. Phys. 2015, 143, 243152. [Google Scholar] [CrossRef]
  29. Schmalhorst, P.S.; Deluweit, F.; Scherrers, R.; Heisenberg, C.P.; Sikora, M. Overcoming the Limitations of the MARTINI Force Field in Simulations of Polysaccharides. J. Chem. Theory Comput. 2017, 13, 5039–5053. [Google Scholar] [CrossRef] [PubMed]
  30. Lee, H.; de Vries, A.H.; Marrink, S.-J.; Pastor, R.W. A coarse-grained model for polyethylene oxide and polyethylene glycol: Conformation and hydrodynamics. J. Phys. Chem. B 2009, 113, 13186–13194. [Google Scholar] [CrossRef]
  31. Uusitalo, J.J.; Ingólfsson, H.I.; Akhshi, P.; Tieleman, D.P.; Marrink, S.J. Martini coarse-grained force field: Extension to DNA. J. Chem. Theory Comput. 2015, 11, 3932–3945. [Google Scholar] [CrossRef]
  32. Alessandri, R.; Barnoud, J.; Gertsen, A.S.; Patmanidis, I.; De Vries, A.H.; Souza, P.C.; Marrink, S.J. Martini 3 coarse-grained force field: Small molecules. Adv. Theory Simul. 2022, 5, 2100391. [Google Scholar] [CrossRef]
  33. Islam, M.Z.; Hossain, S.I.; Deplazes, E.; Saha, S.C. The steroid mometasone alters protein containing lung surfactant monolayers in a concentration-dependent manner. J. Mol. Graph. Model. 2022, 111, 108084. [Google Scholar] [CrossRef]
  34. Marrink, S.J.; Risselada, H.J.; Yefimov, S.; Tieleman, D.P.; De Vries, A.H. The MARTINI force field: Coarse grained model for biomolecular simulations. J. Phys. Chem. B 2007, 111, 7812–7824. [Google Scholar] [CrossRef]
  35. Kumar, S.; Rosenberg, J.M.; Bouzida, D.; Swendsen, R.H.; Kollman, P.A. The weighted histogram analysis method for free-energy calculations on biomolecules. I. The method. J. Comput. Chem. 1992, 13, 1011–1021. [Google Scholar] [CrossRef]
  36. Souza, L.M.; Souza, F.R.; Reynaud, F.; Pimentel, A.S. Tuning the hydrophobicity of a coarse grained model of 1, 2-dipalmitoyl-sn-glycero-3-phosphatidylcholine using the experimental octanol-water partition coefficient. J. Mol. Liq. 2020, 319, 114132. [Google Scholar] [CrossRef]
  37. Taddese, T.; Carbone, P. Effect of chain length on the partition properties of poly (ethylene oxide): Comparison between MARTINI coarse-grained and atomistic models. J. Phys. Chem. B 2017, 121, 1601–1609. [Google Scholar] [CrossRef]
  38. DeBolt, S.E.; Kollman, P.A. Investigation of structure, dynamics, and solvation in 1-octanol and its water-saturated solution: Molecular dynamics and free-energy perturbation studies. J. Am. Chem. Soc. 1995, 117, 5316–5340. [Google Scholar] [CrossRef]
  39. Jaidhan, B.; Rao, P.S.; Apparao, A. Energy minimization and conformation analysis of molecules using steepest descent method. Int. J. Comput. Sci. Inf. Technol. 2014, 5, 3525–3528. [Google Scholar]
  40. Berendsen, H.J.; Postma, J.V.; van Gunsteren, W.F.; DiNola, A.; Haak, J. Molecular dynamics with coupling to an external bath. J. Chem. Phys. 1984, 81, 3684–3690. [Google Scholar] [CrossRef]
  41. Bussi, G.; Donadio, D.; Parrinello, M. Canonical sampling through velocity rescaling. J. Chem. Phys. 2007, 126, 014101. [Google Scholar] [CrossRef] [PubMed]
  42. Parrinello, M.; Rahman, A. Polymorphic transitions in single crystals: A new molecular dynamics method. J. Appl. Phys. 1981, 52, 7182–7190. [Google Scholar] [CrossRef]
  43. Autilio, C.; Pérez-Gil, J. Understanding the principle biophysics concepts of pulmonary surfactant in health and disease. Arch. Dis. Child.-Fetal Neonatal Ed. 2019, 104, F443–F451. [Google Scholar] [CrossRef]
  44. Hossain, S.I.; Islam, M.Z.; Saha, S.C.; Deplazes, E. Drug Meets Monolayer: Understanding the Interactions of Sterol Drugs with Models of the Lung Surfactant Monolayer Using Molecular Dynamics Simulations. In Membrane Lipids: Methods and Protocols; Springer: New York, NY, USA, 2022; Volume 2402, pp. 103–121. [Google Scholar]
  45. Abraham, M.J.; Murtola, T.; Schulz, R.; Páll, S.; Smith, J.C.; Hess, B.; Lindahl, E. GROMACS: High performance molecular simulations through multi-level parallelism from laptops to supercomputers. SoftwareX 2015, 1, 19–25. [Google Scholar] [CrossRef]
  46. Cuendet, M.A.; van Gunsteren, W.F. On the calculation of velocity-dependent properties in molecular dynamics simulations using the leapfrog integration algorithm. J. Chem. Phys. 2007, 127, 184102. [Google Scholar] [CrossRef] [PubMed]
  47. Hub, J.S.; De Groot, B.L.; Van Der Spoel, D. g_wham-A Free Weighted Histogram Analysis Implementation Including Robust Error and Autocorrelation Estimates. J. Chem. Theory Comput. 2010, 6, 3713–3720. [Google Scholar] [CrossRef]
  48. Efron, B. Bootstrap methods: Another Look at the Jackknife. In Breakthroughs in Statistics, Springer Series in Statistics; Springer: New York, NY, USA, 1992; Volume 2, pp. 569–593. [Google Scholar]
  49. Islam, M.Z.; Hossain, S.I.; Deplazes, E.; Luo, Z.; Saha, S.C. The concentration-dependent effect of hydrocortisone on the structure of model lung surfactant monolayer by using an in silico approach. RSC Adv. 2022, 12, 33313–33328. [Google Scholar] [CrossRef]
  50. Hansch, C.; Leo, A. Exploring QSAR. Fundamentals and applications in chemistry and biology. ACS Professional Reference Book. Am. Chem. Soc. 1995, 1, 557–1037. [Google Scholar]
  51. Fornasier, F.; Souza, L.M.; Souza, F.R.; Reynaud, F.; Pimentel, A.S. Lipophilicity of Coarse-Grained Cholesterol Models. J. Chem. Inf. Model. 2020, 60, 569–577. [Google Scholar] [CrossRef] [PubMed]
  52. Espinosa, J.R.; Wand, C.R.; Vega, C.; Sanz, E.; Frenkel, D. Calculation of the water-octanol partition coefficient of cholesterol for SPC, TIP3P, and TIP4P water. J. Chem. Phys. 2018, 149, 224501. [Google Scholar] [CrossRef]
  53. Baluja, S.; Chavda, K.V. Prediction of solubility parameters of cholesterol in some organic solvents. Int. J. Pharm. Chem. Biol. Sci. 2015, 5. [Google Scholar]
  54. Wishart, D. DrugBank. 2006. Available online: https://go.drugbank.com/drugs/DB00764 (accessed on 15 March 2024).
  55. Wishart, D. DrugBank. 2006. Available online: https://go.drugbank.com/drugs/DB14512 (accessed on 15 March 2024).
  56. Tetko, I.V.; Gasteiger, J.; Todeschini, R.; Mauri, A.; Livingstone, D.; Ertl, P.; Palyulin, V.A.; Radchenko, E.V.; Zefirov, N.S.; Makarenko, A.S. Virtual computational chemistry laboratory–design and description. J. Comput. Aided Mol. Des. 2005, 19, 453–463. [Google Scholar] [CrossRef] [PubMed]
  57. Chem Axon and Chemicalize. Available online: https://chemaxon.com/chemicalize (accessed on 22 April 2021).
  58. Estrada-López, E.D.; Murce, E.; Franca, M.P.; Pimentel, A.S. Prednisolone adsorption on lung surfactant models: Insights on the formation of nanoaggregates, monolayer collapse and prednisolone spreading. RSC Adv. 2017, 7, 5272–5281. [Google Scholar] [CrossRef]
  59. Daily, M.D.; Olsen, B.N.; Schlesinger, P.H.; Ory, D.S.; Baker, N.A. Improved coarse-grained modeling of cholesterol-containing lipid bilayers. J. Chem. Theory Comput. 2014, 10, 2137–2150. [Google Scholar] [CrossRef]
  60. Cleary, G.W.; Zatz, J.L. Interaction of hydrocortisone with model membranes containing phospholipid and cholesterol. J. Pharm. Sci. 1977, 66, 975–980. [Google Scholar] [CrossRef]
  61. Saad, S.M.; Neumann, A.W.; Acosta, E.J. A dynamic compression–relaxation model for lung surfactants. Colloids Surf. A Physicochem. Eng. Asp. 2010, 354, 34–44. [Google Scholar] [CrossRef]
  62. Wu, F.; Jin, X.; Guan, Z.; Lin, J.; Cai, C.; Wang, L.; Li, Y.; Lin, S.; Xu, P.; Gao, L. Membrane Nanopores Induced by Nanotoroids via an Insertion and Pore-Forming Pathway. Nano Lett. 2021, 21, 8545–8553. [Google Scholar] [CrossRef]
  63. Islam, M.Z.; Hossain, S.I.; Deplazes, E.; Saha, S.C. Concentration-dependent cortisone adsorption and interaction with model lung surfactant monolayer. Mol. Simul. 2022, 48, 1627–1638. [Google Scholar] [CrossRef]
  64. Islam, M.Z.; Krajewska, M.; Hossain, S.I.; Prochaska, K.; Anwar, A.; Deplazes, E.; Saha, S.C. Concentration-Dependent Effect of the Steroid Drug Prednisolone on a Lung Surfactant Monolayer. Langmuir 2022, 38, 4188–4199. [Google Scholar] [CrossRef] [PubMed]
  65. Majewski, J.; Kuhl, T.L.; Kjaer, K.; Gerstenberg, M.C.; Als-Nielsen, J.; Israelachvili, J.N.; Smith, G.S. X-ray Synchrotron Study of Packing and Protrusions of Polymer−Lipid Monolayers at the Air−Water Interface. J. Am. Chem. Soc. 1998, 120, 1469–1473. [Google Scholar] [CrossRef]
  66. Carotenuto, A.R.; Nguyen, N.; Cao, K.; Gaffney, A.; Waring, A.J.; Lee, K.Y.C.; Owen, D.; Fraldi, M.; Deseri, L.; Pocivavsek, L. Multiscale geometry and mechanics of lipid monolayer collapse. Curr. Top. Membr. 2021, 87, 1–45. [Google Scholar] [PubMed]
  67. Gopal, A.; Lee, K.Y.C. Morphology and collapse transitions in binary phospholipid monolayers. J. Phys. Chem. B 2001, 105, 10348–10354. [Google Scholar] [CrossRef]
  68. Baoukina, S.; Monticelli, L.; Marrink, S.J.; Tieleman, D.P. Pressure–Area Isotherm of a Lipid Monolayer from Molecular Dynamics Simulations. Langmuir 2007, 23, 12617–12623. [Google Scholar] [CrossRef]
  69. Baoukina, S.; Monticelli, L.; Risselada, H.J.; Marrink, S.J.; Tieleman, D.P. The molecular mechanism of lipid monolayer collapse. Proc. Natl. Acad. Sci. 2008, 105, 10803–10808. [Google Scholar] [CrossRef]
  70. Souza, F.; Souza, L.; Pimentel, A. Permeation of beta-defensin-3 encapsulated with polyethylene glycol in lung surfactant models at air-water interface. Colloids Surf. B Biointerfaces 2019, 182, 110357. [Google Scholar] [CrossRef] [PubMed]
  71. Labiris, N.R.; Dolovich, M.B. Pulmonary drug delivery. Part I: Physiological factors affecting therapeutic effectiveness of aerosolized medications. Br. J. Clin. Pharmacol. 2003, 56, 588–599. [Google Scholar] [CrossRef] [PubMed]
  72. Fadl, A.; Wang, J.; Zhang, Z. Metered-dose inhaler efficiency enhancement: A case study and novel design. Inhal. Toxicol. 2010, 22, 601–609. [Google Scholar] [CrossRef] [PubMed]
  73. Dolovich, M. New propellant-free technologies under investigation. J. Aerosol. Med. Pulm. Drug Deliv. 1999, 12, 9–17. [Google Scholar] [CrossRef] [PubMed]
  74. Ochs, M.; Nyengaard, J.R.; Jung, A.; Knudsen, L.; Voigt, M.; Wahlers, T.; Richter, J.; Gundersen, H.J.G. The number of alveoli in the human lung. Am. J. Respir. Crit. Care Med. 2004, 169, 120–124. [Google Scholar] [CrossRef]
  75. Hyde, D.; Tyler, N.; Putney, L.; Singh, P.; Gundersen, H. Total number and mean size of alveoli in mammalian lung estimated using fractionator sampling and unbiased estimates of the Euler characteristic of alveolar openings. Anat. Rec. Part A Discov. Mol. Cell. Evol. Biol. 2004, 277, 216–226. [Google Scholar] [CrossRef]
  76. Hess, B. Determining the shear viscosity of model liquids from molecular dynamics simulations. J. Chem. Phys. 2002, 116, 209–217. [Google Scholar] [CrossRef]
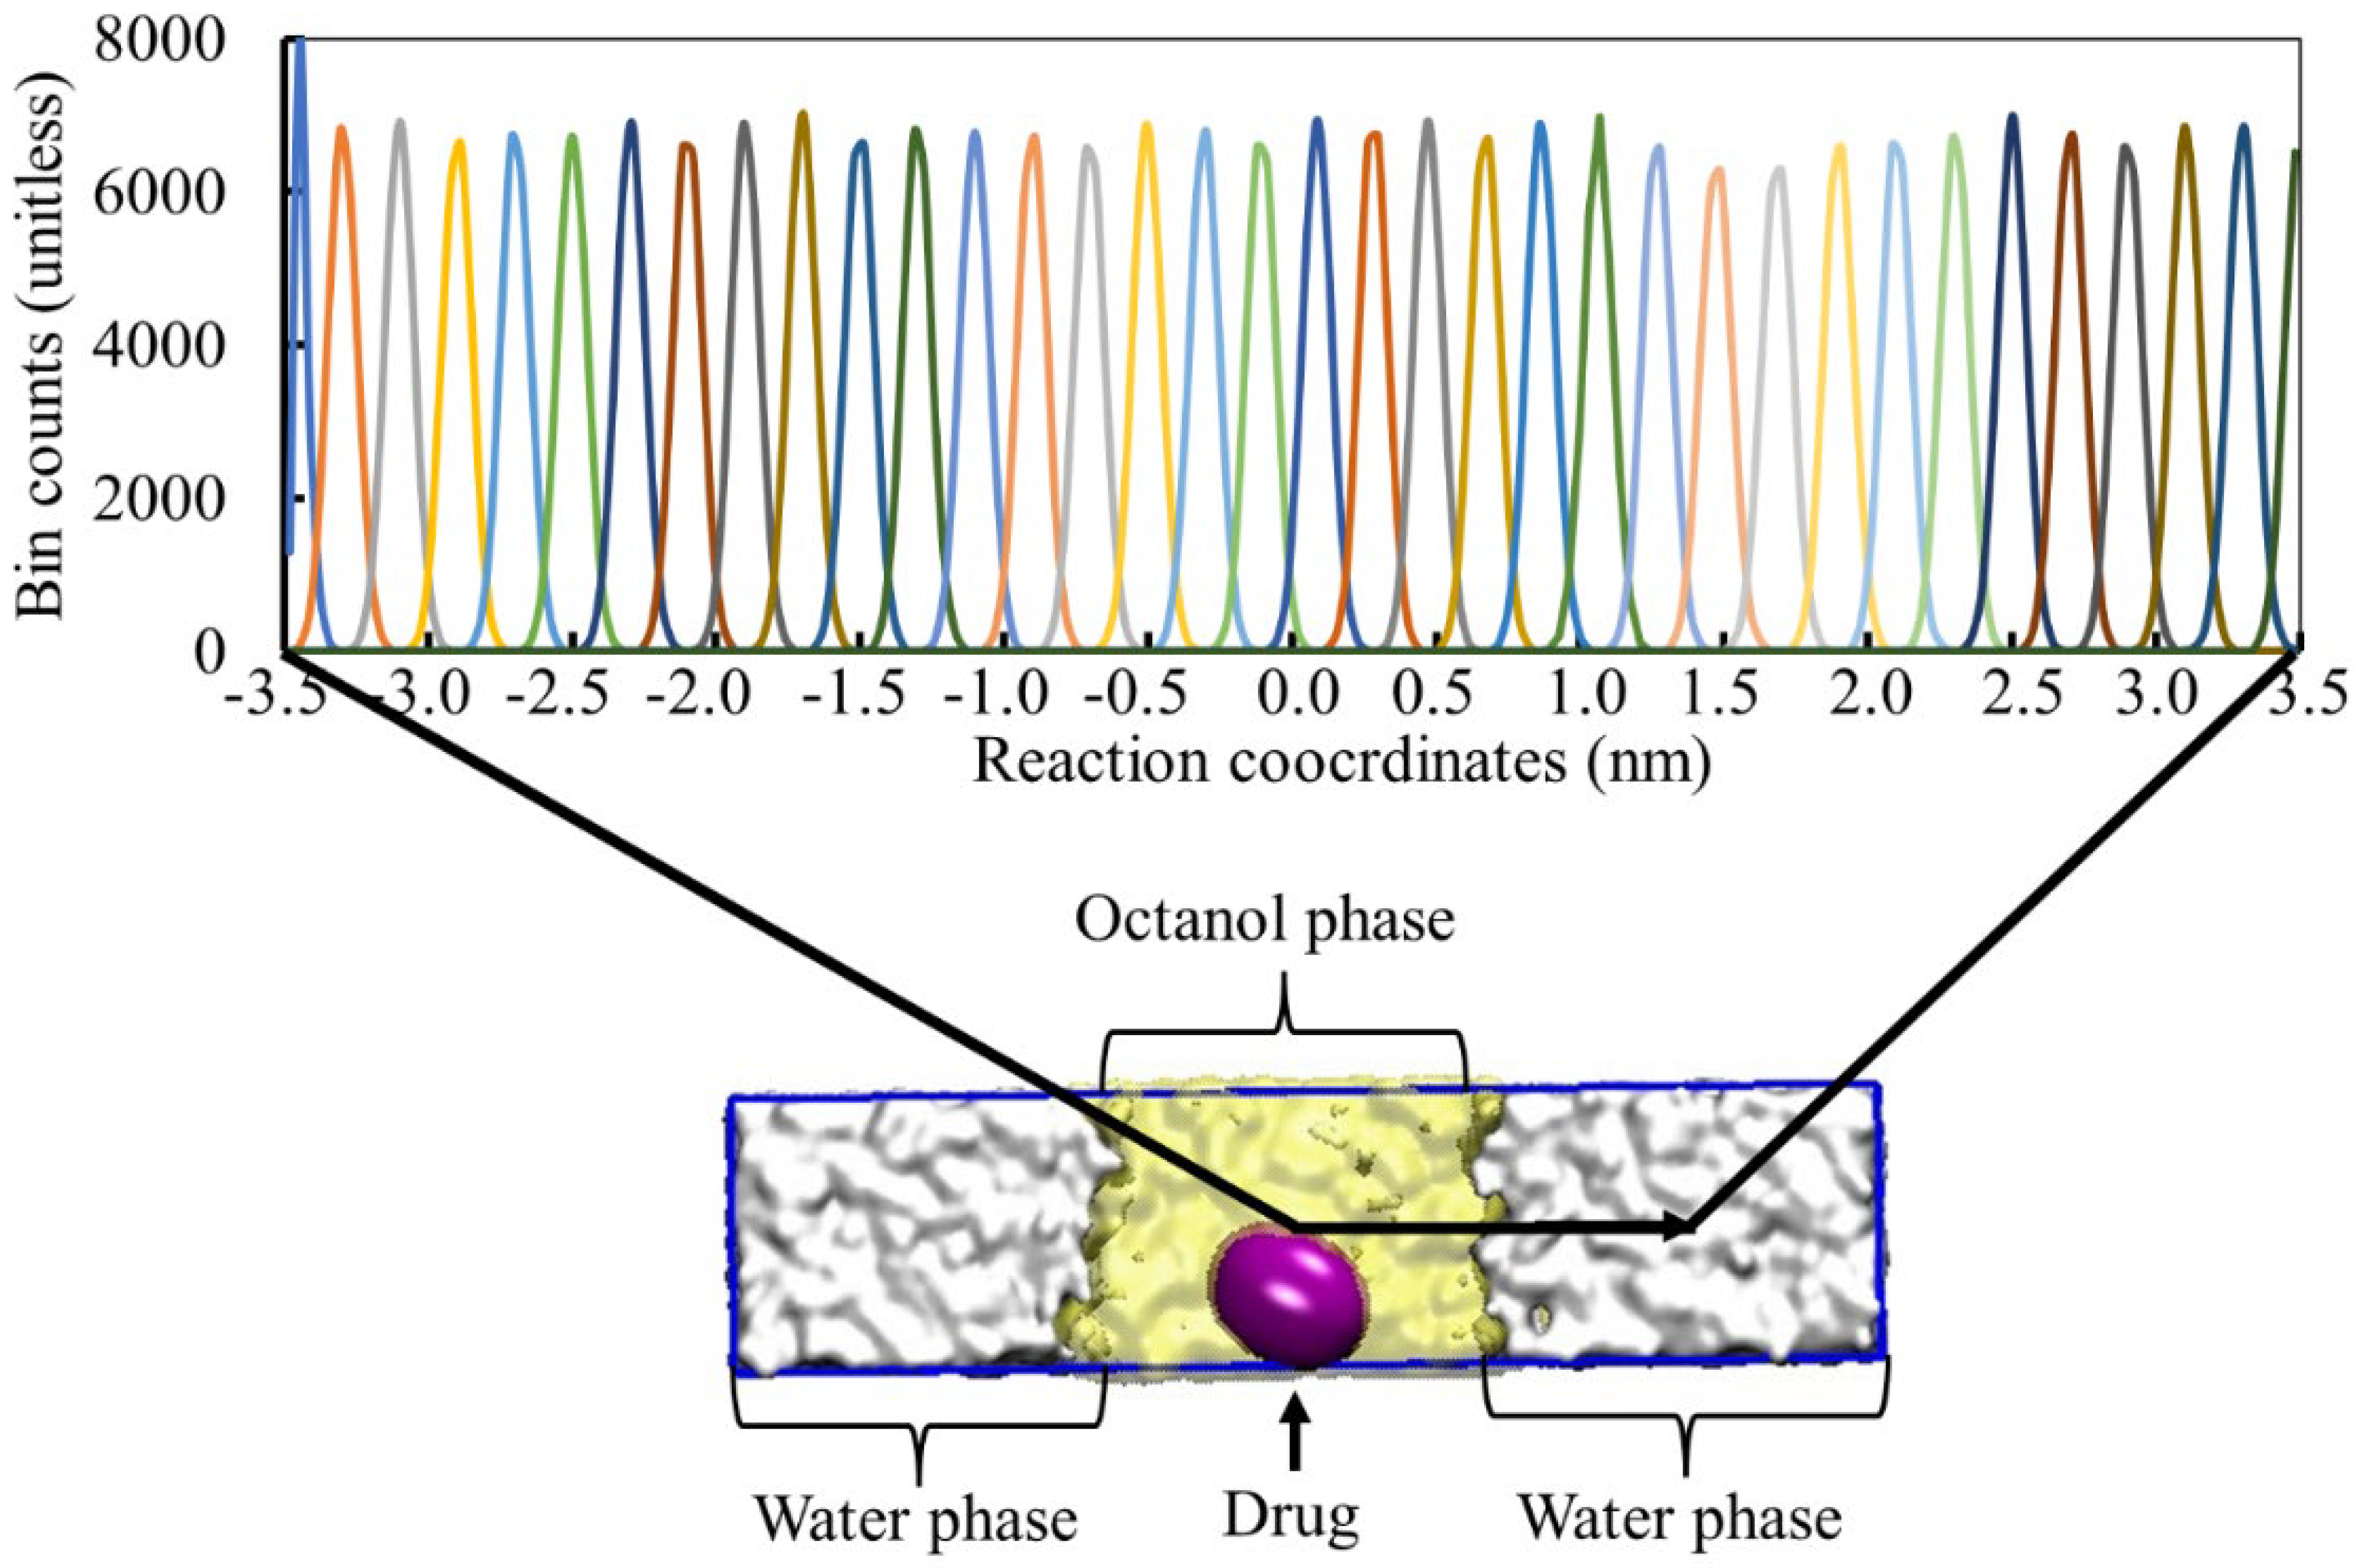
Figure 1. The arrangement of the umbrella sampling simulation of the drug molecule (purple) into the octanol–water biphasic model to measure the PMF of mometasone furoate. The WHAM technique was used to examine the intersection between umbrellas along the z-axis up to 7.0 nm.
Micro 05 00044 g001
Figure 2. Schematic illustration of the simulation system and its components (coarse-grained structure); (a) lung surfactant monolayer system, (b) DPPC, (c) POPC, (d) POPG, (e) cholesterol, and (f) mometasone furoate.
Micro 05 00044 g002
Figure 3. Optimization of coarse-grained bonded parameters for various bond length distributions between different coarse-grained beads. (a) Beads: 1B—3B, (b) beads: 1B—4B, (c) beads: 3B—4B, (d) beads: 3B—5B, (e) beads: 4B—5B, (f) beads: 5B—7B, (g) beads: 7B—3B, (h) beads: 7B—4B. The “black” colour indicates atomistic simulations, and the “red” colour refers to coarse-grained simulations.
Micro 05 00044 g003
Figure 4. The PMF profile of mometasone furoate from octanol to the water phase. (a) PMF curves at various simulation times to test the convergence of the results. (b) The final conversed free energy curve of the drug molecule. The bootstrapping method [48] has been used to calculate the fluctuation errors.
Micro 05 00044 g004
Figure 5. The comparison of the logP value of the corticosteroid drug mometasone furoate and other corticosteroid drugs calculated from different scales (experiments [50,51,52,53,54,55], PubChem reference AlogPS [56] and ChemAxon [57] and umbrella sampling simulation, US [33,34,49,58,59]).
Micro 05 00044 g005
Figure 6. The impact of the drug on the compressibility of the monolayer area from the simulation of the system to isolate the breathing dynamics during the time from inhalation to exhalation breathing conditions. The data were estimated over the last 1 µs of the 2 µs simulation. The error bar refers to the standard deviations of the surface tension data across the frames.
Micro 05 00044 g006
Figure 7. Snapshots of monolayer surface microstructure morphology at two different APL values, (a) 0.47 nm2 (condensed state) and (b) APL = 0.61 nm2 (expanded state), in the presence of 8.02% w/w drug concentration. Components shown are DPPC (green), POPC (blue), POPG (orange), CHOL (red), lipid head group (yellow), and drug (purple).
Micro 05 00044 g007
Figure 8. Density profile of the monolayer components along the z-axis of the drug–lipid system at drug concentration of 1.42% w/w for different mean molecular areas. (a) Phospholipid density (DPPC, POPC, POPG and CHOL), (b) water density.
Micro 05 00044 g008
Figure 9. (a) Cluster size analysis, (b) microstructure morphology analysis by density map calculation at APL = 0.47 nm2, and (c) microstructure morphology analysis by density map analysis at APL = 0.61 nm2 for various drug concentrations.
Micro 05 00044 g009
Table 1. The CG bead mapping of mometasone furoate is based on the chemical structure of the drug molecules. The 4-to-1, 3-to-1, and 2-to-1 mappings are considered regular (R), small (S), and tiny (T) beads for the underlying atoms.
Bead NameMolecule NameBead TypeGroup Moiety
1BRO1SNaCyclic ketone
2BR1SC4Cyclic diene
3BRCL1SC3Cyclic chloro-alkane
4BROHSP1Cyclic alcohol
5BR2SC2Cyclic alkane
6BR3SC2Cyclic alkane
7BRO2SNaCyclic ketone
8BRCL2C3Aliphatic chloride
9BROONaAliphatic acetic acid
10BRO3SNapropanol
Disclaimer/Publisher’s Note: The statements, opinions and data contained in all publications are solely those of the individual author(s) and contributor(s) and not of MDPI and/or the editor(s). MDPI and/or the editor(s) disclaim responsibility for any injury to people or property resulting from any ideas, methods, instructions or products referred to in the content.