
Association Between Adherence Levels to the EAT-Lancet Diet in Habitual Intake and Selected Gut Bacteria in a Mexican Subpopulation

 , , ,
, , , 
Abstract
1. Introduction
2. Materials and Methods
2.1. Study Design and Participants
2.2. Socioeconomic and Demographical Characteristics of the Sample
2.3. Anthropometric and Body Composition Evaluation
2.4. Dietary Intake and Adherence to the EAT-Lancet Diet
2.5. Physical Activity Assessment and Classification
- Mild aerobic activities: Activities such as walking without elevating the heart rate beyond 50% of maximum capacity.
- Moderate to intense aerobic activities: Activities such as brisk walking, jogging, running, swimming, aerobics, and cycling, which elevate the heart rate to 50–90% of maximum capacity.
- Anaerobic activities: Weightlifting sessions lasting at least 20 min per day.
- Low activity: Participants who did not meet the criteria for moderate or high levels of physical activity.
- Moderate activity: Participants who met at least one of the following criteria:
- Vigorous-intensity activity on 3 or more days for at least 20 min per day.
- Moderate-intensity activity or walking on 5 or more days for at least 30 min per day.
- A combination of walking, moderate-intensity, or vigorous-intensity activities on 5 or more days, achieving a minimum of 600 MET-minutes/week.
- High activity: Participants who met one of the following criteria:
- Vigorous-intensity activity on at least 3 days, accumulating at least 1500 MET-minutes/week.
- A combination of walking, moderate-intensity, or vigorous-intensity activities on seven or more days, achieving a minimum of 3000 MET-minutes/week.
2.6. Clinical and Metabolic Biomarkers
2.7. Bacteria Identification
2.7.1. Stool Collection
2.7.2. DNA Extraction from Faeces
2.7.3. Identification of Gut Bacteria
2.7.4. Relative Abundance Quantification
- The factor of 2 reflects the theoretical assumption that each PCR cycle results in an exponential doubling of the DNA present in the original sample.
- ∆Ct = The delta symbol (∆) represents the difference between the Ct values of the specific bacterium and the universal reference primer.

| Bacteria | Primer | Target Gene | Number of Bases | Sequence | Amplicon Size | Reference |
|---|---|---|---|---|---|---|
| Firmicutes (Bacillota) | Forward | 16S rRNA | 21 | 5′-TGAAACTCAAAGGAATTGACG-3 | 200 | [39,42] |
| Reverse | 17 | 5′-ACCATGCACCACCTGTC-3′ | ||||
| Bacteroidota (Bacteroidetes) | Forward | 16S rRNA | 20 | 5′-CAAACAGGATTAGATACCCT-3′ | 240 | [39,42] |
| Reverse | 19 | 5′-GGTAAGGTTCCTCGCGTAT-3′ | ||||
| Lactobacillus | Forward | 16S rRNA | 19 | 5′-AGCAGTAGGGAATCTTCCA-3′ | 341 | [14,39] |
| Reverse | 17 | 5′-CACCGCTACACATGGAG-3′ | ||||
| Bifidobacterium | Forward | 16S rRNA | 18 | 5′-TCGCGTCCGGTGTGAAAG-3′ | 243 | [14,38] |
| Reverse | 17 | 5′-CCACATCCAGCATCCAC-3′ | ||||
| Akkermansia muciniphila | Forward | 16S rRNA | 20 | 5′-CAGCACGTGAAGGTGGGGAC-3′ | 329 | [38,43] |
| Reverse | 20 | 5′-CCTTGCGGTTGGCTTCAGAT-3′ | ||||
| Faecalibacterium prausnitzii | Forward | 16S rRNA | 19 | 5′-GGAGGAAGAAGGTCTTCGG-3′ | 248 | [16,39] |
| Reverse | 21 | 5′-AATTCCGCCTACCTCTGCACT-3′ | ||||
| Prevotella copri | Forward | 16S rRNA | 20 | 5′-CCGGACTCCTGCCCCTGCAA-3′ | 106 | [17,38] |
| Reverse | 20 | 5′-GTTGCGCCAGGCACTGCGAT-3′ | ||||
| Clostridium Coccoides | Forward | 16S rRNA | 19 | 5′-CGGTACCTGACTAAGAAGC-3′ | 429 | [18,38] |
| Reverse | 19 | 5′-AGTTTCATTCTTGCGAACG-3′ | ||||
| Streptococcus thermophilus | Forward | 16S rRNA | 22 | 5′-TTATTTGAAAGGGGCAATTGCT-3′ | 281 | [20,38] |
| Reverse | 21 | 5′-GTGAACTTTCCACTCTCACAC-3′ | ||||
| Bilophila wadsworthia | Forward | tpa | 26 | 5′-CAACGTCCCCACCATCAAGTTCTCTG-3′ | 1001 | [21,39] |
| Reverse | 26 | 5′-TGAATTCGCGGAAGGAGCGAGAGGTC-3′ | ||||
| Universal | Forward | 16S rRNA | 20 | 5′-AAACTCAAAGGAATTGACGG-3′ | 180 | [42,44] |
| Reverse | 18 | 5′-CTCACAACACGAGCTGAC-3′ |
2.8. Statistical Analysis
2.9. Ethics Considerations
3. Results
3.1. Socioeconomic Characteristics of the Sample According to Adherence Level
3.2. Anthropometric, Clinical, Biochemical, and Body Composition Data of the Sample According to Their Adherence Level to the EAT-Lancet Diet
3.3. Nutrient Intake According to Adherence Level to the EAT-Lancet Diet
3.4. Dietary Intake of the EAT-Lancet Diet Groups and Other Food Groups
3.5. Gut Microbiota of the Total Subsample
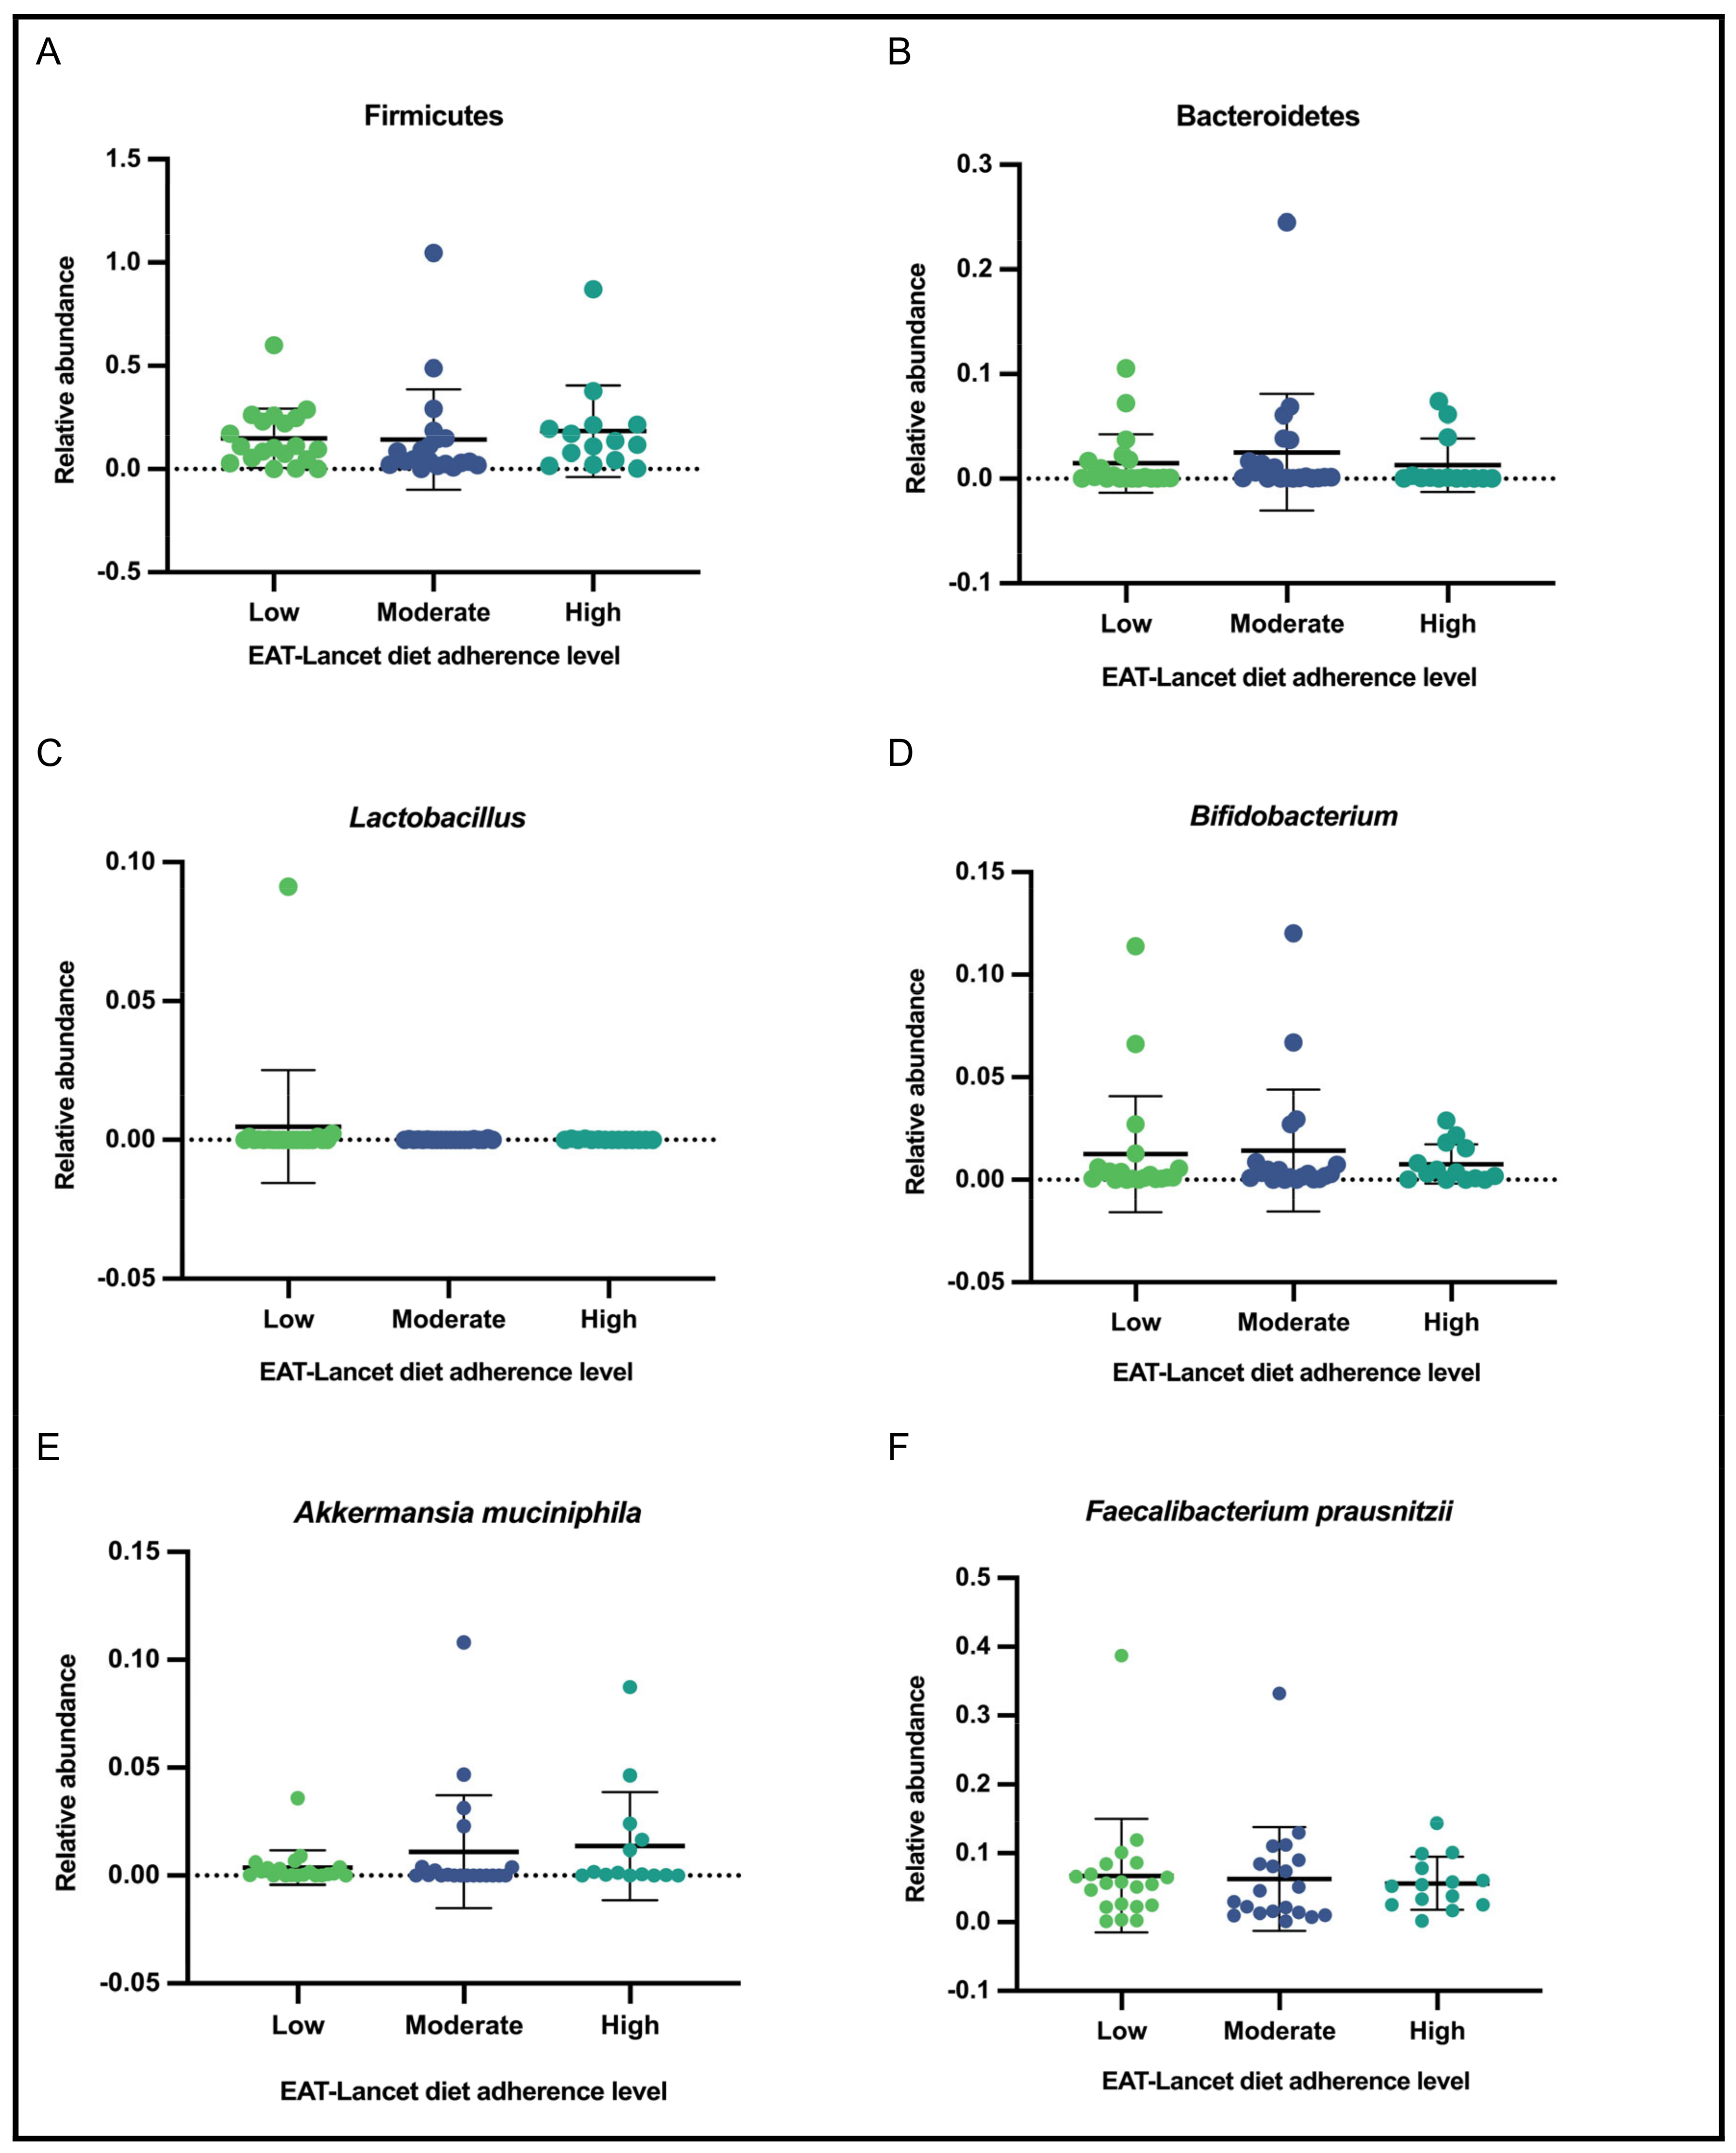
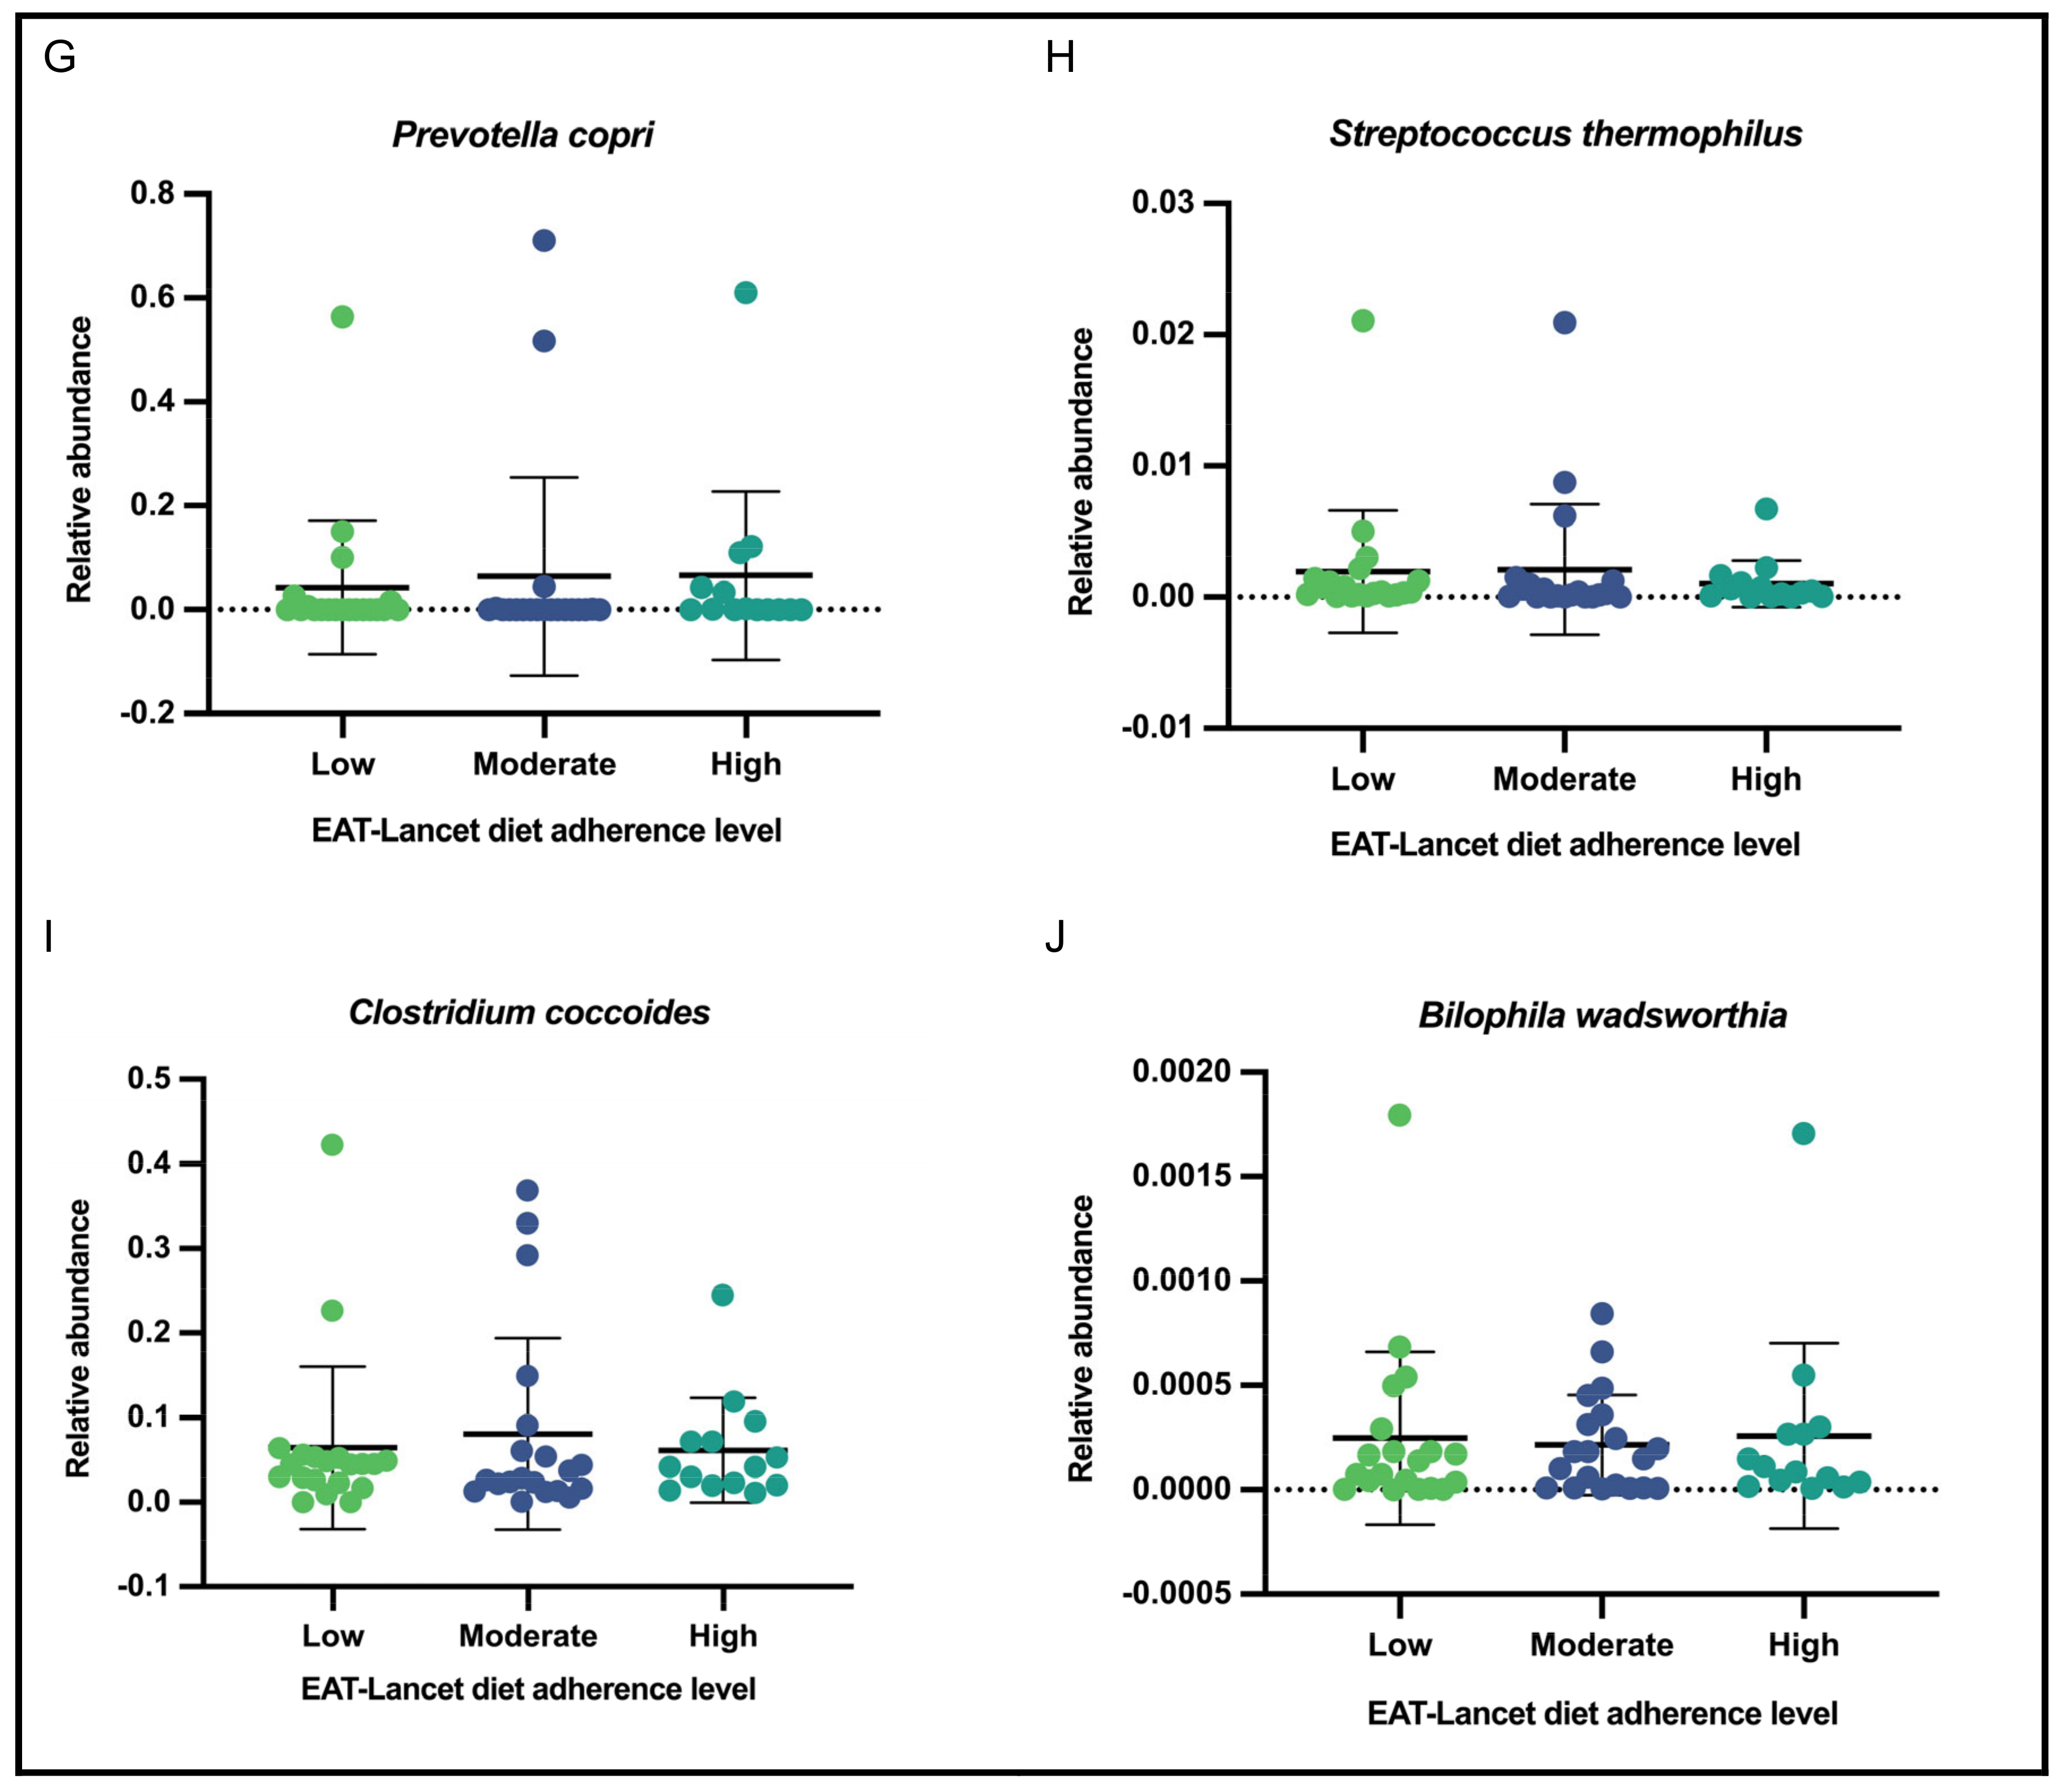
3.6. Relative Abundance of Selected Gut Bacteria According to Adherence Level to the EAT-Lancet Diet
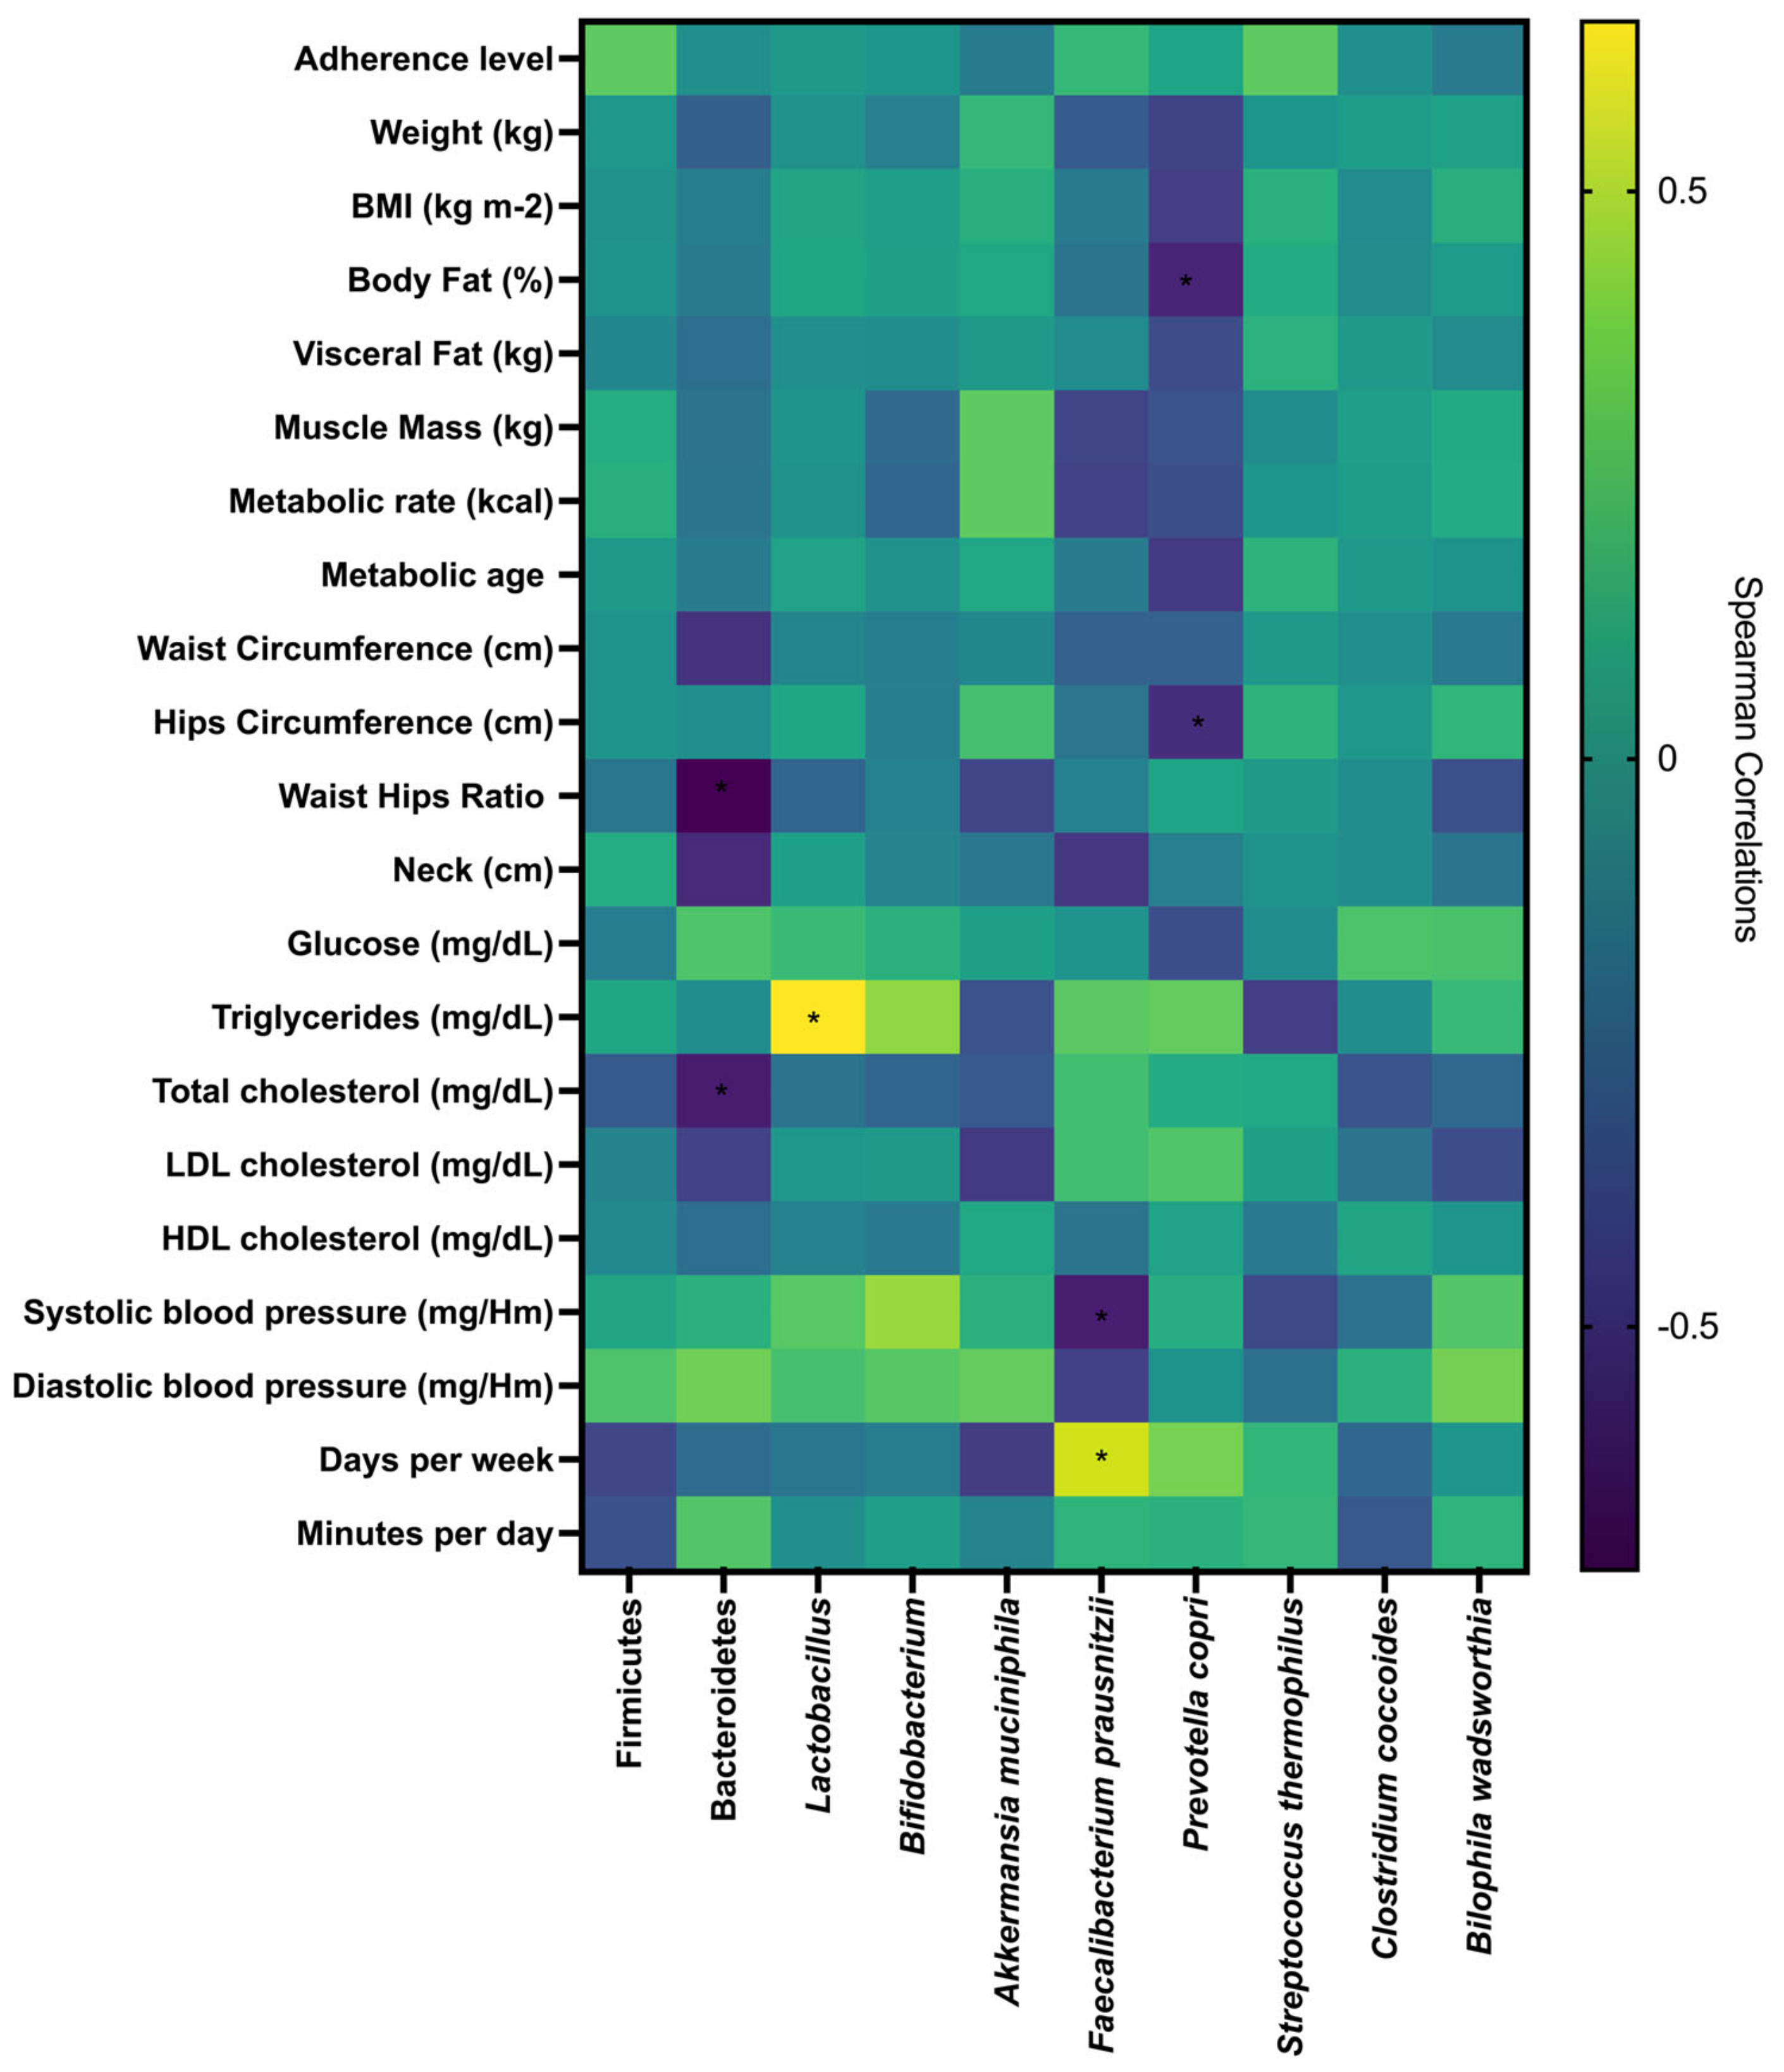
3.7. Correlations Between Gut Microbiota, Adherence Level to the EAT-Lancet Diet, Metabolic, Anthropometric, Body Composition, Clinical Parameters, and Physical Activity
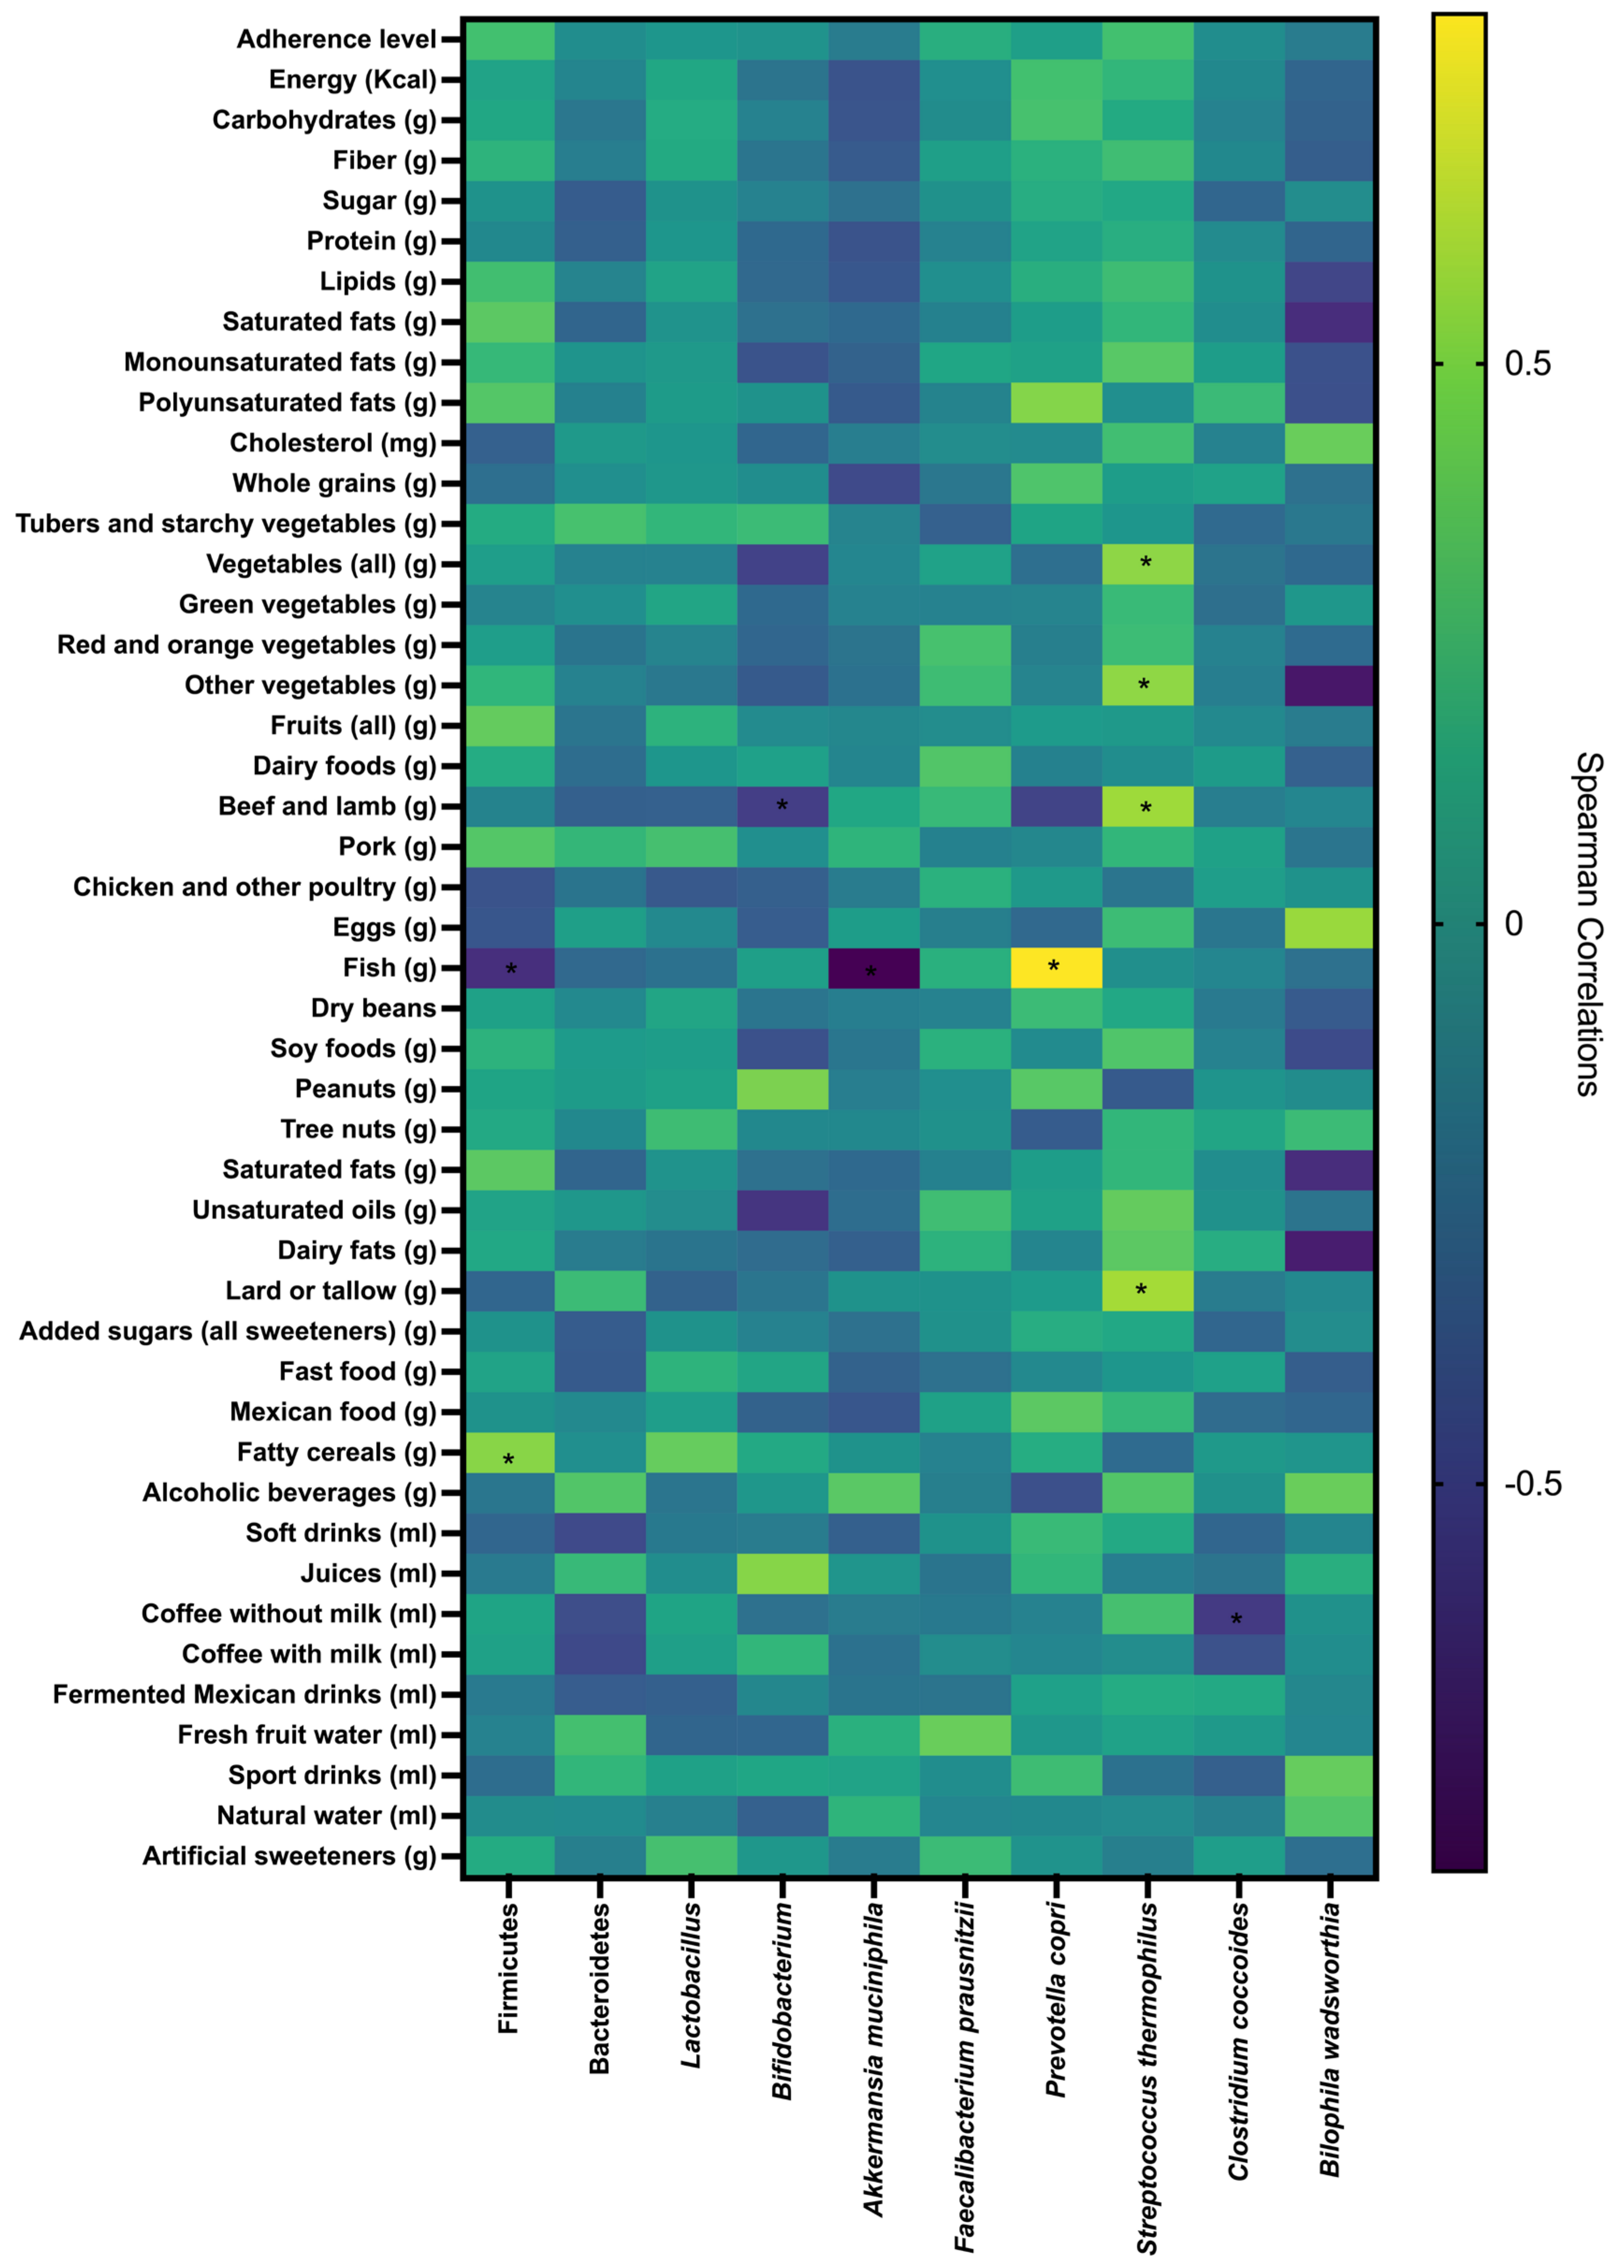
3.8. Correlations Between Gut Microbiota, Adherence Level to the EAT-Lancet Diet, Nutrients, and Food Group Intake
4. Discussion
5. Conclusions
Supplementary Materials
Author Contributions
Funding
Data Availability Statement
Acknowledgments
Conflicts of Interest
References
- Cao, H.; Shi, Y.; Wang, J.; Niu, Z.; Wei, L.; Tian, H.; Yu, F.; Gao, L. The Intestinal Microbiota and Metabolic Profiles of Strauchbufo Raddei Underwent Adaptive Changes during Hibernation. Integr. Zool. 2024, 19, 612–630. [Google Scholar] [CrossRef] [PubMed]
- Park, J.-K.; Do, Y. The Difference and Variation of Gut Bacterial Community and Host Physiology Can Support Adaptation during and after Overwintering in Frog Population. Integr. Zool. 2024, 19, 631–645. [Google Scholar] [CrossRef] [PubMed]
- Rinninella, E.; Tohumcu, E.; Raoul, P.; Fiorani, M.; Cintoni, M.; Mele, M.C.; Cammarota, G.; Gasbarrini, A.; Ianiro, G. The Role of Diet in Shaping Human Gut Microbiota. Best Pract. Res. Clin. Gastroenterol. 2023, 62–63, 101828. [Google Scholar] [CrossRef] [PubMed]
- Asnicar, F.; Berry, S.E.; Valdes, A.M.; Nguyen, L.H.; Piccinno, G.; Drew, D.A.; Leeming, E.; Gibson, R.; Le Roy, C.; Khatib, H.A.; et al. Microbiome Connections with Host Metabolism and Habitual Diet from 1,098 Deeply Phenotyped Individuals. Nat. Med. 2021, 27, 321–332. [Google Scholar] [CrossRef]
- Zhang, L.; Tuoliken, H.; Li, J.; Gao, H. Diet, Gut Microbiota, and Health: A Review. Food Sci. Biotechnol. 2024, 34, 2087–2099. [Google Scholar] [CrossRef]
- Rinninella, E.; Cintoni, M.; Raoul, P.; Lopetuso, L.R.; Scaldaferri, F.; Pulcini, G.; Miggiano, G.A.D.; Gasbarrini, A.; Mele, M.C. Food Components and Dietary Habits: Keys for a Healthy Gut Microbiota Composition. Nutrients 2019, 11, E2393. [Google Scholar] [CrossRef]
- Varzakas, T.; Smaoui, S. Global Food Security and Sustainability Issues: The Road to 2030 from Nutrition and Sustainable Healthy Diets to Food Systems Change. Foods 2024, 13, 306. [Google Scholar] [CrossRef]
- Lindgren, E.; Harris, F.; Dangour, A.D.; Gasparatos, A.; Hiramatsu, M.; Javadi, F.; Loken, B.; Murakami, T.; Scheelbeek, P.; Haines, A. Sustainable Food Systems-a Health Perspective. Sustain. Sci. 2018, 13, 1505–1517. [Google Scholar] [CrossRef]
- Food and Agriculture Organization of the United Nations; World Health Organization. Sustainable Healthy Diets: Guiding Principles; World Health Organization: Geneva, Switzerland, 2019. [Google Scholar]
- Willett, W.; Rockström, J.; Loken, B.; Springmann, M.; Lang, T.; Vermeulen, S.; Garnett, T.; Tilman, D.; DeClerck, F.; Wood, A.; et al. Food in the Anthropocene: The EAT–Lancet Commission on Healthy Diets from Sustainable Food Systems. Lancet 2019, 393, 447–492. [Google Scholar] [CrossRef]
- EAT—Lancet Commission Summary Report. Available online: https://eatforum.org/eat-lancet-commission/eat-lancet-commission-summary-report/ (accessed on 25 December 2024).
- Rehner, J.; Schmartz, G.P.; Kramer, T.; Keller, V.; Keller, A.; Becker, S.L. The Effect of a Planetary Health Diet on the Human Gut Microbiome: A Descriptive Analysis. Nutrients 2023, 15, 1924. [Google Scholar] [CrossRef]
- Deng, K.; Shen, L.; Xue, Z.; Li, B.; Tang, J.; Zhao, H.; Xu, F.; Miao, Z.; Cai, X.; Hu, W.; et al. Association of the EAT-Lancet Diet, Serial Measures of Serum Proteome and Gut Microbiome, and Cardiometabolic Health: A Prospective Study of Chinese Middle-Aged and Elderly Adults. Am. J. Clin. Nutr. 2024, 121, 567–579. [Google Scholar] [CrossRef] [PubMed]
- Avila-Nava, A.; Noriega, L.G.; Tovar, A.R.; Granados, O.; Perez-Cruz, C.; Pedraza-Chaverri, J.; Torres, N. Food Combination Based on a Pre-Hispanic Mexican Diet Decreases Metabolic and Cognitive Abnormalities and Gut Microbiota Dysbiosis Caused by a Sucrose-Enriched High-Fat Diet in Rats. Mol. Nutr. Food Res. 2017, 61, 1501023. [Google Scholar] [CrossRef]
- Medina-Vera, I.; Sanchez-Tapia, M.; Noriega-López, L.; Granados-Portillo, O.; Guevara-Cruz, M.; Flores-López, A.; Avila-Nava, A.; Fernández, M.L.; Tovar, A.R.; Torres, N. A Dietary Intervention with Functional Foods Reduces Metabolic Endotoxaemia and Attenuates Biochemical Abnormalities by Modifying Faecal Microbiota in People with Type 2 Diabetes. Diabetes Metab. 2019, 45, 122–131. [Google Scholar] [CrossRef] [PubMed]
- Ramirez-Farias, C.; Slezak, K.; Fuller, Z.; Duncan, A.; Holtrop, G.; Louis, P. Effect of Inulin on the Human Gut Microbiota: Stimulation of Bifidobacterium Adolescentis and Faecalibacterium Prausnitzii. Br. J. Nutr. 2009, 101, 541–550. [Google Scholar] [CrossRef] [PubMed]
- Scher, J.U.; Sczesnak, A.; Longman, R.S.; Segata, N.; Ubeda, C.; Bielski, C.; Rostron, T.; Cerundolo, V.; Pamer, E.G.; Abramson, S.B.; et al. Expansion of Intestinal Prevotella Copri Correlates with Enhanced Susceptibility to Arthritis. Elife 2013, 2, e01202. [Google Scholar] [CrossRef]
- Rodríguez-Lara, A.; Plaza-Díaz, J.; López-Uriarte, P.; Vázquez-Aguilar, A.; Reyes-Castillo, Z.; Álvarez-Mercado, A.I. Fiber Consumption Mediates Differences in Several Gut Microbes in a Subpopulation of Young Mexican Adults. Nutrients 2022, 14, 1214. [Google Scholar] [CrossRef]
- Meslier, V.; Laiola, M.; Roager, H.M.; De Filippis, F.; Roume, H.; Quinquis, B.; Giacco, R.; Mennella, I.; Ferracane, R.; Pons, N.; et al. Mediterranean Diet Intervention in Overweight and Obese Subjects Lowers Plasma Cholesterol and Causes Changes in the Gut Microbiome and Metabolome Independently of Energy Intake. Gut 2020, 69, 1258–1268. [Google Scholar] [CrossRef]
- Furet, J.-P.; Quénée, P.; Tailliez, P. Molecular Quantification of Lactic Acid Bacteria in Fermented Milk Products Using Real-Time Quantitative PCR. Int. J. Food Microbiol. 2004, 97, 197–207. [Google Scholar] [CrossRef]
- Laue, H.; Smits, T.H.M.; Schumacher, U.K.; Claros, M.C.; Hartemink, R.; Cook, A.M. Identification of Bilophila Wadsworthia by Specific PCR Which Targets the Taurine:Pyruvate Aminotransferase Gene. FEMS Microbiol. Lett. 2006, 261, 74–79. [Google Scholar] [CrossRef]
- Lares-Michel, M.; Housni, F.E.; Reyes-Castillo, Z.; Huertas, J.R.; Aguilera-Cervantes, V.G.; Michel-Nava, R.M. Sustainable-Psycho-Nutritional Intervention Programme for a Sustainable Diet (the ‘NutriSOS’ Study) and Its Effects on Eating Behaviour, Diet Quality, Nutritional Status, Physical Activity, Metabolic Biomarkers, Gut Microbiota and Water and Carbon Footprints in Mexican Population: Study Protocol of an mHealth Randomised Controlled Trial. Br. J. Nutr. 2023, 130, 1823–1838. [Google Scholar] [CrossRef]
- Instituto Nacional de Estadística y Geografía: INEGI. Available online: https://www.inegi.org.mx/default.html (accessed on 27 January 2021).
- Lares-Michel, M.; Housni, F.E.; Cervantes, V.G.A.; Cañedo, C.L.; Carmona, M.d.C.B.; Toro, H.B.D.; Nava, R.M.M. The Relationship between Consumption, Socioeconomic Level and Reasons of Tomato Intake in Mexico. Agric. Sci. 2018, 9, 720–726. [Google Scholar] [CrossRef]
- Asociación Mexicana de Agencias de Investigación de Mercado [AMAI]. Niveles Socioeconómicos. (2018). Available online: https://www.amai.org/ (accessed on 15 June 2025).
- Suverza, A.; Haua, K. El ABCD de La Evaluación Del Estado de Nutrición, 1st ed.; McGraw-Hill: New York, NY, USA, 2010. [Google Scholar]
- Isak—La Sociedad Internacional Para El Avance de La Cineantropometría. Available online: https://www.isak.global/ (accessed on 25 December 2024).
- Lares-Michel, M.; Housni, F.E.; Aguilera Cervantes, V.G.; Michel Nava, R.M. Development of a Mexican Online Nutritional Ecologic Software for Dietary Assessment, Automatic Calculation of Diet Quality, and Dietary Environmental Impact. Available online: https://www.researchsquare.com (accessed on 2 February 2023).
- de Chávez, M.; Solano, J.Á.L.; Villasana, A.C.; Romo, F.P.-G.; Martínez, E.M.; de la Concepción Calvo Carrillo, M.; Curiel, A.Á.; González, I.C.; Castillo, C.S.; Amaro, J.A.R.; et al. Composición de Alimentos Miriam Muñoz de Chávez Valor Nutritivo de Los Alimentos de Mayor Consumo, 2nd ed.; McGraw-Hill: New York, NY, USA, 2021. [Google Scholar]
- Pérez-Lizaur, A.B.; González, B.P.; Becerra, A.L.C.; Galicia, I.F. Sistema Mexicano de Alimentos Equivalentes; Ogali: Enugu, Nigeria, 2014; ISBN 978-607-00-7928-3. [Google Scholar]
- Montejano Vallejo, R.; Schulz, C.-A.; van de Locht, K.; Oluwagbemigun, K.; Alexy, U.; Nöthlings, U. Associations of Adherence to a Dietary Index Based on the EAT–Lancet Reference Diet with Nutritional, Anthropometric, and Ecological Sustainability Parameters: Results from the German DONALD Cohort Study. J. Nutr. 2022, 152, 1763–1772. [Google Scholar] [CrossRef] [PubMed]
- Lares-Michel, M.; Housni, F.E.; Aguilera Cervantes, V.G. A Quantitative Estimation of the Water Footprint of the Mexican Diet, Corrected for Washing and Cooking Water. Food Sec. 2021, 13, 849–874. [Google Scholar] [CrossRef]
- International Physical Activity Questionnaire [IPAQ]. IPAQ Scoring Protocol. Available online: https://sites.google.com/site/theipaq/scoring-protocol (accessed on 27 January 2021).
- IPAQ—Score. Available online: https://sites.google.com/view/ipaq/score (accessed on 9 January 2024).
- Official Journal of the Federation [DOF]. NOM-030-SSA2-2009, Para La Prevención, Detección, Diagnóstico, Tratamiento y Control de La Hipertensión Arterial Sistémica. Available online: https://www.cndh.org.mx/sites/default/files/doc/Programas/VIH/Leyes%20y%20normas%20y%20reglamentos/Norma%20Oficial%20Mexicana/NOM-030-SSA2-2009.pdf (accessed on 26 June 2025).
- Porchas-Quijada, M.; Reyes-Castillo, Z.; Muñoz-Valle, J.F.; Durán-Barragán, S.; Aguilera-Cervantes, V.; López-Espinoza, A.; Vázquez-Del Mercado, M.; Navarro-Meza, M.; López-Uriarte, P. IgG Anti-Ghrelin Immune Complexes Are Increased in Rheumatoid Arthritis Patients Under Biologic Therapy and Are Related to Clinical and Metabolic Markers. Front. Endocrinol. 2019, 10, 252. [Google Scholar] [CrossRef]
- National Library of Medicine. Primer Blast. Finding Primers Specific to Your PCR Template (Using Primer3 and BLAST). Available online: https://www.ncbi.nlm.nih.gov/tools/primer-blast/ (accessed on 9 March 2023).
- Salaiza Ambriz, L.C. Estandarización de Una Metodología Para Identificar Bacterias Asociadas a La Dieta (Akkermansia Muciniphila, Prevotella Copri, Clostridium Coccoides, Streptococcus Thermophilus, Bifidobacterium) Mediante La Técnica de qPCR En Muestras Fecales de Adultos Jóvenes Mexicanos; Universidad de Guadalajara: Guadalajara, Mexico, 2024. [Google Scholar]
- Ramírez Guerrero, S. Estandarización de Un Método Para La Identificación de Bacterias Intestinales (Bacillota, Bacteroidota, Lactobacillus, Faecalibacterium Prausnitzii y Bilophila Wadsworthia) Mediante PCR En Tiempo Real a Partir de Muestras Fecales En Población Joven Mexicana; Universidad de Guadalajara: Guadalajara, Mexico, 2024. [Google Scholar]
- Livak, K.J.; Schmittgen, T.D. Analysis of Relative Gene Expression Data Using Real-Time Quantitative PCR and the 2(-Delta Delta C(T)) Method. Methods 2001, 25, 402–408. [Google Scholar] [CrossRef]
- Schmittgen, T.D.; Livak, K.J. Analyzing Real-Time PCR Data by the Comparative CT Method. Nat. Protoc. 2008, 3, 1101–1108. [Google Scholar] [CrossRef]
- Chávez-Carbajal, A.; Nirmalkar, K.; Pérez-Lizaur, A.; Hernández-Quiroz, F.; Ramírez-Del-Alto, S.; García-Mena, J.; Hernández-Guerrero, C. Gut Microbiota and Predicted Metabolic Pathways in a Sample of Mexican Women Affected by Obesity and Obesity Plus Metabolic Syndrome. Int. J. Mol. Sci. 2019, 20, 438. [Google Scholar] [CrossRef]
- Dao, M.C.; Everard, A.; Aron-Wisnewsky, J.; Sokolovska, N. Akkermansia Muciniphila and Improved Metabolic Health during a Dietary Intervention in Obesity: Relationship with Gut Microbiome Richness and Ecology. Gut 2016, 65, 426–436. [Google Scholar] [CrossRef]
- Bacchetti De Gregoris, T.; Aldred, N.; Clare, A.S.; Burgess, J.G. Improvement of Phylum- and Class-Specific Primers for Real-Time PCR Quantification of Bacterial Taxa. J. Microbiol. Methods 2011, 86, 351–356. [Google Scholar] [CrossRef]
- Curtin, F.; Schulz, P. Multiple Correlations and Bonferroni’s Correction. Biol. Psychiatry 1998, 44, 775–777. [Google Scholar] [CrossRef]
- Swarte, J.C.; Eelderink, C.; Douwes, R.M.; Said, M.Y.; Hu, S.; Post, A.; Westerhuis, R.; Bakker, S.J.L.; Harmsen, H.J.M. Effect of High versus Low Dairy Consumption on the Gut Microbiome: Results of a Randomized, Cross-Over Study. Nutrients 2020, 12, 2129. [Google Scholar] [CrossRef] [PubMed]
- Wang, Y.; Uffelman, C.N.; Bergia, R.E.; Clark, C.M.; Reed, J.B.; Cross, T.-W.L.; Lindemann, S.R.; Tang, M.; Campbell, W.W. Meat Consumption and Gut Microbiota: A Scoping Review of Literature and Systematic Review of Randomized Controlled Trials in Adults. Adv. Nutr. 2023, 14, 215–237. [Google Scholar] [CrossRef] [PubMed]
- Świątecka, D.; Narbad, A.; Ridgway, K.P.; Kostyra, H. The Study on the Impact of Glycated Pea Proteins on Human Intestinal Bacteria. Int. J. Food Microbiol. 2011, 145, 267–272. [Google Scholar] [CrossRef] [PubMed]
- Saygili, S.; Hegde, S.; Shi, X.-Z. Effects of Coffee on Gut Microbiota and Bowel Functions in Health and Diseases: A Literature Review. Nutrients 2024, 16, 3155. [Google Scholar] [CrossRef]
- Fackelmann, G.; Manghi, P.; Carlino, N.; Heidrich, V.; Piccinno, G.; Ricci, L.; Piperni, E.; Arrè, A.; Bakker, E.; Creedon, A.C.; et al. Gut Microbiome Signatures of Vegan, Vegetarian and Omnivore Diets and Associated Health Outcomes across 21,561 Individuals. Nat. Microbiol. 2025, 10, 41–52. [Google Scholar] [CrossRef]
- Castro-Mejía, J.L.; Khakimov, B.; Aru, V.; Lind, M.V.; Garne, E.; Paulová, P.; Tavakkoli, E.; Hansen, L.H.; Smilde, A.K.; Holm, L.; et al. Gut Microbiome and Its Cofactors Are Linked to Lipoprotein Distribution Profiles. Microorganisms 2022, 10, 2156. [Google Scholar] [CrossRef]
- Yu, Y.; Raka, F.; Adeli, K. The Role of the Gut Microbiota in Lipid and Lipoprotein Metabolism. J. Clin. Med. 2019, 8, 2227. [Google Scholar] [CrossRef]
- Muralitharan, R.R.; Jama, H.A.; Xie, L.; Peh, A.; Snelson, M.; Marques, F.Z. Microbial Peer Pressure: The Role of the Gut Microbiota in Hypertension and Its Complications. Hypertension 2020, 76, 1674–1687. [Google Scholar] [CrossRef]
- Griffiths, M.W.; Tellez, A.M. Lactobacillus Helveticus: The Proteolytic System. Front. Microbiol. 2013, 4, 30. [Google Scholar] [CrossRef]
- Ramchandran, L.; Shah, N.P. Proteolytic Profiles and Angiotensin-I Converting Enzyme and Alpha-Glucosidase Inhibitory Activities of Selected Lactic Acid Bacteria. J. Food Sci. 2008, 73, M75–M81. [Google Scholar] [CrossRef]
- Komodromou, I.; Andreou, E.; Vlahoyiannis, A.; Christofidou, M.; Felekkis, K.; Pieri, M.; Giannaki, C.D. Exploring the Dynamic Relationship between the Gut Microbiome and Body Composition across the Human Lifespan: A Systematic Review. Nutrients 2024, 16, 660. [Google Scholar] [CrossRef] [PubMed]
- Kulecka, M.; Fraczek, B.; Mikula, M.; Zeber-Lubecka, N.; Karczmarski, J.; Paziewska, A.; Ambrozkiewicz, F.; Jagusztyn-Krynicka, K.; Cieszczyk, P.; Ostrowski, J. The Composition and Richness of the Gut Microbiota Differentiate the Top Polish Endurance Athletes from Sedentary Controls. Gut Microbes 2020, 11, 1374–1384. [Google Scholar] [CrossRef] [PubMed]
- Kobayashi, T.; Osaki, T.; Oikawa, S. Use of T-RFLP and Seven Restriction Enzymes to Compare the Faecal Microbiota of Obese and Lean Japanese Healthy Men. Benef. Microbes 2015, 6, 735–745. [Google Scholar] [CrossRef] [PubMed]
- Varghese, S.; Rao, S.; Khattak, A.; Zamir, F.; Chaari, A. Physical Exercise and the Gut Microbiome: A Bidirectional Relationship Influencing Health and Performance. Nutrients 2024, 16, 3663. [Google Scholar] [CrossRef]
- Bressa, C.; Bailén-Andrino, M.; Pérez-Santiago, J.; González-Soltero, R.; Pérez, M.; Montalvo-Lominchar, M.G.; Maté-Muñoz, J.L.; Domínguez, R.; Moreno, D.; Larrosa, M. Differences in Gut Microbiota Profile between Women with Active Lifestyle and Sedentary Women. PLoS ONE 2017, 12, e0171352. [Google Scholar] [CrossRef]
- Shah, S.; Mu, C.; Moossavi, S.; Shen-Tu, G.; Schlicht, K.; Rohmann, N.; Geisler, C.; Laudes, M.; Franke, A.; Züllig, T.; et al. Physical Activity-Induced Alterations of the Gut Microbiota Are BMI Dependent. FASEB J. 2023, 37, e22882. [Google Scholar] [CrossRef]
- Ferreira, C.; Otani, S.; Aarestrup, F.M.; Manaia, C.M. Quantitative PCR versus Metagenomics for Monitoring Antibiotic Resistance Genes: Balancing High Sensitivity and Broad Coverage. FEMS Microbes 2023, 4, xtad008. [Google Scholar] [CrossRef]
- Yan, Z.; Hao, T.; Yan, Y.; Zhao, Y.; Wu, Y.; Tan, Y.; Bi, Y.; Cui, Y.; Yang, R.; Zhao, Y. Quantitative and Dynamic Profiling of Human Gut Core Microbiota by Real-Time PCR. Appl. Microbiol. Biotechnol. 2024, 108, 396. [Google Scholar] [CrossRef]

| Variable | General Subsample | Adherence Level | |||
|---|---|---|---|---|---|
| Low | Moderate | High | p-Value | ||
| n (%) | n (%) | n (%) | |||
| n = 54 | 20 (37.00) ^ | 20 (37.00) ^ | 14 (26.00) ^ | ||
| Sex | n (%) | ||||
| Women | 38 (70.37) | 12 (60.00) | 13 (65.00) | 13 (92.86) | 0.095 |
| Men | 16 (29.63) | 8 (40.00) | 7 (35.00) | 1 (7.14) | |
| Educational level | |||||
| Basic | 0 (0.00) | 0 (0.00) | 0 (0.00) | 0 (0.00) | 0.865 |
| Medium | 34 (62.96) | 14 (70.00) | 12 (60.00) | 8 (57.14) | |
| Higher | 20 (37.04) | 6 (30.00) | 8 (40.00) | 6 (42.86) | |
| Occupational level | |||||
| Low | 22 (40.74) | 10 (50.00) | 7 (40.00) | 5 (35.71) | 0.626 |
| Medium | 8 (14.81) | 6 (30.00) | 1 (5.00) | 1 (7.14) | |
| High | 24 (44.44) | 4 (20.00) | 12 (55.00) | 8 (54.14) | |
| Monthly income | |||||
| 0–2699 | 12 (22.22) | 5 (25.00) | 3 (15.00) | 4 (28.57) | 0.300 |
| 2700–6799 | 19 (35.19) | 9 (45.00) | 6 (30.00) | 4 (28.57) | |
| 6800–11,599 | 10 (18.52) | 4 (20.00) | 2 (10.00) | 4 (28.57) | |
| 11,600–34,999 | 12 (22.22) | 2 (10.00) | 8 (40.00) | 2 (14.29) | |
| 35,000–84,999 | 1 (1.85) | 0 (0.00) | 1 (5.00) | 0 (0.00) | |
| +85,000 | 0 (0.00) | 0 (0.00) | 0 (0.00) | 0 (0.00) | |
| Age | |||||
| Average age | 24.70 | 23.95 | 25.20 | 25.07 | 0.340 |
| Standard deviation | 4.29 | 4.22 | 3.80 | 5.136 | |
| Minimum | 19.00 | 20 | 19 | 19 | |
| Maximum | 35.00 | 35 | 30 | 34 | |
| Variable | General Subsample | Adherence Level | p-Value | ||||||
|---|---|---|---|---|---|---|---|---|---|
| Low | Moderate | High | |||||||
| n (%) | n (%) | n (%) | |||||||
| n = 54 | 20 (37.00) ^ | 20 (37.00) ^ | 14 (26.00) ^ | ||||||
| Mean | SD | Mean | SD | Mean | SD | Mean | SD | ||
| Anthropometric data | |||||||||
| Height (cm) | 164.24 | 8.00 | 164.59 a | 7.79 | 164.80 a | 8.21 | 162.96 a | 8.46 | 0.7888 |
| Weight (kg) | 71.10 | 20.08 | 75.40 a | 25.80 | 70.05 a | 17.03 | 66.46 a | 13.89 | 0.6916′ |
| BMI (kg m−2) | 26.07 | 5.89 | 27.35 a | 7.37 | 25.62 a | 5.05 | 24.91 a | 4.50 | 0.7277′ |
| Waist circumference (cm) | 82.09 | 13.98 | 84.12 a | 17.04 | 82.25 a | 12.92 | 78.98 a | 10.55 | 0.7207′ |
| Hips circumference (cm) | 100.03 | 16.87 | 104.28 a | 15.01 | 95.33 a | 21.63 | 100.69 a | 9.24 | 0.6186′ |
| Waist–hip ratio | 0.93 | 0.90 | 0.80 a | 0.07 | 1.15 a | 1.47 | 0.78 a | 0.06 | 0.1956′ |
| Neck (cm) | 35.07 | 4.14 | 36.07 | 4.85 | 35.50 | 3.96 | 33.04 | 2.53 | 0.0923 |
| Body composition data | |||||||||
| Body fat (%) | 30.85 | 9.00 | 31.06 a | 11.16 | 29.66 a | 6.98 | 32.27 a | 8.53 | 0.4963 |
| Visceral fat (kg) | 5.02 | 4.20 | 6.15 a | 5.77 | 4.80 a | 3.14 | 3.71 a | 2.23 | 0.4766′ |
| Muscle mass (kg) | 45.86 | 10.86 | 47.94 a | 12.49 | 46.43 a | 10.96 | 42.08 a | 7.39 | 0.3039′ |
| Water (%) | 50.63 | 5.91 | 50.48 | 7.32 | 51.19 | 4.53 | 50.06 | 5.77 | 0.5852 |
| Metabolic rate (kcal) | 2344.89 | 531.76 | 2440.05 a | 620.31 | 2371.50 a | 541.13 | 2170.93 a | 338.90 | 0.3250′ |
| Metabolic age | 40.07 | 21.82 | 43.95 a | 26.89 | 38.05 a | 18.74 | 37.43 a | 18.25 | 0.8472′ |
| Biochemical data | |||||||||
| Glucose (mg/dL) | 89.54 | 8.34 | 90.85 a | 7.71 | 88.75 a | 8.00 | 88.79 a | 9.93 | 0.6825 |
| Triglycerides (mg/dL) | 94.17 | 51.49 | 98.85 a | 58.15 | 97.50 a | 51.83 | 82.71 a | 41.84 | 0.4579′ |
| Total cholesterol (mg/dL) | 156.11 | 30.60 | 160.82 a | 36.68 | 153.32 a | 32.38 | 153.39 a | 16.32 | 0.6954 |
| LDL cholesterol (mg/dL) | 105.23 | 28.77 | 110.33 a | 31.10 | 103.65 a | 33.25 | 100.22 a | 16.54 | 0.6203 |
| HDL cholesterol (mg/dL) | 50.88 | 10.34 | 50.49 a | 11.15 | 49.68 a | 9.63 | 53.17 a | 10.52 | 0.5820 |
| Clinical data | |||||||||
| Systolic blood pressure (mg/Hm) | 104.35 | 15.24 | 108.00 a | 13.61 | 106.25 a | 17.84 | 96.43 a | 10.82 | 0.0702 |
| Diastolic blood pressure (mg/Hm) | 72.22 | 11.06 | 75.75 a | 10.67 | 72.25 a | 13.03 | 67.14 a | 6.11 | 0.0804 |
| Physical activity | |||||||||
| Days per week | 2.54 | 2.13 | 3.05 a | 1.96 | 2.15 a | 2.39 | 2.36 a | 1.95 | 0.3875 |
| Minutes per day | 45.19 | 44.67 | 49.00 a | 41.79 | 44.50 a | 51.96 | 40.71 a | 39.90 | 0.7419 |
| Physical activity level | n | % | n | % | n | % | n | % | |
| Low | 25.00 | 46.29 | 8.00 | 40.00 | 11.00 | 55.00 | 6.00 | 42.85 | 0.457 º |
| Medium | 25.00 | 46.29 | 10.00 | 50.00 | 8.00 | 40.00 | 7.00 | 50.00 | |
| Intense | 4.00 | 7.40 | 2.00 | 10.00 | 1.00 | 5.00 | 1.00 | 7.14 | |
| Physical activity type | |||||||||
| Mild aerobic | 21.00 | 38.88 | 6.00 | 30.00 | 11.00 | 55.00 | 4.00 | 28.57 | 0.751 º |
| Moderate to intense aerobic | 22.00 | 40.74 | 10.00 | 50.00 | 4.00 | 20.00 | 8.00 | 57.12 | |
| Anaerobic | 11.00 | 20.37 | 4.00 | 20.00 | 5.00 | 25.00 | 2.00 | 14.28 | |
| Variable | General Subsample | Adherence Level | p Value | ||||||
|---|---|---|---|---|---|---|---|---|---|
| Low | Moderate | High | |||||||
| n (%) | n (%) | n (%) | |||||||
| n = 54 | 20 (37.00) ^ | 20 (37.00) ^ | 14 (26.00) ^ | ||||||
| Mean | SD | Mean | SD | Mean | SD | Mean | SD | ||
| Energy (Kcal) | 3296.02 | 1245.91 | 3494.36 a | 1525.27 | 3201.09 a | 1137.81 | 3148.29 a | 968.67 | 0.8703 |
| Fibre (g) | 34.63 | 17.73 | 37.19 a | 22.47 | 32.77 a | 15.06 | 33.62 a | 13.98 | 0.9597 |
| Carbohydrates (g) | 401.01 | 162.35 | 406.85 a | 173.95 | 390.94 a | 157.30 | 407.07 a | 163.76 | 0.9597 |
| Sugar (g) | 152.76 | 102.42 | 147.07 a | 66.60 | 127.60 a | 75.43 | 196.81 a | 157.64 | 0.3805 |
| Protein (g) | 133.37 | 59.85 | 153.74 a | 75.25 | 131.74 a | 51.86 | 106.62 a | 31.36 | 0.0930 |
| Lipids (g) | 130.82 | 57.40 | 142.97 a | 77.50 | 123.72 a | 46.71 | 123.62 a | 33.24 | 0.8561 |
| Saturated fatty acids (g) | 41.30 | 22.07 | 48.10 a | 31.43 | 37.29 a | 14.86 | 37.30 a | 10.31 | 0.4009 |
| Monounsaturated fatty acids (g) | 37.57 | 18.38 | 40.95 a | 25.04 | 35.48 a | 13.71 | 35.73 a | 12.60 | 0.9384 |
| Polyunsaturated fatty acids (g) | 25.00 | 16.47 | 24.48 a | 17.66 | 21.81 a | 12.71 | 30.31 a | 19.18 | 0.3862 |
| Cholesterol (mg) | 574.20 | 333.76 | 712.18 a | 409.69 | 528.62 ab | 284.09 | 442.19 b | 199.06 | 0.0158 * |
| Calcium (mg) | 1559.99 | 670.65 | 1759.65 a | 863.77 | 1516.73 a | 508.87 | 1336.57 a | 496.81 | 0.2664 |
| Phosphorus (mg) | 1868.01 | 844.85 | 2214.59 a | 1098.95 | 1709.58 a | 595.92 | 1599.23 a | 569.82 | 0.1502 |
| Iron (mg) | 29.83 | 12.39 | 31.95 a | 15.20 | 29.36 a | 11.05 | 27.48 a | 9.85 | 0.7200 |
| Magnesium (mg) | 524.15 | 241.56 | 570.37 a | 293.15 | 501.28 a | 205.19 | 490.78 a | 213.25 | 0.7038 |
| Sodium (mg) | 4393.46 | 2739.18 | 4930.93 a | 3968.11 | 3991.16 a | 1881.36 | 4200.34 a | 1292.13 | 0.6382 |
| Potassium (mg) | 4627.91 | 2192.74 | 5163.00 a | 2751.99 | 4333.46 a | 1859.35 | 4284.13 a | 1667.12 | 0.6045 |
| Zinc (mg) | 16.76 | 6.85 | 18.99 a | 8.71 | 15.80 a | 5.36 | 14.93 a | 5.08 | 0.3610 |
| Selenium (mg) | 55.99 | 26.36 | 61.67 a | 27.49 | 57.99 a | 29.67 | 45.01 a | 16.02 | 0.2066 |
| Vitamin A (µg RE) | 1107.88 | 570.69 | 1223.46 a | 571.23 | 1091.49 a | 607.86 | 966.20 a | 517.95 | 0.3260 |
| Ascorbic acid (mg) | 317.55 | 220.67 | 335.98 a | 214.43 | 326.17 a | 264.30 | 278.90 a | 164.24 | 0.7860 |
| Thiamine (mg) | 2.77 | 1.47 | 2.89 a | 1.36 | 2.89 a | 1.82 | 2.41 a | 1.04 | 0.4357 |
| Riboflavin (mg) | 3.35 | 1.82 | 3.84 a | 1.95 | 3.36 a | 1.95 | 2.66 a | 1.21 | 0.0815 |
| Niacin (mg) | 26.36 | 11.85 | 30.05 a | 13.37 | 26.03 a | 11.91 | 21.58 a | 7.66 | 0.1768 |
| Pyridoxine (mg) | 8.69 | 6.12 | 11.54 a | 7.37 | 8.01 ab | 4.79 | 5.61 b | 4.03 | 0.0303 * |
| Folic acid (µg) | 431.95 | 177.28 | 485.74 a | 191.22 | 405.16 a | 171.33 | 393.37 a | 156.91 | 0.2617 |
| Cobalamin (mg) | 8.10 | 3.84 | 8.78 a | 4.02 | 8.49 a | 4.29 | 6.57 a | 2.49 | 0.1998 |
| Ethanol (g) | 7.43 | 11.82 | 4.58 a | 6.74 | 10.09 a | 17.03 | 7.71 a | 7.49 | 0.1914 |
| Variable | EAT-Lancet Reference Intake | General Subsample | Adherence Level | p-Value | ||||||||
|---|---|---|---|---|---|---|---|---|---|---|---|---|
| Low | Moderate | High | ||||||||||
| n (%) | n (%) | n (%) | ||||||||||
| Suggested Intake | Possible Range | n = 54 | 20 (37.00) ^ | 20 (37.00) ^ | 14 (26.00) ^ | |||||||
| g/day | g/day | Mean | SD | Mean | SD | Mean | SD | Mean | SD | |||
| EAT-Lancet diet food groups 1 | (g) | (g) | (g) | (g) | (g) | (g) | (g) | (g) | ||||
| Whole grains | 232.00 | 0.00% | 60.00% | 299.56 | 130.75 | 329.92 a | 125.20 | 284.80 a | 118.95 | 277.29 a | 154.32 | 0.2239 |
| Tubers and starchy vegetables | 50.00 | 0.00 | 100.00 | 37.38 | 50.66 | 39.48 a | 41.29 | 41.76 a | 65.46 | 28.12 a | 39.75 | 0.4139 |
| Vegetables (all) | 300.00 | 200.00 | 600.00 | 317.71 | 189.64 | 323.13 a | 224.82 | 323.19 a | 176.93 | 302.14 a | 163.25 | 0.9115 |
| Green vegetables | 100.00 | - | - | 164.43 | 112.03 | 182.81 a | 141.57 | 156.70 a | 98.03 | 149.22 a | 83.47 | 0.9545 |
| Red and orange vegetables | 100.00 | - | - | 91.15 | 70.93 | 91.41 a | 69.71 | 96.95 a | 82.39 | 82.49 a | 57.94 | 0.9452 |
| Other vegetables | 100.00 | - | - | 62.13 | 49.84 | 48.91 a | 37.89 | 69.54 a | 54.11 | 70.43 a | 57.65 | 0.4666 |
| Fruits (all) | 200.00 | 100.00 | 300.00 | 389.73 | 280.83 | 397.84 a | 320.60 | 397.94 a | 271.22 | 366.42 a | 251.00 | 0.7535 |
| Dairy foods | 250.00 | 0.00 | 500.00 | 229.83 | 150.85 | 276.91 a | 160.95 | 230.43 a | 134.94 | 161.73 a | 141.05 | 0.0674 |
| Protein sources | 84.00 | 0.00 | 211.00 | 229.95 | 139.65 | 292.43 a | 166.65 | 224.89 ab | 118.43 | 147.94 b | 71.67 | 0.0012 * |
| Meats (protein sources without eggs) | 71.00 | 0.00 | 186.00 | 165.52 | 99.85 | 209.29 a | 122.38 | 166.22 ab | 81.49 | 101.99 b | 41.90 | 0.0016 * |
| Beef and lamb | 7.00 | 0.00 | 14.00 | 44.54 | 28.27 | 49.44 a | 29.49 | 45.74 a | 28.45 | 35.84 a | 26.15 | 0.3821 |
| Pork | 7.00 | 0.00 | 14.00 | 19.86 | 23.88 | 30.43 a | 33.74 | 14.30 a | 13.95 | 12.71 a | 10.16 | 0.3951 |
| Chicken and other poultry | 29.00 | 0.00 | 58.00 | 58.48 | 53.96 | 84.05 a | 65.65 | 48.62 a | 46.40 | 36.01 a | 26.94 | 0.0212 * |
| Eggs | 13.00 | 0.00 | 25.00 | 64.44 | 55.27 | 83.14 a | 58.87 | 58.67 a | 53.12 | 45.94 a | 48.04 | 0.0599 |
| Fish | 28.00 | 0.00 | 100.00 | 42.64 | 49.87 | 45.36 a | 45.96 | 57.56 a | 63.38 | 17.43 a | 11.97 | 0.0497 * |
| Legumes | 125.00 | 0.00 | 225.00 | 121.83 | 99.41 | 161.55 a | 141.63 | 96.84 a | 54.97 | 100.78 a | 51.88 | 0.3986 |
| Dry beans, lentils, peas, and chickpeas | 50.00 | 0.00 | 100.00 | 98.22 | 95.49 | 127.31 a | 140.28 | 73.41 a | 47.87 | 92.10 a | 52.68 | 0.5306 |
| Soy foods | 25.00 | 0.00 | 50.00 | 4.22 | 12.29 | 5.59 a | 12.65 | 4.86 a | 15.75 | 1.36 a | 2.65 | 0.2276 |
| Peanuts | 25.00 | 0.00 | 75.00 | 6.00 | 15.69 | 9.13 a | 24.75 | 5.07 a | 7.07 | 2.86 a | 2.80 | 0.9229 |
| Tree nuts | 25.00 | - | - | 13.39 | 34.07 | 19.52 a | 44.22 | 13.50 a | 34.23 | 4.47 a | 4.32 | 0.1243 |
| Added fats | 51.80 | 20.00 | 91.80 | 78.23 | 90.43 | 83.23 a | 82.09 | 83.64 a | 124.30 | 63.38 a | 24.30 | 0.6041 |
| Saturated fats | 6.80 | 0.00 | 6.80 | 41.30 | 22.07 | 48.10 a | 31.43 | 37.29 a | 14.86 | 37.30 a | 10.31 | 0.4009 |
| Unsaturated oils | 40.00 | 20.00 | 80.00 | 16.90 | 18.25 | 12.99 a | 11.15 | 17.85 a | 23.86 | 21.11 a | 17.30 | 0.3703 |
| Dairy fats | 0.00 | 0.00 | 0.00 | 16.02 | 64.11 | 13.79 a | 35.19 | 26.90 a | 99.89 | 3.64 a | 3.13 | 0.6514 |
| Lard or tallow | 5.00 | 0.00 | 5.00 | 4.02 | 17.46 | 8.34 a | 28.40 | 1.60 a | 3.26 | 1.32 a | 1.84 | 0.8615 |
| Added sugars (all sweeteners) | 31.00 | 0.00 | 31.00 | 152.76 | 102.42 | 147.07 a | 66.60 | 127.60 a | 75.43 | 196.81 a | 157.64 | 0.3805 |
| Variable | General Subsample | Adherence Level | p Value | ||||||
|---|---|---|---|---|---|---|---|---|---|
| Low | Moderate | High | |||||||
| n (%) | n (%) | n (%) | |||||||
| n = 54 | 20 (37.00) ^ | 20 (37.00) ^ | 14 (26.00) ^ | ||||||
| Mean | SD | Mean | SD | Mean | SD | Mean | SD | ||
| Non-EAT-Lancet diet food groups | |||||||||
| Fast food (g) | 76.48 | 54.02 | 59.10 a | 35.80 | 88.93 a | 70.87 | 83.54 a | 43.89 | 0.1968 |
| Mexican food (g) | 192.89 | 132.57 | 204.88 a | 175.45 | 169.03 a | 81.99 | 209.87 a | 124.22 | 0.6338 |
| Fatty cereals (g) | 82.51 | 66.82 | 76.13 a | 47.72 | 82.57 a | 91.54 | 91.55 a | 49.76 | 0.2573 |
| Alcoholic beverages (g) | 98.36 | 191.54 | 66.52 a | 135.48 | 146.43 a | 272.22 | 75.19 a | 93.54 | 0.3333 |
| Soft drinks (mL) | 128.98 | 198.88 | 120.50 a | 167.82 | 81.25 a | 112.25 | 209.29 a | 301.85 | 0.4066 |
| Juices (mL) | 34.37 | 39.23 | 37.06 a | 43.98 | 29.63 a | 37.16 | 37.28 a | 37.06 | 0.7767 |
| Coffee without milk (mL) | 294.91 | 391.39 | 262.18 a | 437.41 | 336.60 a | 450.54 | 282.14 a | 209.10 | 0.2155 |
| Coffee without milk (mL) | 24.06 | 48.26 | 30.98 a | 62.99 | 23.99 a | 46.53 | 14.29 a | 18.87 | 0.5011 |
| Fermented Mexican drinks (mL) | 32.58 | 34.99 | 35.06 a | 45.07 | 29.05 a | 21.90 | 34.09 a | 35.92 | 0.9644 |
| Fresh fruit water (mL) | 152.59 | 186.21 | 87.20 a | 86.74 | 220.00 a | 254.83 | 149.71 a | 147.93 | 0.1233 |
| Sport drinks (mL) | 40.83 | 90.96 | 15.49 a | 27.19 | 70.74 a | 133.14 | 34.29 a | 65.83 | 0.1324 |
| Natural water (mL) | 1413.77 | 916.07 | 1308.80 a | 783.14 | 1514.78 a | 1229.29 | 1419.43 a | 532.60 | 0.8307 |
| Artificial sweeteners (g) | 0.45 | 1.30 | 0.58 a | 1.72 | 0.46 a | 1.22 | 0.26 a | 0.58 | 0.9984 |
Disclaimer/Publisher’s Note: The statements, opinions and data contained in all publications are solely those of the individual author(s) and contributor(s) and not of MDPI and/or the editor(s). MDPI and/or the editor(s) disclaim responsibility for any injury to people or property resulting from any ideas, methods, instructions or products referred to in the content. |
© 2025 by the authors. Licensee MDPI, Basel, Switzerland. This article is an open access article distributed under the terms and conditions of the Creative Commons Attribution (CC BY) license (https://creativecommons.org/licenses/by/4.0/).
Share and Cite
Lares-Michel, M.; Vázquez-Solórzano, R.; Reyes-Castillo, Z.; Salaiza-Ambriz, L.C.; Ramírez-Guerrero, S.; Housni, F.E.; Rodríguez-Lara, A.; R. Huertas, J. Association Between Adherence Levels to the EAT-Lancet Diet in Habitual Intake and Selected Gut Bacteria in a Mexican Subpopulation. Appl. Microbiol. 2025, 5, 62. https://doi.org/10.3390/applmicrobiol5030062
Lares-Michel M, Vázquez-Solórzano R, Reyes-Castillo Z, Salaiza-Ambriz LC, Ramírez-Guerrero S, Housni FE, Rodríguez-Lara A, R. Huertas J. Association Between Adherence Levels to the EAT-Lancet Diet in Habitual Intake and Selected Gut Bacteria in a Mexican Subpopulation. Applied Microbiology. 2025; 5(3):62. https://doi.org/10.3390/applmicrobiol5030062
Chicago/Turabian StyleLares-Michel, Mariana, Rafael Vázquez-Solórzano, Zyanya Reyes-Castillo, Leilani Clarissa Salaiza-Ambriz, Salvador Ramírez-Guerrero, Fatima Ezzahra Housni, Avilene Rodríguez-Lara, and Jesús R. Huertas. 2025. "Association Between Adherence Levels to the EAT-Lancet Diet in Habitual Intake and Selected Gut Bacteria in a Mexican Subpopulation" Applied Microbiology 5, no. 3: 62. https://doi.org/10.3390/applmicrobiol5030062
APA StyleLares-Michel, M., Vázquez-Solórzano, R., Reyes-Castillo, Z., Salaiza-Ambriz, L. C., Ramírez-Guerrero, S., Housni, F. E., Rodríguez-Lara, A., & R. Huertas, J. (2025). Association Between Adherence Levels to the EAT-Lancet Diet in Habitual Intake and Selected Gut Bacteria in a Mexican Subpopulation. Applied Microbiology, 5(3), 62. https://doi.org/10.3390/applmicrobiol5030062