
Comprehensive Analysis of E. coli, Enterococcus spp., Salmonella enterica, and Antimicrobial Resistance Determinants in Fugitive Bioaerosols from Cattle Feedyards

 , , , , and
Abstract
1. Introduction
2. Materials and Methods
2.1. Experimental Design
2.2. Bioaerosol Sampling Methods
Hardware
2.3. Microbiological Processing
2.3.1. Crude Bacterial Quantification
2.3.2. Quantitative Real-Time PCR (qPCR) for Antimicrobial Resistance Genes
Community DNA Extraction for qPCR
Primers and Reaction Setup
Standard Curve Generation
2.3.3. Phenotypic Characterization of Bacteria
Antimicrobial Susceptibility Testing (AST)
2.3.4. Genotypic Characterization of Bacterial Isolates
DNA Extraction for Whole Genome Sequencing (WGS)
Whole Genome Sequencing (WGS)
Bioinformatics Analysis of WGS Data
2.3.5. Dust Mass Calculations
- Mo = mass of filter before sampling (g)
- Me = mass of filter after sampling (g)
- AMCTSP = concentration of bioaerosol captured in TSP filter in grams per m3 of air
- AMCPM10 = concentration of bioaerosol captured in PM10 filter in grams per m3 of air
- TSP(g) = MeTSP − MoTSP
- PM10(g) = MePM10 − MoPM10
- Q = Air sampling flow rate (m3/min)
- = Sampling time (min)
- VA = Volume of air sampled by impinger (L)
- AMTSP = Aerosol mass (AM) derived from co-located high-volume TSP sampler (TSP (g))
- AMCimp = concentration of bioaerosol captured in impinger in grams per m3 of air
- Qimp = Air sampling flow rate through impinger (L/min)
- Δtimp = Impinger sampling time (min)
2.4. Statistical Analyses
2.4.1. Bacterial Count Analyses
- AMimp = Aerosol mass (AM) derived from co-located high-volume TSP sampler (TSP (g))
- V1 = 100 mL of raw sample
- AMmb = Aerosol mass (AM) derived from transmittance measure
- V2 = 150 mL of raw sample
- AMQF = Aerosol mass (AM) derived from quartz filter sampler (g)
- V3 = 200 mL of raw sample
2.4.2. Antimicrobial Susceptibility Analysis
2.4.3. Quantitative Real-Time PCR (qPCR) for Antimicrobial Resistance Genes
3. Results
3.1. Bacterial Prevalence and Quantification
3.1.1. Descriptive Statistics
3.1.2. Hurdle Regression Models
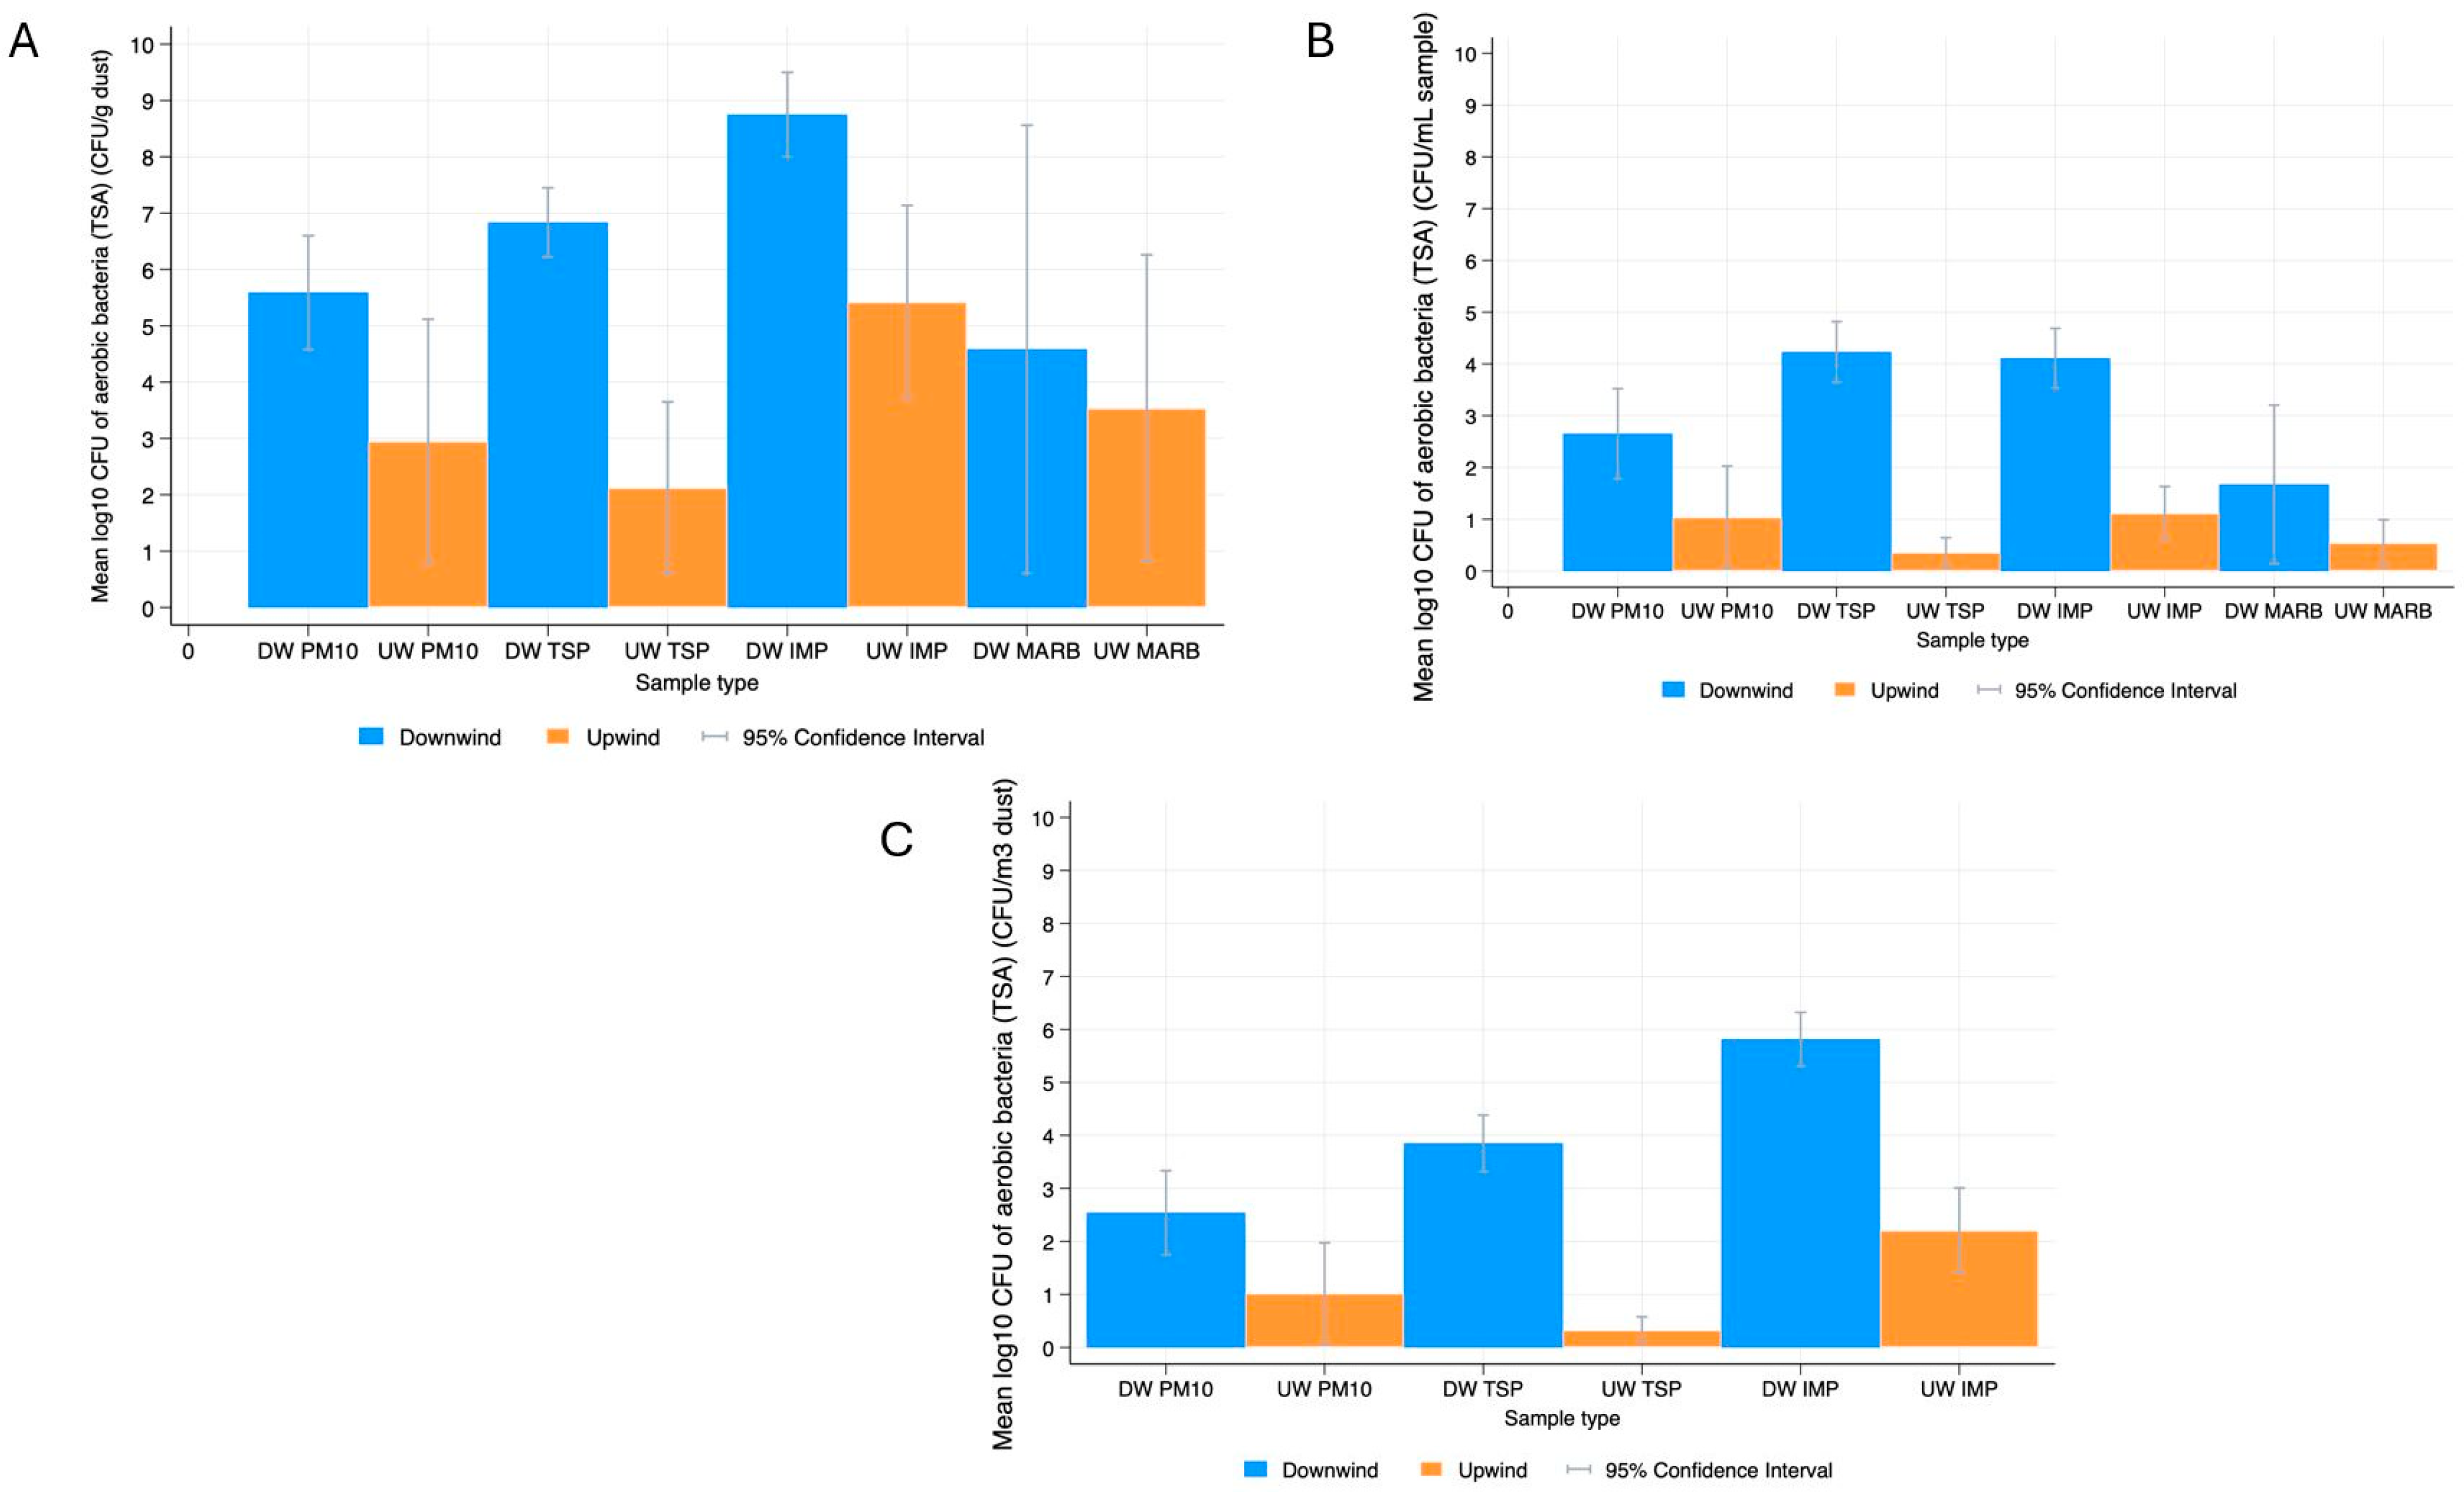
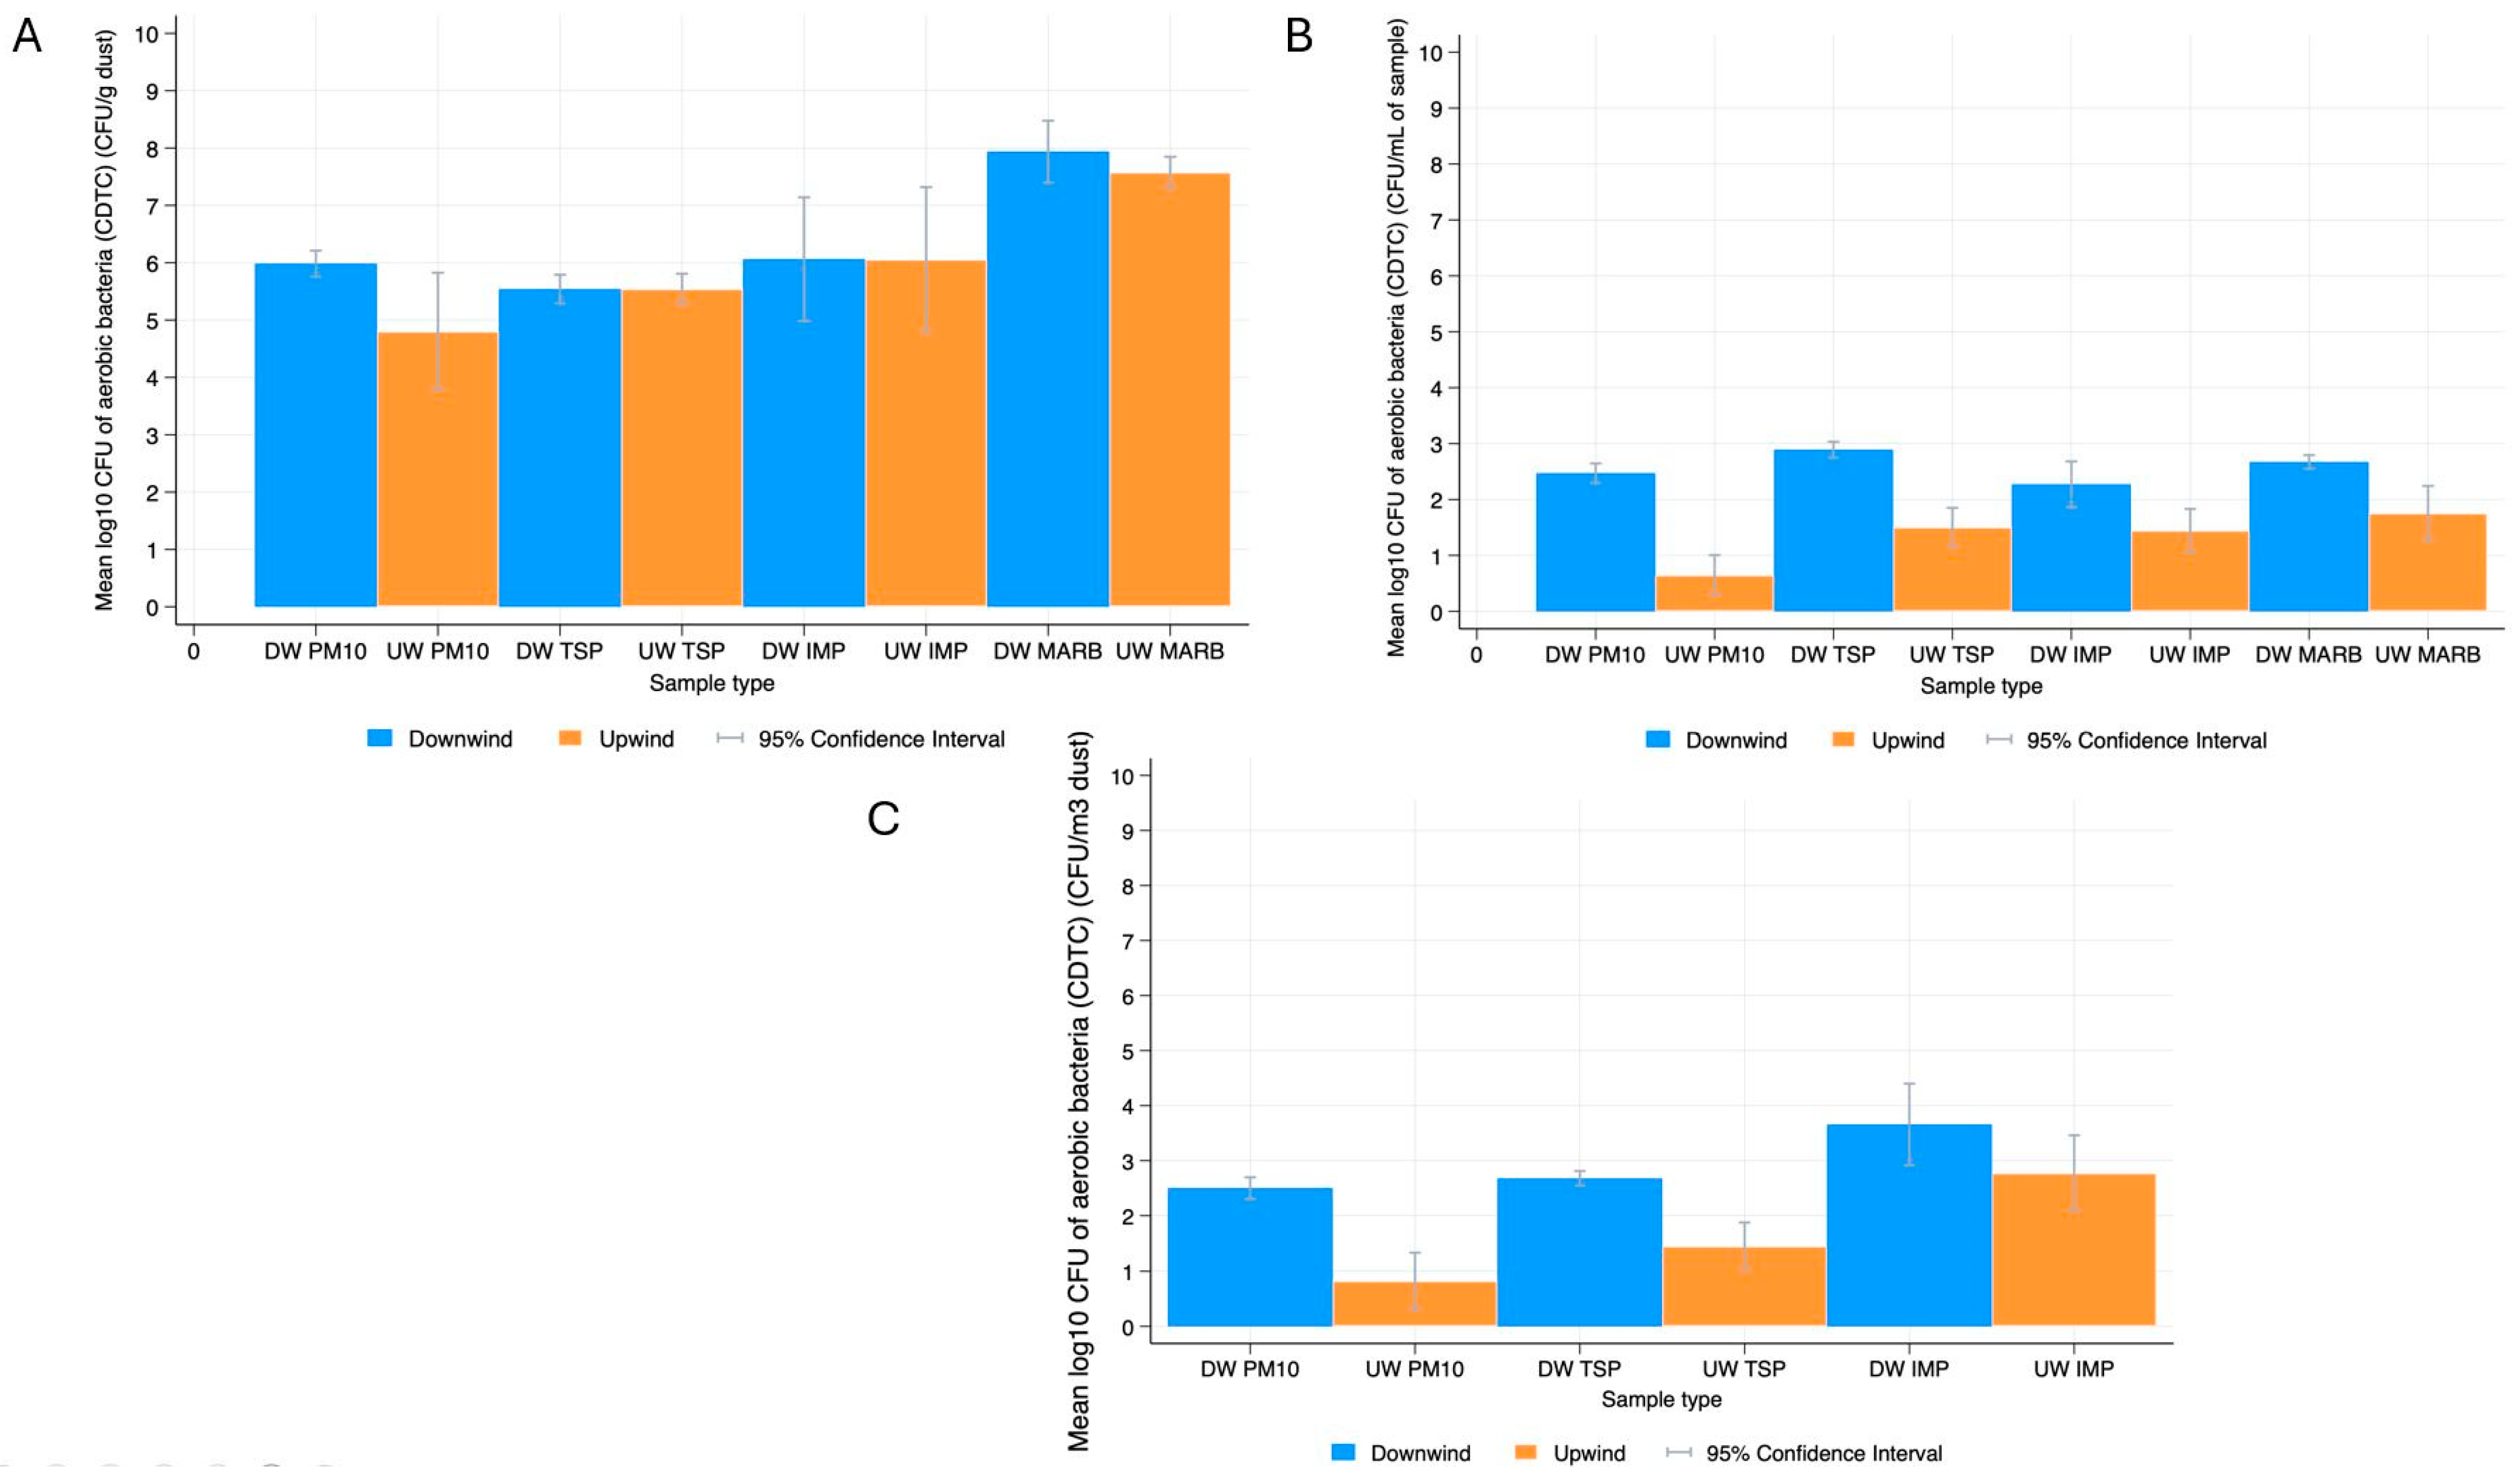
Aerobic Bacteria
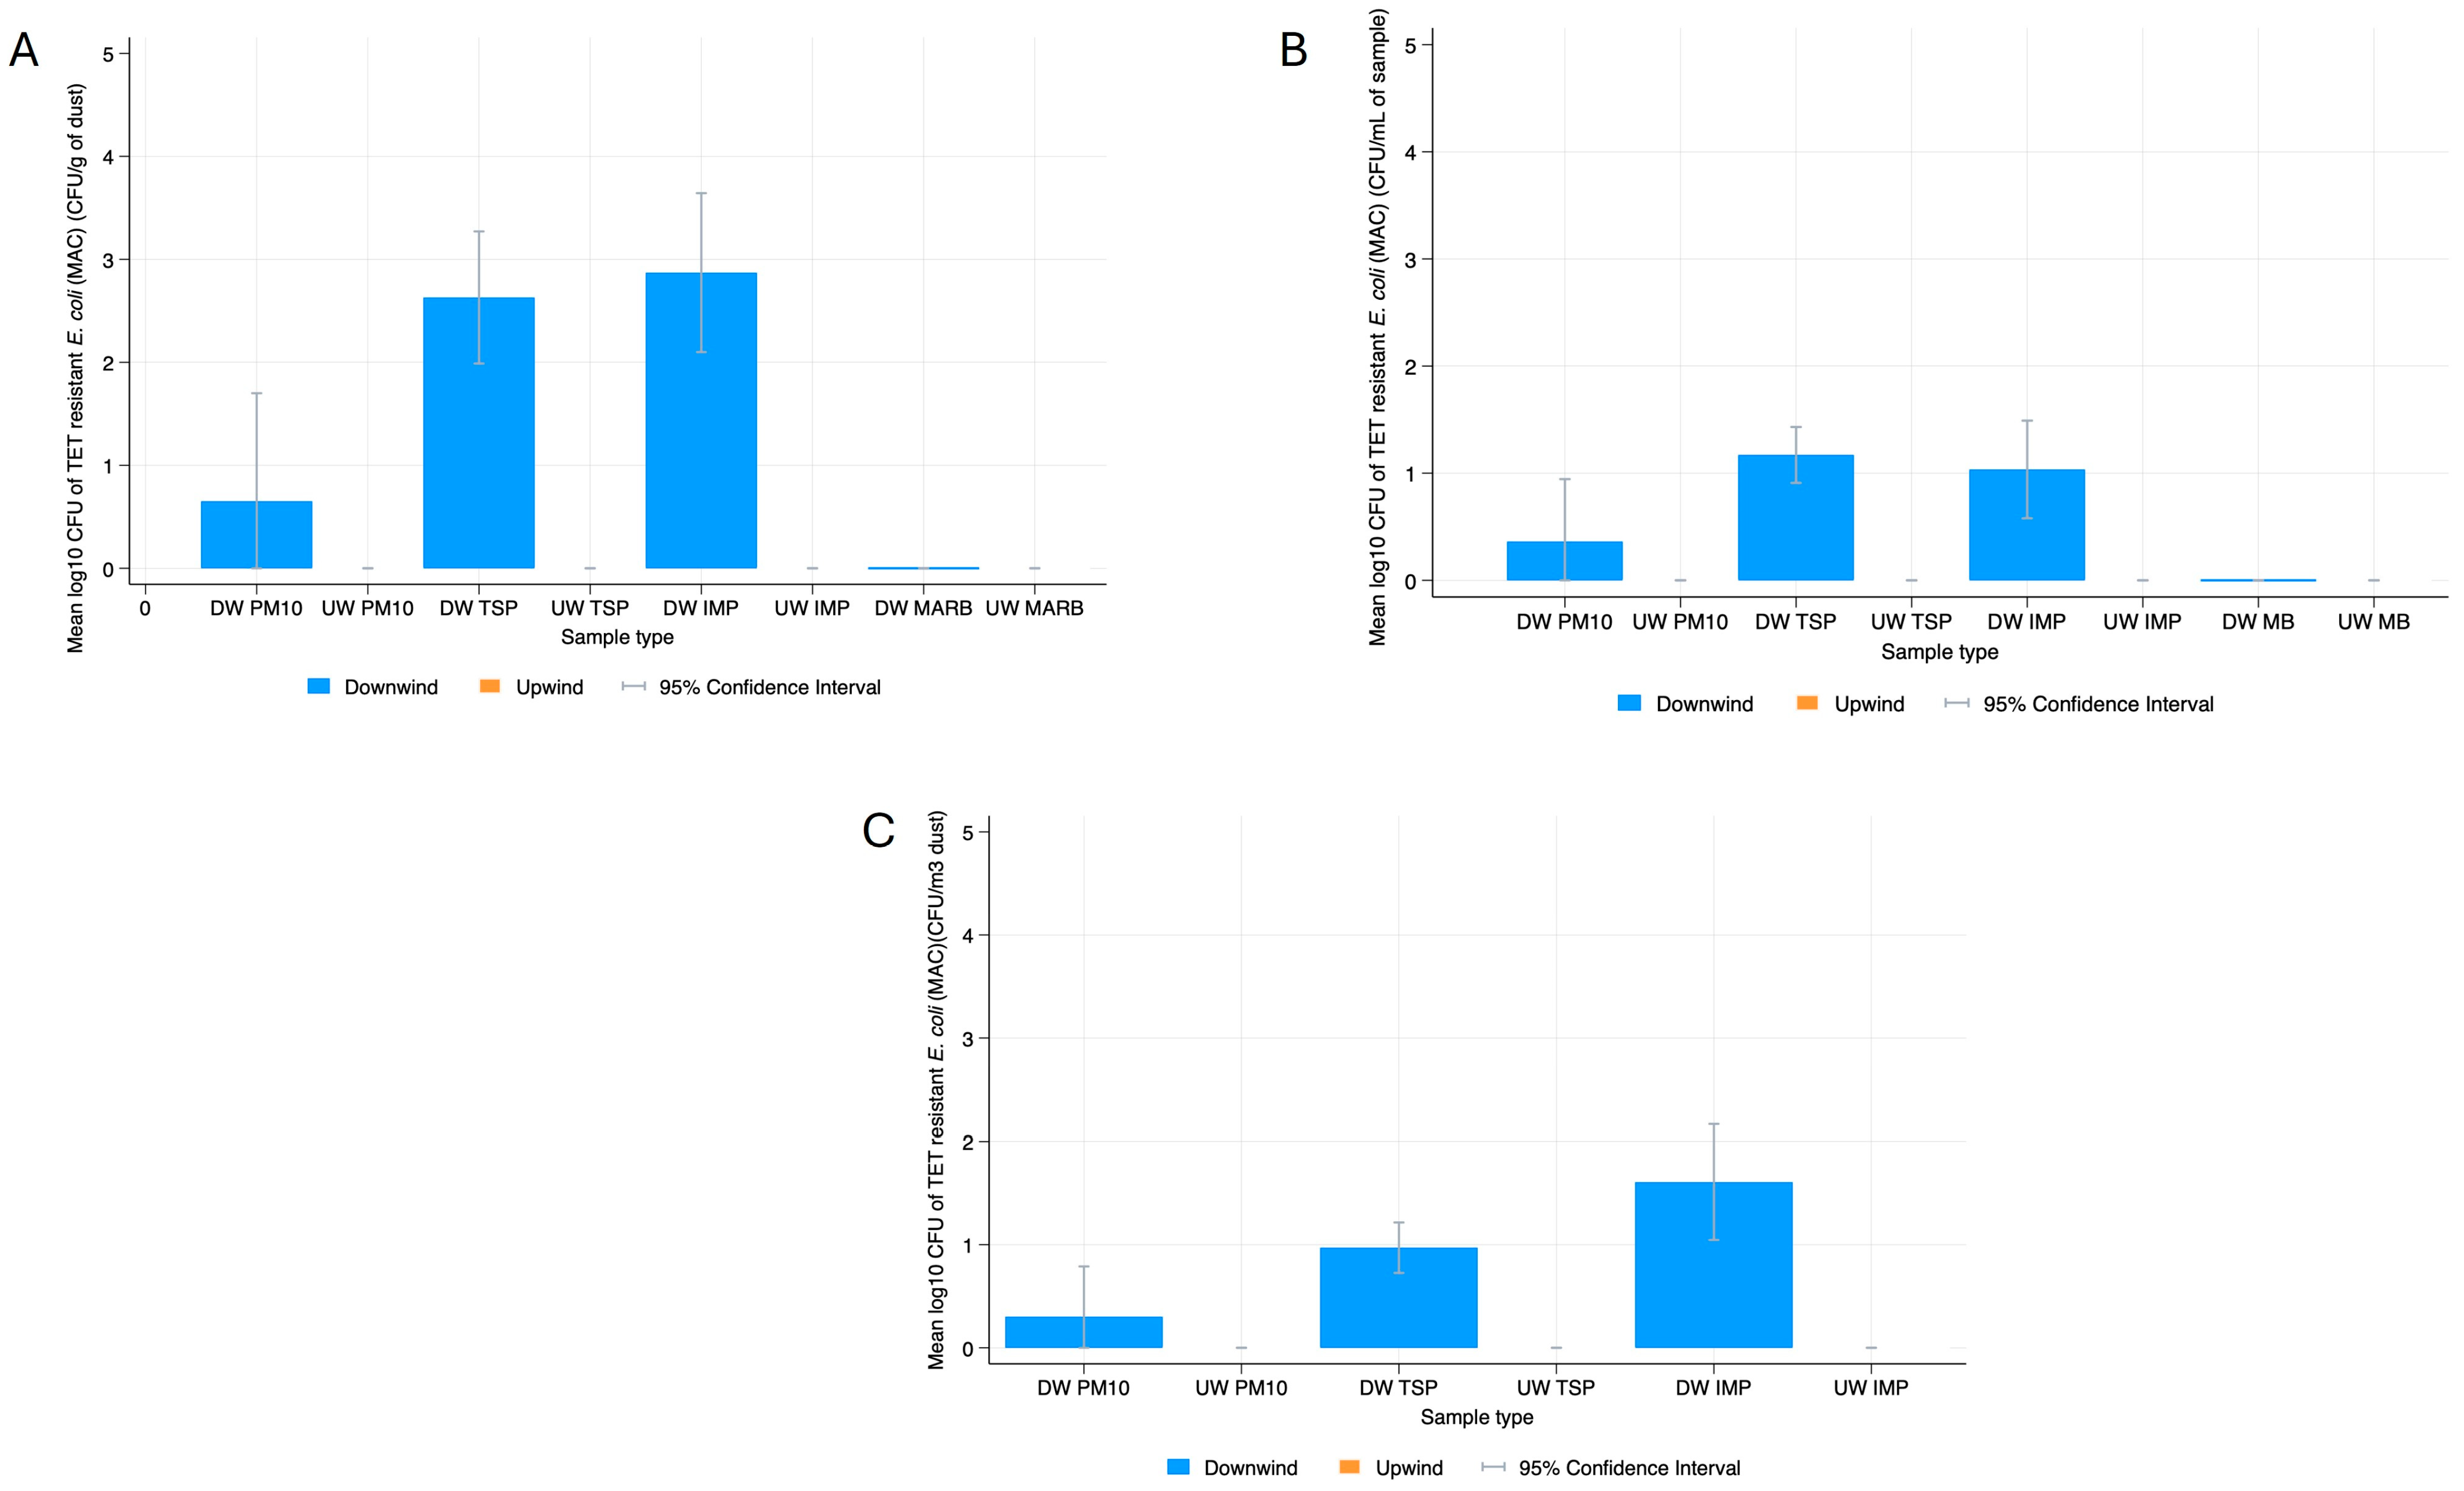
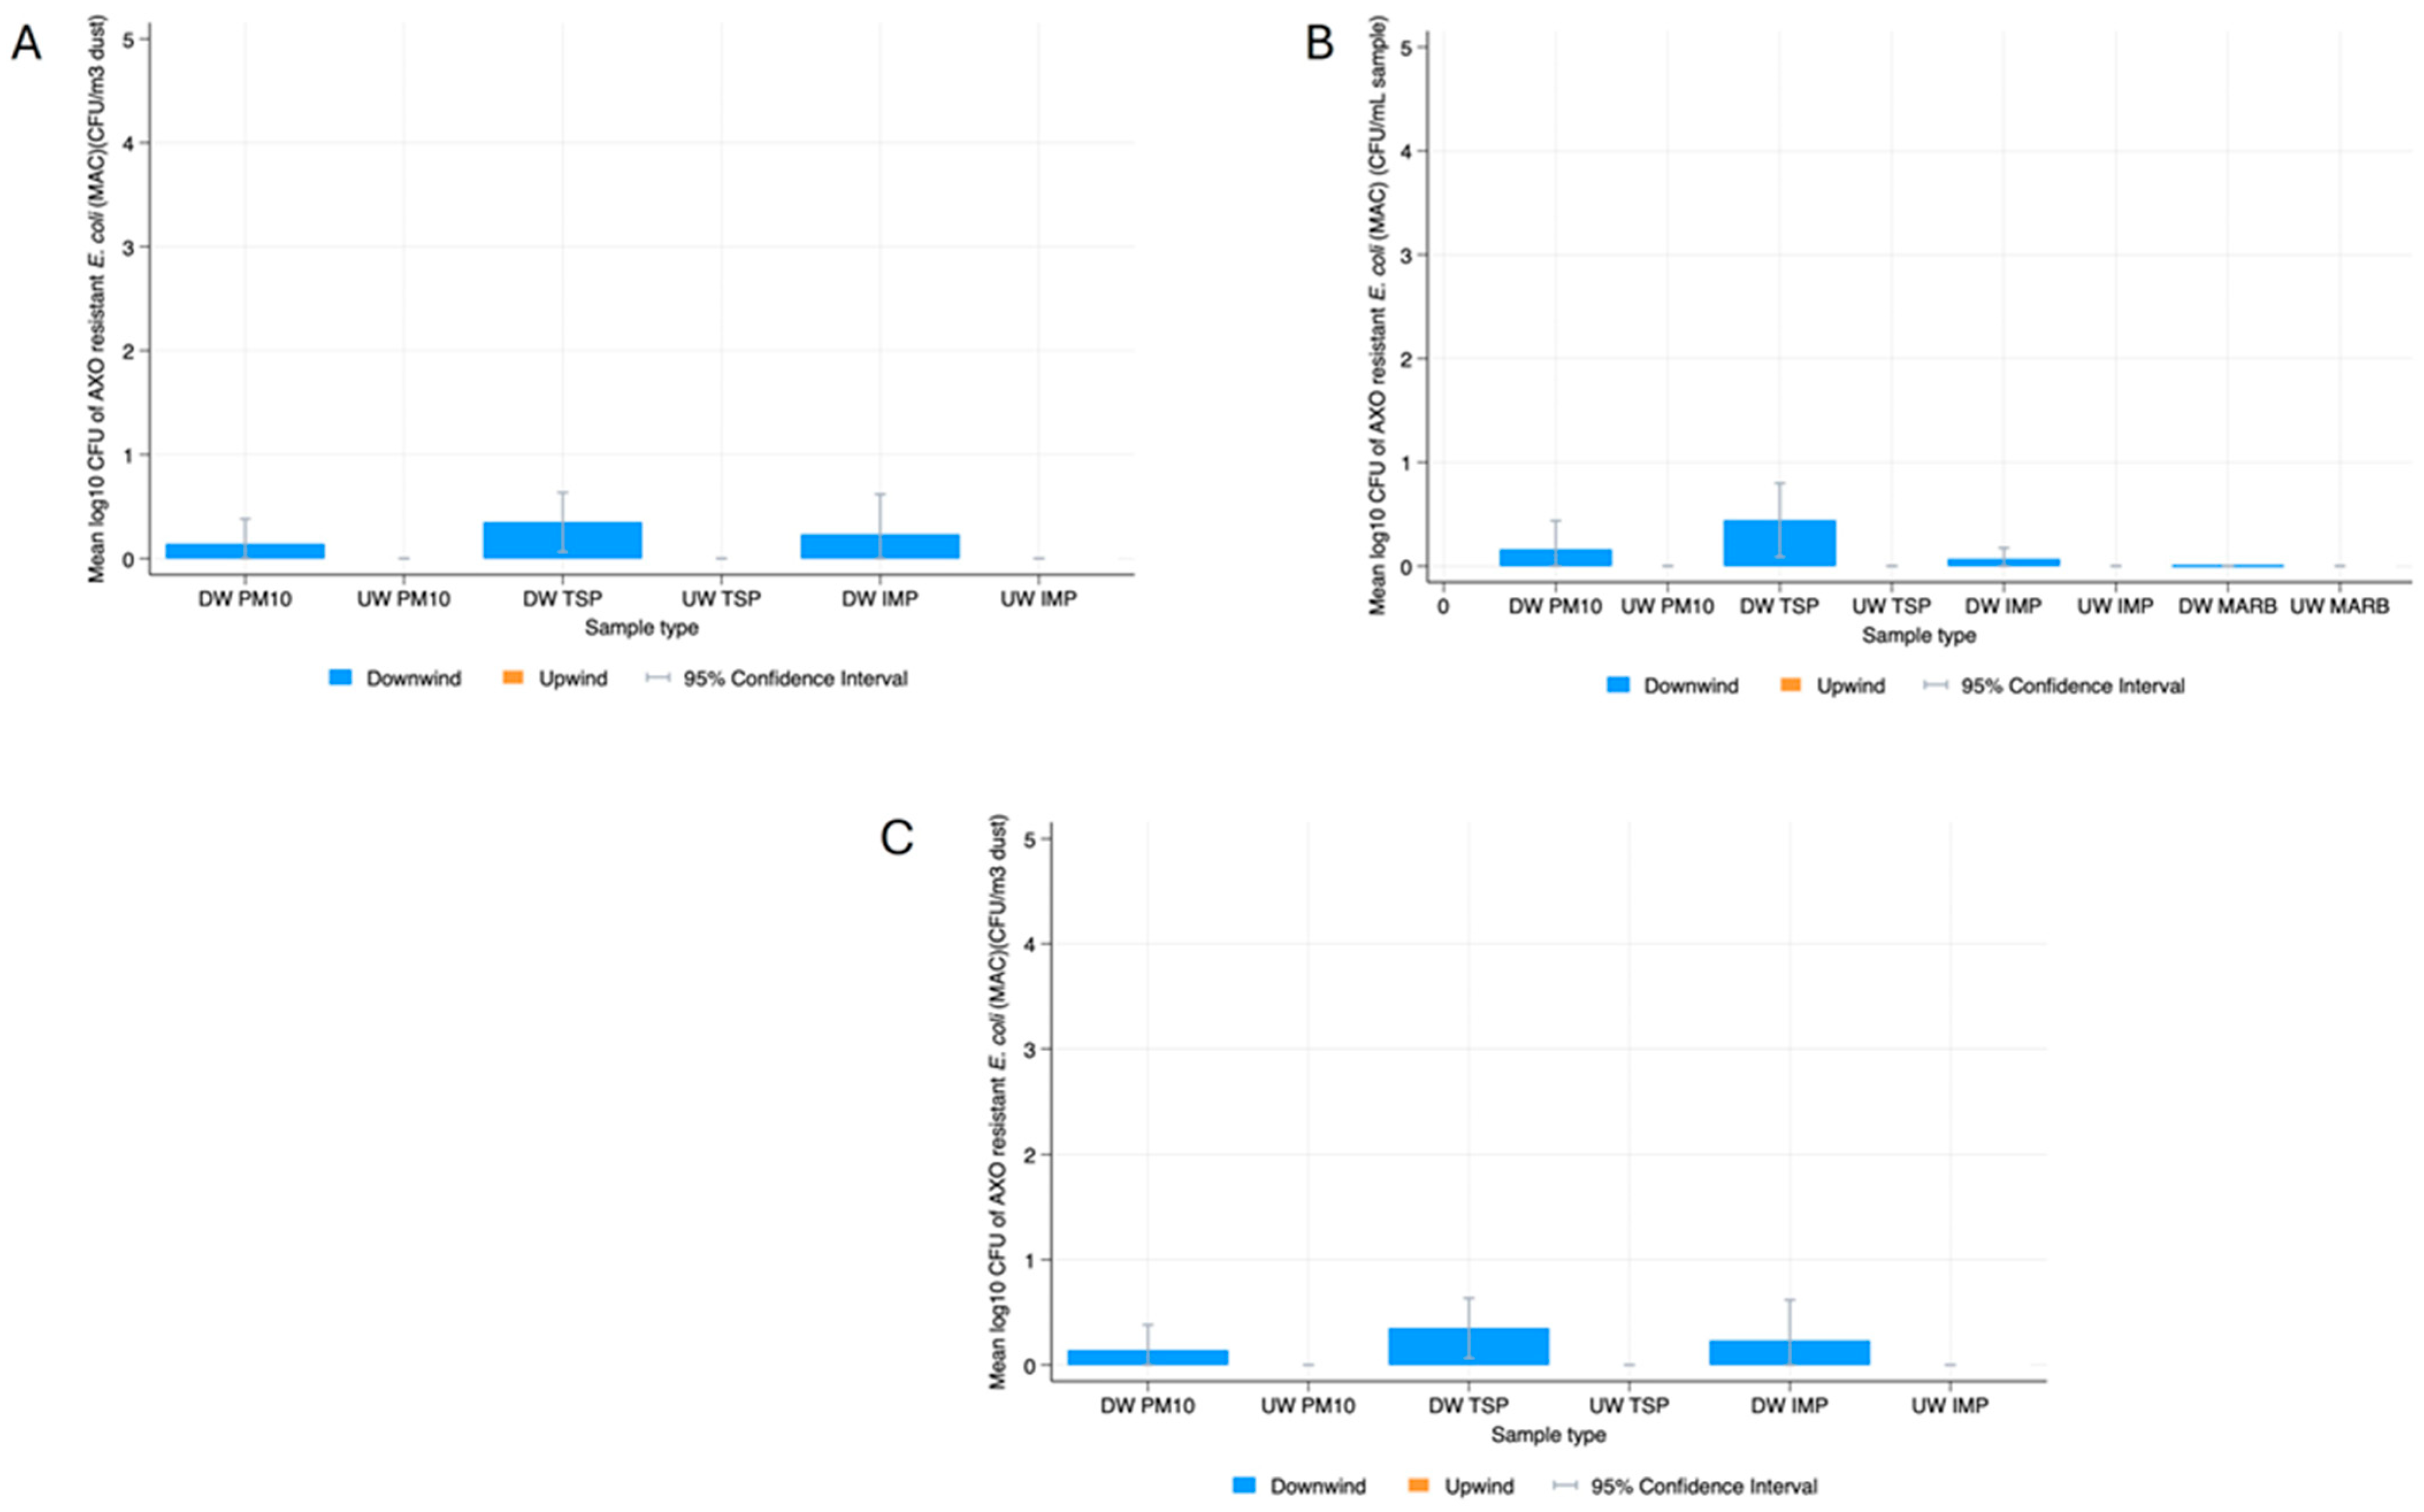
E. coli
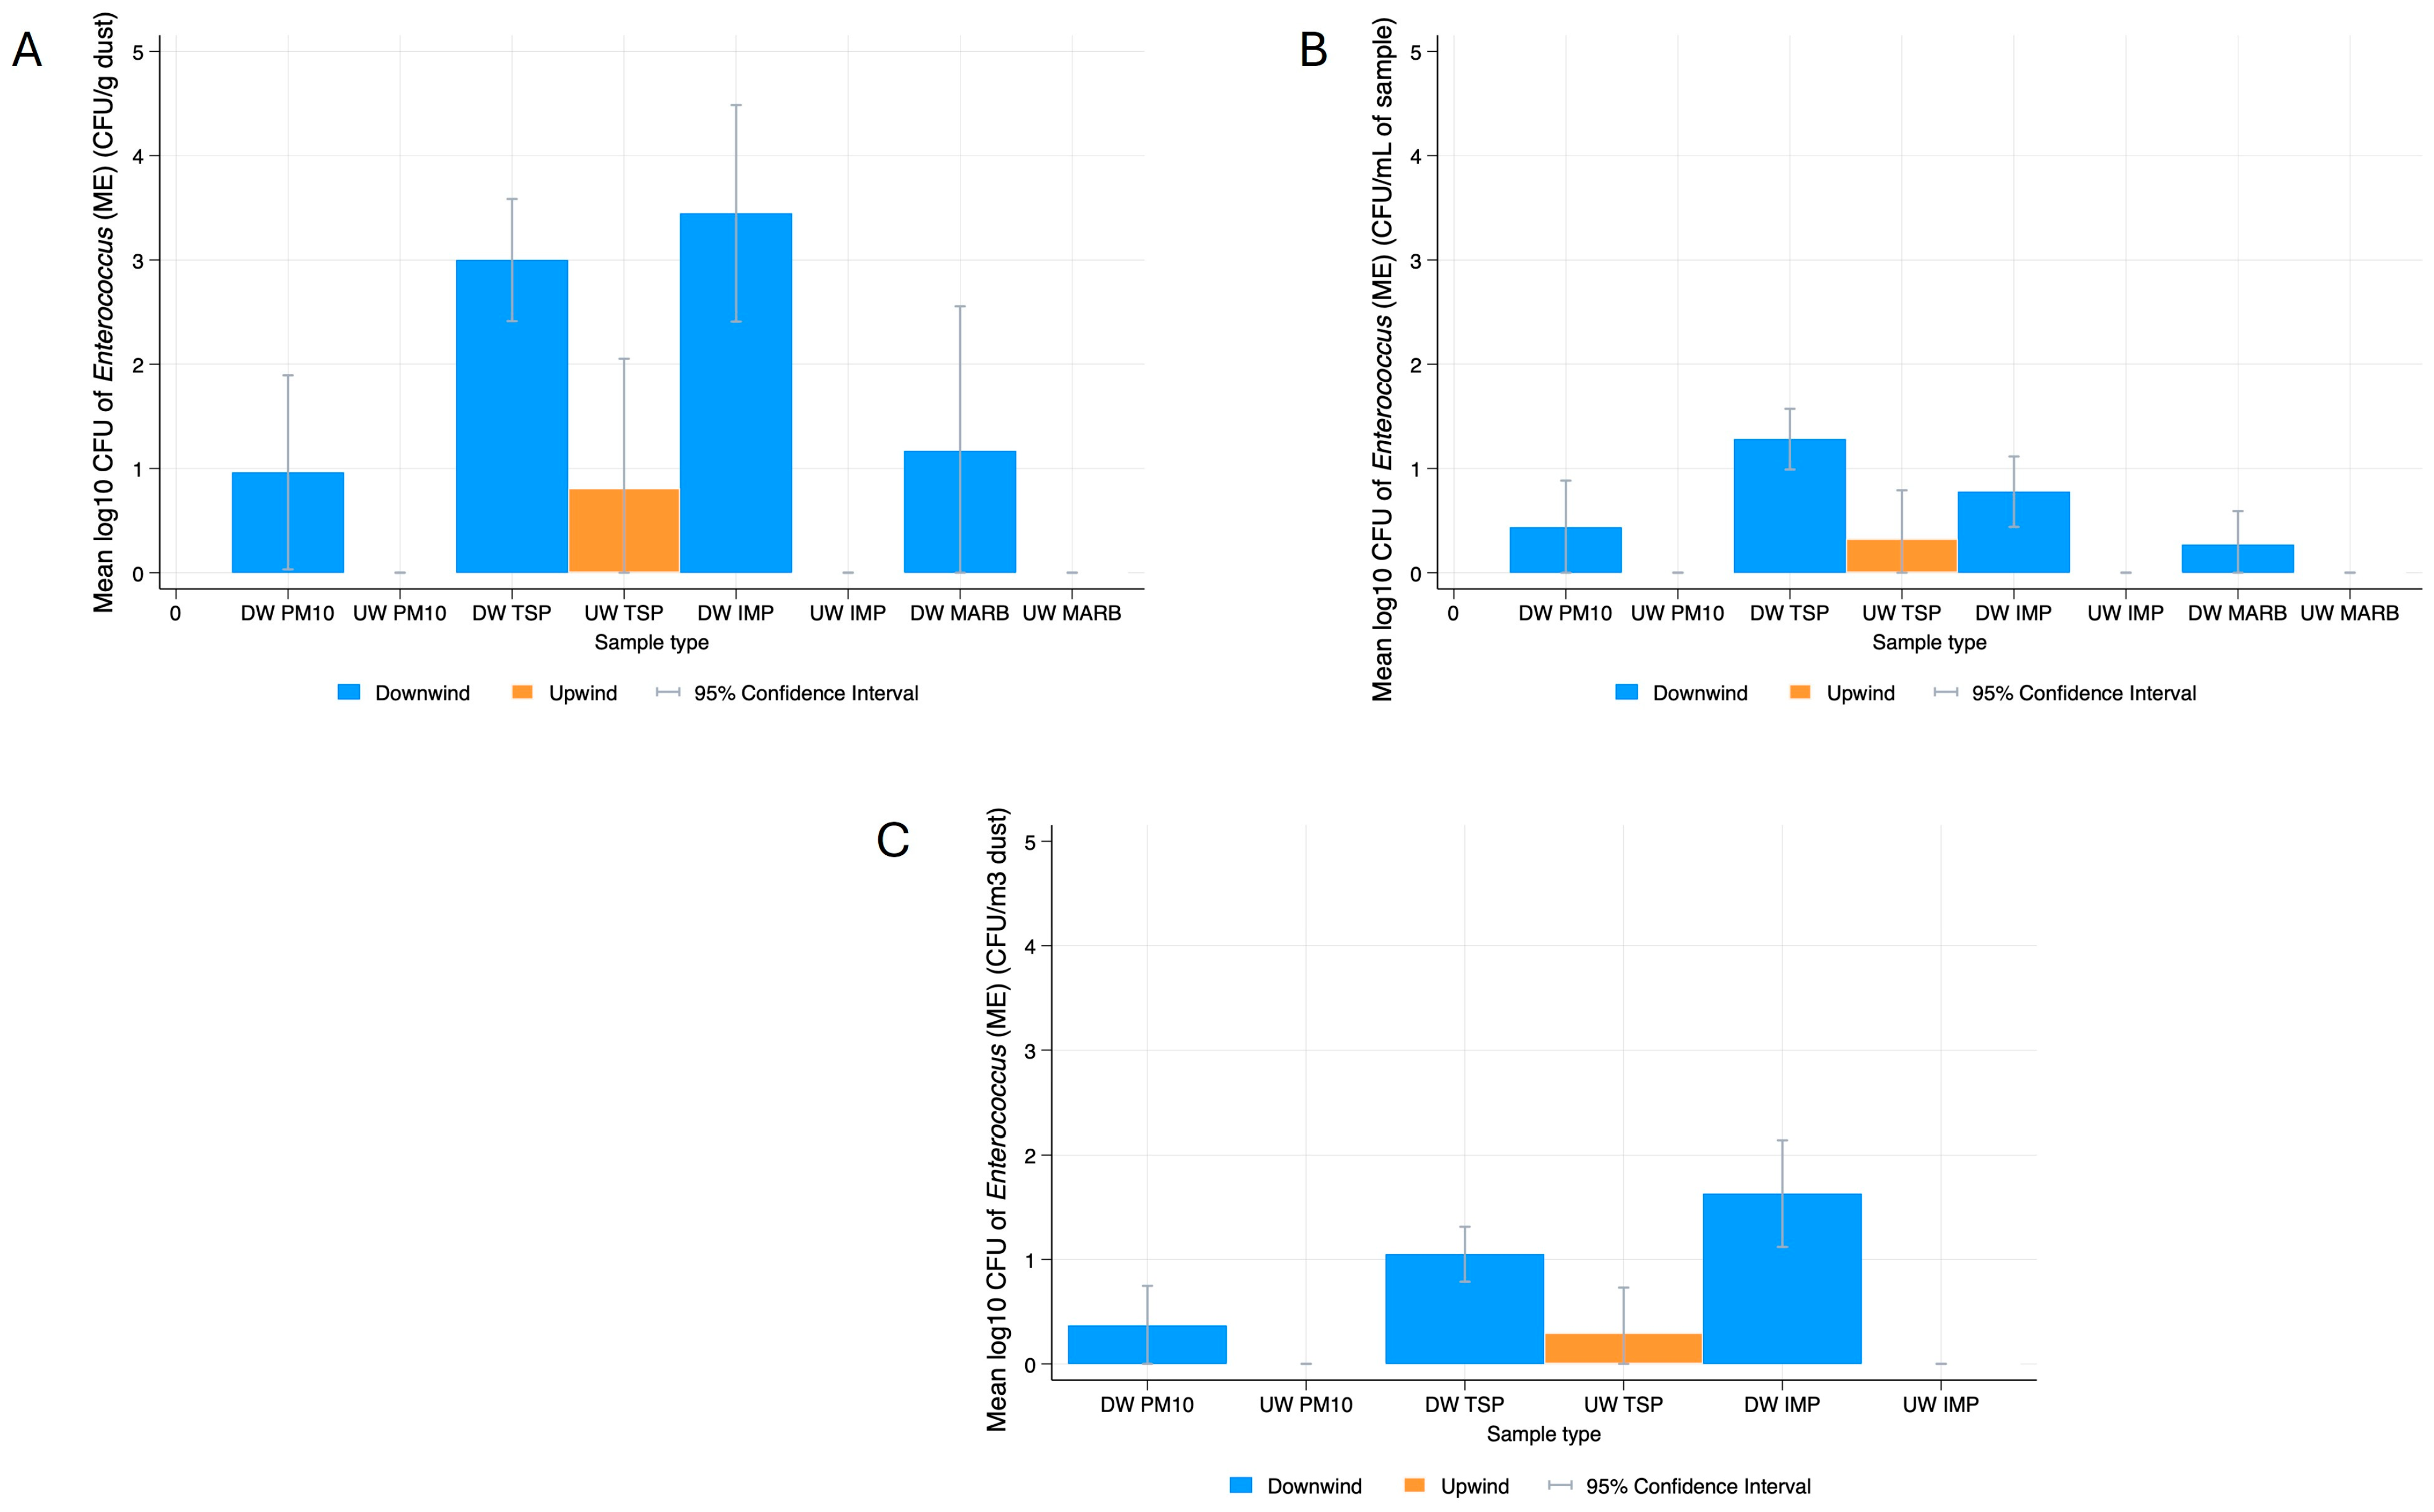
Enterococcus spp.
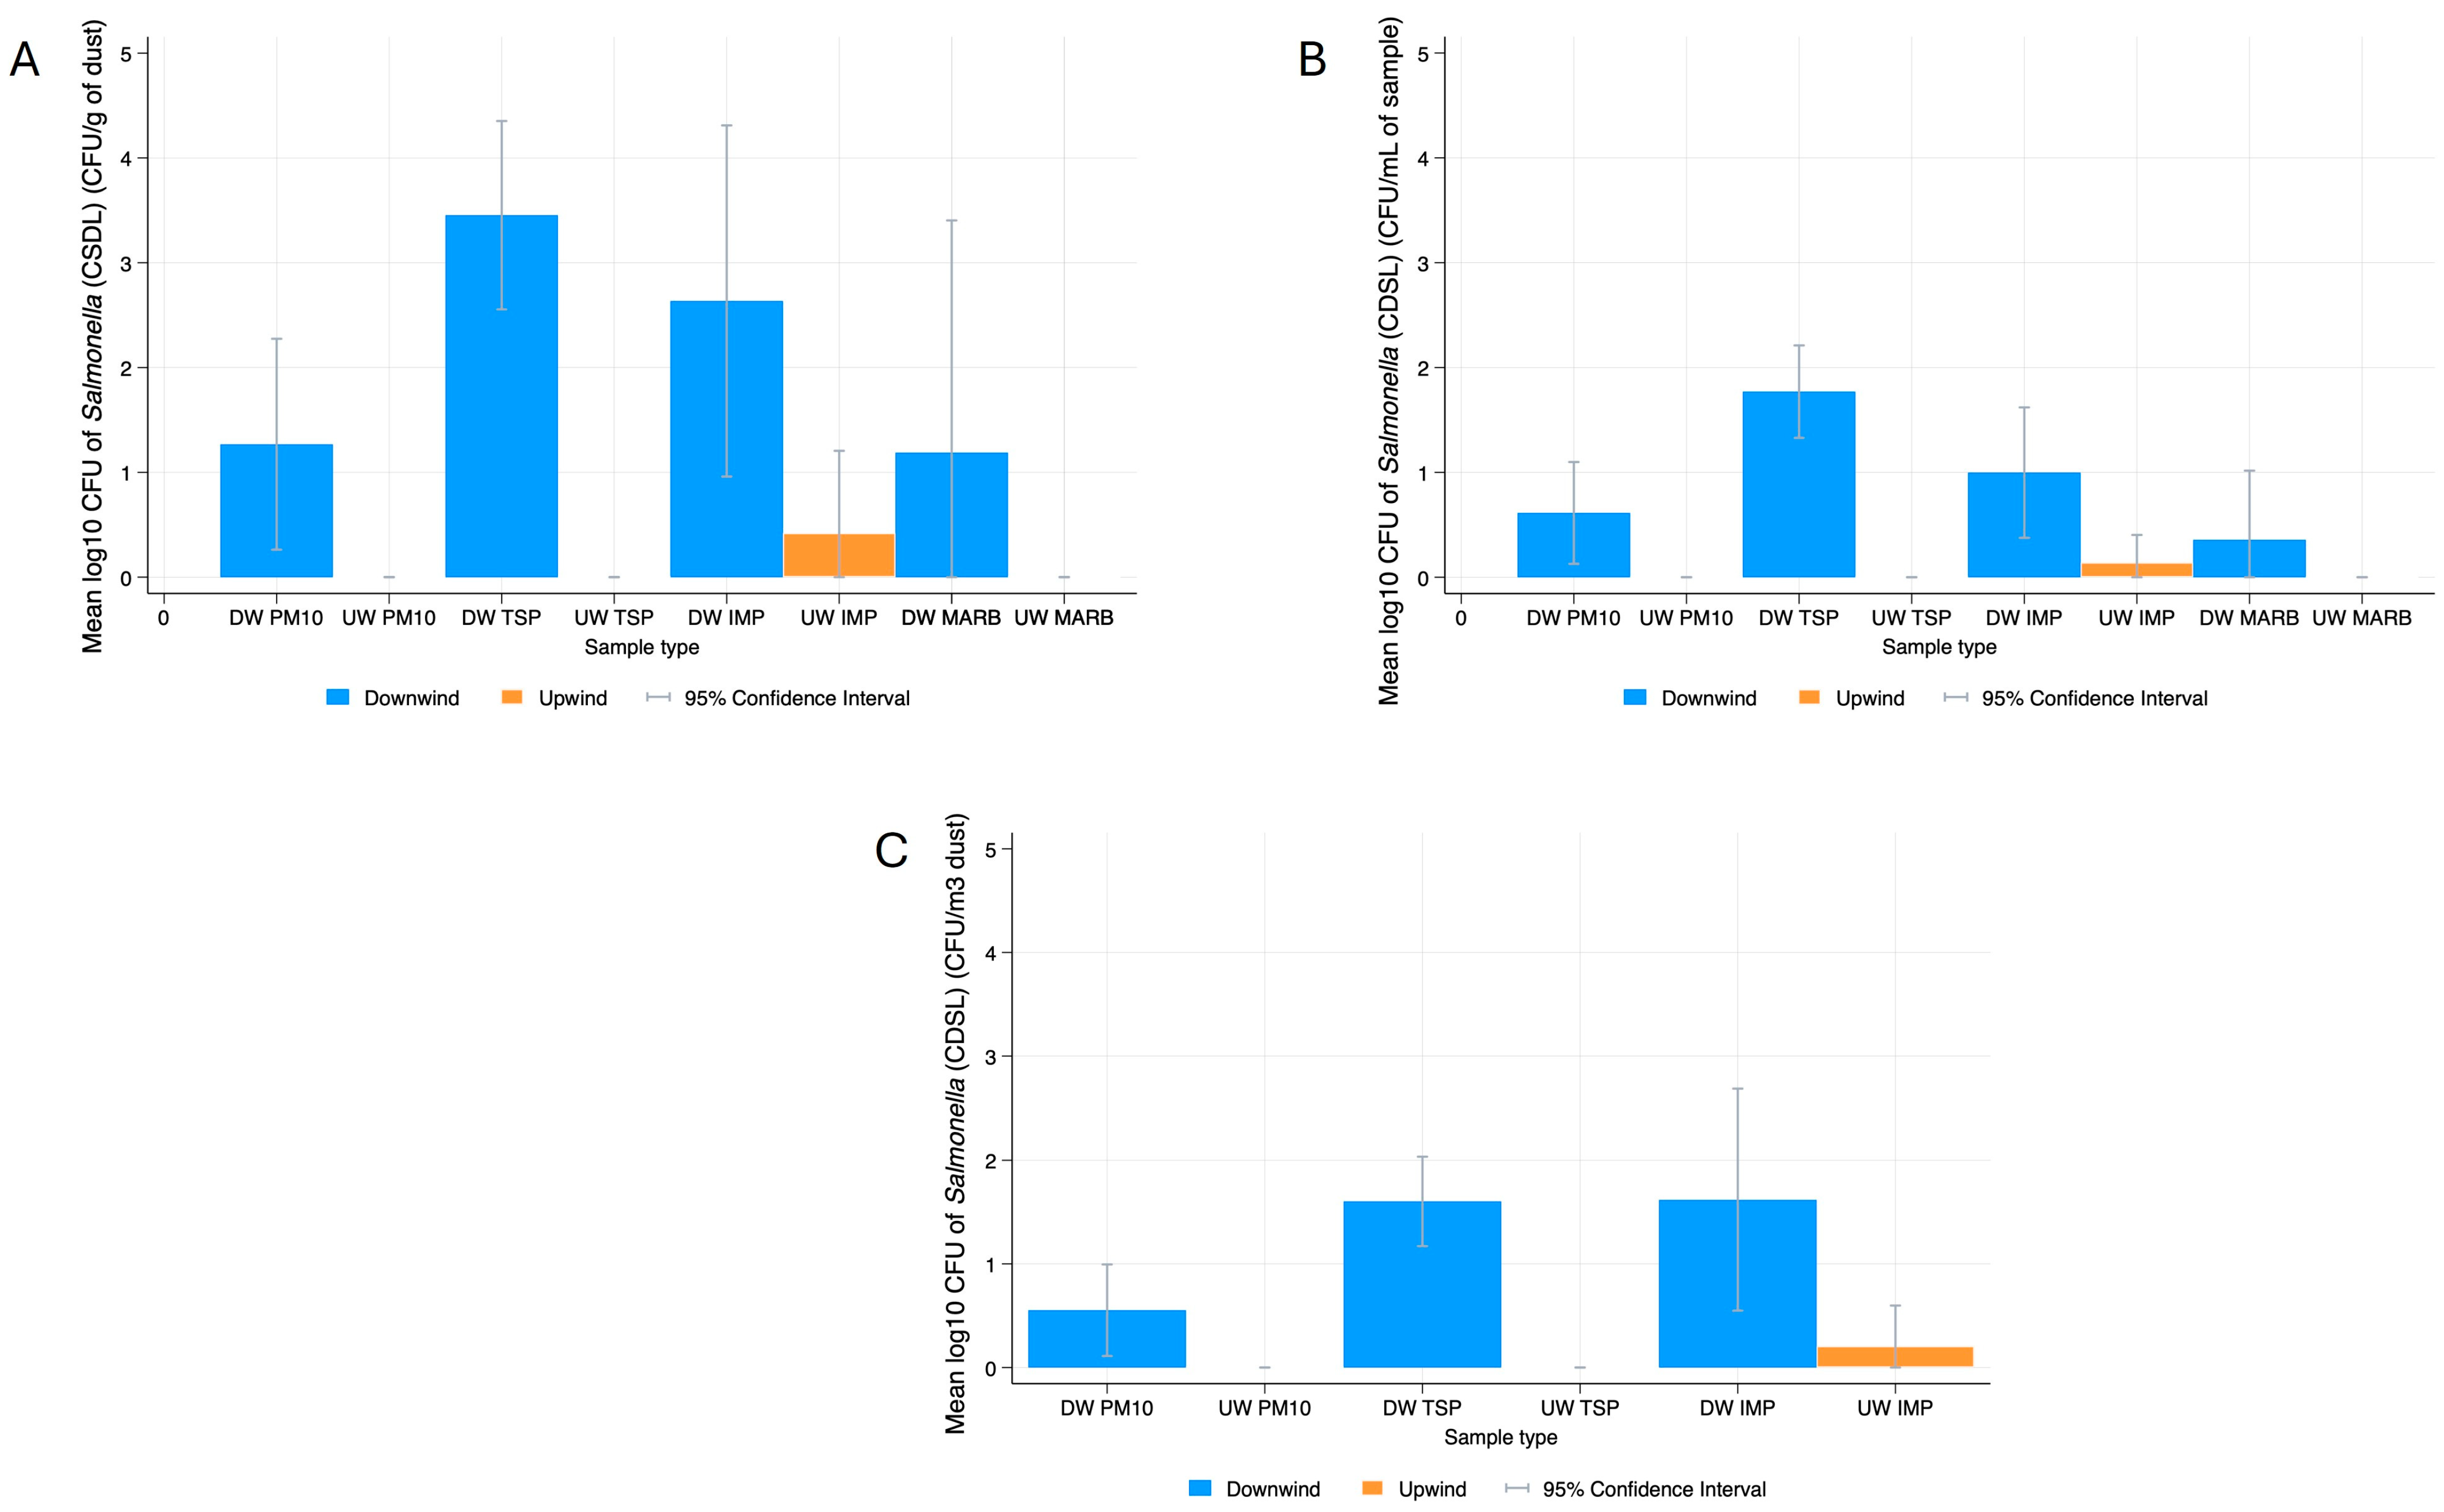
Salmonella
Coliforms
3.2. Bacterial Resistance Gene Quantification in Dust
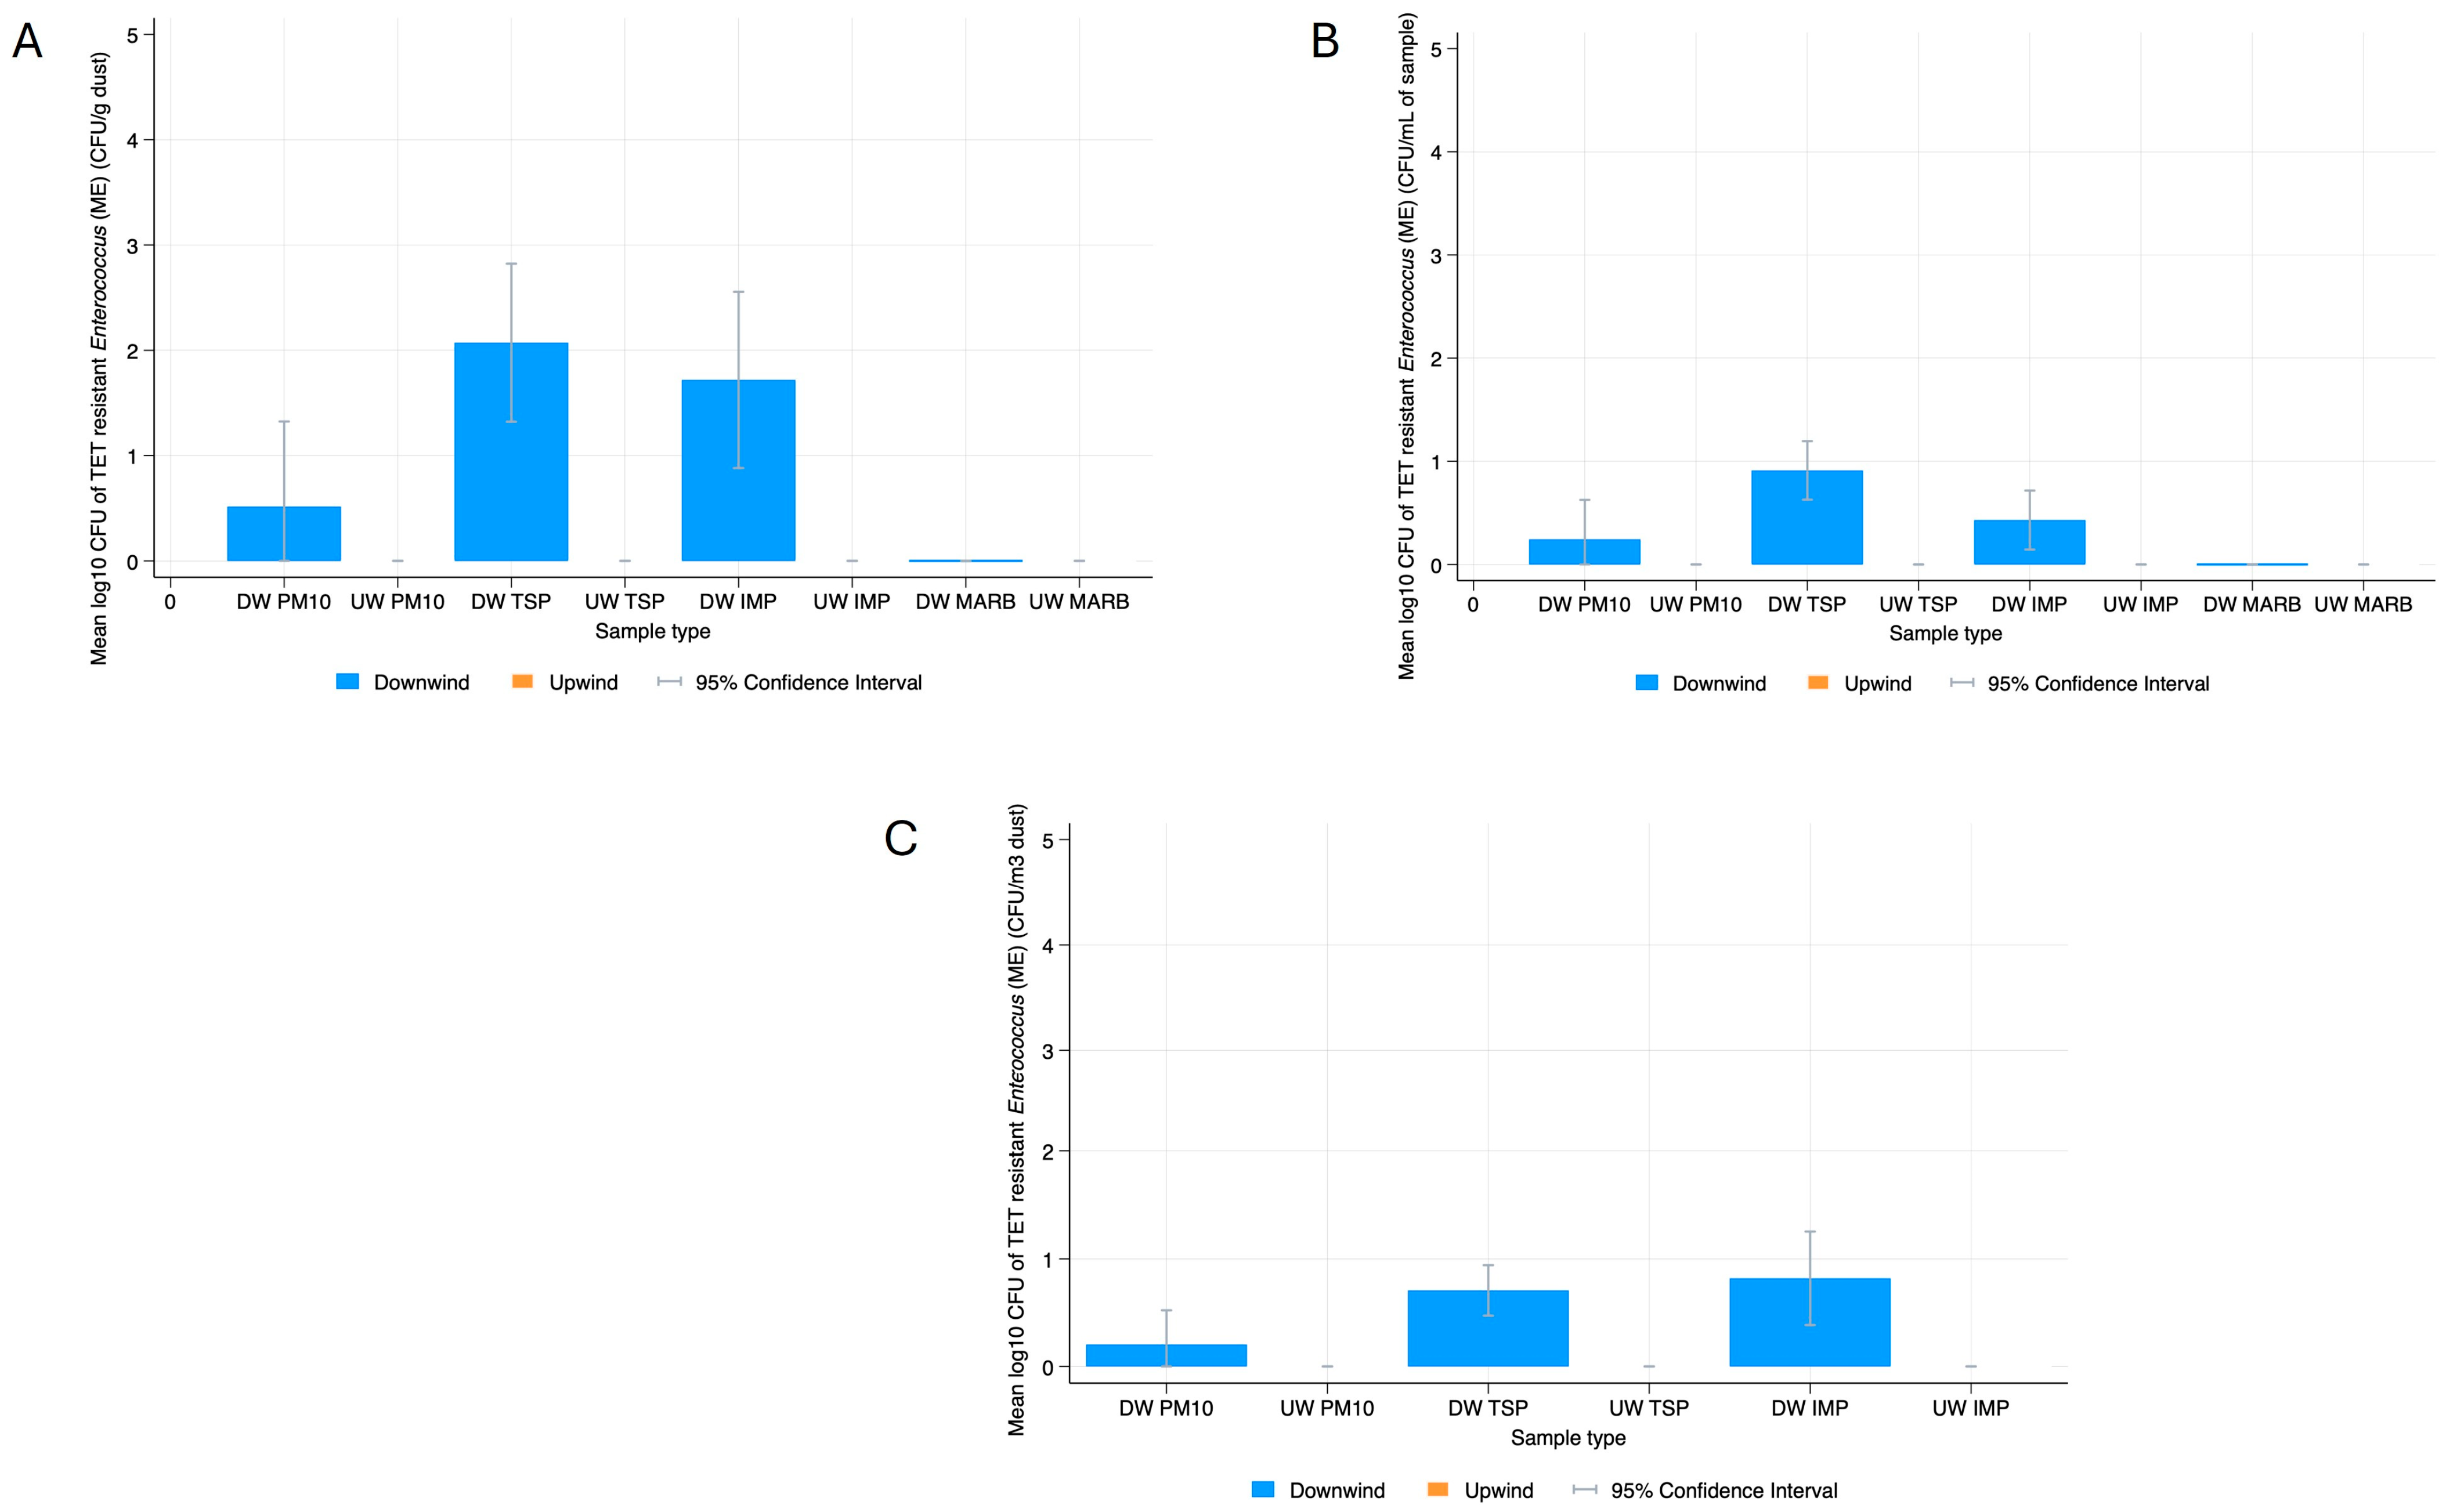
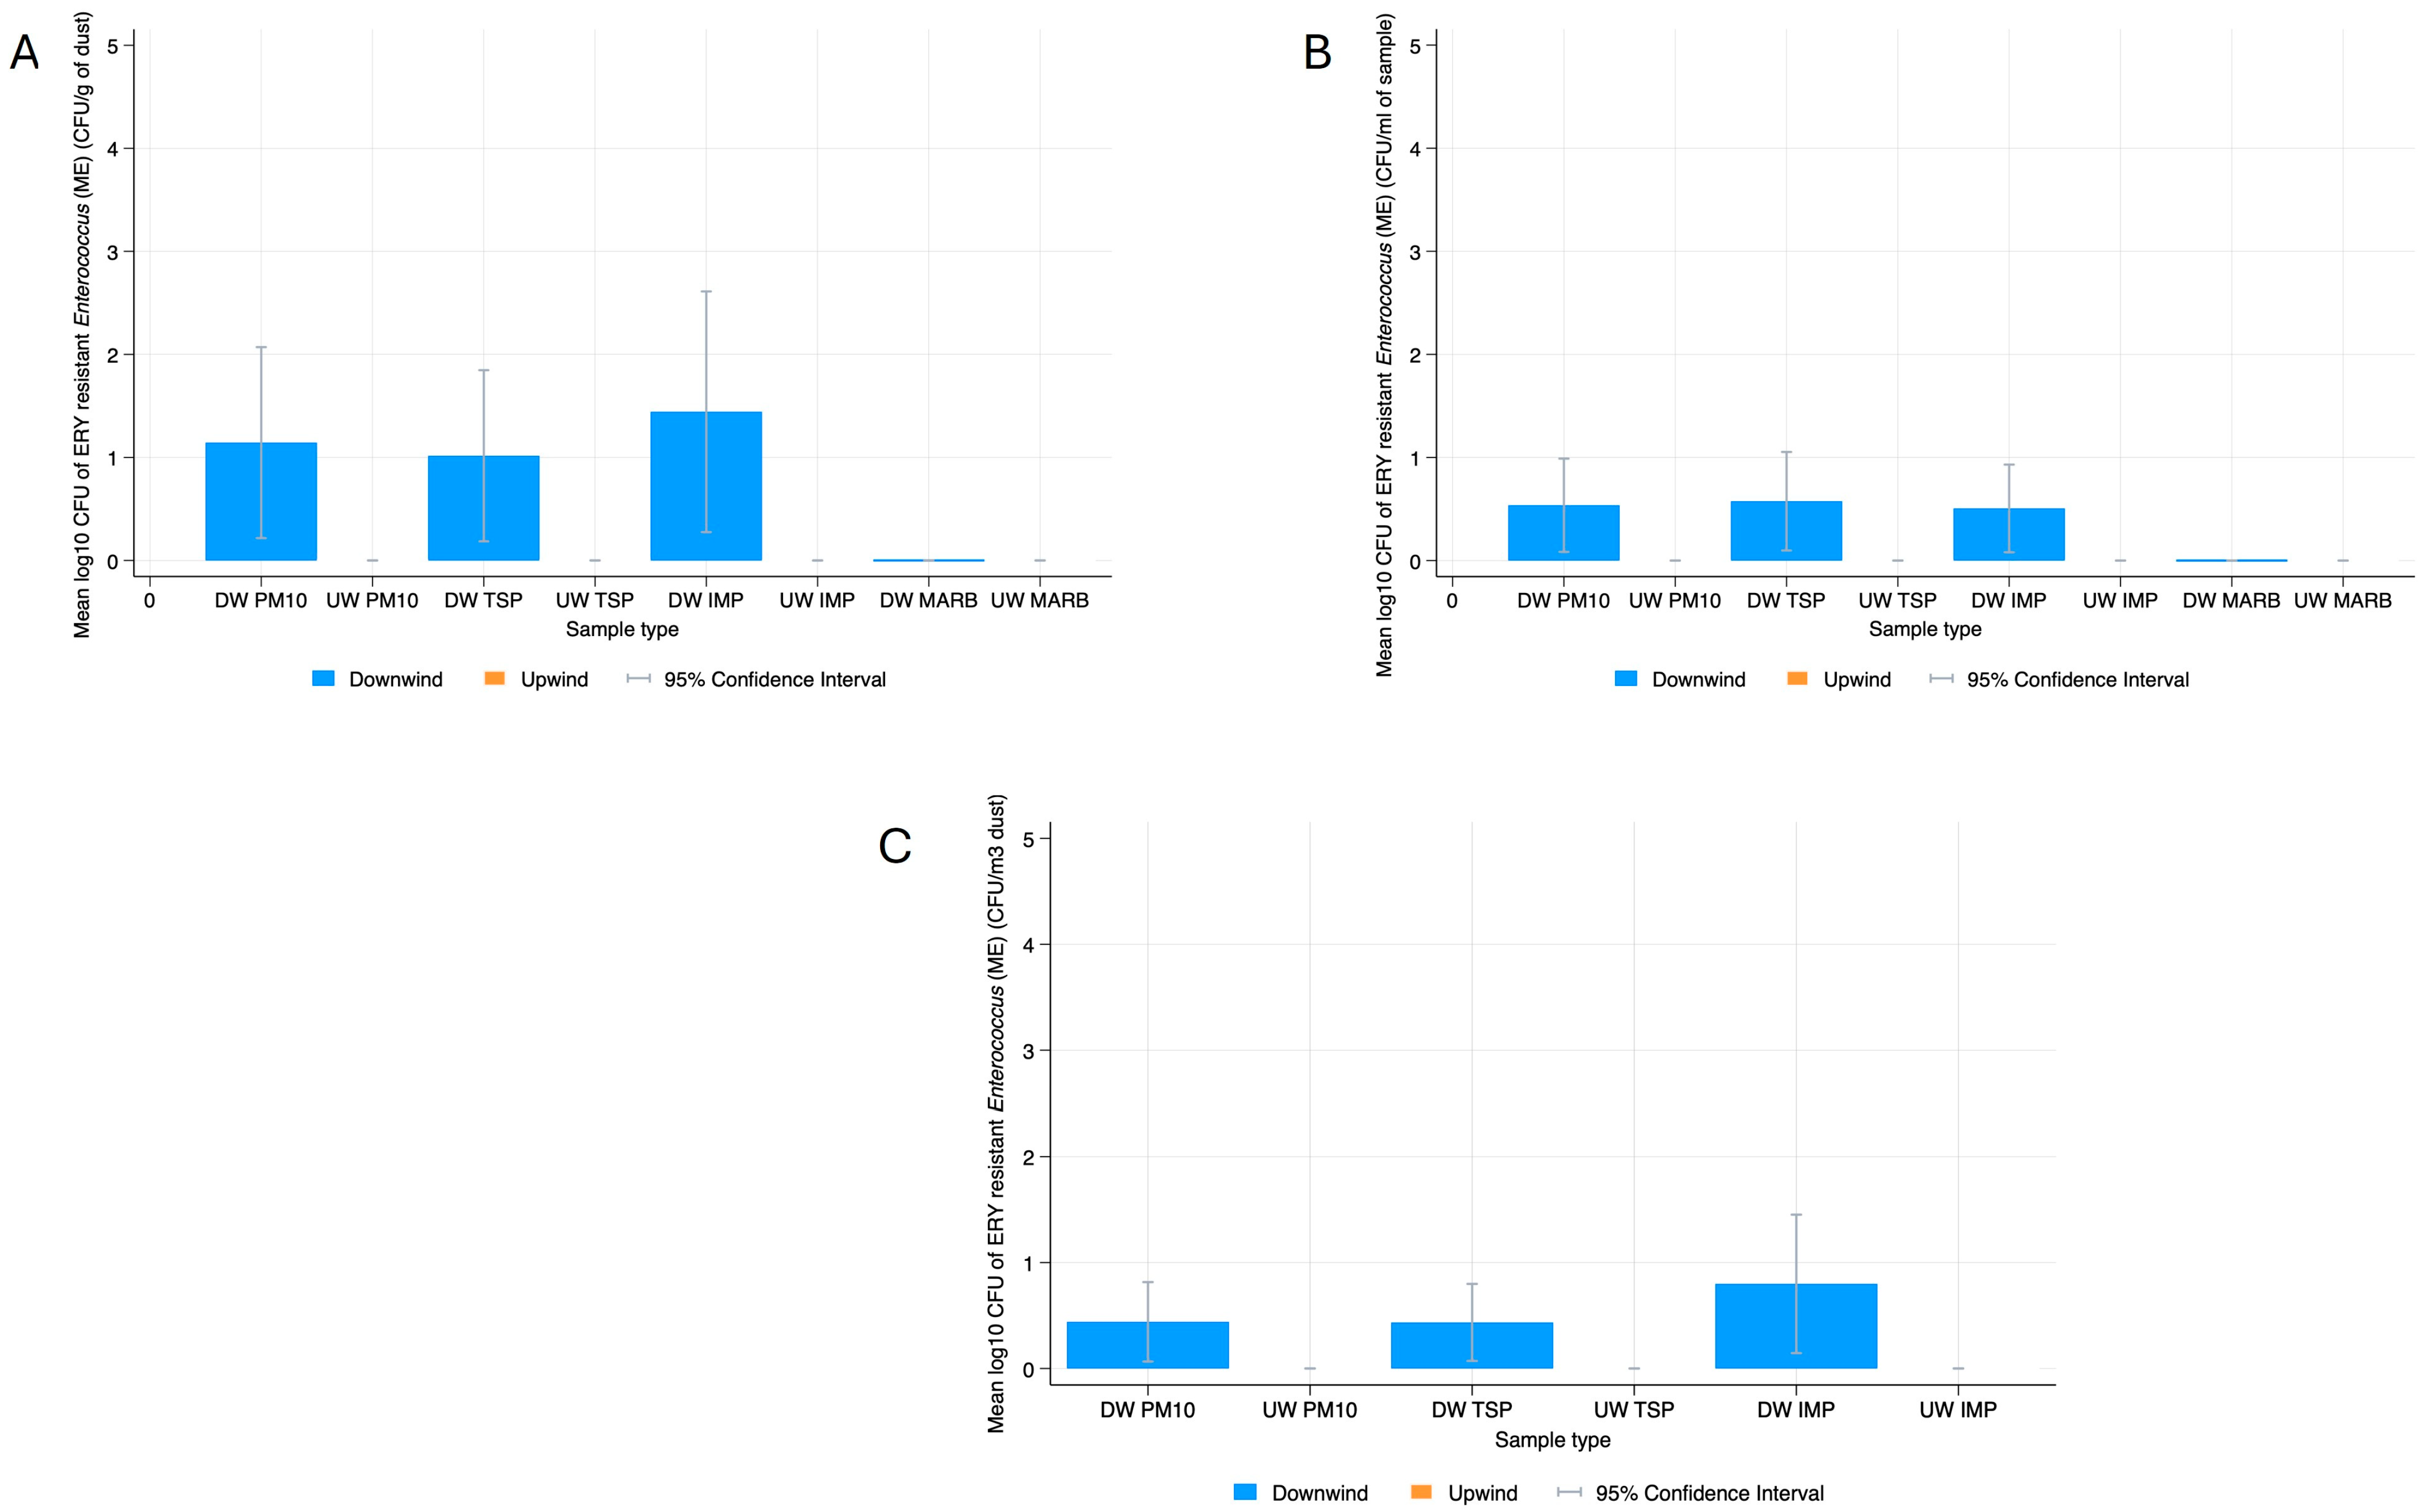
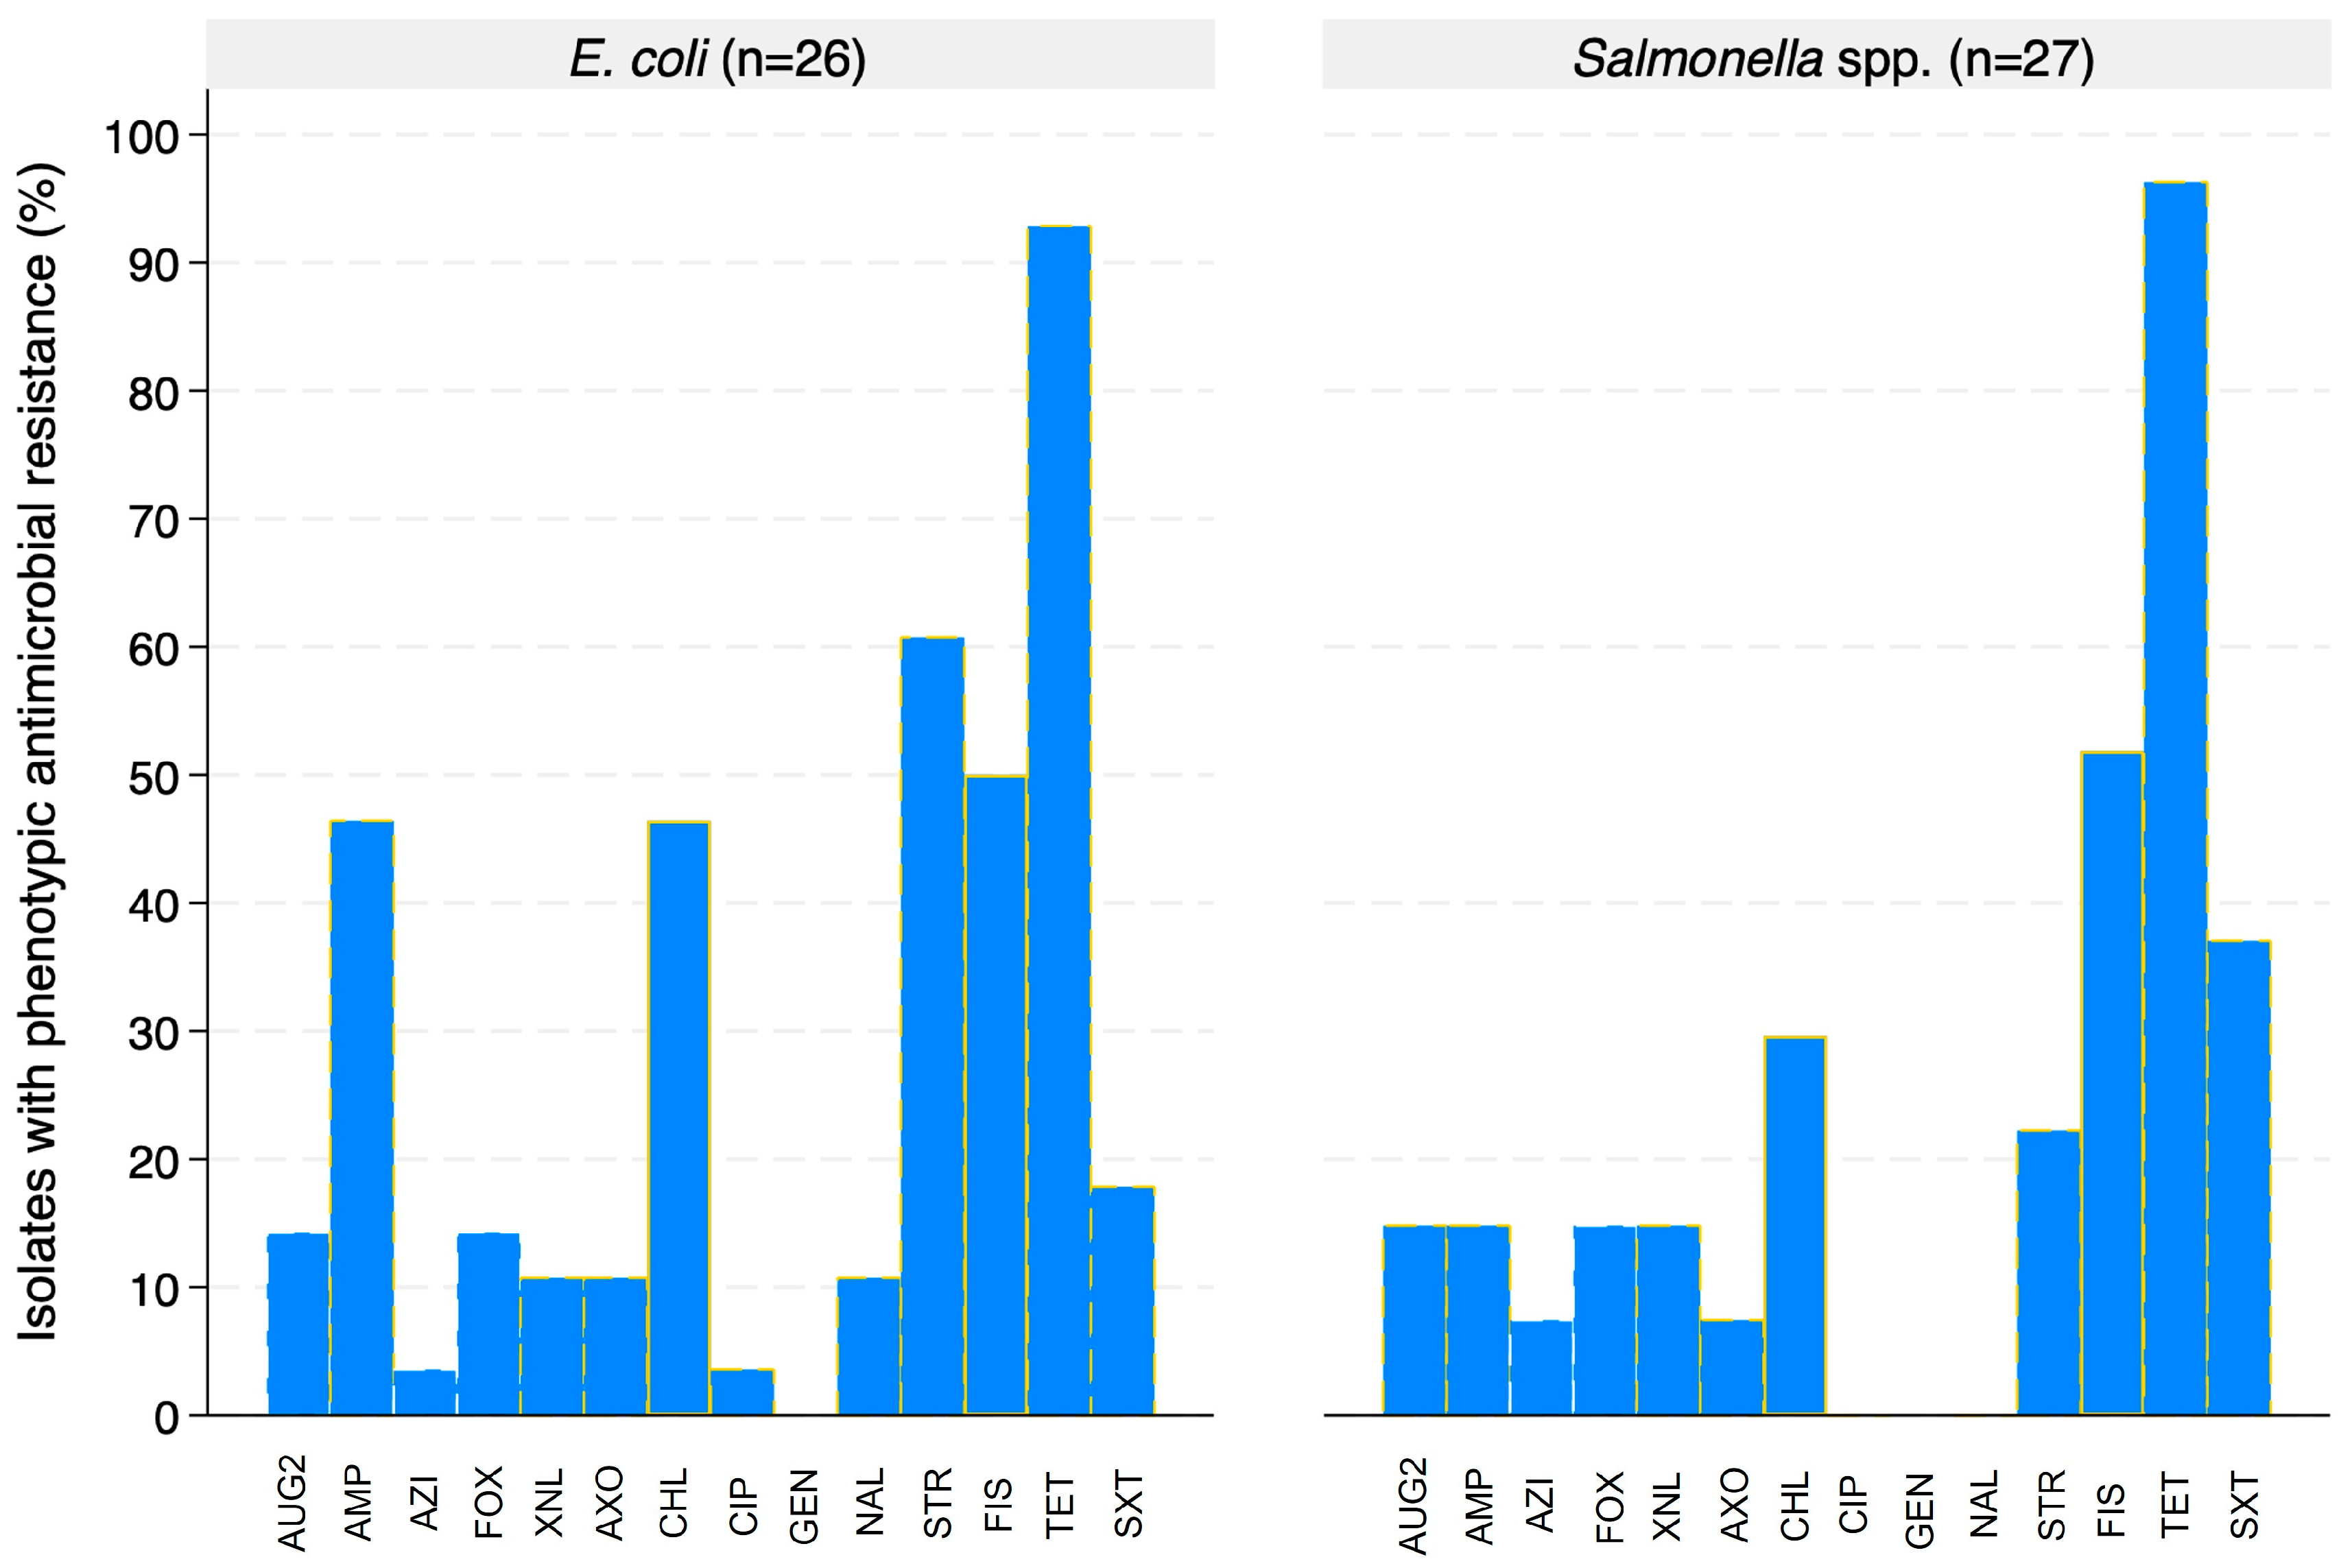
3.3. Phenotypic Characterization
Evaluation of Antimicrobial Resistance in E. coli and Salmonella
3.4. Genotypic Characterization
3.4.1. Antimicrobial Resistance Genes
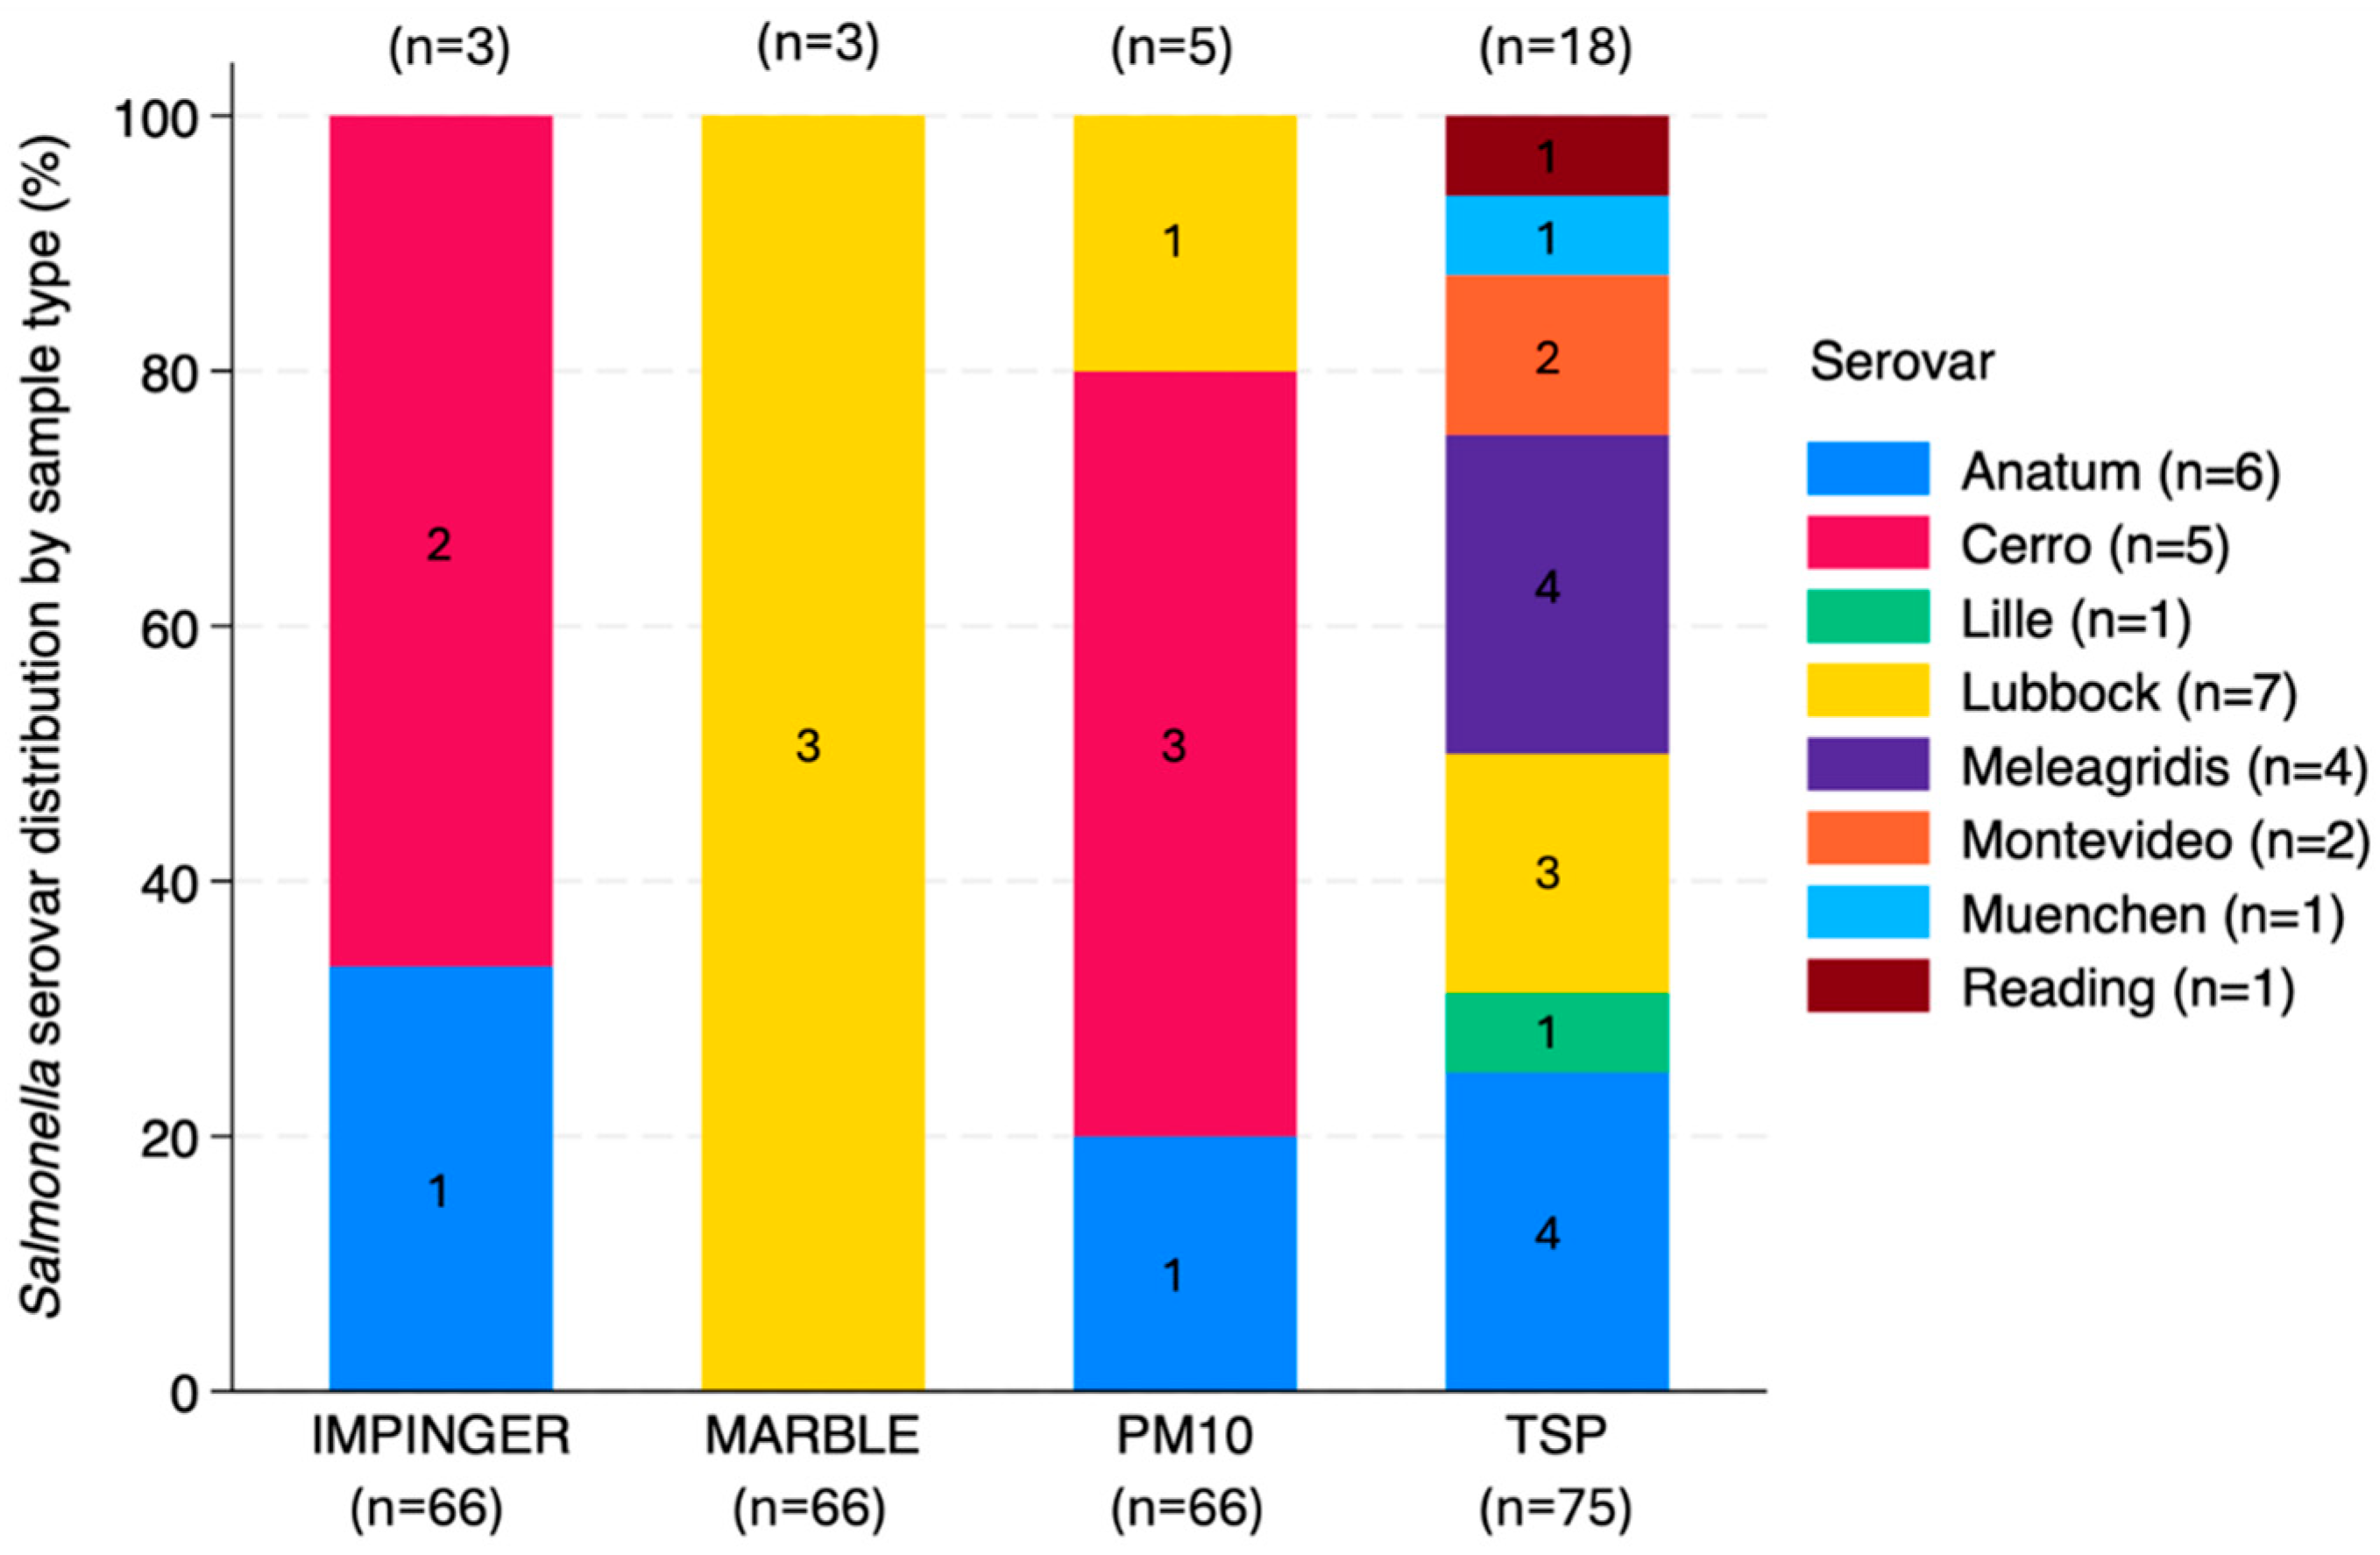
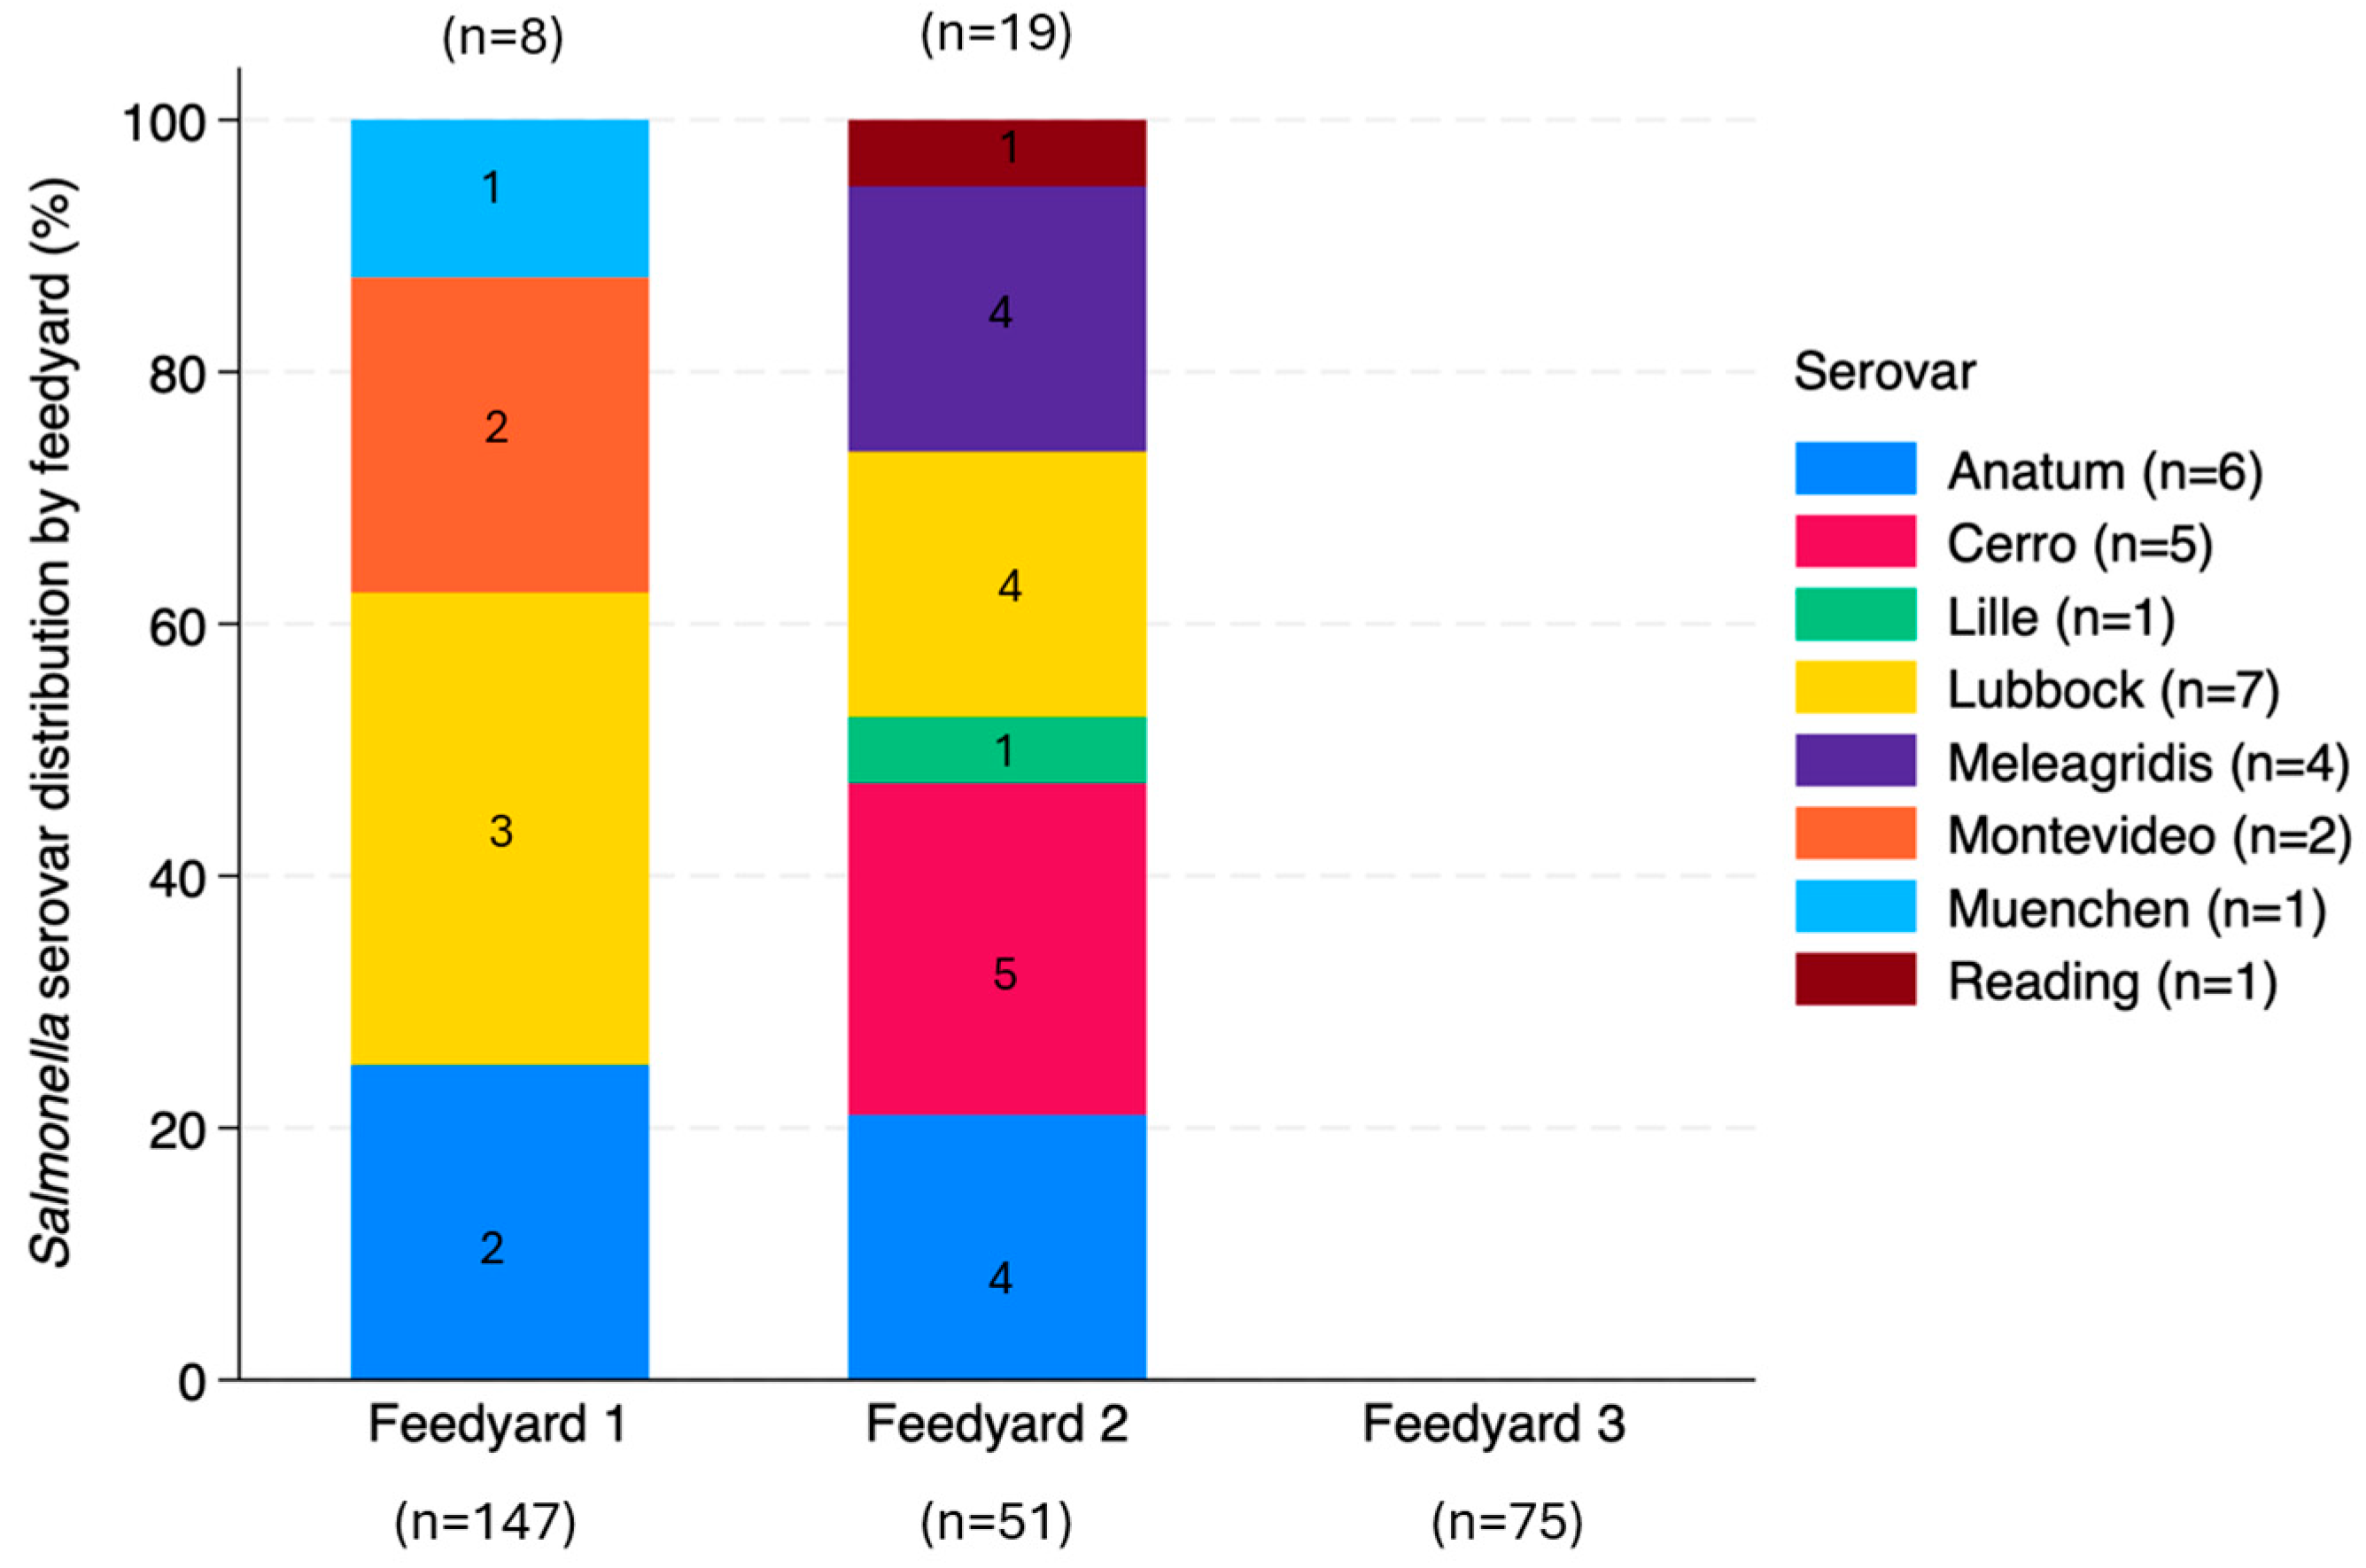
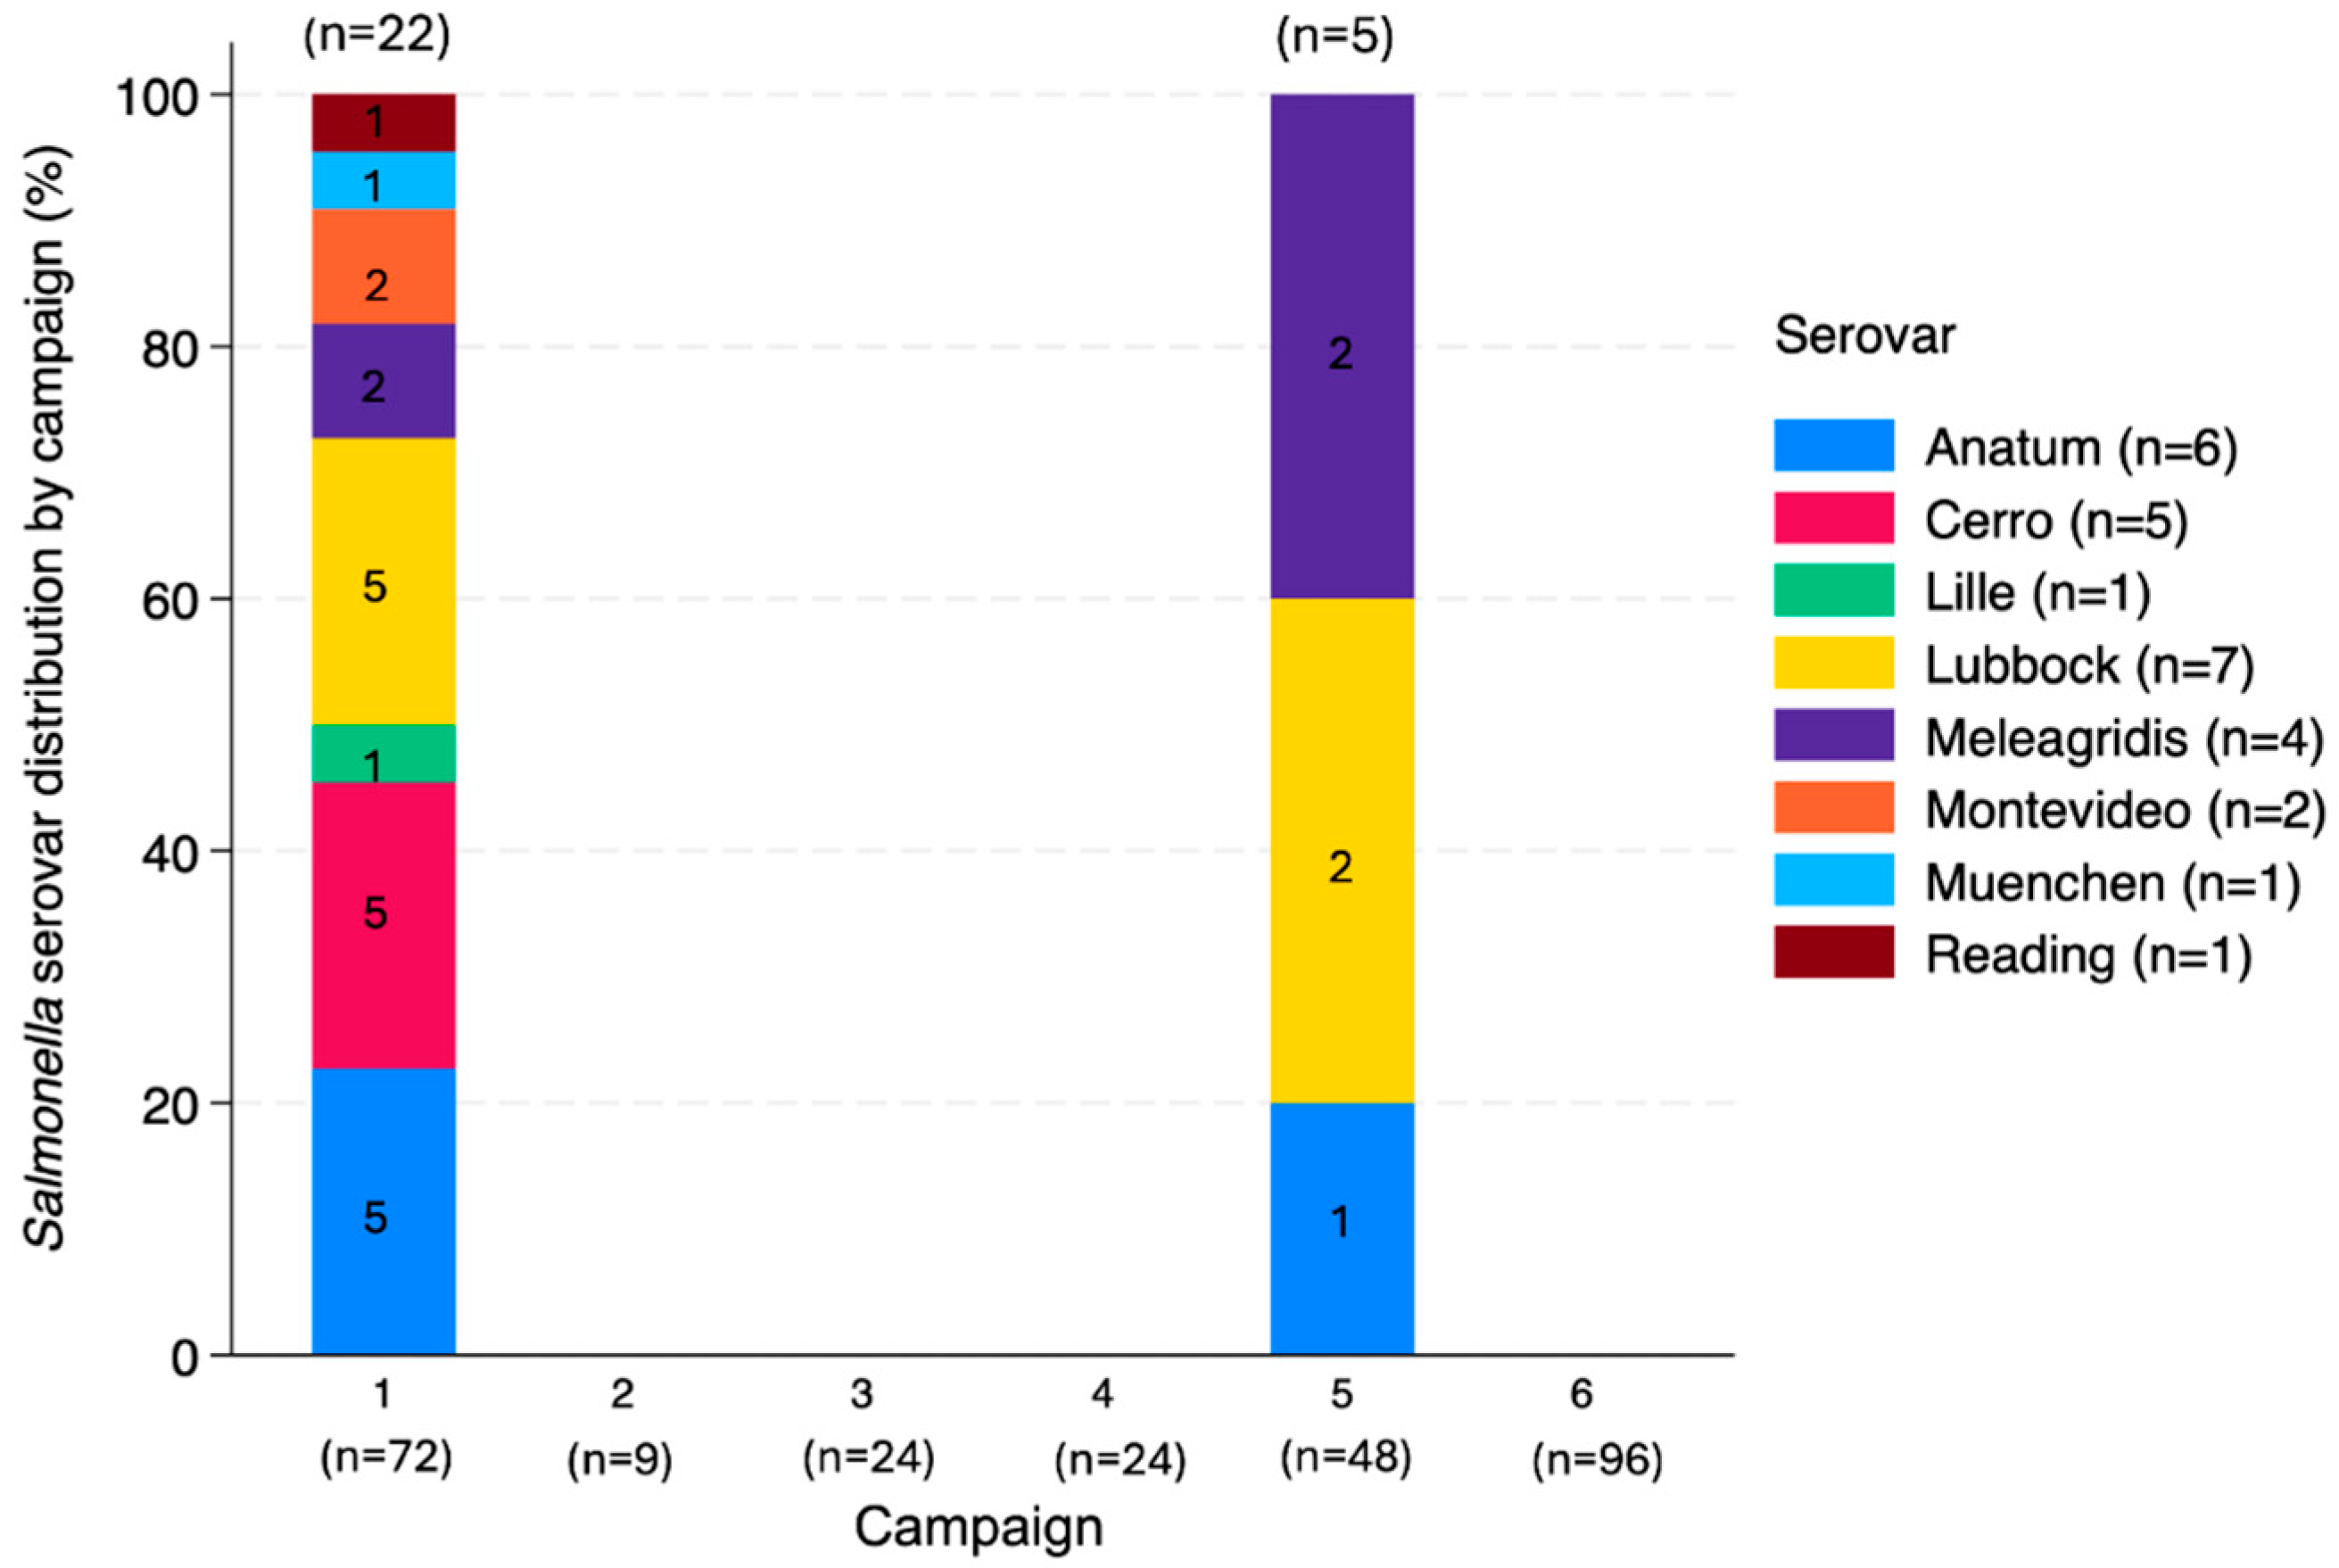
3.4.2. Salmonella Serovars
3.4.3. Plasmid Analysis
4. Discussion
4.1. Bacterial Quantification in Dust
4.2. Bacterial Gene Quantification in Dust
4.3. Phenotypic and Genotypic Characterization of E. coli and Salmonella Isolates
4.3.1. Evaluation of Antimicrobial Resistance in E. coli and Salmonella spp.
4.3.2. Salmonella Serovars
4.3.3. Bacterial Antimicrobial Resistance Genes
4.3.4. Plasmids
5. Conclusions
Supplementary Materials
Author Contributions
Funding
Data Availability Statement
Acknowledgments
Conflicts of Interest
References
- Gilchrist, M.J.; Greko, C.; Wallinga, D.B.; Beran, G.W.; Riley, D.G.; Thorne, P.S. The potential role of concentrated animal feeding operations in infectious disease epidemics and antibiotic resistance. Environ. Health Perspect. 2007, 115, 313–316. [Google Scholar] [CrossRef] [PubMed]
- USDA. Quick Stats; United States Department of Agriculture: Washington, DC, USA, 2024. Available online: https://quickstats.nass.usda.gov/ (accessed on 1 October 2024).
- OIE. Animal Welfare and Beef Cattle Production Systems; World Organisation for Animal Health: Paris, France, 2013. [Google Scholar]
- Snowder, G.; Van Vleck, L.D.; Cundiff, L.; Bennett, G. Bovine respiratory disease in feedlot cattle: Environmental, genetic, and economic factors. J. Anim. Sci. 2006, 84, 1999–2008. [Google Scholar] [CrossRef] [PubMed]
- Meadows, A.J.; Mundt, C.C.; Keeling, M.J.; Tildesley, M.J. Disentangling the influence of livestock vs. farm density on livestock disease epidemics. Ecosphere 2018, 9, e02294. [Google Scholar] [CrossRef]
- Machalaba, C.C.; Loh, E.H.; Daszak, P.; Karesh, W.B. Emerging Diseases from Animals. In State of the World 2015: Confronting Hidden Threats to Sustainability; Island Press/Center for Resource Economics: Washington, DC, USA, 2015; pp. 105–116. [Google Scholar]
- Hao, H.; Cheng, G.; Iqbal, Z.; Ai, X.; Hussain, H.I.; Huang, L.; Dai, M.; Wang, Y.; Liu, Z.; Yuan, Z. Benefits and risks of antimicrobial use in food-producing animals. Front. Microbiol. 2014, 5, 288. [Google Scholar] [CrossRef] [PubMed]
- Chantziaras, I.; Boyen, F.; Callens, B.; Dewulf, J. Correlation between veterinary antimicrobial use and antimicrobial resistance in food-producing animals: A report on seven countries. J. Antimicrob. Chemother. 2014, 69, 827–834. [Google Scholar] [CrossRef]
- Prescott, J.F. History of Antimicrobial Usage in Agriculture: An Overview. In Antimicrobial Resistance in Bacteria of Animal Origin; Aarestrup, F.M., Ed.; ASM Press: Washington, DC, USA, 2006; pp. 19–27. [Google Scholar]
- Casey, J.A.; Kim, B.F.; Larsen, J.; Price, L.B.; Nachman, K.E. Industrial Food Animal Production and Community Health. Curr. Environ. Health Rep. 2015, 2, 259–271. [Google Scholar] [CrossRef]
- Woolhouse, M.; Ward, M.; van Bunnik, B.; Farrar, J. Antimicrobial resistance in humans, livestock and the wider environment. Philos. Trans. R. Soc. B Biol. Sci. 2015, 370, 20140083. [Google Scholar] [CrossRef]
- Molton, J.S.; Tambyah, P.A.; Ang, B.S.; Ling, M.L.; Fisher, D.A. The global spread of healthcare-associated multidrug-resistant bacteria: A perspective from Asia. Clin. Infect. Dis. 2013, 56, 1310–1318. [Google Scholar] [CrossRef]
- Pal, C.; Bengtsson-Palme, J.; Kristiansson, E.; Larsson, D.G. The structure and diversity of human, animal and environmental resistomes. Microbiome 2016, 4, 54. [Google Scholar] [CrossRef]
- Pruden, A. Balancing water sustainability and public health goals in the face of growing concerns about antibiotic resistance. Environ. Sci. Technol. 2014, 48, 5–14. [Google Scholar] [CrossRef]
- Rolain, J.M. Food and human gut as reservoirs of transferable antibiotic resistance encoding genes. Front. Microbiol. 2013, 4, 173. [Google Scholar] [CrossRef] [PubMed]
- Fernando, G.A.; Collignon, P.J.; Bell, J.M. A risk for returned travellers: The “post-antibiotic era”. Med. J. Aust. 2010, 193, 59. [Google Scholar] [CrossRef]
- Wang, H.; Qi, J.-F.; Qin, R.; Ding, K.; Graham, D.W.; Zhu, Y.-G. Intensified livestock farming increases antibiotic resistance genotypes and phenotypes in animal feces. Commun. Earth Environ. 2023, 4, 123. [Google Scholar] [CrossRef]
- Manyi-Loh, C.; Mamphweli, S.; Meyer, E.; Okoh, A. Antibiotic Use in Agriculture and Its Consequential Resistance in Environmental Sources: Potential Public Health Implications. Molecules 2018, 23, 795. [Google Scholar] [CrossRef] [PubMed]
- Chee-Sanford, J.C.; Aminov, R.I.; Krapac, I.J.; Garrigues-Jeanjean, N.; Mackie, R.I. Occurrence and diversity of tetracycline resistance genes in lagoons and groundwater underlying two swine production facilities. Appl. Environ. Microbiol. 2001, 67, 1494–1502. [Google Scholar] [CrossRef] [PubMed]
- McEachran, A.D.; Blackwell, B.R.; Hanson, J.D.; Wooten, K.J.; Mayer, G.D.; Cox, S.B.; Smith, P.N. Antibiotics, bacteria, and antibiotic resistance genes: Aerial transport from cattle feed yards via particulate matter. Environ. Health Perspect. 2015, 123, 337–343. [Google Scholar] [CrossRef]
- Gibbs, S.G.; Green, C.F.; Tarwater, P.M.; Mota, L.C.; Mena, K.D.; Scarpino, P.V. Isolation of Antibiotic-Resistant Bacteria from the Air Plume Downwind of a Swine Confined or Concentrated Animal Feeding Operation. Environ. Health Perspect. 2006, 114, 1032–1037. [Google Scholar] [CrossRef]
- Yanamala, S.; Miller, M.F.; Loneragan, G.H.; Gragg, S.E.; Brashears, M.M. Potential for microbial contamination of spinach through feedyard air/dust growing in close proximity to cattle feedyard operations. J. Food Saf. 2011, 31, 525–529. [Google Scholar] [CrossRef]
- Berry, E.D.; Wells, J.E.; Bono, J.L.; Woodbury, B.L.; Kalchayanand, N.; Norman, K.N.; Suslow, T.V.; López-Velasco, G.; Millner, P.D. Effect of proximity to a cattle feedlot on Escherichia coli O157:H7 contamination of leafy greens and evaluation of the potential for airborne transmission. Appl. Environ. Microbiol. 2015, 81, 1101–1110. [Google Scholar] [CrossRef]
- Létourneau, V.; Nehmé, B.; Mériaux, A.; Massé, D.; Cormier, Y.; Duchaine, C. Human pathogens and tetracycline-resistant bacteria in bioaerosols of swine confinement buildings and in nasal flora of hog producers. Int. J. Hyg. Environ. Health 2010, 213, 444–449. [Google Scholar] [CrossRef]
- Dohmen, W.; Schmitt, H.; Bonten, M.; Heederik, D. Air exposure as a possible route for ESBL in pig farmers. Environ. Res. 2017, 155, 359–364. [Google Scholar] [CrossRef] [PubMed]
- Dungan, R.S. Board-Invited Review: Fate and transport of bioaerosols associated with livestock operations and manures. J. Anim. Sci. 2010, 88, 3693–3706. [Google Scholar] [CrossRef] [PubMed]
- Guo, L.; Maghirang, R.G.; Razote, E.B.; Auvermann, B.W. Laboratory evaluation of dust-control effectiveness of pen surface treatments for cattle feedlots. J. Environ. Qual. 2011, 40, 1503–1509. [Google Scholar] [CrossRef]
- Auvermann, B.; Bottcher, R.; Heber, A.; Meyer, D.; Parnell, C.B.; Shaw, B.; Worley, J. Particulate Matter Emissions from Animal Feeding Operations; ASABE: St. Joseph, MI, USA, 2006. [Google Scholar]
- Nguyen, X.D.; Zhao, Y.; Evans, J.D.; Lin, J.; Purswell, J.L. Survival of Escherichia coli in Airborne and Settled Poultry Litter Particles. Animals 2022, 12, 284. [Google Scholar] [CrossRef] [PubMed]
- Tang, J.W. The effect of environmental parameters on the survival of airborne infectious agents. J. R. Soc. Interface 2009, 6, S737–S746. [Google Scholar] [CrossRef]
- Carpenter, G.A. Dust in livestock buildings—Review of some aspects. J. Agric. Eng. Res. 1986, 33, 227–241. [Google Scholar] [CrossRef]
- Apley, M.I.S.; Scott, H.M. Remarks Addressing Airborne Feedyard Dust and Antimicrobial Resistance; Texas A&M University-Veterinary Medicine: College Station, TX, USA, 2015; p. 2. [Google Scholar]
- Dubnau, D. DNA uptake in bacteria. Annu. Rev. Microbiol. 1999, 53, 217–244. [Google Scholar] [CrossRef]
- Frost, L.S.; Leplae, R.; Summers, A.O.; Toussaint, A. Mobile genetic elements: The agents of open source evolution. Nat. Rev. Microbiol. 2005, 3, 722–732. [Google Scholar] [CrossRef]
- Burrus, V.; Waldor, M.K. Shaping bacterial genomes with integrative and conjugative elements. Res. Microbiol. 2004, 155, 376–386. [Google Scholar] [CrossRef]
- Norman, A.; Hansen, L.H.; Sørensen, S.J. Conjugative plasmids: Vessels of the communal gene pool. Philos. Trans. R. Soc. B Biol. Sci. 2009, 364, 2275–2289. [Google Scholar] [CrossRef] [PubMed]
- Partridge, S.R.; Kwong, S.M.; Firth, N.; Jensen, S.O. Mobile Genetic Elements Associated with Antimicrobial Resistance. Clin. Microbiol. Rev. 2018, 31, e00088-17. [Google Scholar] [CrossRef]
- Sweeten, J.M.; Parnell, C.B.; Shaw, B.W.; Auvermann, B. Particle size distribution of cattle feedlot dust emission. Trans. ASABE 1998, 41, 1477–1481. [Google Scholar] [CrossRef]
- Haig, C.W.; Mackay, W.G.; Walker, J.T.; Williams, C. Bioaerosol sampling: Sampling mechanisms, bioefficiency and field studies. J. Hosp. Infect. 2016, 93, 242–255. [Google Scholar] [CrossRef]
- Wang, Z.; Reponen, T.; Grinshpun, S.A.; Górny, R.L.; Willeke, K. Effect of sampling time and air humidity on the bioefficiency of filter samplers for bioaerosol collection. J. Aerosol Sci. 2001, 32, 661–674. [Google Scholar] [CrossRef]
- Ghosh, B.; Lal, H.; Srivastava, A. Review of bioaerosols in indoor environment with special reference to sampling, analysis and control mechanisms. Environ. Int. 2015, 85, 254–272. [Google Scholar] [CrossRef] [PubMed]
- Acosta-Martínez, V.; Van Pelt, S.; Moore-Kucera, J.; Baddock, M.C.; Zobeck, T.M. Microbiology of wind-eroded sediments: Current knowledge and future research directions. Aeolian Res. 2015, 18, 99–113. [Google Scholar] [CrossRef]
- Liu, D.; Chai, T.; Xia, X.; Gao, Y.; Cai, Y.; Li, X.; Miao, Z.; Sun, L.; Hao, H.; Roesler, U.; et al. Formation and transmission of Staphylococcus aureus (including MRSA) aerosols carrying antibiotic-resistant genes in a poultry farming environment. Sci. Total Environ. 2012, 426, 139–145. [Google Scholar] [CrossRef]
- Just, N.A.; Létourneau, V.; Kirychuk, S.P.; Singh, B.; Duchaine, C. Potentially pathogenic bacteria and antimicrobial resistance in bioaerosols from cage-housed and floor-housed poultry operations. Ann. Occup. Hyg. 2012, 56, 440–449. [Google Scholar] [CrossRef]
- Schmithausen, R.M.; Schulze-Geisthoevel, S.V.; Stemmer, F.; El-Jade, M.; Reif, M.; Hack, S.; Meilaender, A.; Montabauer, G.; Fimmers, R.; Parcina, M.; et al. Analysis of Transmission of MRSA and ESBL-E among Pigs and Farm Personnel. PLoS ONE 2015, 10, e0138173. [Google Scholar] [CrossRef]
- Hermann, J.R.; Brockmeier, S.L.; Yoon, K.-J.; Zimmerman, J.J. Detection of respiratory pathogens in air samples from acutely infected pigs. Can. J. Vet. Res. 2008, 72, 367–370. [Google Scholar]
- Song, L.; Wang, C.; Jiang, G.; Ma, J.; Li, Y.; Chen, H.; Guo, J. Bioaerosol is an important transmission route of antibiotic resistance genes in pig farms. Environ. Int. 2021, 154, 106559. [Google Scholar] [CrossRef]
- EPA. Appendix B to Part 50—Reference Method for the Determination of Suspended Particulate Matter in the Atmosphere (High-Volume Method). 2023. 165. Available online: https://www.govinfo.gov/content/pkg/CFR-2011-title40-vol2/pdf/CFR-2011-title40-vol2-part50-appB.pdf (accessed on 20 October 2024).
- Sow, M.; Goossens, D.; Rajot, J.L. Calibration of the MDCO dust collector and of four versions of the inverted frisbee dust deposition sampler. Geomorphology 2006, 82, 360–375. [Google Scholar] [CrossRef]
- CLSI. Performance Standards for Antimicrobial Susceptibility Testing, 33rd ed.; CLSI document M100; Clinical and Laboratory Standards Institute: Wayne, PA, USA, 2023. [Google Scholar]
- Bustin, S.A.; Benes, V.; Garson, J.A.; Hellemans, J.; Huggett, J.; Kubista, M.; Mueller, R.; Nolan, T.; Pfaffl, M.W.; Shipley, G.L.; et al. The MIQE Guidelines: Minimum Information for Publication of Quantitative Real-Time PCR Experiments. Clin. Chem. 2009, 55, 611–622. [Google Scholar] [CrossRef] [PubMed]
- Murray, S.A.; Holbert, A.C.; Norman, K.N.; Lawhon, S.D.; Sawyer, J.E.; Scott, H.M. Effects of tylosin, a direct-fed microbial and feedlot pen environment on phenotypic resistance among Enterococci isolated from beef cattle feces. Antibiotics 2022, 11, 106. [Google Scholar] [CrossRef]
- Ohta, N.; Norman, K.N.; Norby, B.; Lawhon, S.D.; Vinasco, J.; den Bakker, H.; Loneragan, G.H.; Scott, H.M. Population dynamics of enteric Salmonella in response to antimicrobial use in beef feedlot cattle. Sci. Rep. 2017, 7, 14310. [Google Scholar] [CrossRef] [PubMed]
- Bolger, A.M.; Lohse, M.; Usadel, B. Trimmomatic: A flexible trimmer for Illumina sequence data. Bioinformatics 2014, 30, 2114–2120. [Google Scholar] [CrossRef]
- Babraham, B. FastQC/0.11.6-Java-1.8.0. Available online: https://www.bioinformatics.babraham.ac.uk/projects/ (accessed on 23 March 2024).
- Ewels, P.; Magnusson, M.; Lundin, S.; Käller, M. MultiQC: Summarize analysis results for multiple tools and samples in a single report. Bioinformatics 2016, 32, 3047–3048. [Google Scholar] [CrossRef]
- Bankevich, A.; Nurk, S.; Antipov, D.; Gurevich, A.A.; Dvorkin, M.; Kulikov, A.S.; Lesin, V.M.; Nikolenko, S.I.; Pham, S.; Prjibelski, A.D.; et al. SPAdes: A new genome assembly algorithm and its applications to single-cell sequencing. J. Comput. Biol. 2012, 19, 455–477. [Google Scholar] [CrossRef]
- Gurevich, A.; Saveliev, V.; Vyahhi, N.; Tesler, G. QUAST: Quality assessment tool for genome assemblies. Bioinformatics 2013, 29, 1072–1075. [Google Scholar] [CrossRef]
- Yoshida, C.E.; Kruczkiewicz, P.; Laing, C.R.; Lingohr, E.J.; Gannon, V.P.J.; Nash, J.H.E.; Taboada, E.N. The Salmonella In Silico Typing Resource (SISTR): An Open Web-Accessible Tool for Rapidly Typing and Subtyping Draft Salmonella Genome Assemblies. PLoS ONE 2016, 11, e0147101. [Google Scholar] [CrossRef]
- Seemann, T. Abricate; Github: Melbourne, Australia, 2020. [Google Scholar]
- Zankari, E.; Hasman, H.; Cosentino, S.; Vestergaard, M.; Rasmussen, S.; Lund, O.; Aarestrup, F.M.; Larsen, M.V. Identification of acquired antimicrobial resistance genes. J. Antimicrob. Chemother. 2012, 67, 2640–2644. [Google Scholar] [CrossRef] [PubMed]
- Bortolaia, V.; Kaas, R.S.; Ruppe, E.; Roberts, M.C.; Schwarz, S.; Cattoir, V.; Philippon, A.; Allesoe, R.L.; Rebelo, A.R.; Florensa, A.F.; et al. ResFinder 4.0 for predictions of phenotypes from genotypes. J. Antimicrob. Chemother. 2020, 75, 3491–3500. [Google Scholar] [CrossRef] [PubMed]
- Zankari, E.; Allesøe, R.; Joensen, K.G.; Cavaco, L.M.; Lund, O.; Aarestrup, F.M. PointFinder: A novel web tool for WGS-based detection of antimicrobial resistance associated with chromosomal point mutations in bacterial pathogens. J. Antimicrob. Chemother. 2017, 72, 2764–2768. [Google Scholar] [CrossRef]
- Carattoli, A.; Zankari, E.; García-Fernández, A.; Voldby Larsen, M.; Lund, O.; Villa, L.; Møller Aarestrup, F.; Hasman, H. In silico detection and typing of plasmids using PlasmidFinder and plasmid multilocus sequence typing. Antimicrob. Agents Chemother. 2014, 58, 3895–3903. [Google Scholar] [CrossRef]
- Xin, H.; Gao, M.; Wang, X.; Qiu, T.; Guo, Y.; Zhang, L. Animal farms are hot spots for airborne antimicrobial resistance. Sci. Total Environ. 2022, 851, 158050. [Google Scholar] [CrossRef]
- EPA. Risk Assessment Guidance for Superfund Volume 1 Human Health Evaluation Manual; Environmental Protection Agency: Washington, DC, USA, 1989.
- Harel, O.; Zhou, X.H. Multiple imputation: Review of theory, implementation and software. Stat. Med. 2007, 26, 3057–3077. [Google Scholar] [CrossRef]
- Schafer, J.L. Multiple imputation in multivariate problems when the imputation and analysis models differ. Stat. Neerl. 2003, 57, 19–35. [Google Scholar] [CrossRef]
- Eddings, W.; Marchenko, Y. Diagnostics for multiple imputation in Stata. Stata J. 2012, 12, 353–367. [Google Scholar] [CrossRef]
- Yong, S.L.S.; Ng, J.L.; Huang, Y.F.; Ang, C.K. Estimation of Reference Crop Evapotranspiration with Three Different Machine Learning Models and Limited Meteorological Variables. Agronomy 2023, 13, 1048. [Google Scholar] [CrossRef]
- Pereira, L.S.; Allen, R.G.; Smith, M.; Raes, D. Crop evapotranspiration estimation with FAO56: Past and future. Agric. Water Manag. 2015, 147, 4–20. [Google Scholar] [CrossRef]
- NARMS. 2018 NARMS Update: Integrated Report Summary Interactive Version; FDA: Silver Spring, MD, USA, 2018. Available online: https://www.fda.gov/animal-veterinary/national-antimicrobial-resistance-monitoring-system/2018-narms-update-integrated-report-summary-interactive-version (accessed on 12 November 2020).
- Bai, H.; He, L.Y.; Wu, D.L.; Gao, F.Z.; Zhang, M.; Zou, H.Y.; Yao, M.S.; Ying, G.G. Spread of airborne antibiotic resistance from animal farms to the environment: Dispersal pattern and exposure risk. Environ. Int. 2022, 158, 106927. [Google Scholar] [CrossRef] [PubMed]
- Schmid, A.; Hörmansdorfer, S.; Messelhäusser, U.; Käsbohrer, A.; Sauter-Louis, C.; Mansfeld, R. Prevalence of extended-spectrum β-lactamase-producing Escherichia coli on Bavarian dairy and beef cattle farms. Appl. Environ. Microbiol. 2013, 79, 3027–3032. [Google Scholar] [CrossRef] [PubMed]
- Benedict, K.M.; Gow, S.P.; McAllister, T.A.; Booker, C.W.; Hannon, S.J.; Checkley, S.L.; Noyes, N.R.; Morley, P.S. Antimicrobial Resistance in Escherichia coli Recovered from Feedlot Cattle and Associations with Antimicrobial Use. PLoS ONE 2015, 10, e0143995. [Google Scholar] [CrossRef]
- Cameron, A.; McAllister, T.A. Antimicrobial usage and resistance in beef production. J. Anim. Sci. Biotechnol. 2016, 7, 68. [Google Scholar] [CrossRef]
- Messele, Y.E.; Alkhallawi, M.; Veltman, T.; Trott, D.J.; McMeniman, J.P.; Kidd, S.P.; Low, W.Y.; Petrovski, K.R. Phenotypic and Genotypic Analysis of Antimicrobial Resistance in Escherichia coli Recovered from Feedlot Beef Cattle in Australia. Animals 2022, 12, 2256. [Google Scholar] [CrossRef] [PubMed]
- NARMS. 2018 NARMS Update: Integrated Report Summary; NARMS U.S. Food & Drug Administration: Silver Spring, MD, USA, 2018.
- Leon, I.M.; Auvermann, B.W.; Bush, K.J.; Casey, K.; Pinchak, W.E.; Vinasco, J.; Lawhon, S.D.; Smith, J.K.; Scott, H.M.; Norman, K.N. Assessing the Resilience of Enteric Bacteria in Manure in Response to Changes in Relative Humidity and UV-B Light. Environments 2024, 11, 197. [Google Scholar] [CrossRef]
- Purdy, C.W.; Clark, R.N.; Straus, D.C. Analysis of Aerosolized Particulates of Feedyards Located in the Southern High Plains of Texas. Aerosol Sci. Technol. 2007, 41, 497–509. [Google Scholar] [CrossRef]
- Wooten, K.J.; Blackwell, B.R.; McEachran, A.D.; Mayer, G.D.; Smith, P.N. Airborne particulate matter collected near beef cattle feedyards induces androgenic and estrogenic activity in vitro. Agric. Ecosyst. Environ. 2015, 203, 29–35. [Google Scholar] [CrossRef]
- Wooten, K.J.; Mayer, G.D.; Smith, P.N. Persistence of elevated concentrations of PM, affiliated pharmaceuticals, and tetracycline resistance genes downwind of feedyards. Environ. Pollut. 2019, 247, 467–473. [Google Scholar] [CrossRef]
- Bonifacio, H.F.; Maghirang, R.G.; Auvermann, B.W.; Razote, E.B.; Murphy, J.P.; Harner Iii, J.P. Particulate matter emission rates from beef cattle feedlots in Kansas—Reverse dispersion modeling. J. Air Waste Manag. Assoc. 2012, 62, 350–361. [Google Scholar] [CrossRef]
- Guo, L.; Maghirang, R.G.; Razote, E.B.; Trabue, S.L.; McConnell, L.L. Concentrations of Particulate Matter Emitted from Large Cattle Feedlots in Kansas. J. Air Waste Manag. Assoc. 2011, 61, 1026–1035. [Google Scholar] [CrossRef] [PubMed]
- Gonzales, B.H.; Maghirang, G.R.; Wilson, D.J.; Razote, B.E.; Guo, L. Measuring Cattle Feedlot Dust Using Laser Diffraction Analysis. Trans. ASABE 2011, 54, 2319–2327. [Google Scholar] [CrossRef]
- Emert, A.D.; Griffis-Kyle, K.; Green, F.B.; Smith, P.N. Atmospheric transport of particulate matter and particulate-bound agrochemicals from beef cattle feedlots: Human health implications for downwind agricultural communities. Sci. Total Environ. 2023, 894, 164678. [Google Scholar] [CrossRef]
- Wilson, S.C.; Morrow-Tesch, J.; Straus, D.C.; Cooley, J.D.; Wong, W.C.; Mitlöhner, F.M.; McGlone, J.J. Airborne microbial flora in a cattle feedlot. Appl. Environ. Microbiol. 2002, 68, 3238–3242. [Google Scholar] [CrossRef]
- Hiranuma, N.; Brooks, S.D.; Gramann, J.; Auvermann, B.W. High concentrations of coarse particles emitted from a cattle feeding operation. Atmos. Chem. Phys. 2011, 11, 8809–8823. [Google Scholar] [CrossRef]
- Purdy, C.W.; Straus, D.C.; Parker, D.B.; Wilson, S.C.; Clark, R.N. Comparison of the type and number of microorganisms and concentration of endotoxin in the air of feedyards in the Southern High Plains. Am. J. Vet. Res. 2004, 65, 45–52. [Google Scholar] [CrossRef] [PubMed]
- De Vaugelade, S.; Aime, M.; Farcette, N.; Maurel, E.; Lacour, T.; Thomas, C.; Bouchonnet, S.; Pirnay, S. Comparison of the compact dry TC method with the standard method ISO 21149:2006 for determining aerobic colony counts in cosmetic emulsion. Int. J. Cosmet. Sci. 2017, 39, 17–24. [Google Scholar] [CrossRef]
- Mainelis, G. Bioaerosol sampling: Classical approaches, advances, and perspectives. Aerosol Sci. Technol. 2020, 54, 496–519. [Google Scholar] [CrossRef]
- Šantl-Temkiv, T.; Amato, P.; Gosewinkel, U.; Thyrhaug, R.; Charton, A.; Chicot, B.; Finster, K.; Bratbak, G.; Löndahl, J. High-Flow-Rate Impinger for the Study of Concentration, Viability, Metabolic Activity, and Ice-Nucleation Activity of Airborne Bacteria. Environ. Sci. Technol. 2017, 51, 11224–11234. [Google Scholar] [CrossRef]
- Chi, M.-C.; Li, C.-S. Analysis of Bioaerosols from Chicken Houses by Culture and Non-Culture Method. Aerosol Sci. Technol. 2006, 40, 1071–1079. [Google Scholar] [CrossRef]
- Chen, P.-S.; Li, C.-S. Sampling Performance for Bioaerosols by Flow Cytometry with Fluorochrome. Aerosol Sci. Technol. 2005, 39, 231–237. [Google Scholar] [CrossRef]
- Nguyen, X.D.; Zhao, Y.; Evans, J.D.; Lin, J.; Schneider, L.; Voy, B.H.; Hawkins, S.A.; Purswell, J.L. Evaluation of Bioaerosol Samplers for Airborne Escherichia Coli Carried by Poultry Litter Particles. J. ASABE 2022, 65, 825–833. [Google Scholar] [CrossRef]
- Thompson, K.N.; Wooten, K.J.; Hensley, L.L.; Smith, P.N.; Mayer, G.D. Viable Antimicrobial Resistant Bacteria are Transported from Cattle Feed Yards viaAerosolized Particulate Matter. J. Veter Sci. Med. 2018, 6, 5. [Google Scholar] [CrossRef]
- Reheis, M.C. A 16-year record of eolian dust in Southern Nevada and California, USA: Controls on dust generation and accumulation. J. Arid. Environ. 2006, 67, 487–520. [Google Scholar] [CrossRef]
- Eden, R. Enterobacteriaceae, Coliforms and E. coli: Classical and Modern Methods for Detection and Enumeration. In Encyclopedia of Food Microbiology, 2nd ed.; Batt, C.A., Tortorello, M.L., Eds.; Academic Press: Oxford, MS, USA, 2014; pp. 667–673. [Google Scholar]
- Levy, S.B.; Miller, R.V. Gene transfer in the environment. In Environmental Biotechnology; McGraw-Hill: New York, NY, USA, 1989; pp. 1–434. [Google Scholar]
- WHO. WHO’s List of Medically Important Antimicrobials: A Risk Management Tool for Mitigating Antimicrobial Resistance Due to Non-Human Use; World Health Organization: Geneva, Switzerland, 2024.
- NRC. The Effects on Human Health of Subtherapeutic Use of Antimicrobials in Animal Feeds HHS Vulnerability Disclosure. Available online: https://www.ncbi.nlm.nih.gov/books/NBK216502/ (accessed on 23 May 2024).
- Zaidi, S.E.; Zaheer, R.; Barbieri, R.; Cook, S.R.; Hannon, S.J.; Booker, C.W.; Church, D.; Van Domselaar, G.; Zovoilis, A.; McAllister, T.A. Genomic Characterization of Enterococcus hirae From Beef Cattle Feedlots and Associated Environmental Continuum. Front. Microbiol. 2022, 13, 859990. [Google Scholar] [CrossRef] [PubMed]
- Zhang, Y.; Zheng, Y.; Zhu, Z.; Chen, Y.; Dong, H. Dispersion of Antibiotic Resistance Genes (ARGs) from stored swine manure biogas digestate to the atmosphere. Sci. Total Environ. 2021, 761, 144108. [Google Scholar] [CrossRef]
- Zaheer, R.; Cook, S.R.; Barbieri, R.; Goji, N.; Cameron, A.; Petkau, A.; Polo, R.O.; Tymensen, L.; Stamm, C.; Song, J.; et al. Surveillance of Enterococcus spp. reveals distinct species and antimicrobial resistance diversity across a One-Health continuum. Sci. Rep. 2020, 10, 3937. [Google Scholar]
- Strong, K.M.; Marasco, K.L.; Invik, J.; Ganshorn, H.; Reid-Smith, R.J.; Waldner, C.L.; Otto, S.J.G.; Kastelic, J.P.; Checkley, S.L. Factors associated with antimicrobial resistant enterococci in Canadian beef cattle: A scoping review. Front. Vet. Sci. 2023, 10, 1155772. [Google Scholar] [CrossRef]
- Leclercq, R. Mechanisms of Resistance to Macrolides and Lincosamides: Nature of the Resistance Elements and Their Clinical Implications. Clin. Infect. Dis. 2002, 34, 482–492. [Google Scholar] [CrossRef]
- Zaheer, R.; Cook, S.R.; Klima, C.L.; Stanford, K.; Alexander, T.; Topp, E.; Read, R.R.; McAllister, T.A. Effect of subtherapeutic vs. therapeutic administration of macrolides on antimicrobial resistance in Mannheimia haemolytica and enterococci isolated from beef cattle. Front. Microbiol. 2013, 4, 133. [Google Scholar] [CrossRef]
- Cazer, C.L.; Eldermire, E.R.B.; Lhermie, G.; Murray, S.A.; Scott, H.M.; Gröhn, Y.T. The effect of tylosin on antimicrobial resistance in beef cattle enteric bacteria: A systematic review and meta-analysis. Prev. Vet. Med. 2020, 176, 104934. [Google Scholar] [CrossRef] [PubMed]
- Sancheza, H.M.; Echeverria, C.; Thulsiraj, V.; Zimmer-Faust, A.; Flores, A.; Laitz, M.; Healy, G.; Mahendra, S.; Paulson, S.E.; Zhu, Y.; et al. Antibiotic Resistance in Airborne Bacteria Near Conventional and Organic Beef Cattle Farms in California, USA. Water Air Soil. Pollut. 2016, 227, 280. [Google Scholar] [CrossRef]
- Luiken, R.E.C.; Heederik, D.J.J.; Scherpenisse, P.; Van Gompel, L.; van Heijnsbergen, E.; Greve, G.D.; Jongerius-Gortemaker, B.G.M.; Tersteeg-Zijderveld, M.H.G.; Fischer, J.; Juraschek, K.; et al. Determinants for antimicrobial resistance genes in farm dust on 333 poultry and pig farms in nine European countries. Environ. Res. 2022, 208, 112715. [Google Scholar] [CrossRef]
- USDA; APHIS. Veterinary Services, Center for Epidemiology and animal Health. In Salmonella in U.S. Cattle Feedlots; USDA: Washington, DC, USA, 2014; p. 2. [Google Scholar]
- Trastoy, R.; Manso, T.; Fernández-García, L.; Blasco, L.; Ambroa, A.; Pérez Del Molino, M.L.; Bou, G.; García-Contreras, R.; Wood, T.K.; Tomás, M. Mechanisms of Bacterial Tolerance and Persistence in the Gastrointestinal and Respiratory Environments. Clin. Microbiol. Rev. 2018, 31, 4. [Google Scholar] [CrossRef]
- Dewachter, L.; Fauvart, M.; Michiels, J. Bacterial Heterogeneity and Antibiotic Survival: Understanding and Combatting Persistence and Heteroresistance. Mol. Cell 2019, 76, 255–267. [Google Scholar] [CrossRef]
- NARMS. NARMS Now: Integrated Data; United States Food and Drug Administration (FDA): Silver Spring, MD, USA, 2023.
- NAHMS. Antimicrobial Use and Stewardship on U.S. Feedlots, 2017; USDA: Washington, DC, USA, 2019; p. 81.
- Levent, G.; Schlochtermeier, A.; Ives, S.E.; Norman, K.N.; Lawhon, S.D.; Loneragan, G.H.; Anderson, R.C.; Vinasco, J.; Scott, H.M. Population Dynamics of Salmonella enterica within Beef Cattle Cohorts Followed from Single-Dose Metaphylactic Antibiotic Treatment until Slaughter. Appl. Environ. Microbiol. 2019, 85, e01386-19. [Google Scholar] [CrossRef] [PubMed]
- Nickodem, C.; Arnold, A.N.; Gehring, K.B.; Gill, J.J.; Richeson, J.T.; Samuelson, K.L.; Scott, H.M.; Smith, J.K.; Taylor, T.M.; Vinasco, J.; et al. A Longitudinal Study on the Dynamics of Salmonella enterica Prevalence and Serovar Composition in Beef Cattle Feces and Lymph Nodes and Potential Contributing Sources from the Feedlot Environment. Appl. Environ. Microbiol. 2023, 89, e0003323. [Google Scholar] [CrossRef]
- Amachawadi, R.G.; Thomas, M.; Nagaraja, T.G.; Scaria, J. Genome Sequences of Salmonella enterica subsp. enterica Serovar Lubbock Strains Isolated from Liver Abscesses of Feedlot Cattle. Genome Announc. 2016, 4, e00319-16. [Google Scholar] [CrossRef] [PubMed]
- Bugarel, M.; Bakker, H.C.d.; Nightingale, K.K.; Brichta-Harhay, D.M.; Edrington, T.S.; Loneragan, G.H. Two Draft Genome Sequences of a New Serovar of Salmonella enterica, Serovar Lubbock. Genome Announc. 2015, 3, e00215-15. [Google Scholar] [CrossRef]
- Bugarel, M.; Cook, P.W.; Bakker, H.C.d.; Harhay, D.; Nightingale, K.K.; Loneragan, G.H. Complete Genome Sequences of Four Salmonella enterica Strains (Including Those of Serotypes Montevideo, Mbandaka, and Lubbock) Isolated from Peripheral Lymph Nodes of Healthy Cattle. Microbiol. Resour. Announc. 2019, 8, e01450-18. [Google Scholar] [CrossRef]
- Xie, Y.; Savell, J.W.; Arnold, A.N.; Gehring, K.B.; Gill, J.J.; Taylor, T.M. Prevalence and Characterization of Salmonella enterica and Salmonella Bacteriophages Recovered from Beef Cattle Feedlots in South Texas. J. Food Prot. 2016, 79, 1332–1341. [Google Scholar] [CrossRef] [PubMed]
- Arnold, A.N.; Sawyer, J.E.; Gehring, K.B. Longitudinal Evaluation of Salmonella in Environmental Components and Peripheral Lymph Nodes of Fed Cattle from Weaning to Finish in Three Distinct Feeding Locations. J. Food Prot. 2023, 86, 100062. [Google Scholar] [CrossRef]
- Gragg, S.E.; Loneragan, G.H.; Nightingale, K.K.; Brichta-Harhay, D.M.; Ruiz, H.; Elder, J.R.; Garcia, L.G.; Miller, M.F.; Echeverry, A.; Porras, R.G.R.; et al. Substantial within-Animal Diversity of Salmonella Isolates from Lymph Nodes, Feces, and Hides of Cattle at Slaughter. Appl. Environ. Microbiol. 2013, 79, 4744–4750. [Google Scholar] [CrossRef]
- Nesemeier, B.; Ekiri, A.B.; Landblom, D.G.; Doetkott, D.K.; Khaitsa, M.L. Prevalence and Antimicrobial Resistance of Salmonella enterica Shed from Range and Feedlot Cattle from Post-weaning to Slaughter. Food Prot. Trends 2015, 35, 280–289. [Google Scholar]
- Dargatz, D.A.; Fedorka-Cray, P.J.; Ladely, S.R.; Kopral, C.A.; Ferris, K.E.; Headrick, M.L. Prevalence and antimicrobial susceptibility of Salmonella spp. isolates from US cattle in feedlots in 1999 and 2000. J. Appl. Microbiol. 2003, 95, 753–761. [Google Scholar] [CrossRef]
- Gragg, S.E.; Loneragan, G.H.; Brashears, M.M.; Arthur, T.M.; Bosilevac, J.M.; Kalchayanand, N.; Wang, R.; Schmidt, J.W.; Brooks, J.C.; Shackelford, S.D.; et al. Cross-sectional study examining Salmonella enterica carriage in subiliac lymph nodes of cull and feedlot cattle at harvest. Foodborne Pathog. Dis. 2013, 10, 368–374. [Google Scholar] [CrossRef]
- Green, A.L.; Dargatz, D.A.; Wagner, B.A.; Fedorka-Cray, P.J.; Ladely, S.R.; Kopral, C.A. Analysis of Risk Factors Associated with Salmonella spp. Isolated from U.S. Feedlot Cattle. Foodborne Pathog. Dis. 2010, 7, 825–833. [Google Scholar] [CrossRef] [PubMed]
- Navajas-Benito, E.V.; Alonso, C.A.; Sanz, S.; Olarte, C.; Martínez-Olarte, R.; Hidalgo-Sanz, S.; Somalo, S.; Torres, C. Molecular characterization of antibiotic resistance in Escherichia coli strains from a dairy cattle farm and its surroundings. J. Sci. Food Agric. 2017, 97, 362–365. [Google Scholar] [CrossRef] [PubMed]
- Bourafa, N.; Loucif, L.; Boutefnouchet, N.; Rolain, J.M. Enterococcus hirae, an unusual pathogen in humans causing urinary tract infection in a patient with benign prostatic hyperplasia: First case report in Algeria. New Microbes New Infect. 2015, 8, 7–9. [Google Scholar] [CrossRef]
- Mollenkopf, D.F.; Mathys, D.A.; Dargatz, D.A.; Erdman, M.M.; Habing, G.G.; Daniels, J.B.; Wittum, T.E. Genotypic and epidemiologic characterization of extended-spectrum cephalosporin resistant Salmonella enterica from US beef feedlots. Prev. Vet. Med. 2017, 146, 143–149. [Google Scholar] [CrossRef]
- Leon, I.M.; Lawhon, S.D.; Norman, K.N.; Threadgill, D.S.; Ohta, N.; Vinasco, J.; Scott, H.M. Serotype Diversity and Antimicrobial Resistance among Salmonella enterica Isolates from Patients at an Equine Referral Hospital. Appl. Environ. Microbiol. 2018, 84, e02829-17. [Google Scholar] [CrossRef] [PubMed]
- Rychlik, I.; Gregorova, D.; Hradecka, H. Distribution and function of plasmids in Salmonella enterica. Vet. Microbiol. 2006, 112, 1–10. [Google Scholar] [CrossRef]
- Ingle, D.J.; Ambrose, R.L.; Baines, S.L.; Duchene, S.; Gonçalves da Silva, A.; Lee, D.Y.J.; Jones, M.; Valcanis, M.; Taiaroa, G.; Ballard, S.A.; et al. Evolutionary dynamics of multidrug resistant Salmonella enterica serovar 4,[5],12:i:- in Australia. Nat. Commun. 2021, 12, 4786. [Google Scholar] [CrossRef]
- Wong, M.H.-y.; Kan, B.; Chan, E.W.-c.; Yan, M.; Chen, S. IncI1 Plasmids Carrying Various blaCTX-M Genes Contribute to Ceftriaxone Resistance in Salmonella enterica Serovar Enteritidis in China. Antimicrob. Agents Chemother. 2016, 60, 982–989. [Google Scholar] [CrossRef] [PubMed]
- Messele, Y.E.; Trott, D.J.; Hasoon, M.F.; Veltman, T.; McMeniman, J.P.; Kidd, S.P.; Djordjevic, S.P.; Petrovski, K.R.; Low, W.Y. Phylogenetic Analysis of Escherichia coli Isolated from Australian Feedlot Cattle in Comparison to Pig Faecal and Poultry/Human Extraintestinal Isolates. Antibiotics 2023, 12, 895. [Google Scholar] [CrossRef]
- Shin, S.W.; Jung, M.; Shin, M.-K.; Yoo, H.S. Profiling of antimicrobial resistance and plasmid replicon types in β-lactamase producing Escherichia coli isolated from Korean beef cattle. J. Vet. Sci. 2015, 16, 483–489. [Google Scholar] [CrossRef] [PubMed]
- Rozwandowicz, M.; Brouwer, M.S.M.; Fischer, J.; Wagenaar, J.A.; Gonzalez-Zorn, B.; Guerra, B.; Mevius, D.J.; Hordijk, J. Plasmids carrying antimicrobial resistance genes in Enterobacteriaceae. J. Antimicrob. Chemother. 2018, 73, 1121–1137. [Google Scholar] [CrossRef]
- Han, J.; Pendleton, S.J.; Deck, J.; Singh, R.; Gilbert, J.; Johnson, T.J.; Sanad, Y.M.; Nayak, R.; Foley, S.L. Impact of co-carriage of IncA/C plasmids with additional plasmids on the transfer of antimicrobial resistance in Salmonella enterica isolates. Int. J. Food Microbiol. 2018, 271, 77–84. [Google Scholar] [CrossRef] [PubMed]


| Campaign | Sample Type | Δt (min) 4 | Δt (h) 4 |
|---|---|---|---|
| 1 | Impinger, QF 1 (PM10 2, TSP 3), and marbles | 215–249 | 3.58–4.15 |
| 2 | QF (TSP) | 149–215 | 2.48–3.58 |
| 3 | Impinger, QF (PM10, TSP), and marbles | 184–192 | 3.07–3.20 |
| 4 | Impinger, QF (PM10 and TSP), and marbles | 142–148 | 2.37–2.47 |
| 5 | Impinger, QF (PM10 and TSP), and marbles | no recorded | no recorded |
| 6 | Impinger, QF (PM10 and TSP) and marbles | 195–205 | 3.25–3.42 |
| Plate Type | CDTC 1 | CDEC 2 | CDSL 3 |
|---|---|---|---|
| Bacteria | Total Aerobic | Coliforms and E. coli | Salmonella |
| Temperature (°C) | 37 °C | 37 °C | 42 °C |
| Incubation time (h) | 18 | 18 | 24 |
| Expected phenotypic results | Most colonies will be red | Pink and purple colonies are coliforms and blue-colored colonies are E. coli | Green or blue colonies with and without the black center on a yellow background |
| Antimicrobial Class | Antimicrobial Agent | Breakpoints (µg/mL) | ||
|---|---|---|---|---|
| Susceptible | Intermediate | Resistant | ||
| Aminoglycosides | Gentamicin | ≤4 | 8 | ≥16 |
| Streptomycin 1 | ≤16 | N/A | ≥32 | |
| β-Lactam/β-Lactamase Inhibitor Combinations | Amoxicillin–Clavulanic Acid | ≤8/4 | 16/8 | ≥32/16 |
| Cephems | Cefoxitin | ≤8 | 16 | ≥32 |
| Ceftriaxone | ≤1 | 2 | ≥4 | |
| Ceftiofur | ≤2 | 4 | ≥8 | |
| Folate Pathway Inhibitors | Sulfisoxazole | 256 | N/A | ≥512 |
| Trimethoprim–Sulfamethoxazole | ≤2/38 | N/A | ≥4/76 | |
| Macrolides | Azithromycin 1 | ≤16 | N/A | ≥32 |
| Penicillins | Ampicillin | ≤8 | 16 | ≥32 |
| Phenicols | Chloramphenicol | ≤8 | 16 | ≥32 |
| Quinolones | Ciprofloxacin 2 | ≤0.06 | 0.12–0.5 | ≥1 |
| Nalidixic acid | ≤16 | N/A | ≥32 | |
| Tetracyclines | Tetracycline | ≤4 | 8 | ≥16 |
| Direction | Sample Type | Observations | Mean | Std. Dev. | Min | Max |
|---|---|---|---|---|---|---|
| downwind | PM10 | 33 | 0.00080 | 0.00111 | 0.00003 | 0.00380 |
| downwind | TSP | 42 | 0.00227 | 0.00279 | 0.00006 | 0.01006 |
| downwind | impinger | 33 | 0.00276 | 0.00297 | 0.00006 | 0.01006 |
| upwind | PM10 | 21 | 0.00008 | 0.00009 | 0.000004 | 0.00023 |
| upwind | TSP | 21 | 0.00009 | 0.00005 | 0.00003 | 0.00018 |
| upwind | impinger | 21 | 0.00009 | 0.00005 | 0.00003 | 0.00018 |
Disclaimer/Publisher’s Note: The statements, opinions and data contained in all publications are solely those of the individual author(s) and contributor(s) and not of MDPI and/or the editor(s). MDPI and/or the editor(s) disclaim responsibility for any injury to people or property resulting from any ideas, methods, instructions or products referred to in the content. |
© 2025 by the authors. Licensee MDPI, Basel, Switzerland. This article is an open access article distributed under the terms and conditions of the Creative Commons Attribution (CC BY) license (https://creativecommons.org/licenses/by/4.0/).
Share and Cite
Leon, I.M.; Auvermann, B.W.; Bush, K.J.; Casey, K.D.; Pinchak, W.E.; Levent, G.; Vinasco, J.; Lawhon, S.D.; Smith, J.K.; Scott, H.M.; et al. Comprehensive Analysis of E. coli, Enterococcus spp., Salmonella enterica, and Antimicrobial Resistance Determinants in Fugitive Bioaerosols from Cattle Feedyards. Appl. Microbiol. 2025, 5, 63. https://doi.org/10.3390/applmicrobiol5030063
Leon IM, Auvermann BW, Bush KJ, Casey KD, Pinchak WE, Levent G, Vinasco J, Lawhon SD, Smith JK, Scott HM, et al. Comprehensive Analysis of E. coli, Enterococcus spp., Salmonella enterica, and Antimicrobial Resistance Determinants in Fugitive Bioaerosols from Cattle Feedyards. Applied Microbiology. 2025; 5(3):63. https://doi.org/10.3390/applmicrobiol5030063
Chicago/Turabian StyleLeon, Ingrid M., Brent W. Auvermann, K. Jack Bush, Kenneth D. Casey, William E. Pinchak, Gizem Levent, Javier Vinasco, Sara D. Lawhon, Jason K. Smith, H. Morgan Scott, and et al. 2025. "Comprehensive Analysis of E. coli, Enterococcus spp., Salmonella enterica, and Antimicrobial Resistance Determinants in Fugitive Bioaerosols from Cattle Feedyards" Applied Microbiology 5, no. 3: 63. https://doi.org/10.3390/applmicrobiol5030063
APA StyleLeon, I. M., Auvermann, B. W., Bush, K. J., Casey, K. D., Pinchak, W. E., Levent, G., Vinasco, J., Lawhon, S. D., Smith, J. K., Scott, H. M., & Norman, K. N. (2025). Comprehensive Analysis of E. coli, Enterococcus spp., Salmonella enterica, and Antimicrobial Resistance Determinants in Fugitive Bioaerosols from Cattle Feedyards. Applied Microbiology, 5(3), 63. https://doi.org/10.3390/applmicrobiol5030063