Article

Effect of r-Human Insulin (Humulin®) and Sugars on Escherichia coli K-12 Biofilm Formation

by
Balbina J. Plotkin
1,*,
Ira Sigar
1 and
Monika Konaklieva
2
1
Department of Microbiology and Immunology, Midwestern University, Downers Grove, IL 60515, USA
2
Department of Chemistry, American University, Washington, DC 20016, USA
*
Author to whom correspondence should be addressed.
Appl. Microbiol. 2025, 5(3), 58; https://doi.org/10.3390/applmicrobiol5030058 (registering DOI)
Submission received: 21 May 2025 / Revised: 23 June 2025 / Accepted: 25 June 2025 / Published: 27 June 2025

Abstract

E. coli attaches to, and forms biofilms on various surfaces, including latex and polystyrene, contributing to nosocomial spread. E. coli responds to both exogenous and endogenous insulin, which induces behavioral changes. Human insulin, a quorum signal surrogate for microbial insulin, may affect the ability of E. coli to interact with latex and polystyrene in the presence of various sugars. E. coli ATCC 25923 was grown in peptone (1%) yeast nitrogen base broth to either the logarithmic or stationary growth phase. Adherence to latex was determined using 6 × 6 mm latex squares placed in a suspension of washed cells (103 CFU/mL; 30 min; 37 °C) in buffer containing insulin at 2, 20, and 200 µU/mL (Humulin® R; Lilly) with and without mannose, galactose, fructose, sorbose, arabinose, xylose, lactose, maltose, melibiose, glucose-6-phosphate, glucose-1-phosphate, and glucosamine at concentrations reported to affect behavioral response. Attachment levels to latex were determined by the press plate method. Biofilm levels were measured in a similar fashion but with overnight cultures in flat bottom uncoated polystyrene plates. Controls were media, insulin, sugar, or buffer alone. Glucose served as the positive control. Overall, the stationary phase cells’ adherence to latex was greater, regardless of the test condition, than was measured for the logarithmic phase cells. The effect of insulin on adherence to latex was insulin and sugar concentration dependent. The addition of insulin (200 µU/mL) resulted in a significantly (p < 0.05) increased adherence to latex and biofilm formation on polystyrene compared with sugar alone for 12 of the 13 sugars tested with stationary phase bacteria and 10 of the 13 sugars tested with logarithmic phase bacteria. Adherence in response to sorbose was the only sugar tested that was unaffected by insulin. These findings show that insulin enhances E. coli’s association with materials in common usage in medical environments in a nutrition-dependent manner.

1. Introduction

Inter-kingdom communication is increasingly recognized as playing a role in the bacterial expressions of phenotypes associated with virulence and environmental survival. These communication molecules act in a manner similar to that reported for quorum autoinducer (AI) signals, i.e., regulation of the expression of factors associated with virulence including, adherence, chemotaxis, toxin excretion, and increased resistance to antibiotics [1,2,3,4]. Insulin is an important signaling molecule in this inter-kingdom communication [5,6,7].
Insulin is a phylogenetically ancient protein synthesized by organisms across the taxonomic kingdoms. Aspergillus, Neurospora, Tetrahymena, and E. coli all produce insulin with chemical properties (size and charge), bioactivity (rat adipocyte [3H]glucose uptake), and immune activity (radioimmunoassay), which overlap with those of mammalian insulins including humans [8,9,10,11]. These findings further demonstrate the structure-activity relatedness of insulin across divergent organisms. The highly conserved nature of this protein in evolution, and its production and secretion throughout E. coli’s growth cycle, argues that its presence has a fundamental function. Previous studies have indicated that r-human insulin induces phenotypic changes analogous to those reported for other AIs, but with a broader range of activity [5,7,12,13]. To date, all studies have focused on the coordinate effects of r-insulin and glucose. We hypothesize that human insulin, a signal surrogate for microbial insulin, alters the ability of E. coli to interact with plastic (polystyrene) and latex in the presence of various carbohydrates. To test this hypothesis, we measured the effect of insulin on E. coli adherence to surgical latex and polystyrene in the presence of various sugars.

2. Materials and Methods

All materials used for this study were obtained from commercial sources.

2.1. Bacterial Strain and Culture Conditions

E. coli ATCC 25923, a highly stable quality control E. coli K12 strain, was used. The isolate was maintained at –80 °C until inoculated onto Luria-Bertani (LB) agar (BD Difco, Franklin Lakes, NJ, USA; Catalog No. DF0446-07-5) plates for use.

2.2. Bacterial Growth Phase

The role the growth phase plays in adherence to latex was measured. E. coli was grown in peptone (1%; Gibco™ Bacto™ Peptone, Fisher Scientific, Waltham, MA USA 02451 Catalog No. DF0118-17-0) and yeast nitrogen base broth (YNBP; Fisher Scientific, Waltham, MA USA 02451; Catalog No. DF0335-15-9) to either the logarithmic (log; Abs 600 nm = 0.3) or stationary (stat; Abs 600 nm = 0.6) growth phase. Both log and stat growth phase cells were harvested by centrifugation at 1500× g for 20 min at ambient temperature.

2.3. Latex Adherence

Uniform latex squares (6 × 6 mm) were obtained by cutting commercially certified virgin natural rubber latex smooth texture gloves from a single lot (Adenna ProWorks Natural Latex Powder-free Gloves; smooth texture; Adenna LLC, Tustin, CA, USA; Catalog No. SKU: M120222 GL-L105FL). Latex squares were prepared by incubation in a sodium hypochlorite solution (5.6%; 5 min, ambient temperature; Chlorox® commercial household bleach). No alterations in surface texture (smooth) or interaction with E. coli were observed. This was followed by extensive washing in at least four changes of sterile water. The squares were then aseptically transferred for drying in a sterile Petri dish. Adherence to latex squares was determined by placing the squares in Petri dishes containing 20 mL of logarithmic (log) or stationary (stat) growth phase bacterial suspension (108 CFU/mL) in PBS alone, or with the various sugars with and without insulin. The sugar concentrations were guided by the peak and threshold behavioral response concentrations (Table 1) [14]. Insulin concentrations were based on the human physiological range of insulin (2, 20 and 200 µU/mL; Humulin® R, Eli Lilly and Co, Indianapolis, IN, USA) [15,16]. After static incubation (37 °C, 30 min), the fluid was aspirated from the Petri dish, and the latex squares washed in four changes of PBS (20 mL each wash). After washing, both sides of the latex square were pressed onto trypticase soy agar (TSA, Troy Biologicals, Troy, MI, USA; Catalog No. SKU: R455006) plates, and colonies were counted after incubation (37 °C, 24 h). Controls consisted of bacteria in PBS, media, PBS with insulin, or PBS with sugar alone. The mean ± SEM for bacteria in PBS, media, and PBS with insulin ranged from 0 to <1.0 ± 0.05 CFU/latex square.

2.4. Hydrophobic Biofilm Assay

Adherence to polystyrene is a measure of the ability to form biofilms on a moderately hydrophobic surface [17,18,19]. Each sugar (Table 1) was dissolved in yeast nitrogen base (without amino acids; BD-Difco, Franklin Lakes, NJ, USA) with 1% peptone (YNBP broth) and then serially diluted in YNBP (96 well uncoated polystyrene plate, 100 µL YNBP/well, Evergreen Science, Buffalo, NY, USA). YNBP, with various concentrations of r-insulin (Humulin® R, Eli Lilly and Co., Indianapolis, IN, USA) or YNBP alone, was inoculated from an overnight culture to 105 CFU/mL (initial concentration; pH 7.2). This culture was added to each well (100 µL). After overnight growth (18 h, 37 °C), the wells were carefully emptied, washed four times with phosphate buffered saline (in one-liter ddw: 8 g NaCl, 0.2 g KCl, 1.15 g Na2HPO4, 0.2 g KH2PO4), air-dried, then stained with 300 µL of crystal violet (Troy Biologics). After the plate wells were stained for ~1 min, the wells were emptied, thoroughly rinsed free of non-bound stain, and dried. The adherent stain was dissolved in absolute alcohol (300 µL). Absorbance was determined by an EIA spectrophotometer (Dynatech Laboratories, Inc., Chantilly, VA, USA; Abs 595 nm). Controls consisted of organisms tested in PBS with sugar and/or insulin. Experiments were conducted in octuplicate and repeated thrice (total n = 24). Biofilms in the presence of buffer alone for all test conditions ranged from 0 to <±0.003 Abs 595 nm.

2.5. Statistics

All assays were carried out at least in quadruplicate and repeated at least twice. Statistical analysis was conducted with Instat (GraphPad, version 4) using repeated measures ANOVA with Tukey post hoc tests. If p < 0.05, a Tukey–Kramer post hoc analysis was applied (Instat, GraphPad Software, San Diego, CA, USA).

3. Results

3.1. Binding to Latex

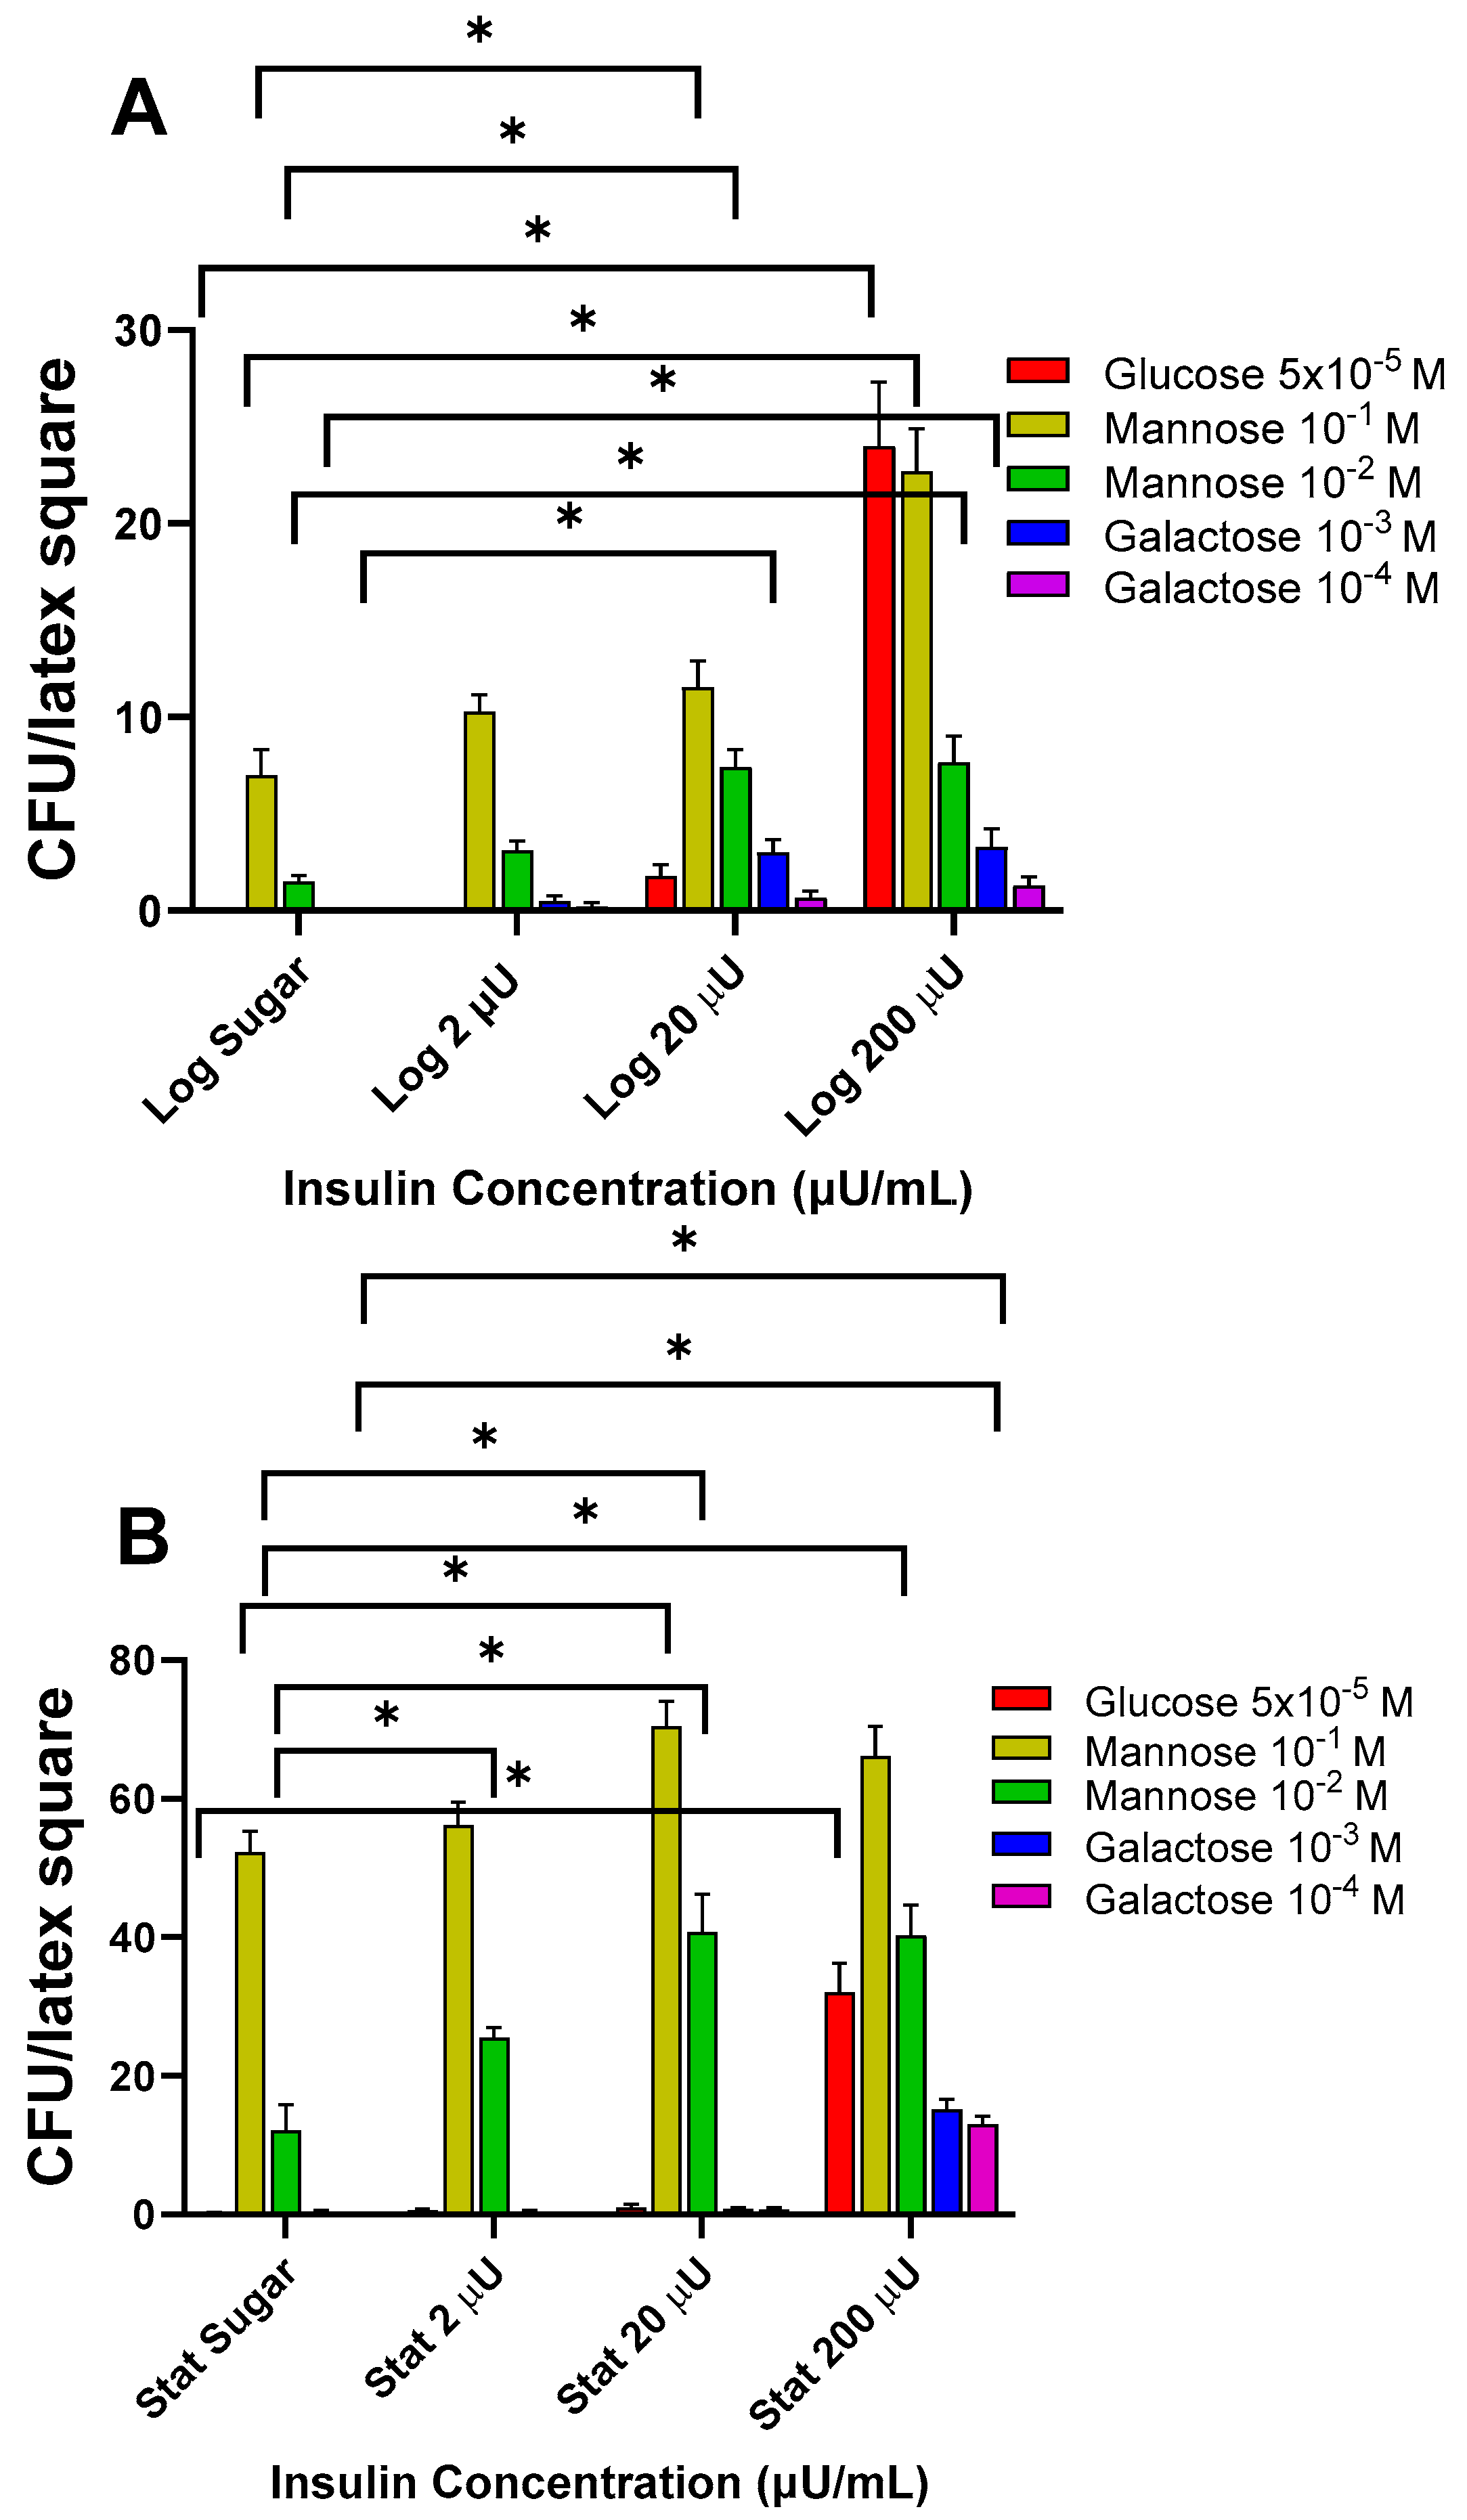
3.1.1. Effects of Insulin with 6-Carbon Aldo Sugars on Log and Stat E. coli Adherence

Both glucose and mannose elicited the highest level of attachment to latex in response to the presence of insulin (20 and 200 µU/mL insulin) (Figure 1A,B). For both the log and stat growth phase cells, mannose (10−1 M) with 200 or 20 µU/mL insulin, respectively, supported maximum attachment. The highest level was for mannose-insulin (20 µU/mL insulin) in the stat growth phase (70.5 ± 3.5 CFU/latex square), which was 1.3-fold higher than mannose alone for the stat growth phase cells. Insulin had a greater impact on the log growth phase cells (200 µU/mL) where the insulin exposed cells were 3.2-fold higher than mannose alone. Interestingly, the log growth phase cells in the presence of glucose and insulin) were only responsive with 200 µU/mL insulin, while both 20 and 200 µU/mL insulin significantly increased the level of binding for the stat growth phase cells. While the adherence to latex for log cells in galactose was similar across all insulin concentrations, the generalized increase in the adherence of stat growth phase bacteria occurred overall regardless of the sugar tested (Figure 1A,B). In addition, the enhancement in adherence in response to glucose, mannose, and galactose was concentration specific with regard to both the insulin concentration and sugar concentration tested.

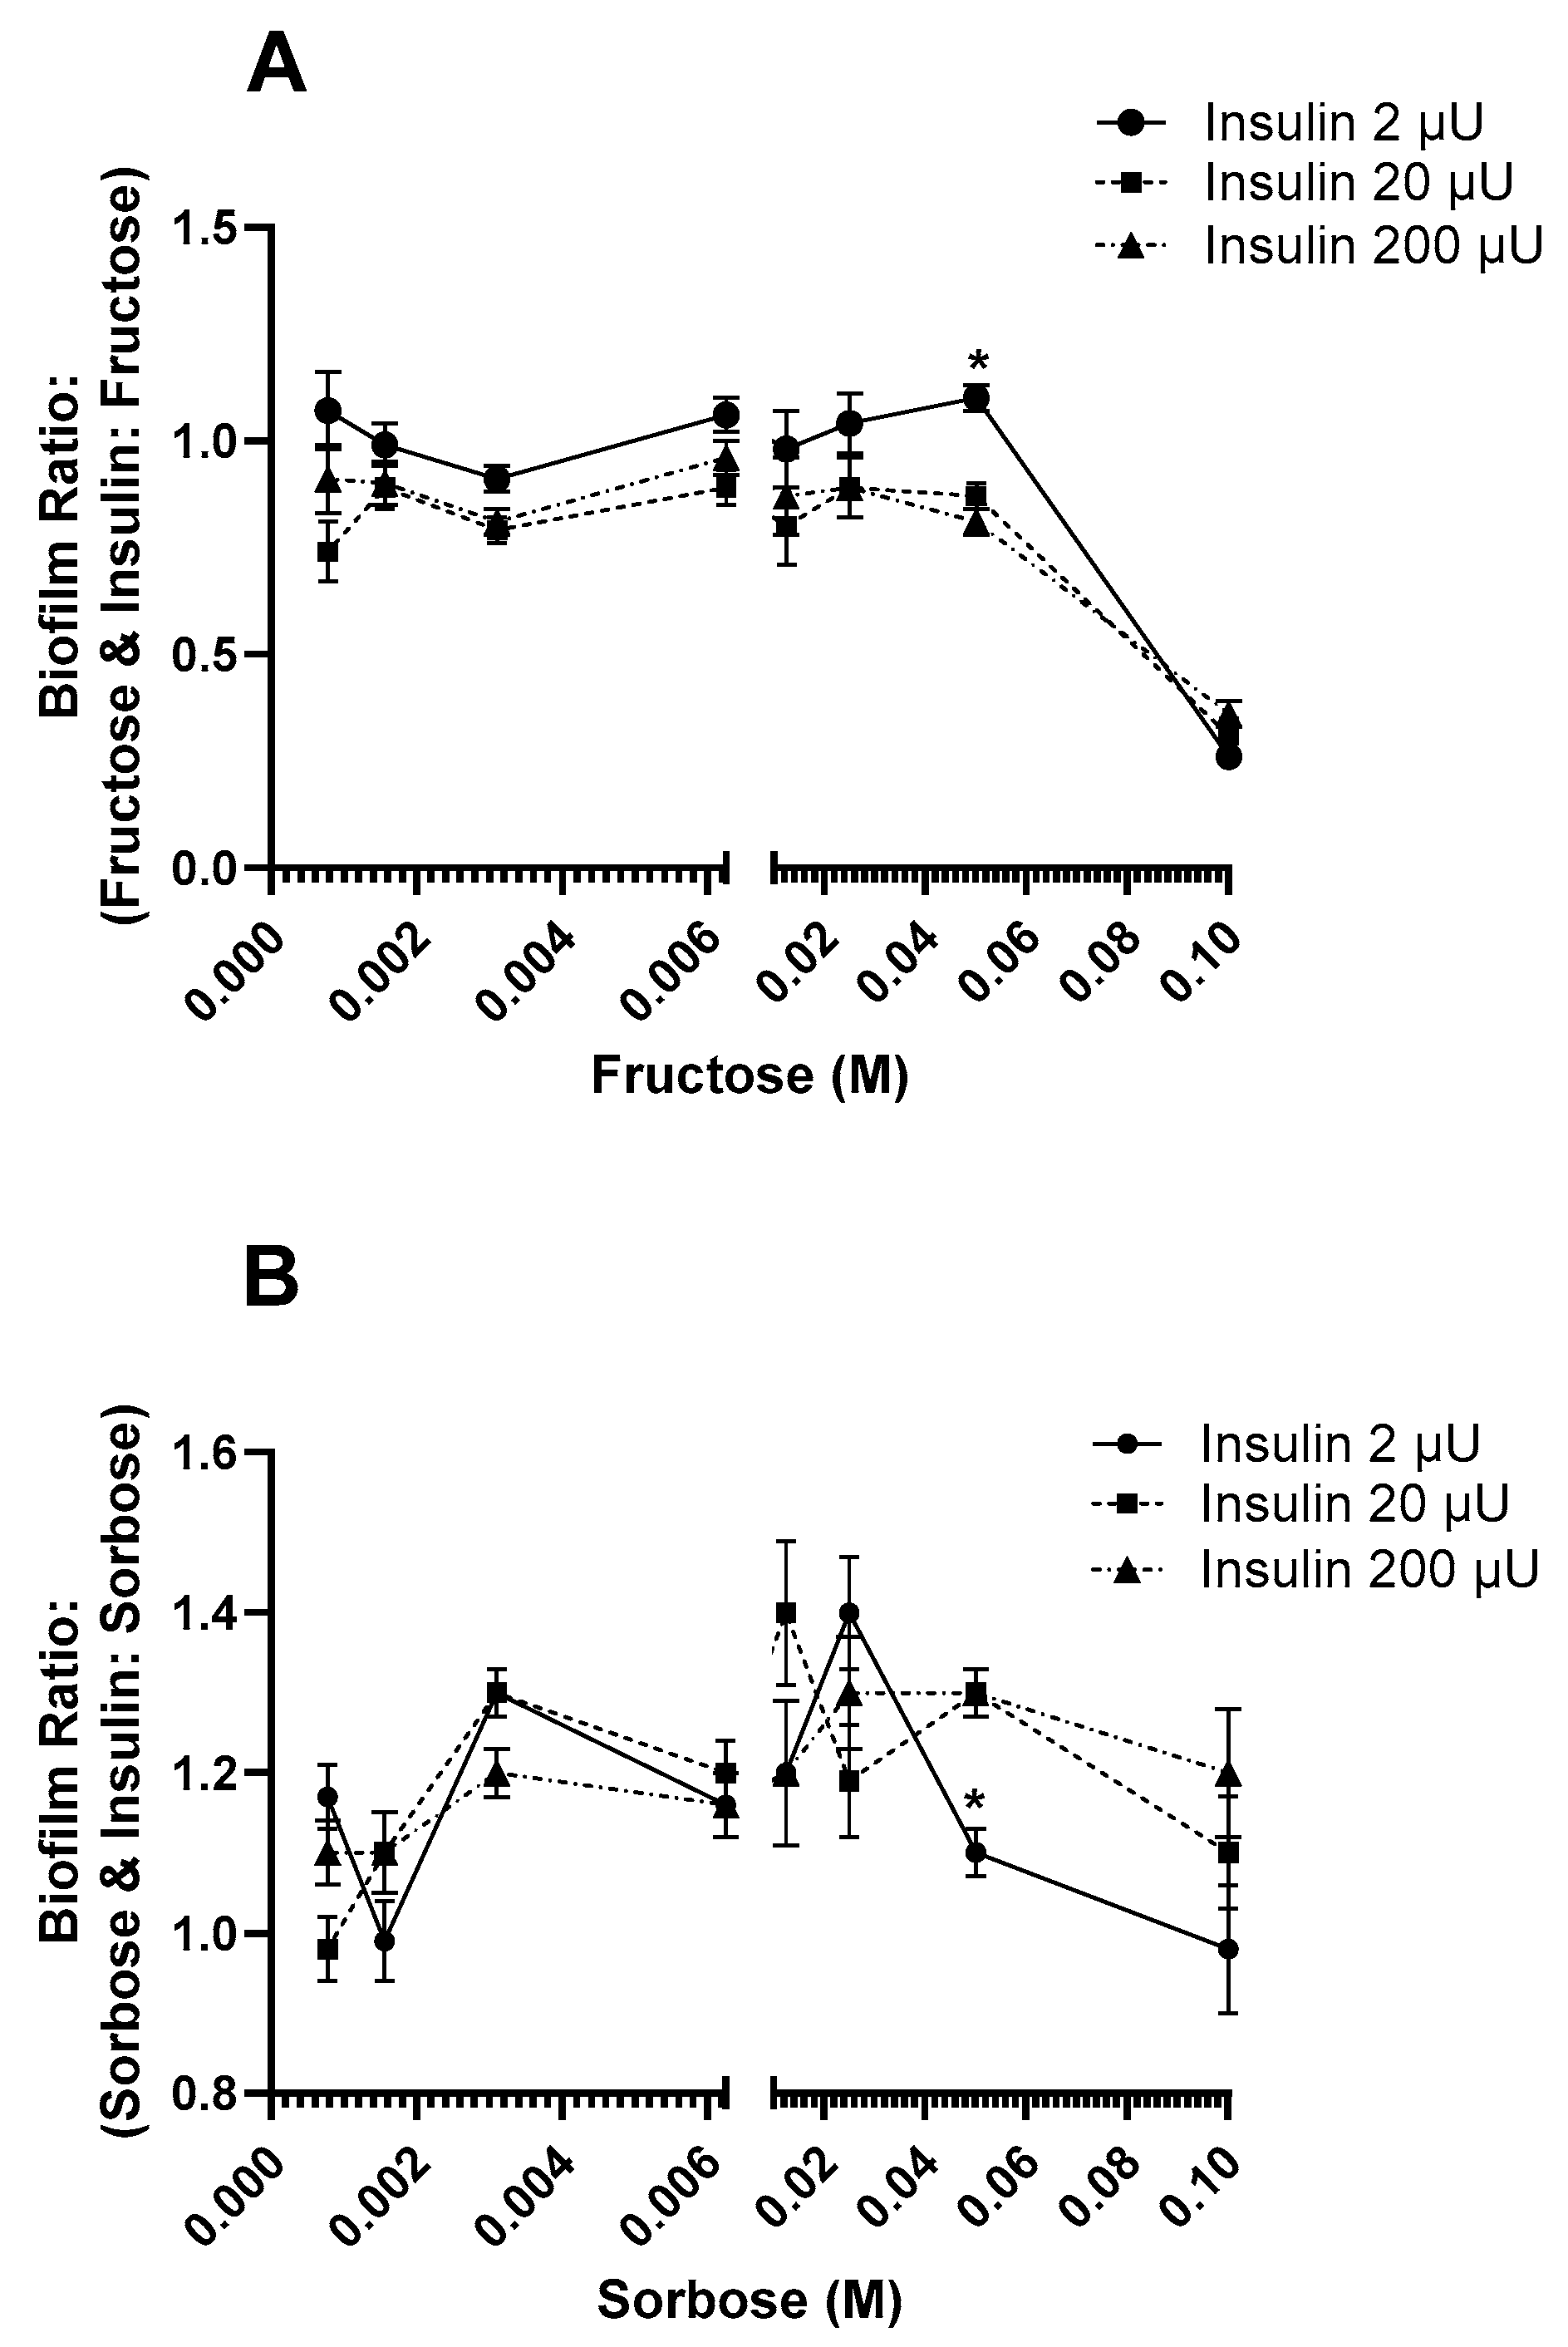
3.1.2. Effects of Insulin with 6-Carbon Keto Sugars on Log and Stat E. coli Binding

In contrast to fructose-insulin or fructose alone, the log growth phase E. coli with sorbose-insulin responded to the presence of insulin (20 or 200 µU/mL) through significantly (p < 0.05), albeit minimally (1.86 ± 0.46 and 2.11 ± 0.69 CFU/latex square, respectively), increased attachment levels (Figure 2A,B). Interestingly, the binding of stat cells was unaffected by sorbose with insulin (i.e., binding was similar to the sorbose control). The reverse pattern was measured for the fructose effects. While log cells adhering to latex in fructose with insulin were similar to fructose only, the reverse pattern was measured for stat cells with respect to fructose with 200 µU/mL insulin (19.88 ± 1.5 CFU/latex square). Though E. coli can utilize sorbose and fructose as a carbon and energy source, their adherence can be influenced by the sugar concentration [20]. However, both the attachment and subsequent biofilm formation were tested over a range of concentrations but yielded similar responses. While the presence of insulin modulates this response, the effect should be taken into consideration together with the use of sugar concentrations applicable to chemotactic responses, particularly since the release of cells from biofilms and their return to a planktonic state can occur in response to chemotactic stimuli [21].

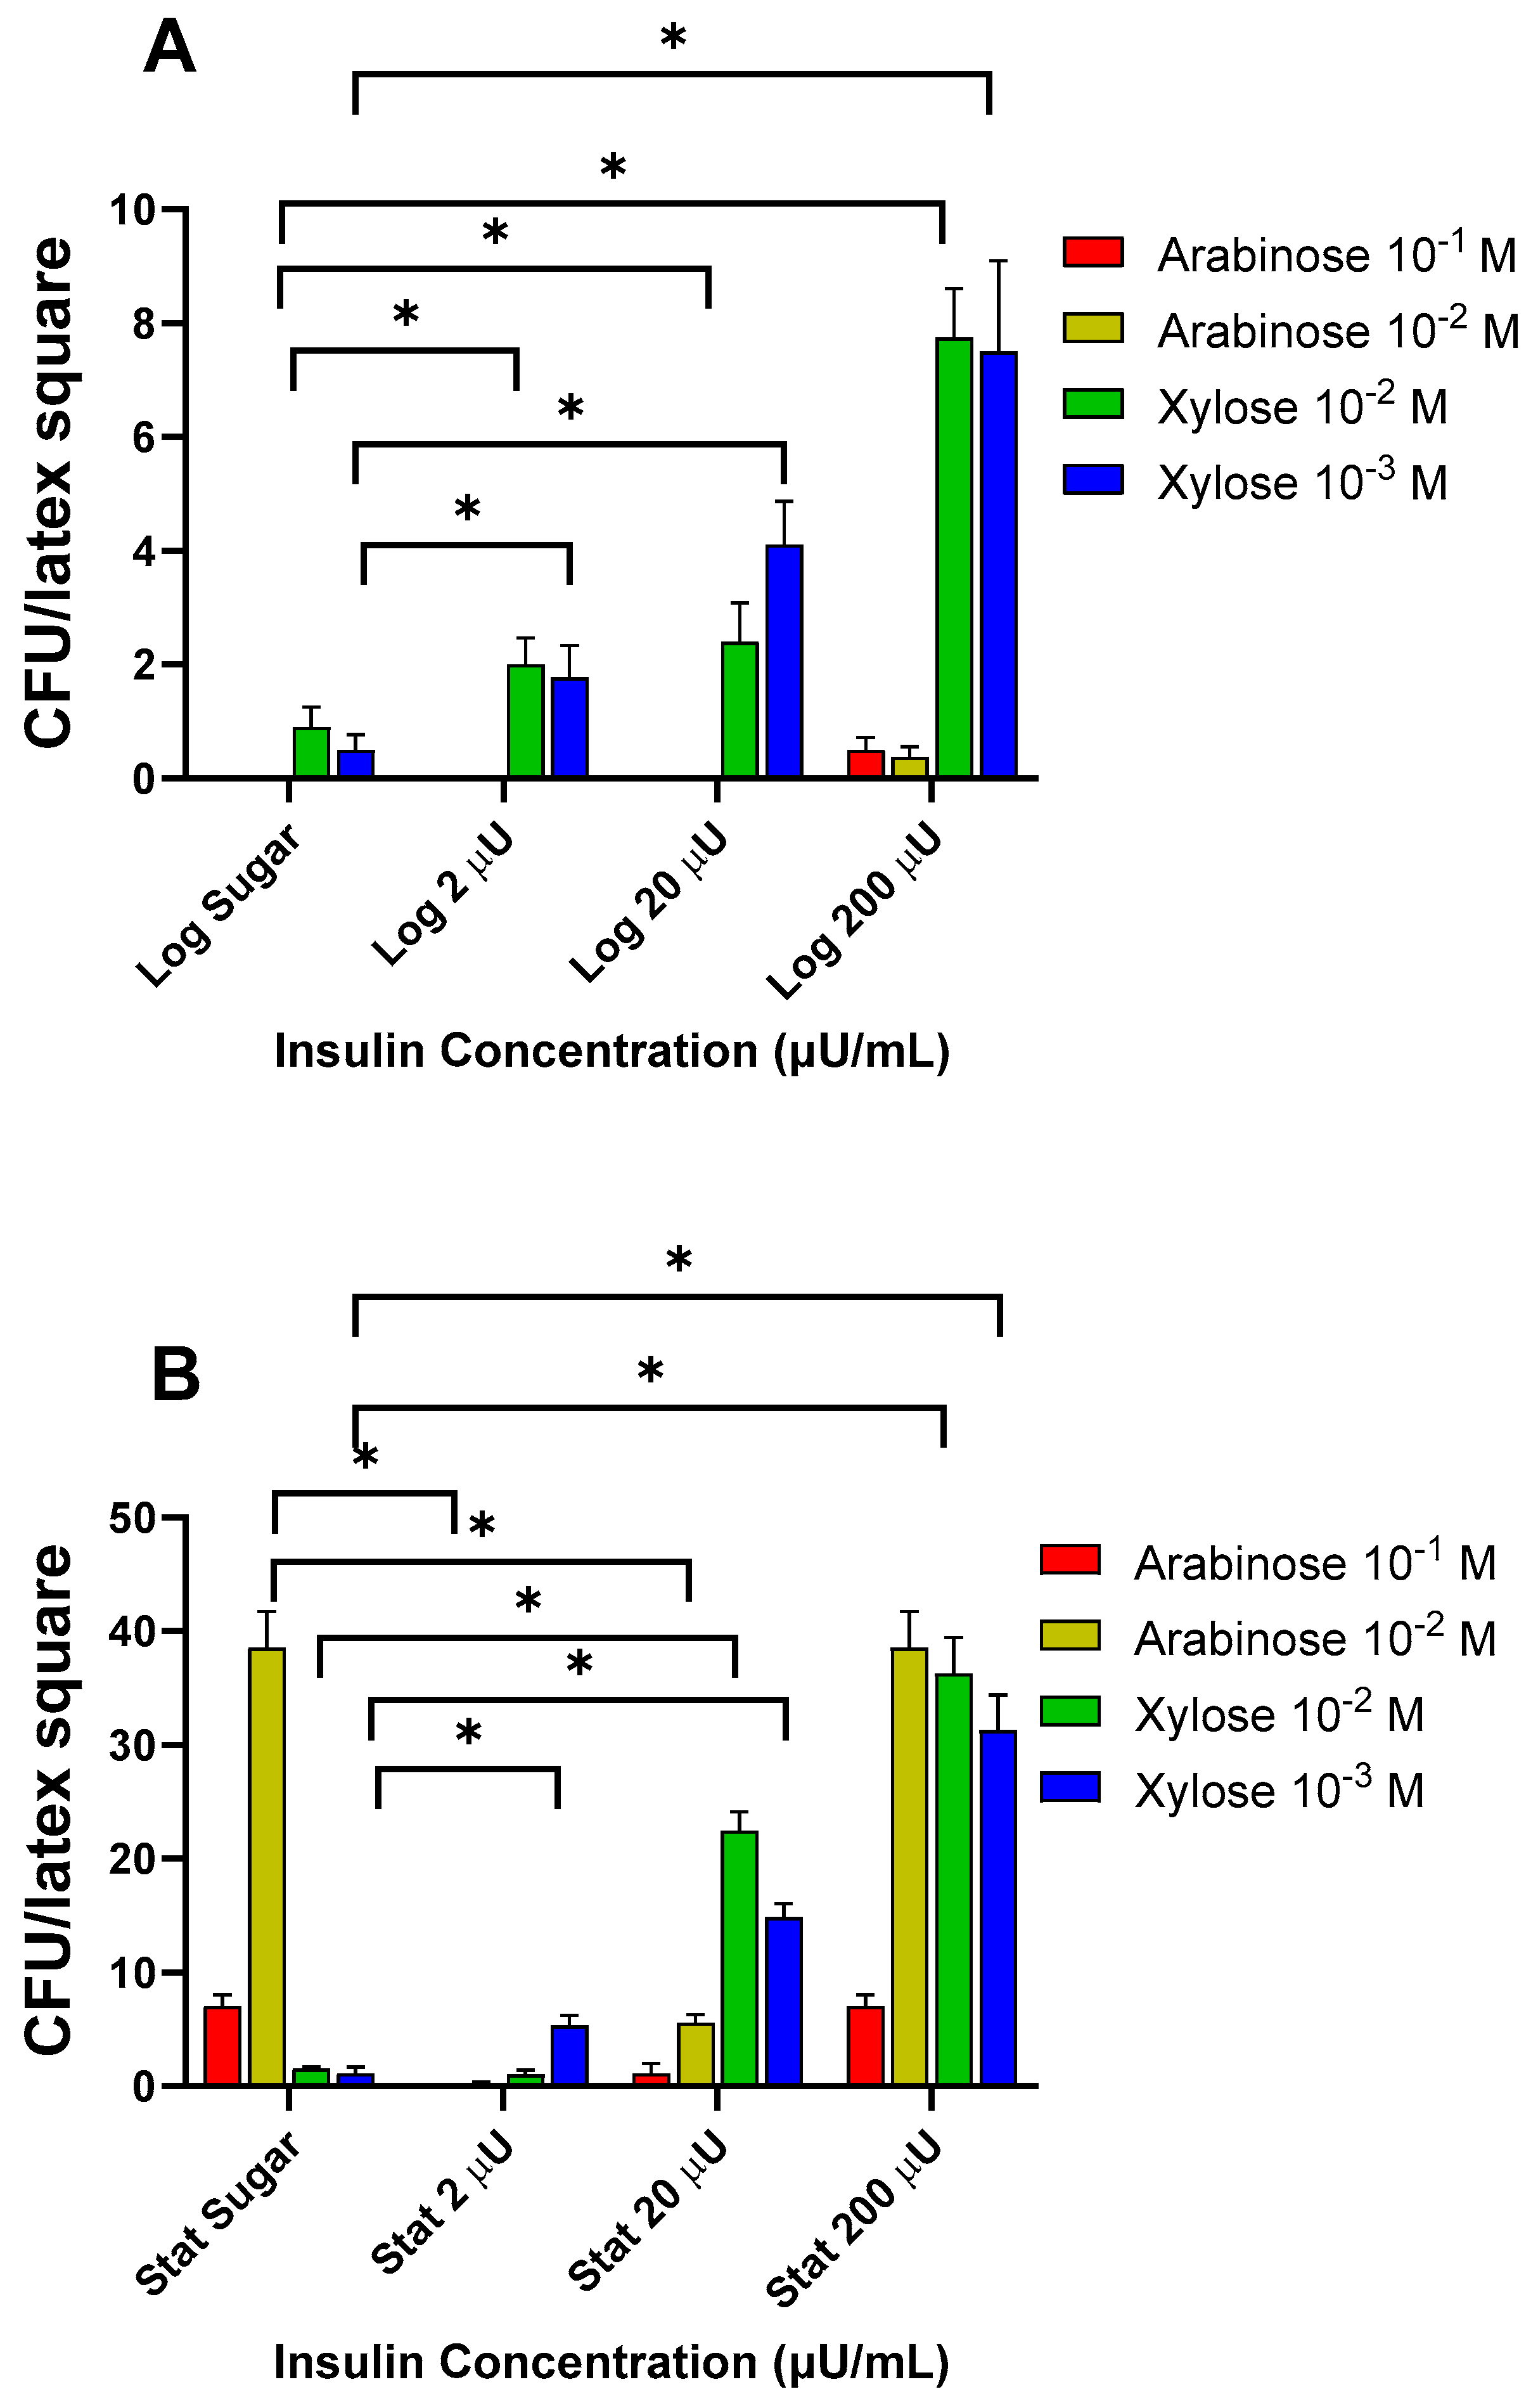
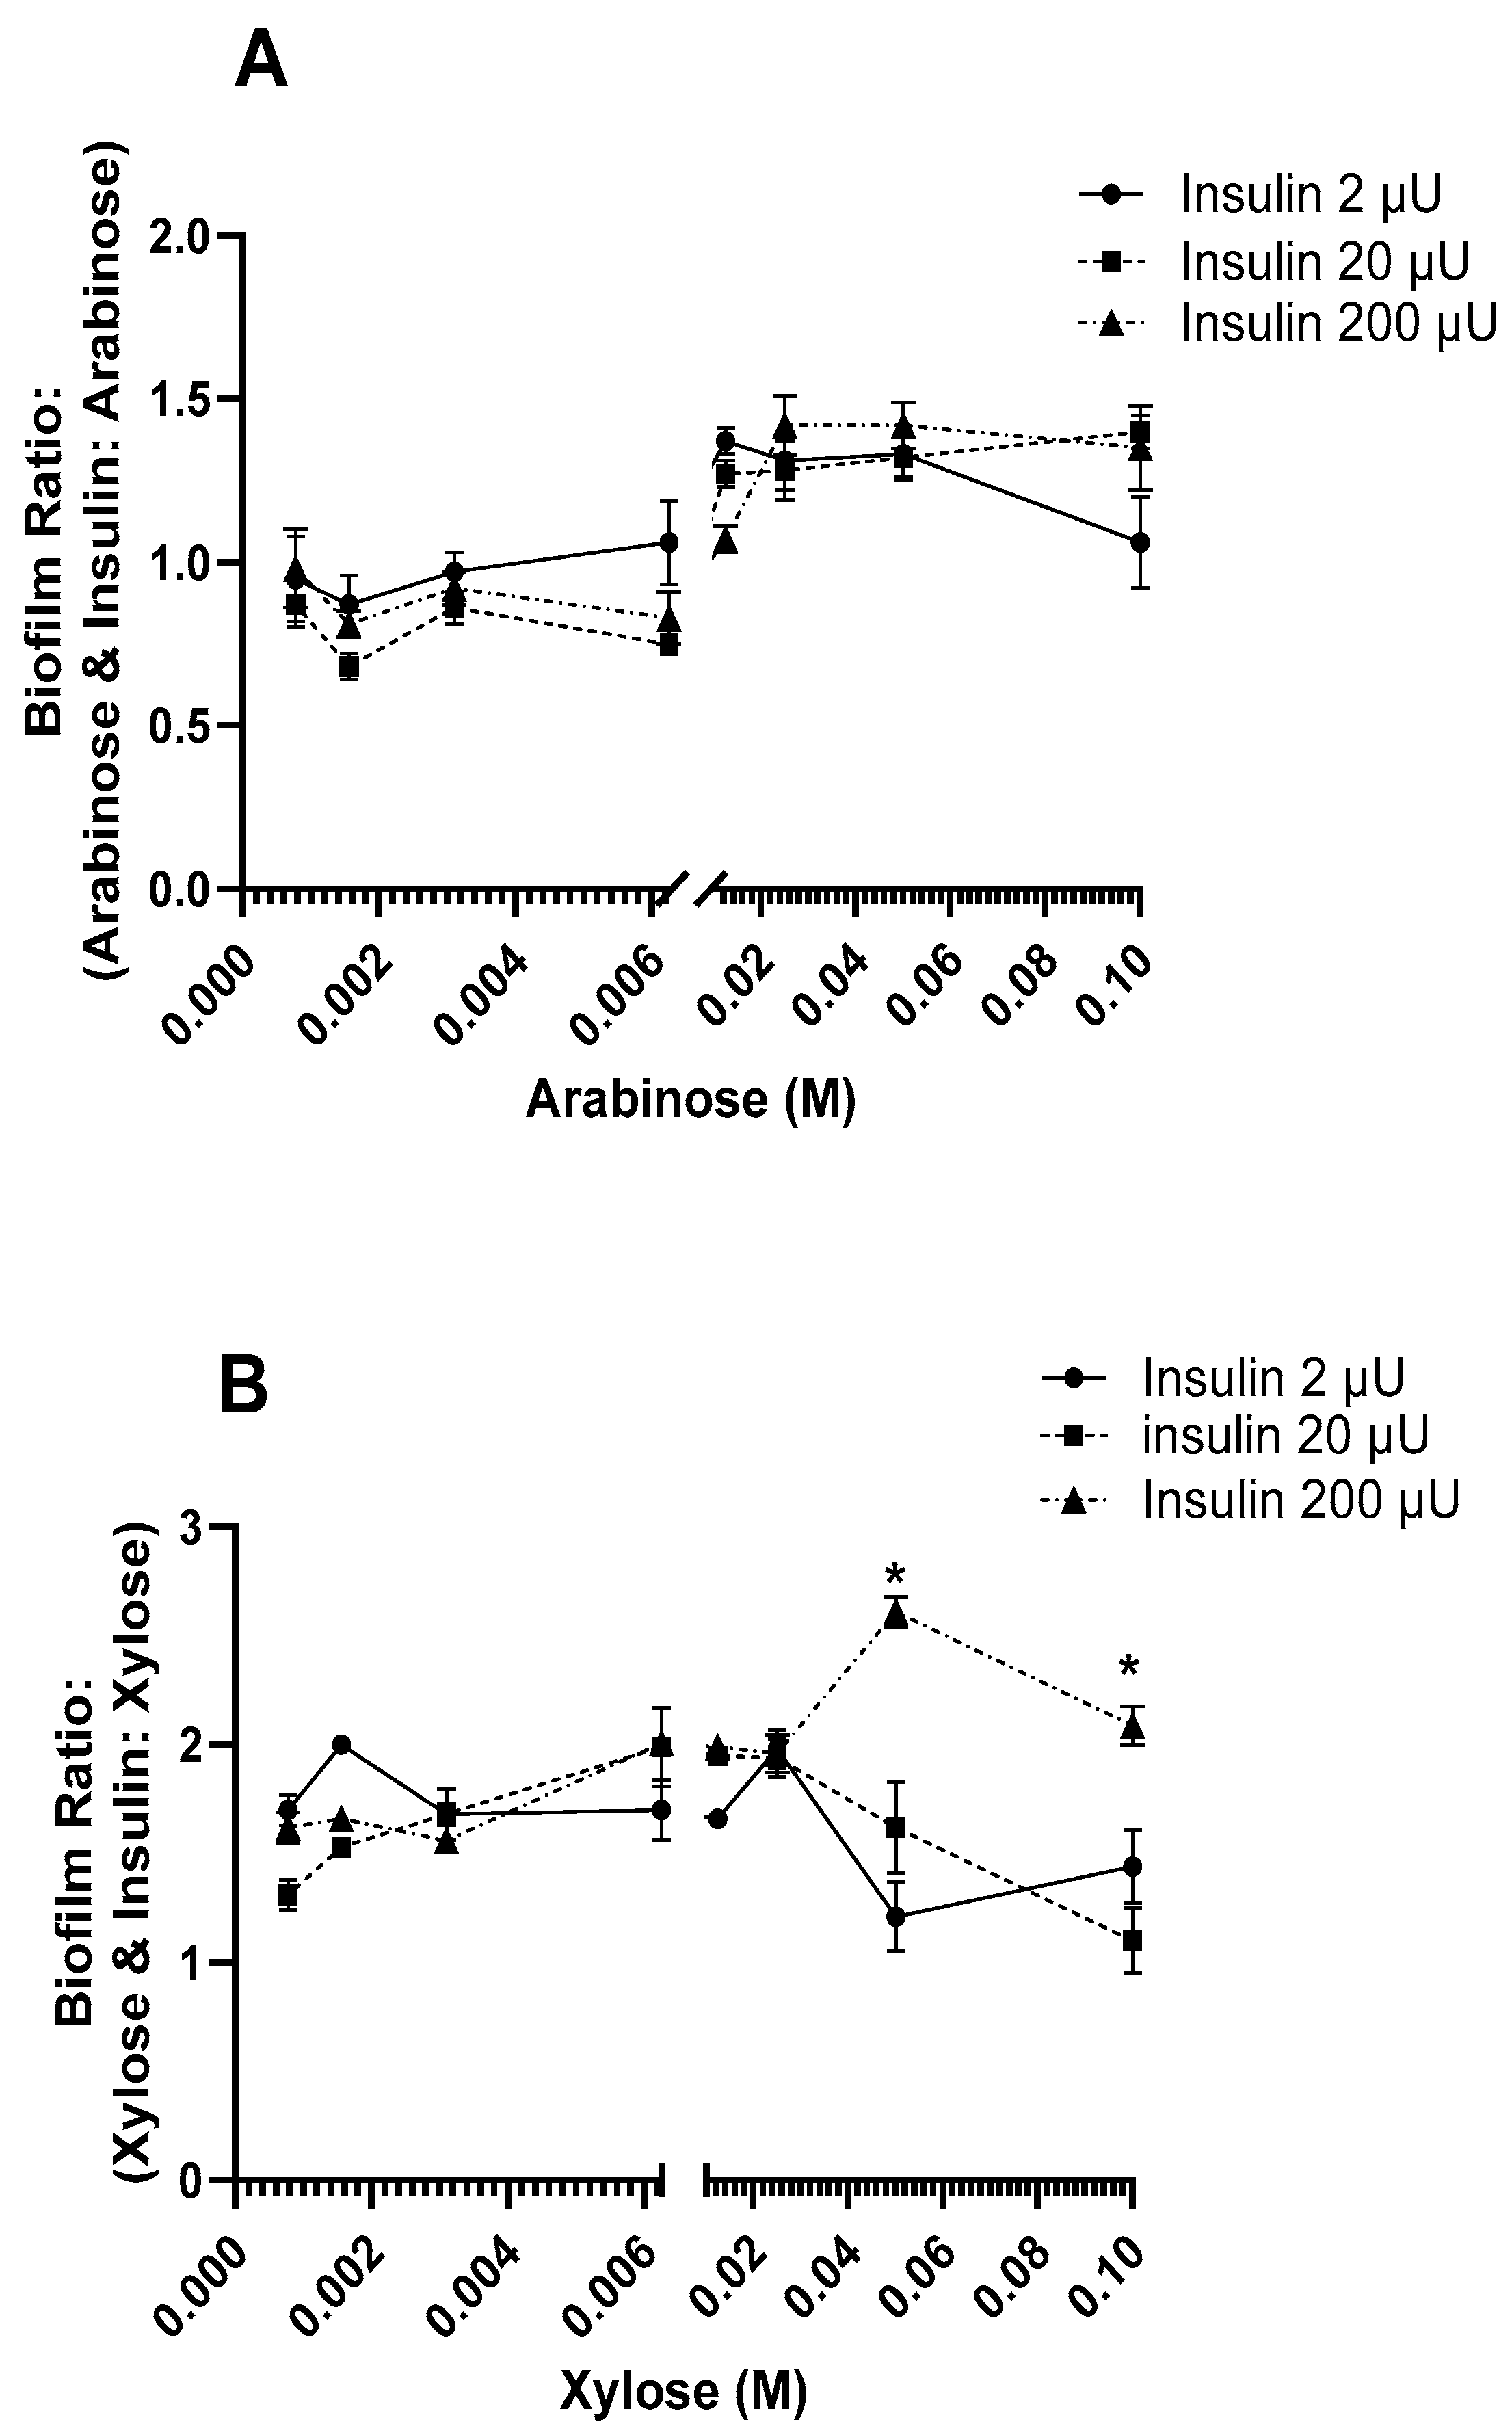
3.1.3. Effects of Insulin with 5-Carbon Sugars on Log and Stat E. coli Binding

The impact of five carbon sugars (arabinose and xylose) on the log and stat growth phase of E. coli binding is shown in Figure 3A,B. Binding of the log growth phase cells in the presence of arabinose, regardless of sugar concentration or insulin levels, had no significant effect on binding to latex compared with the insulin-free control. In contrast, both xylose concentrations (10−2 and 10−3 M) with either 20 or 200 µU/mL insulin enabled binding that was significantly (p < 0.05) increased compared with xylose alone (7.8 ± 0.9 and 7.5 ± 1.6 CFU/latex square, respectively). Interestingly, the response to the arabinose alone control for the stat growth phase E. coli (10−2 M; 38.5 ± 3.24 CFU/latex square) was similar to the maximal level of binding in the presence of 200 µU/mL insulin (Figure 3B). In contrast, the binding of cells in the presence of arabinose with 2 (0.22 ± 0.15 CFU/latex square) and 20 µU/mL insulin (5.6 ± 1.72) was suppressed.

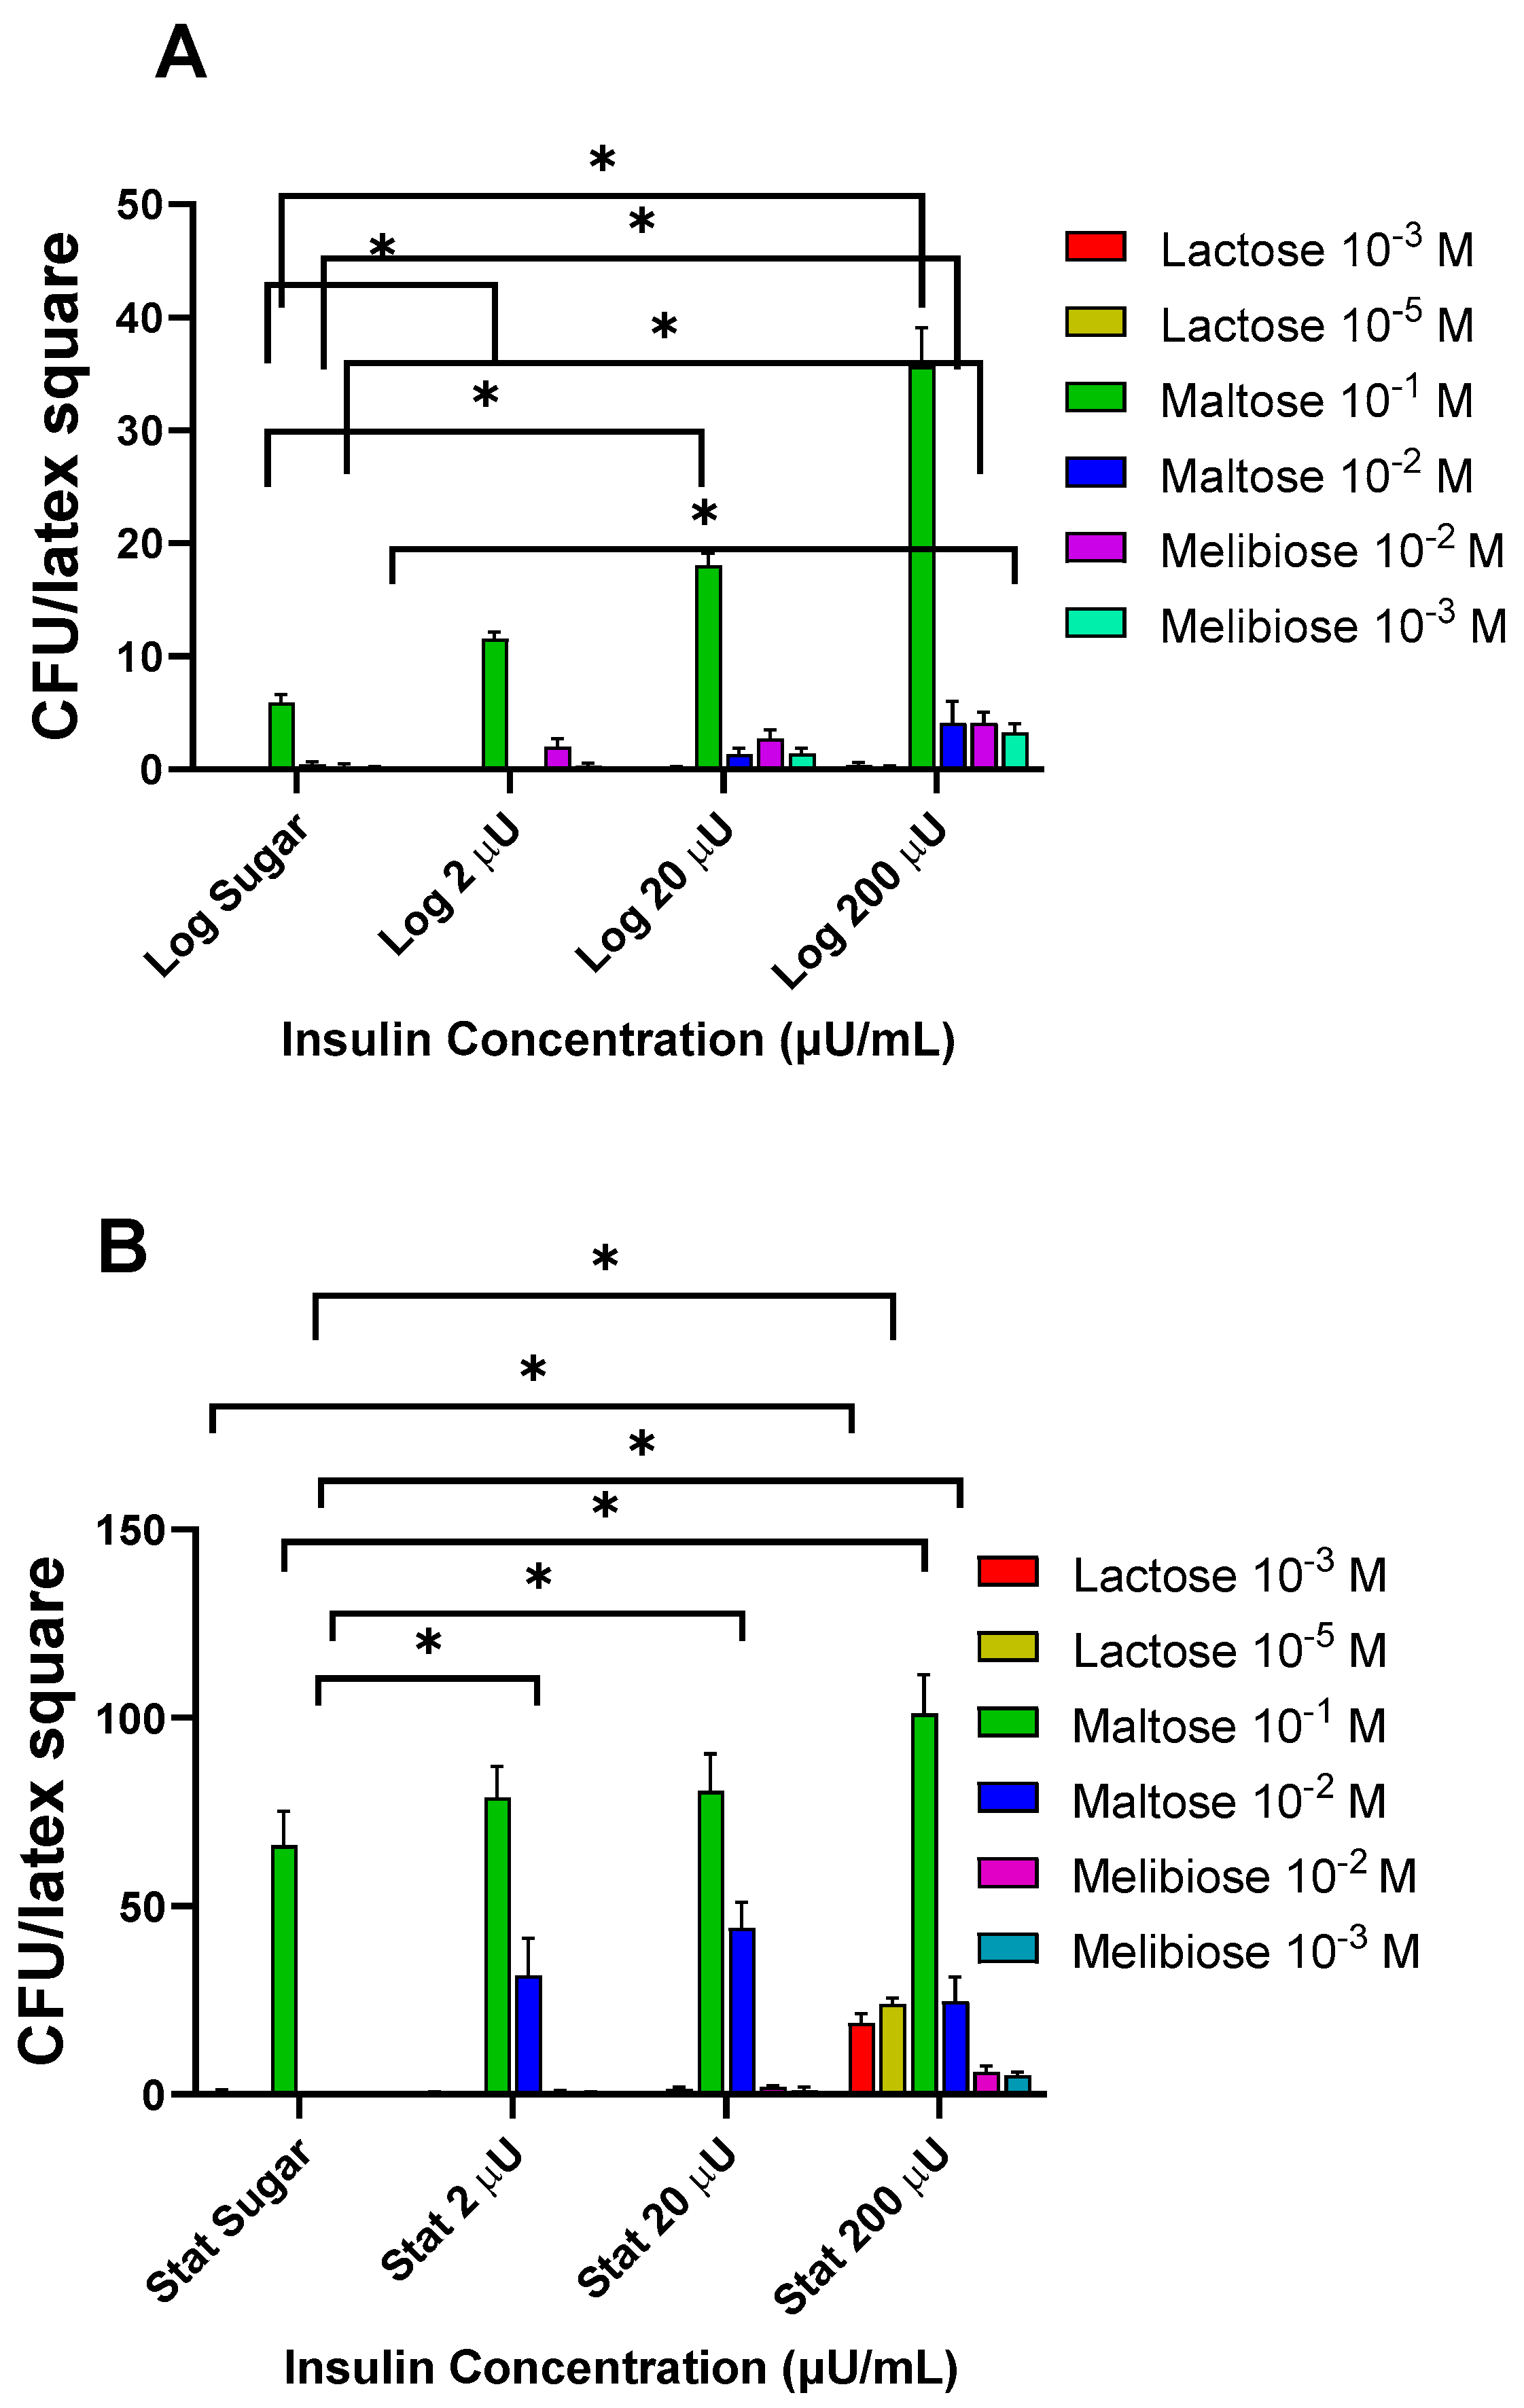
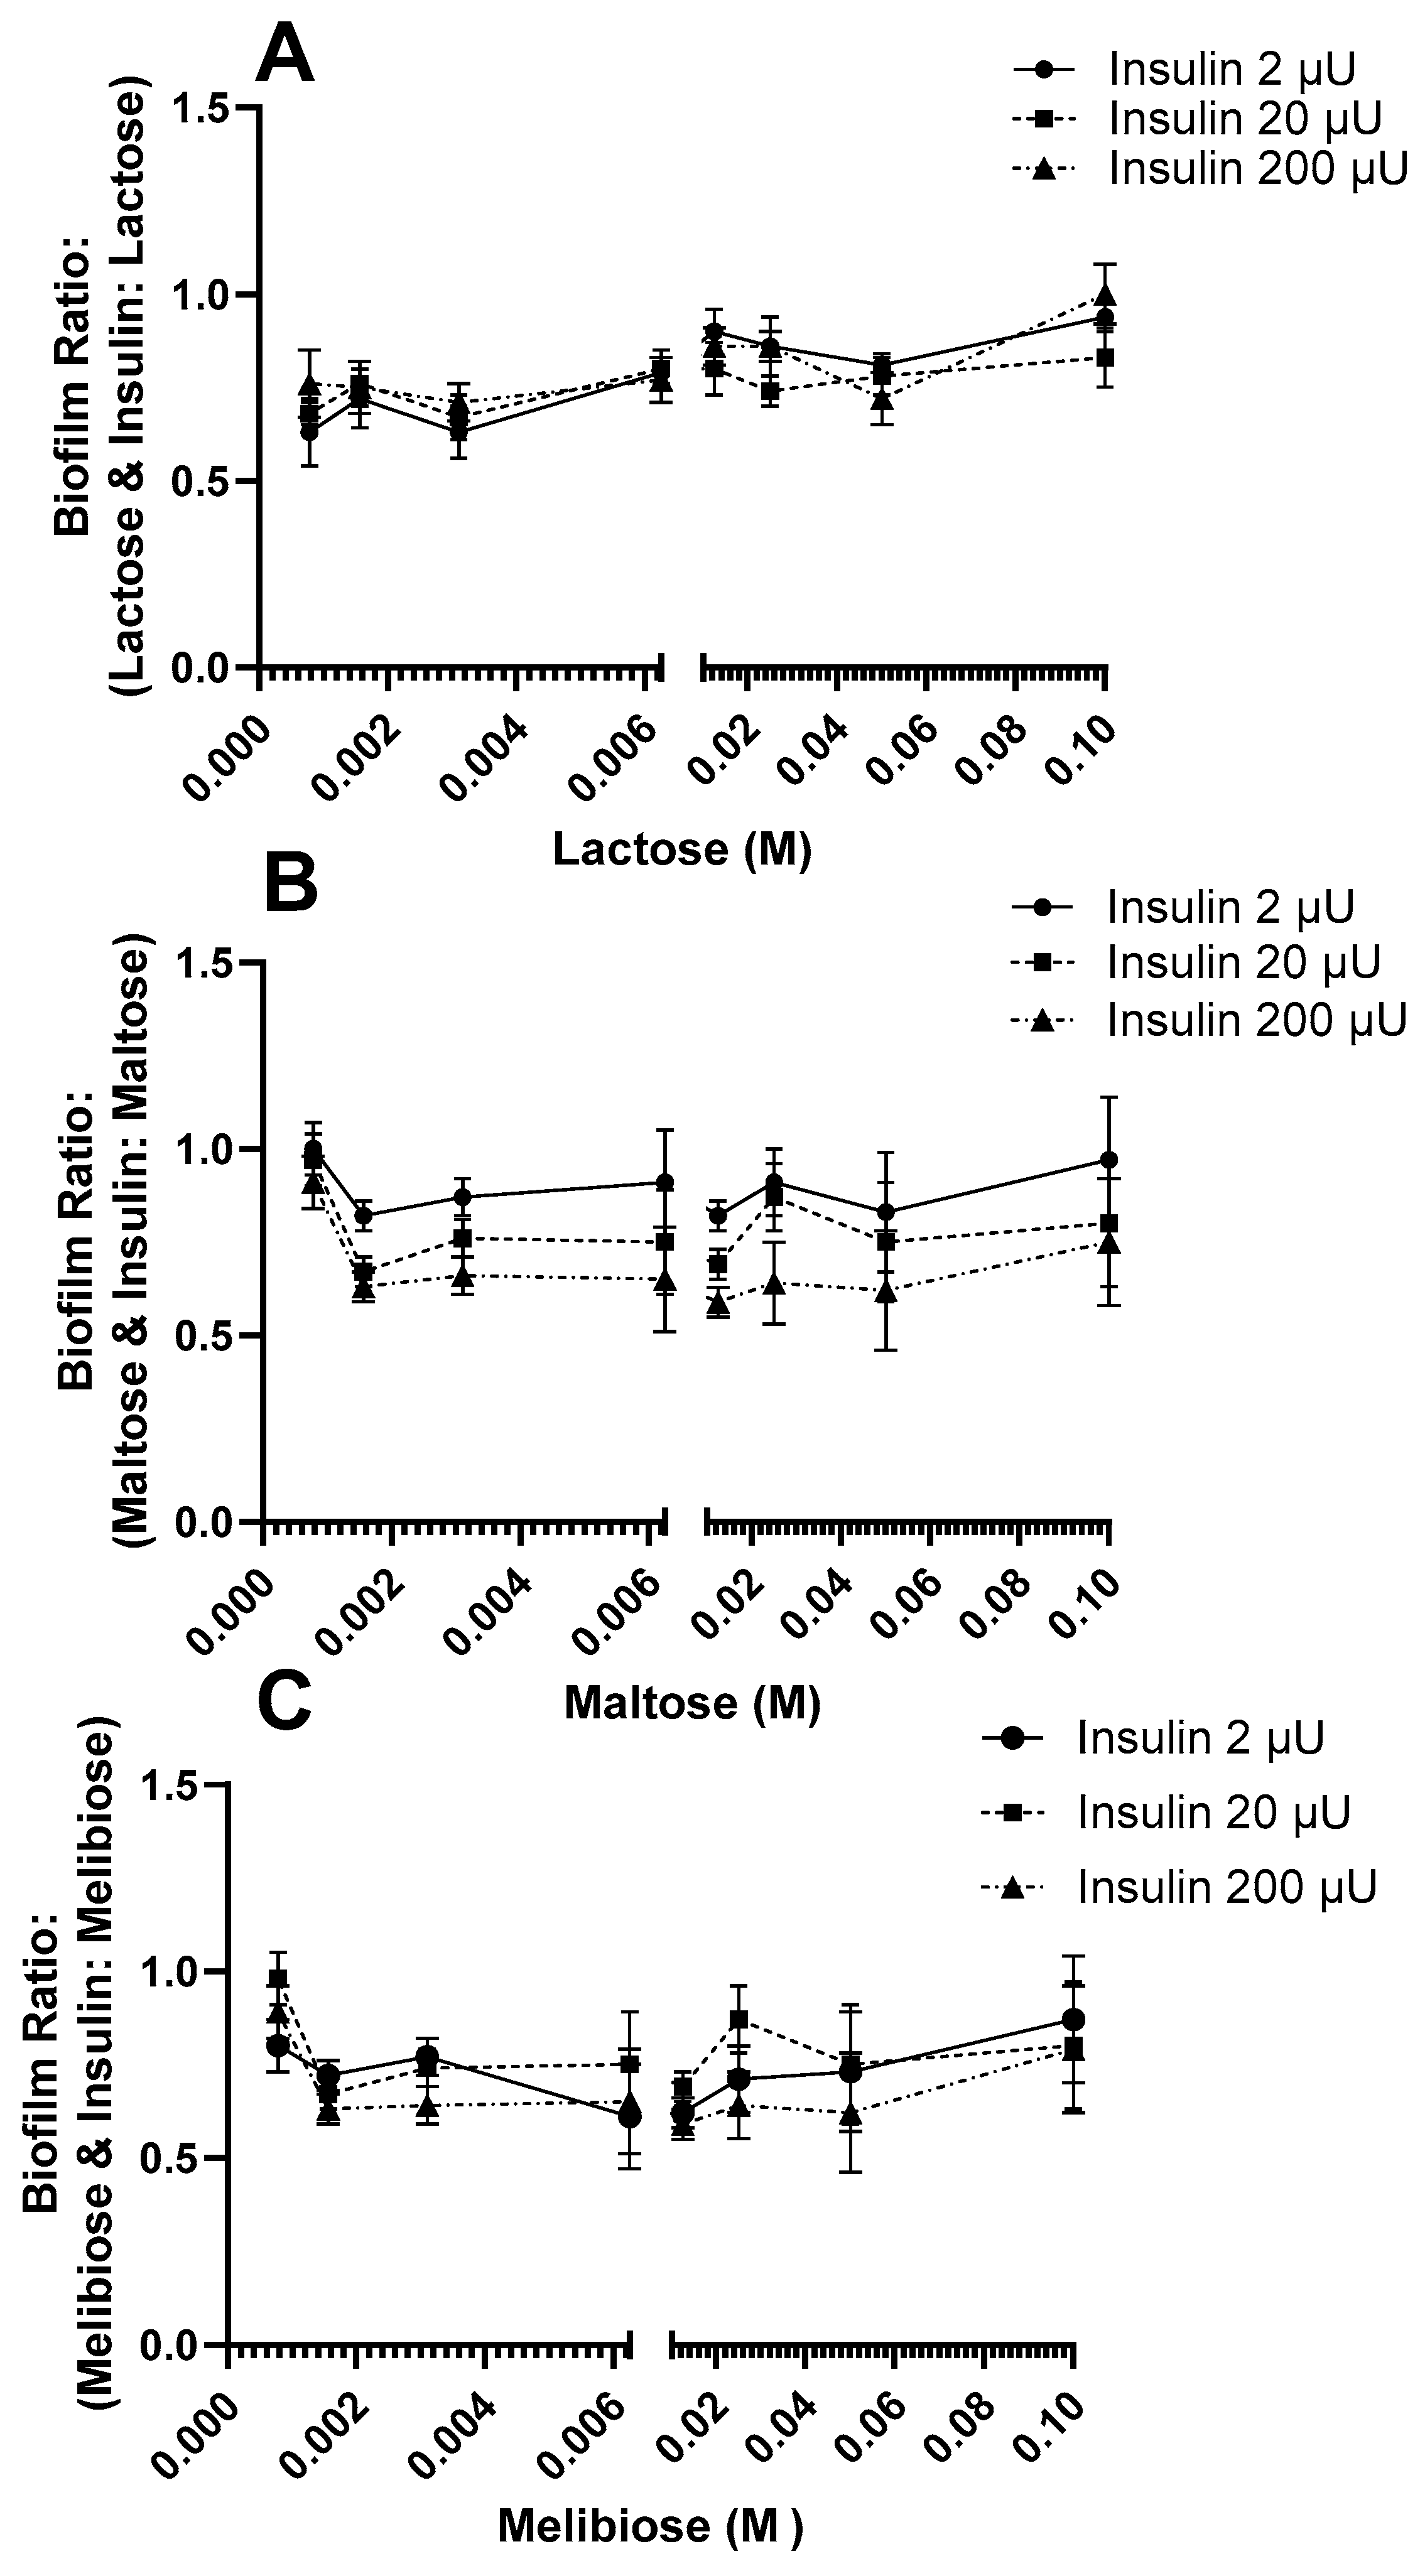
3.1.4. Effects of Insulin with Disaccharides on Log and Stat E. coli Binding

As with the other sugars, with the exception of sorbose, exposure to disaccharides resulted in the stat growth phase cells adhering to latex to a higher level than that measured for the log growth phase cells (Figure 4A,B). Of the disaccharides tested, maltose (log and stat growth phase cells) affected the adherence to latex squares to the greatest extent compared with all other sugars tested. The pattern of the maltose-insulin effect on attachment appeared to be in a sugar concentration dependent manner, with 10−1 M the most potent, with a maximal adherence of 35.6 ± 3.4 CFU/latex square for the log growth phase cells and a maximal adherence of 101.0 ± 10.4 CFU/latex square for the stat growth phase cells. Insulin had no significant effect on the binding of log cells in response to either lactose or melibiose, except for the presence of 200 µU/mL of insulin, which resulted in an increase in binding compared with the sugar alone control to 19 ± 2.6 or 24 ± 1.6 CFU/latex square for lactose (10−3 and 10−5 M, respectively) and 5.9 ± 1.6 and 5.2 ± 0.8 CFU/latex square for the melibiose concentrations (10−2 and 10−3 M, respectively).

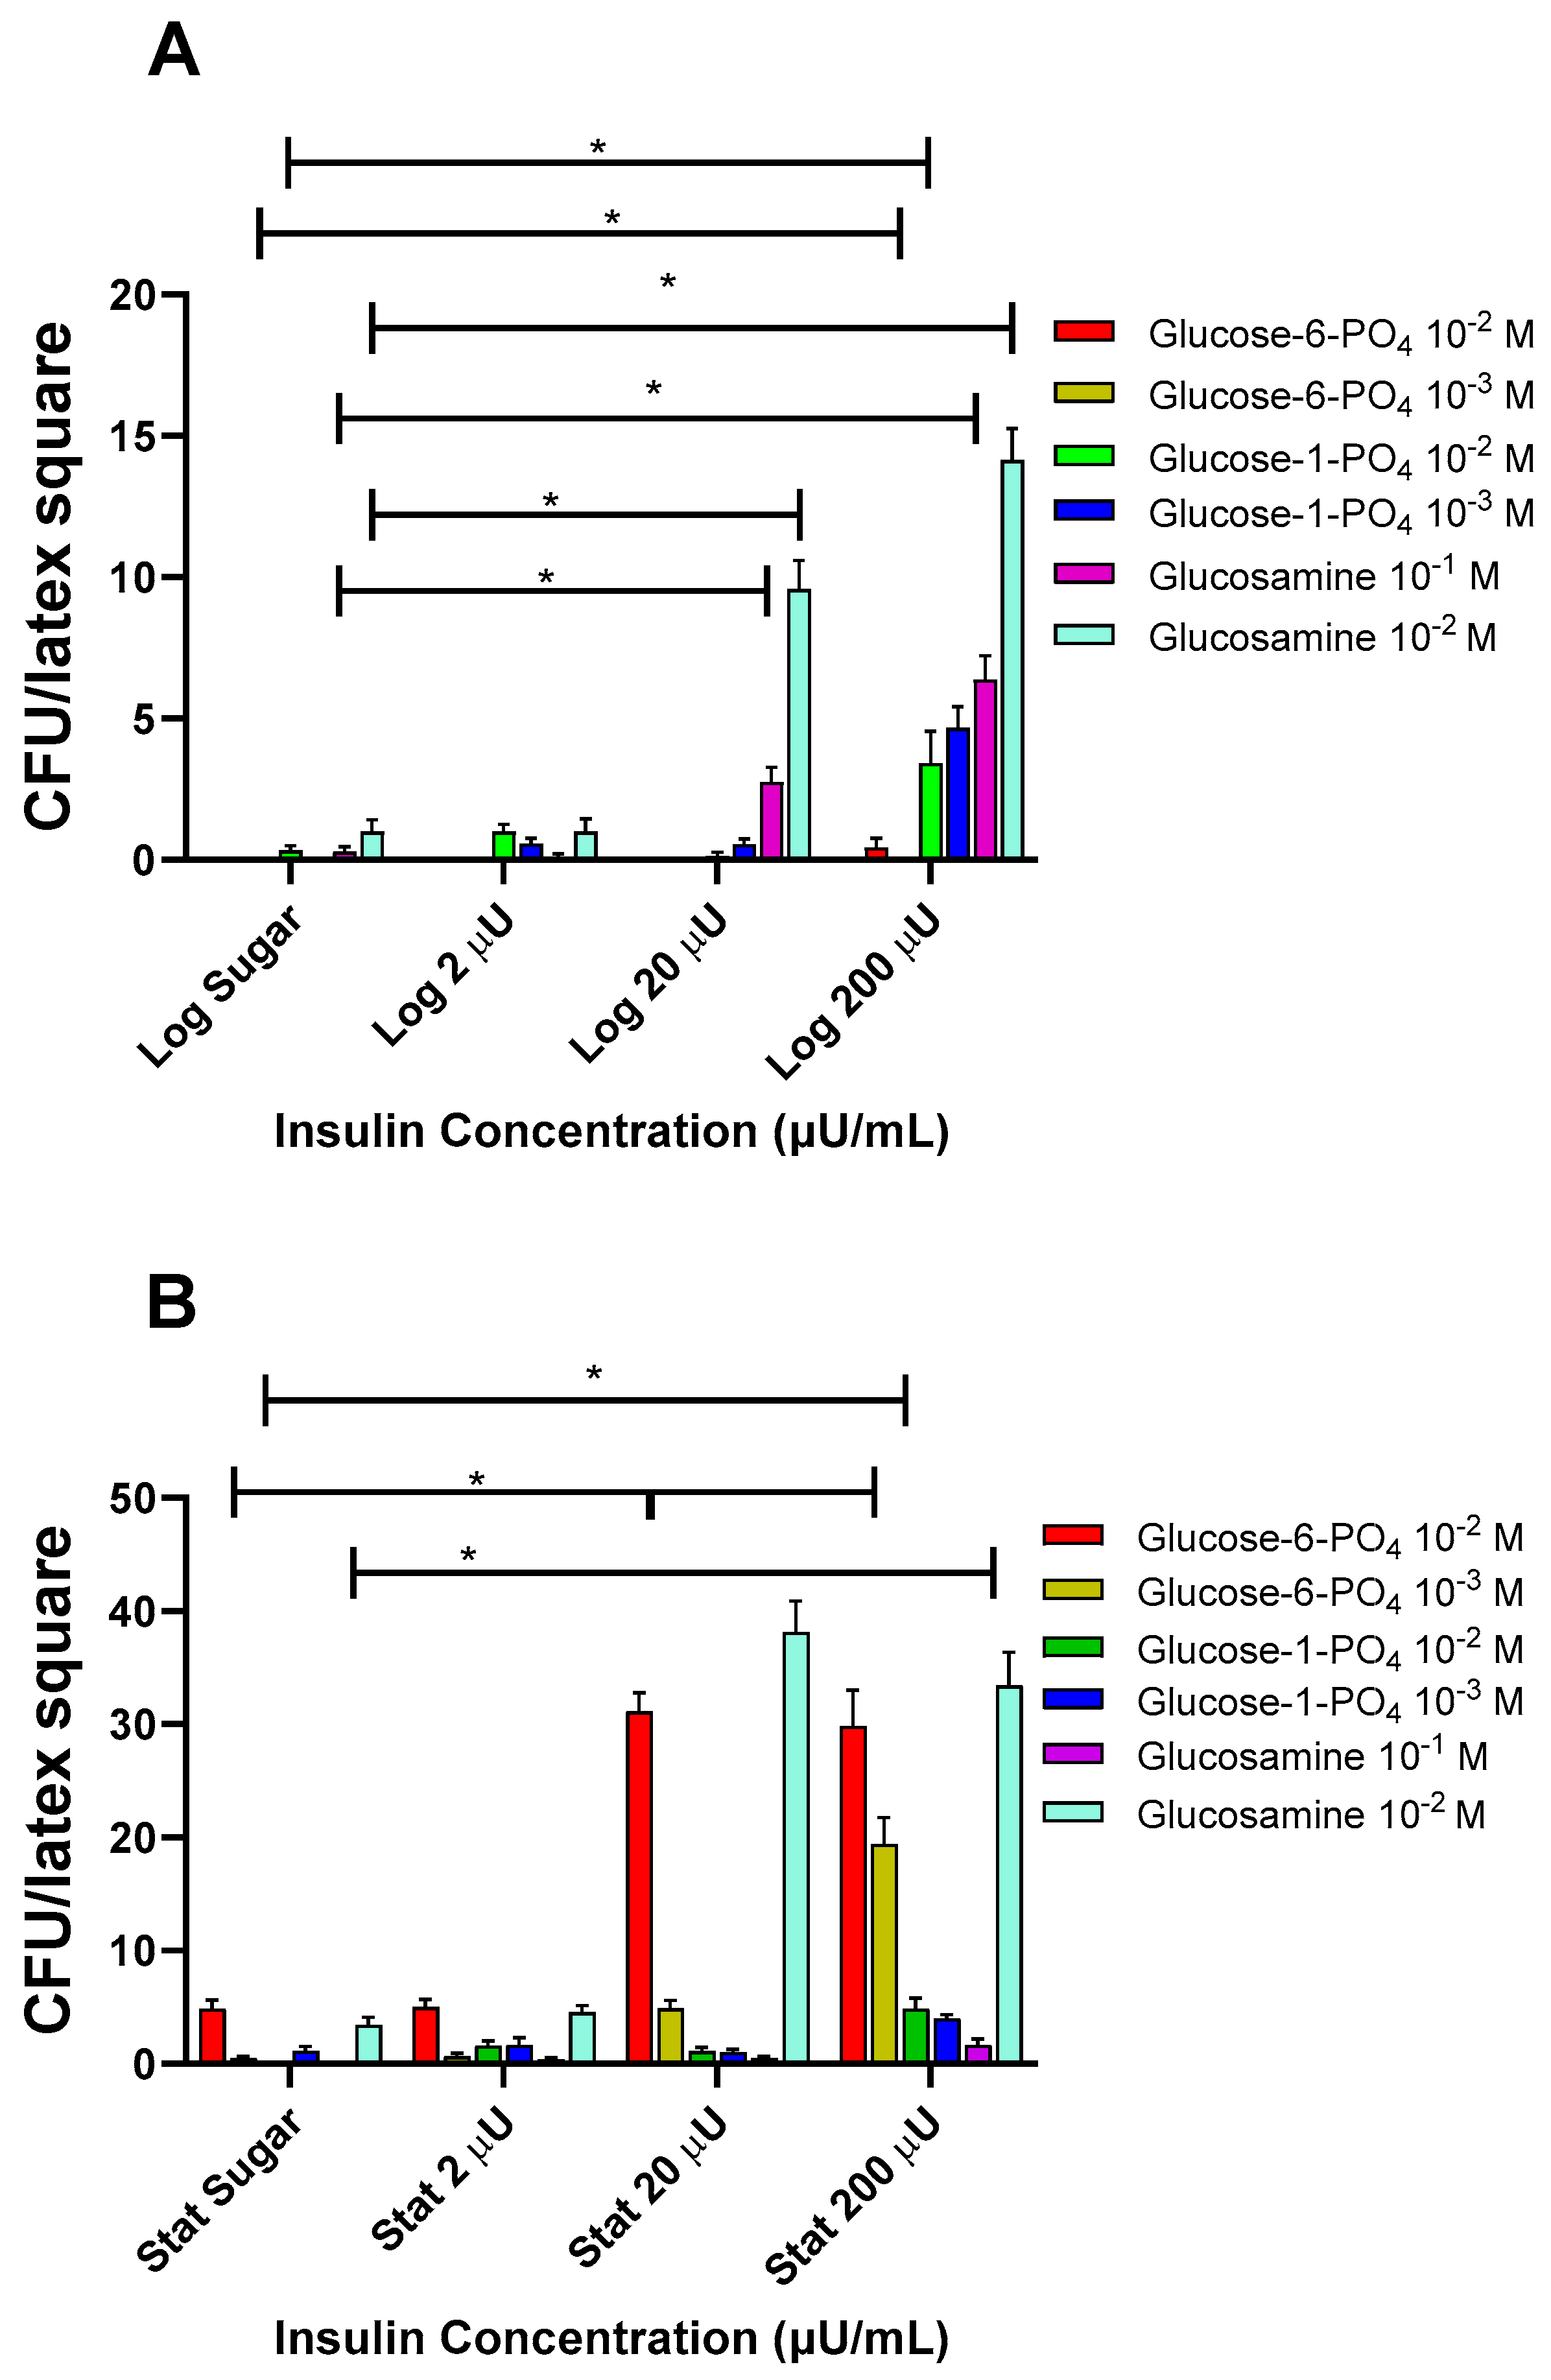
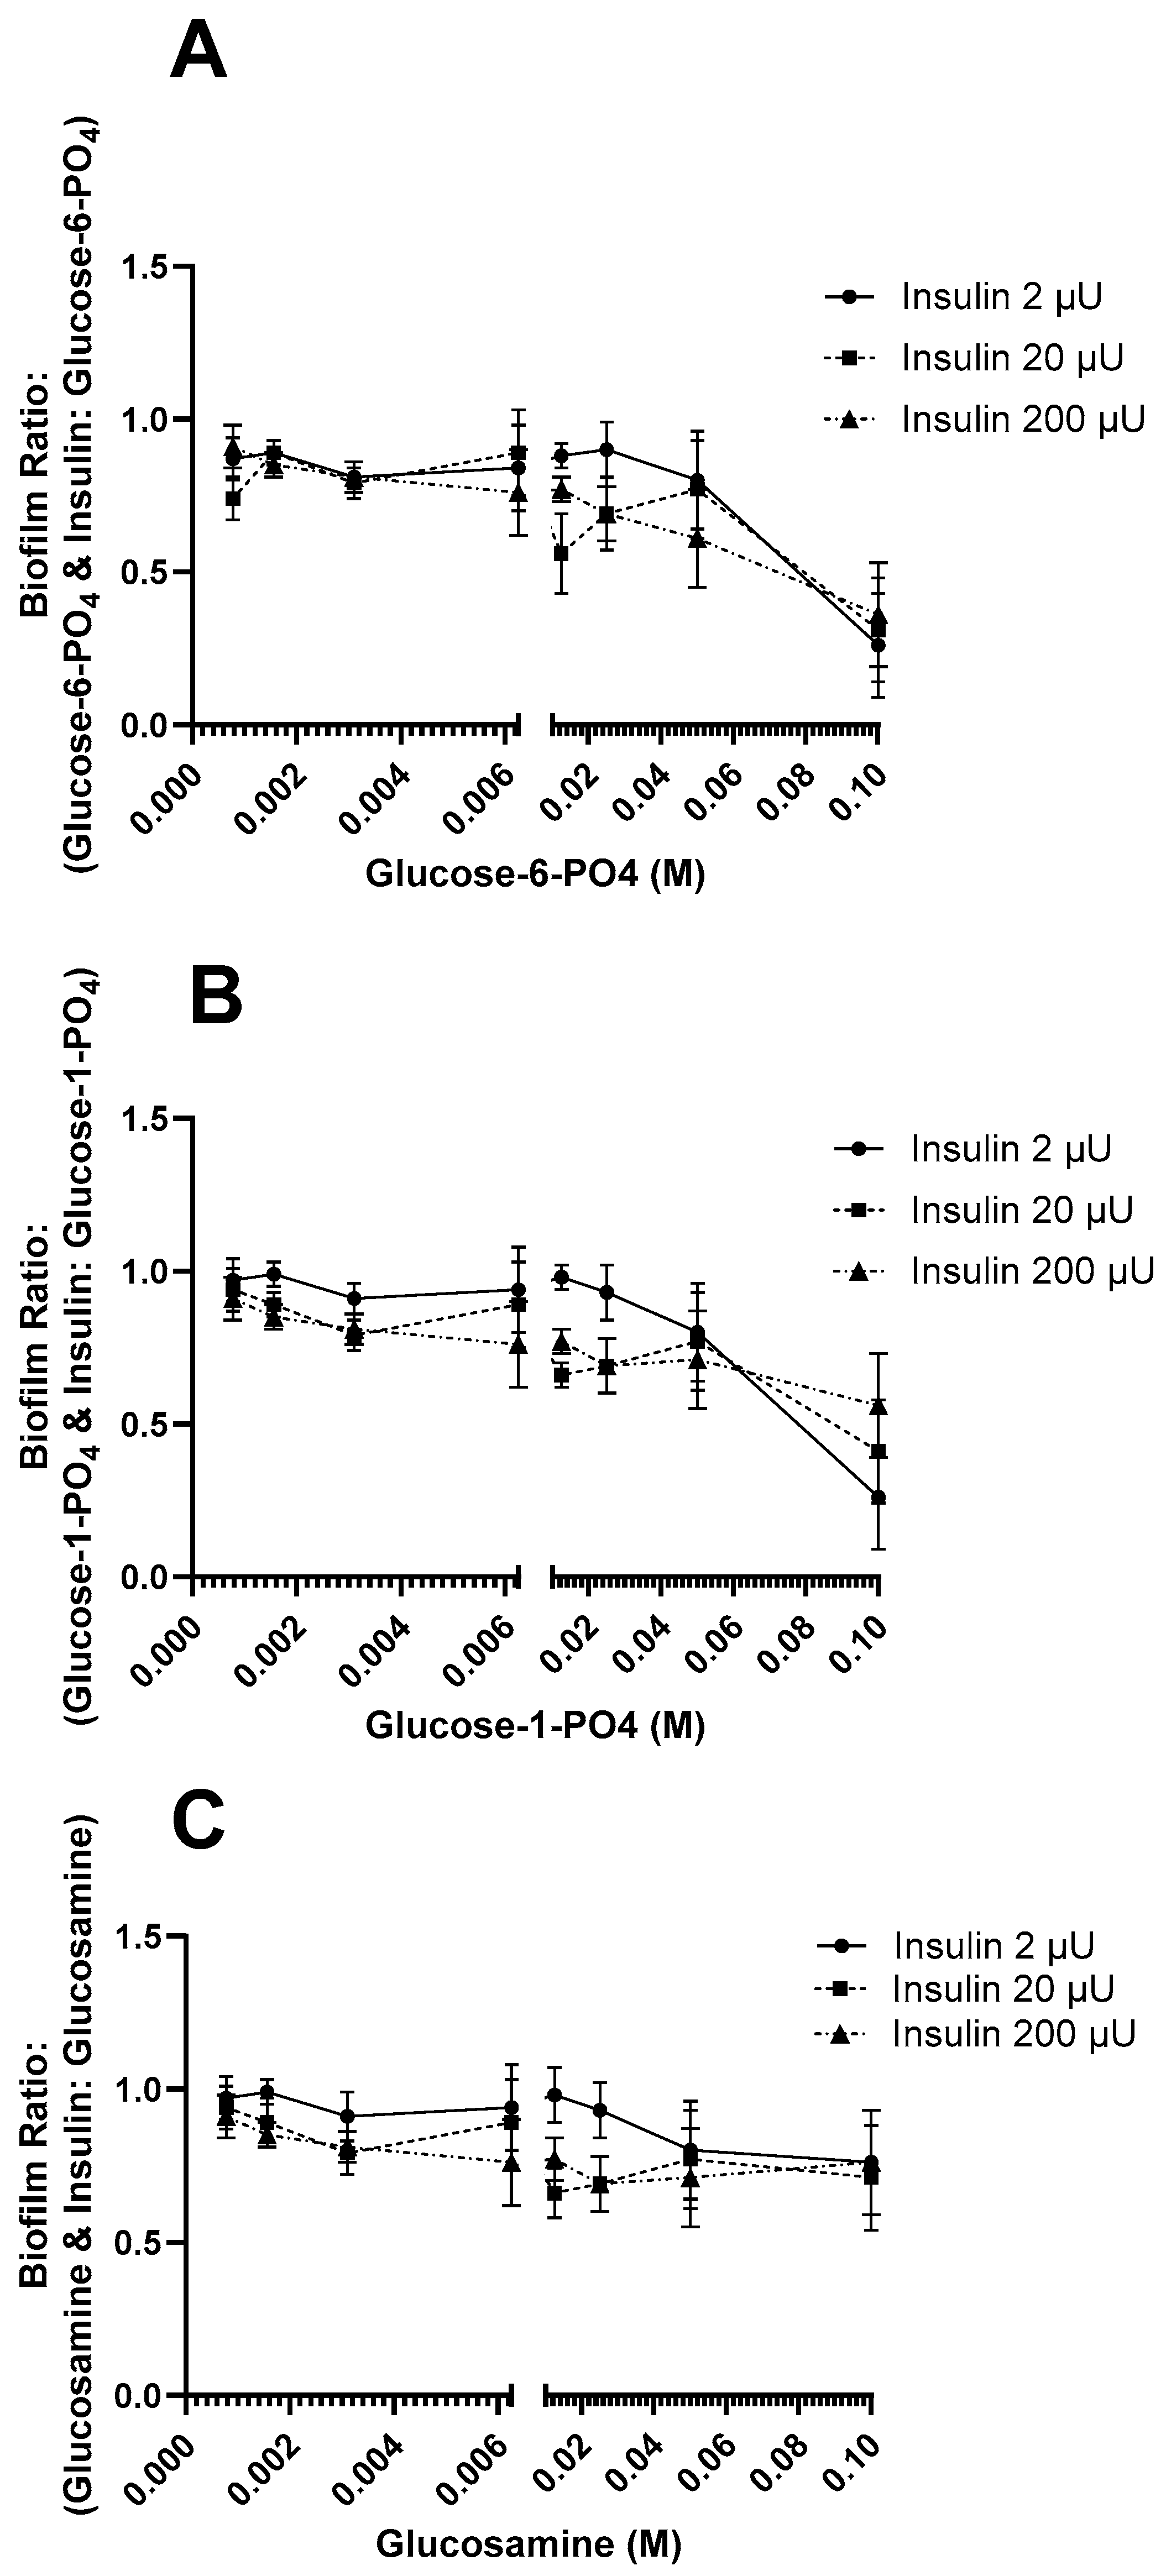
3.1.5. Effects of Insulin with Altered Glucose Compounds on Log and Stat E. coli Binding

The effect of insulin with altered glucose compounds comprised of glucose with phosphate, or an amine group, was determined (Figure 5A,B). The presence of 200 µU/mL of insulin had the maximal effect on log cells for glucose-1-PO4 and glucosamine, significantly (p < 0.05) enhancing the level of adherence to latex compared with the compound alone control. However, log cells with glucose-6-PO4 were unaffected by either sugar and/or insulin, regardless of concentration. In contrast, the stat growth phase cells in glucose-1-PO4 were similar to the control, while glucose-6-PO4 and insulin significantly (p < 0.05) increased attachment compared with the sugar control. This indicates that response to the location of the phosphate group on glucose (i.e., 1-carbon vs. 6-carbon position) affected the response of E. coli in the presence of sugar-insulin in a growth phase dependent manner. For glucosamine, both the log and stat growth phase cells in 10−2 M were the most responsive to insulin (20 and 200 µU/mL).

3.2. Effect of Insulin and Sugars on E. coli Biofilm Formation

Biofilm formation, a multi-stage process, starts with bacterial adherence to a surface, followed by microcolony formation, biofilm maturation, and finally, the dispersal of cells. Thus, biofilm formation is a prolonged process in comparison to the initial attachment stage. Nutrients can impact biofilm formation [20,22]. The interaction of various sugars together with insulin on biofilm formation, as measured by cell association with polystyrene, is presented in Figure 6, Figure 7, Figure 8, Figure 9 and Figure 10. Of the aldo sugars, growth in the presence of galactose with insulin resulted in a decrease in biofilm levels, regardless of sugar concentration, with 20 µU/mL having a significant (p < 0.05) effect compared with the other insulin levels (2 and 200 µU/mL) (Figure 6C). In contrast, growth in glucose or mannose with insulin increased the biofilm levels, with mannose with 2 µU insulin/mL exhibiting the maximal biofilm formation of 2.2-fold above the sugar alone control (Figure 6A,B). This reflects a pattern similar to that measured for attachment to latex.
The effects of the keto sugars, fructose and sorbose, on biofilm formation were opposing in the presence of insulin (Figure 7A,B). The normal physiologic insulin concentration (2 µU/mL) maintains biofilm levels similar to that of fructose alone for all sugar concentrations, with the exception of the highest fructose level tested (0.1 M), where there was a precipitous decline in adherence to 0.4 that of fructose alone. This finding supports that of Lee et al. [23], who reported that fructose could both promote and inhibit biofilm formation in a sugar concentration sensitive manner, with high fructose concentrations inhibitory. In contrast, except at the lowest sorbose levels, wherein adherence was similar to that of sorbose alone, that of insulin-sorbose increased the attachment to polystyrene to 1.4-fold above sorbose alone for 0.0125 and 0.025 M when combined with insulin (2 and 20 µU/mL).
For the 5-carbon sugars tested, both arabinose and xylose with insulin showed enhanced biofilm formation compared with sugar only (Figure 8A,B). The enhancement was arabinose concentration specific, with increased biofilm measured for arabinose-insulin at arabinose concentrations of 0.0125 to 0.1 M for 20 and 200 µU/mL of insulin. In contrast for xylose, insulin (200 µU/mL) enhanced the biofilm to more than twice that of just xylose for 0.05 and 0.1 M xylose (2.6-fold and 2.1-fold increase, respectively).
In the presence of the disaccharides’ lactose, maltose, or melibiose with insulin, regardless of concentration, the degree of biofilm formation was less than that for sugar alone for all insulin concentrations apart from the normal physiologic level of 2 µU/mL (Figure 9A–C). In addition, as the disaccharide concentrations increased, regardless of insulin concentration, the biofilm levels increased to the maximum level, similar to that of sugar alone. This pattern was divergent from adherence to latex measured for these disaccharides, particularly maltose.
A similar pattern was observed for insulin and altered glucose compounds (Figure 10A–C). The biofilm formation levels decreased with an increasing sugar phosphate level in the presence of insulin compared with the altered glucose compound alone. Although the insulin concentrations tested had no concentration-specific effect, the combination of both glucose-6-PO4 or glucose-1-PO4 with insulin resulted in a reduction in biofilm formation to a low of 0.3 biofilm ratio (sugar-insulin:sugar) for both sugars. Interestingly, the altered glucose compounds, except for glucosamine, were minimally affected by the presence of insulin with regard to their attachment to latex; however, the reverse pattern was observed for polystyrene adherence.

4. Discussion

The nutritional environment directly influences the bacterial cell surface structure, and thus the cellular interaction with either inert or biological surfaces [23]. Substrate composition with respect to physico-chemical composition affects the bacterial–substrate interaction. Both natural rubber latex and polystyrene are moderately hydrophobic with similar logP values; in addition, latex is nonpolar [17,18]. This shared characteristic provides the basis for measuring nutritional effects on both short- and long-term microbial surface interactions (attachment and biofilm formation, respectively).
As indicated herein, E. coli interaction with different substrates is sugar and insulin dependent. Previous studies have shown that fructose, lactose, melibiose, and maltose support biofilm formation on electronegative surfaces (glass) [24]. However, even electronegative-dependent (glass) adherence is modulated by insulin [5]. Previous studies have demonstrated that insulin modulates adherence to glass by inhibiting biofilm formation; however, insulin-glucose enhances biofilm formation. This study showed that the role of insulin in microbial attachment and biofilm formation extends beyond glucose.
Insulin modulated both attachment and biofilm formation in response to all saccharides tested. While glucose is arguably an important carbon and energy source, with respect to biofilm formation, mannose and maltose (a di-glucose saccharide) with insulin were the most effective in enhancing both nonpolar (latex) and hydrophobic surface attachment characteristics, as exemplified by the maximal attachment to latex and polystyrene. However, the insulin-glucose effects on attachment tended toward being more insulin concentration specific in their effects, especially for stat growth phase cells, with log growth phase cells being less responsive. These results are similar to those previously reported with regard to the importance of insulin concentrations [13]. These findings demonstrated that the insulin to glucose ratio plays a significant role in E. coli adherence as well as that of other Gram-negative bacteria.
The mechanism responsible for the insulin quorum effect on behavior is not well-elucidated. Previous studies have indicated that insulin acts in a rheostat-like function with respect to chemotaxis (i.e., alone it repels E. coli, however, with glucose, it enhances the chemoattraction to glucose) [7]. Whether a similar effect is observed for other saccharides is a topic for future testing.
Similar to the findings for glucose, the impact of the other sugars, regardless of stereochemical structure, with insulin was pleomorphic, with no discernible global patterns of behavior deducible based on r-insulin concentration or sugar, with the exception of adherence to latex relative to the E. coli growth phase [5,6,7]. The acquisition of structurally different sugars is affected by quorum signaling [25]. Different uptake mechanisms and the broad range of overlapping substrate specificities allow bacteria to quickly adapt to and colonize changing environments. For latex adherence, the stat growth phase E. coli adhered to higher levels than that measured for the log growth phase cells. This coincides with the expression of stress genes, which is greatest in log phase cells [26,27,28]. Interestingly, in contrast to the glucose:insulin effects on biofilm formation, which tended to be concentration specific, with the most maximum effects measured at 200 µU/mL (hyperinsulinemic level), other sugars (mannose, maltose, glucosamine) with r-insulin in combination often exhibited a dose–response kinetic curve with the maximum effect at normal-to-hyperinsulinemic levels (2–200 µU/mL) depending on the sugar tested. While sugars are grouped according to their structural properties, E. coli does not respond to them in a uniform manner according to that grouping. In addition, many of these share common transport and catabolic pathways [29,30,31]. If r-insulin as a quorum-signal compound was to affect the regulation of one of these pathways or transport systems, then it is possible that a pattern of r-insulin-mediated effect would become discernible. However, this analysis is problematic because most sugars are controlled by multiple pathways (transport, catabolism, and anabolism) with varying degrees of affinity [29,30,31]. For example, glucose-6-phosphate has been shown to enhance the attachment of Pseudomonas aeruginosa in a manner dependent on the orphan sensor SagS. Whether an analogous pathway to SagS functions in E. coli in an insulin-sensitive manner remains to be determined [32,33]. The mechanism through which insulin functions in bacteria has not been elucidated yet. It is possible that, in addition to modulating changes in the surface characteristics [5] and nutrients [7], insulin can either alone or in combination with a sugar initiate phenotypic biofilm formation changes, including the regulation of second messengers (e.g., cyclic di-guanosine monophosphate (c-di-GMP)), as has been demonstrated in a wound model with Pseudomonas aeruginosa [34,35,36]. As this study has shown, interactions between r-insulin and E. coli are complex and likely under the regulation of a multitude of factors. Interactions between sugars could also affect insulin’s regulatory patterns. Further studies examining the specific combinations of insulin with sugars, likely found in human disease states, would help expand our understanding of the r-insulin effects on E. coli pathogenesis.

5. Conclusions

This study is the first to focus on determining whether the previously reported effect of physiologically relevant levels of r-insulin on E. coli attachment and overall biofilm formation is specific to glucose. Insulin, together with a variety of sugars previously reported to function as chemoattractant agents, affects E. coli’s ability to interact with materials that resemble biological surfaces, or are in common usage in biomedical practice. All of the saccharides tested elicited an insulin-sensitive response that was variable, depending on the growth phase of E. coli, the substrate tested, and insulin–sugar concentration.

Author Contributions

Conceptualization, B.J.P.; Methodology, B.J.P.; Validation, B.J.P. and I.S.; Formal analysis, M.K.; Investigation, I.S.; Resources, B.J.P.; Data curation, B.J.P.; Writing—original draft preparation, B.J.P.; Writing—review and editing, I.S. and M.K.; Visualization, B.J.P.; Supervision, B.J.P.; Project administration, B.J.P.; Funding acquisition, B.J.P. All authors have read and agreed to the published version of the manuscript.

Funding

This research received no external funding. We acknowledge the intramural funding support of Midwestern University Office of Research and Sponsored Programs.

Data Availability Statement

Data available upon request to interested researchers.

Acknowledgments

We thank S. Surapenia for their assistance.

Conflicts of Interest

The authors declare no conflicts of interest.

References

  1. Waters, C.M.; Bassler, B.L. Quorum sensing: Cell-to-cell communication in bacteria. Annu. Rev. Cell Dev. Biol. 2005, 21, 319–346. [Google Scholar] [CrossRef] [PubMed]
  2. Gonzalez Barrios, A.; Zuo, R.; Hashimoto, Y.; Yang, L.; Bentley, W.; Wood, T. Autoinducer 2 controls biofilm formation in Escherichia coli through a novel motility quorum-sensing regulator (MqsR, B3022). J. Bacteriol. 2006, 188, 305–316. [Google Scholar] [CrossRef] [PubMed]
  3. Konaklieva, M.; Plotkin, B. Chemical communication—Do we have a quorum? Mini-Rev. Med. Chem. 2006, 6, 817–825. [Google Scholar] [CrossRef]
  4. Reading, N.; Sperandio, V. Quorum sensing: The many languages of bacteria. FEMS Microbiol. Lett. 2006, 254, 1–11. [Google Scholar] [CrossRef]
  5. Klosowska, K.; Plotkin, B. Human insulin modulation of Escherichia coli adherence and chemotaxis. Am. J. Infect. Dis. 2006, 2, 197–200. [Google Scholar] [CrossRef]
  6. Plotkin, B.; Wu, Z.; Ward, K.; Nadella, S.; Green, J.; Rummani, B. Effect of human insulin on the formation of catheter-associated E. coli biofilms. Open J. Urol. 2014, 4, 49–56. [Google Scholar] [CrossRef]
  7. Patel, N.; Curtis, J.C.; Plotkin, B.J. Insulin Regulation of Escherichia coli Abiotic Biofilm Formation: Effect of Nutrients and Growth Conditions. Antibiotics 2021, 10, 1349. [Google Scholar] [CrossRef]
  8. LeRoith, D.; Shiloach, J.; Roth, J.; Lesniak, M. Evolutionary origins of vertebrate hormones: Substances similar to mammalian insulins are native to unicellular eukaryotes. Proc. Natl. Acad. Sci. USA 1980, 77, 6184–6188. [Google Scholar] [CrossRef]
  9. LeRoith, D.; Shiloach, J.; Roth, J.; Lesniak, M.A. Insulin or a closely related molecule is native to Escherichia coli. J. Biol. Chem. 1981, 256, 6533–6536. [Google Scholar] [CrossRef]
  10. LeRoith, D.; Shiloach, J.; Heffron, R.; Rubinovitz, C.; Tanenbaum, R.; Roth, J. Insulin-related material in microbes: Similarities and differences from mammalian insulins. Can. J. Biochem. Cell Biol. 1985, 63, 839–849. [Google Scholar] [CrossRef]
  11. Christensen, S. Insulin rescues the unicellular eucaryote Tetrahymena from dying in a complete, synthetic nutrient medium. Cell Biol. Intern. 1993, 17, 833–837. [Google Scholar] [CrossRef] [PubMed]
  12. Plotkin, B.J.; Viselli, S.M. Effect of insulin on microbial growth. Curr. Microbiol. 2000, 41, 60–64. [Google Scholar] [CrossRef]
  13. Plotkin, B.J.; Halkyard, S.; Spoolstra, E.; Micklo, A.; Kaminski, A.; Sigar, I.M.; Konaklieva, M.I. The Role of the Insulin/Glucose Ratio in the Regulation of Pathogen Biofilm Formation. Biology 2023, 12, 1432. [Google Scholar] [CrossRef] [PubMed]
  14. Adler, J.; Hazelbauer, G.L.; Dahl, M.M. Chemotaxis toward sugars in Escherichia coli. J. Bacteriol. 1973, 115, 824–847. [Google Scholar] [CrossRef] [PubMed]
  15. Niswender, K.D. Basal insulin: Physiology, pharmacology, and clinical implications. Postgrad. Med. 2011, 123, 17–26. [Google Scholar] [CrossRef]
  16. Rasmussen, H.; Zawalich, K.C.; Ganesan, S.; Calle, R.; Zawalich, W.S. Physiology and pathophysiology of insulin secretion. Diabetes Care 1990, 13, 655–666. [Google Scholar] [CrossRef]
  17. Di Santo Meztler, P.; Fait, M.E.; Foresti, M.L.; Morcelle, S.R. Biocatalytic characterization of a naturally immobilized lipase found in Araujia sericifera Brot. (Apocynaceae) latex. Catal. Sci. Technol. 2014, 4, 1386–1394. [Google Scholar] [CrossRef]
  18. Faghihnejad, A.; Zeng, H. Hydrophobic interactions between polymer surfaces: Using polystyrene as a model system. Soft Matter. 2012, 8, 2746–2759. [Google Scholar] [CrossRef]
  19. Christensen, G.; Simpson, W.; Younger, J.; Baddour, L.; Barrett, F.; Melton, D.; Beachy, E. Adherence of coagulase-negative staphylococci to plastic tissue culture plates: A quantitative model for the adherence of staphylococci to medical devices. J. Clin. Microbiol. 1985, 22, 966–1006. [Google Scholar] [CrossRef]
  20. Hu, J.; Lv, X.; Niu, X.; Yu, F.; Zuo, J.; Bao, Y.; Yin, H.; Huang, C.; Nawaz, S.; Zhou, W. Effect of nutritional and environmental conditions on biofilm formation of avian pathogenic Escherichia coli. J. Appl. Microbiol. 2022, 132, 4236–4251. [Google Scholar] [CrossRef]
  21. Song, S.; Wood, T.K. The Primary Physiological Roles of Autoinducer 2 in Escherichia coli Are Chemotaxis and Biofilm Formation. Microorganisms 2021, 9, 386. [Google Scholar] [CrossRef] [PubMed]
  22. Soares, A.; Gomes, L.C.; Monteiro, G.A.; Mergulhão, F.J. The influence of nutrient medium composition on Escherichia coli biofilm development and heterologous protein expression. Appl. Sci. 2021, 11, 8667. [Google Scholar] [CrossRef]
  23. Lee, J.H.; Park, J.H.; Kim, J.A.; Neupane, G.P.; Cho, M.H.; Lee, C.S.; Lee, J. Low concentrations of honey reduce biofilm formation, quorum sensing, and virulence in Escherichia coli O157:H7. Biofouling 2011, 27, 1095–1104. [Google Scholar] [CrossRef]
  24. Sutrina, S.L.; Callender, S.; Grazette, T.; Scantlebury, P.; O’Neal, S.; Neal, S.; Thomas, K.; Harris, D.C.; Mota-Meira, M. The quantity and distribution of biofilm growth of Escherichia coli strain ATCC 9723 depends on the carbon/energy source. Microbiology 2019, 165, 47–64. [Google Scholar] [CrossRef]
  25. Ha, J.-H.; Hauk, P.; Cho, K.; Eo, Y.; Ma, X.; Stephens, K.; Cha, S.; Jeong, M.; Suh, J.-Y.; Sintim, H.O.; et al. Evidence of link between quorum sensing and sugar metabolism in Escherichia coli revealed via cocrystal structures of LsrK and HPr. Sci. Adv. 2018, 4, eaar7063. [Google Scholar] [CrossRef]
  26. Domka, J.; Lee, J.; Bansal, T.; Wood, T.K. Temporal gene-expression in Escherichia coli K-12 biofilms. Environ. Microbiol. 2007, 9, 332–346. [Google Scholar] [CrossRef]
  27. Schembri, M.A.; Kjærgaard, K.; Klemm, P. Global gene expression in Escherichia coli biofilms. Mol. Microbiol. 2003, 48, 253–267. [Google Scholar] [CrossRef]
  28. Tao, H.; Bausch, C.; Richmond, C.; Blattner, F.R.; Conway, T. Functional genomics: Expression analysis of Escherichia coli growing on minimal and rich media. J. Bacteriol. 1999, 181, 6425–6440. [Google Scholar] [CrossRef]
  29. Miyakoshi, M. Multilayered regulation of amino acid metabolism in Escherichia coli. Curr. Opin. Microbiol. 2024, 77, 102406. [Google Scholar] [CrossRef]
  30. Huang, J.-F.; Shen, Z.-Y.; Mao, Q.-L.; Zhang, X.-M.; Zhang, B.; Wu, J.-S.; Liu, Z.-Q.; Zheng, Y.-G. Systematic Analysis of Bottlenecks in a Multibranched and Multilevel Regulated Pathway: The Molecular Fundamentals of l-Methionine Biosynthesis in Escherichia coli. ACS Synth. Biol. 2018, 7, 2577–2589. [Google Scholar] [CrossRef]
  31. Charlier, D.; Bervoets, I. Regulation of arginine biosynthesis, catabolism and transport in Escherichia coli. Amino Acids 2019, 51, 1103–1127. [Google Scholar] [CrossRef] [PubMed]
  32. Park, S.; Dingemans, J.; Gowett, M.; Sauer, K. Glucose-6-Phosphate acts as an extracellular signal of SagS to modulate Pseudomonas aeruginosa c-di-GMP levels, attachment, and biofilm formation. mSphere 2021, 6, e01231-1220. [Google Scholar] [CrossRef]
  33. Jeckelmann, J.-M.; Erni, B. Transporters of glucose and other carbohydrates in bacteria. Pflügers Arch.-Eur. J. Physiol. 2020, 472, 1129–1153. [Google Scholar] [CrossRef]
  34. Romling, U.; Gomelsky, M.; Galperin, M. C-di-GMP: The dawning of a novel bacterial signalling system. Mol. Microbiol. 2005, 53, 629–639. [Google Scholar] [CrossRef]
  35. Wei, Q.; Zhang, Z.; Luo, J.; Kong, J.; Ding, Y.; Chen, Y.; Wang, K. Insulin treatment enhances Pseudomonas aeruginosa biofilm formation by increasing intracellular cyclic di-GMP levels, leading to chronic wound infection and delayed wound healing. Am. J. Transl. Res. 2019, 11, 3261–3279. [Google Scholar]
  36. Park, S.; Sauer, K. Controlling biofilm development through cyclic di-GMP signaling. Adv. Exp. Med. Biol. 2022, 1386, 69–94. [Google Scholar] [CrossRef]
Figure 1. Effect of 6-carbon aldo sugars and insulin on the E. coli logarithmic (log) and stationary (stat) growth phase cells’ adherence to latex. (A) Log growth phase cells’ adherence to latex; (B) stat growth phase cells’ adherence to latex. * Significantly different (p < 0.05) from sugar alone.
Applmicrobiol 05 00058 g001
Figure 2. Effect of 6-carbon keto sugars and insulin on E. coli logarithmic (log) and stationary (stat) growth phase cells adherence to latex. (A) Log growth phase cells’ adherence to latex; (B) stat growth phase cells’ adherence to latex. * Significantly different (p < 0.05) from sugar alone.
Applmicrobiol 05 00058 g002
Figure 3. Effect of 5-carbon sugars and insulin on the E. coli logarithmic (log) and stationary (stat) growth phase cells’ adherence to latex. (A) Log growth phase cells’ adherence to latex; (B) stat growth phase cells’ adherence to latex. * Significantly different (p < 0.05) from sugar alone.
Applmicrobiol 05 00058 g003
Figure 4. Effect of disaccharides and insulin on the E. coli logarithmic (log) and stationary (stat) growth phase cells’ adherence to latex. (A) Log growth phase cells’ adherence to latex; (B) stat growth phase cells’ adherence to latex. * Significantly different (p < 0.05) from sugar alone.
Applmicrobiol 05 00058 g004
Figure 5. Effect of altered glucose compounds and insulin on the E. coli logarithmic (log) and stationary (stat) growth phase cells’ adherence to latex. (A) Log growth phase cells’ adherence to latex; (B) stat growth phase cells’ adherence to latex. Glucose alone and insulin alone were similar to the PBS control. * Significantly different (p < 0.05) from sugar alone.
Applmicrobiol 05 00058 g005
Figure 6. Effect of growth in 6-carbon aldo sugars with physiological insulin concentrations on the E. coli biofilm formation. (A) Glucose; (B) mannose; (C) galactose. * Insulin effect significantly different from the homologous sugar level hydrophobicity with different insulin concentrations.
Applmicrobiol 05 00058 g006
Figure 7. Effect of growth in 6-carbon keto sugars with physiological insulin concentrations on the E. coli hydrophobicity. (A) Fructose; (B) sorbose. * Insulin effect significantly (p < 0.05) different from the homologous sugar level hydrophobicity with different insulin concentrations.
Applmicrobiol 05 00058 g007
Figure 8. Effect of growth in 5-carbon sugars with physiological insulin concentrations on the E. coli hydrophobicity. (A) Arabinose; (B) xylose. * Insulin effect significantly (p < 0.05) different from the homologous sugar level hydrophobicity with different insulin concentrations.
Applmicrobiol 05 00058 g008
Figure 9. Effect of growth in disaccharides with physiological insulin concentrations on the E. coli hydrophobicity. (A) Lactose; (B) maltose; (C) melibiose.
Applmicrobiol 05 00058 g009
Figure 10. Effect of growth in altered glucose compounds with physiological insulin concentrations on the E. coli hydrophobicity. (A) glucose-6-PO4; (B) glucose-1-PO4; (C) glucosamine.
Applmicrobiol 05 00058 g010
Table 1. Sugars and their concentrations used in this study.
6-Carbon Aldo Sugars6-Carbon Keto Sugars5-Carbon SugarsDisaccharidesAltered Glucose Compounds
Glucose
(5 × 10⁻⁵ M)
Fructose
(10−3, 10−4 M)
Arabinose
(10−1, 10−2 M)
Lactose
(10−3, 10−5 M)
Glucose-6-Phosphate
(10−2, 10−3 M)
Mannose
(10−1, 10−2 M)
Sorbose
(10−2, 10−3 M)
Xylose
(10−2, 10−3 M)
Maltose
(10−1, 10−2 M)
Glucosamine
(10−1, 10−2 M)
Galactose
(10−3, 10−4 M)
Melibiose
(10−2, 10−3 M)
Glucose-1-Phosphate
(10−2, 10−3 M)
Disclaimer/Publisher’s Note: The statements, opinions and data contained in all publications are solely those of the individual author(s) and contributor(s) and not of MDPI and/or the editor(s). MDPI and/or the editor(s) disclaim responsibility for any injury to people or property resulting from any ideas, methods, instructions or products referred to in the content.

