Article

Evaluating Seedling Vigor of Soybean Genotypes of Various Maturity Groups Following Short and Prolonged Seed Exposure to Abiotic Stress


AgroBioInstitute, Agricultural Academy, Blvd. Dragan Tsankov 8, 1164 Sofia, Bulgaria
*
Author to whom correspondence should be addressed.
Crops 2026, 6(3), 57; https://doi.org/10.3390/crops6030057
Submission received: 3 April 2026 / Revised: 10 June 2026 / Accepted: 15 June 2026 / Published: 17 June 2026

Abstract

This study investigated the vigor and molecular responses of soybean (Glycine max) seedlings belonging to cultivars from various maturity groups under simulated abiotic stress. Seeds and seedlings were subjected to varying concentrations of NaCl (150–300 mM) and PEG-6000 (20–30%), during long-term (12 days) and short-term (72 h) treatments, to evaluate the impact of salinity and drought on seedling viability and gene expression. Molecular analysis via qRT-PCR focused on the transcriptional profiles of the auxin transmembrane influx carrier LAX6, the vacuolar pyrophosphatase H+-PP-ase, and the stress protein kinase StrK2. The data indicated a dose-dependent correlation between stress intensity and developmental inhibition; increased concentrations of stress agents generally resulted in delayed germination and reduced survival rates. Certain soybean genotypes exhibited a robust transcriptional response, characterized by a several-fold increase in the expression of all studied genes following stress induction. These findings suggest that soybean abiotic stress responses may be influenced by a complex interaction between stress severity, exposure duration, genotype specificity and the maturity group.

1. Introduction

One of the most important agricultural crops is soybean (Glycine max (L.) Merr.). It is characterized by high-quality oil and protein content. Nowadays, soybean products are a crucial part of a healthy human diet and serve as the main protein component of animal feed [1]. This crop belongs to the Fabaceae family and is capable of entering into symbiotic nitrogen fixation with bacteria from the genus Bradyrhizobium, which improves soil fertility, and reduces the need for artificial fertilizers [2]. In the era of climate change and a constantly growing world population, modern agriculture needs new soybean varieties that are high-yielding and tolerant to unfavorable environmental conditions [3,4]. Drought and soil salinity are the primary abiotic factors that negatively affect the yields of this important legume crop [5]. In line with the overall European protein strategy, soybeans and other legume crops have started to play an important role in European agriculture. To increase soybean cropping across Europe, the key strategy for soybean breeding is to develop cultivars across different maturity groups (MG 000, 00 and 0-I), capable of adapting to diverse locations. Searching for improved tolerance to drought and high temperatures is a major strategy for preserving yield stability and the overall competitiveness of soybean in the conditions of global climate change, especially in Southeast and Central Europe. Soybean breeding across Europe is focused on the establishment of local cultivars suitable for the specific climatic conditions of each country [6,7,8]. As part of the Danube region, Bulgaria offers the necessary environmental conditions for intensive soybean production, where MG 0-I cultivars are traditionally cultivated. Severe summer drought is the main limiting factor for sustainable crop yield in Bulgaria and Southeast Europe [9]. To avoid extreme drought in July and August, planting earlier soybean cultivars of MG 00 and 000 allows the sensitive flowering and pod development stages (R1–R4) to pass earlier before the July drought. According to this, the efforts of our research team are related to testing soybean varieties from different MGs suitable for cultivation in Bulgaria. In addition, extreme salinity stress, which slows photosynthesis and induces oxidative stress, can cause plant death [10]. Drought and salinity stress can delay and decrease soybean seed germination and proper seedling development [11,12]. The number of healthy seedlings developed under conditions of drought and salinity could be reduced by more than 20%, especially when stress conditions occur at the germination stage, which could compromise the soybean yield [13,14,15]. Soybean plants rely on a complex network of genes to manage salinity and drought, primarily categorized into ion transporters, osmoprotectants, and transcription factors that coordinate the overall stress response [16]. In soybean, the GmLAX (Auxin Influx Carrier) gene family plays a vital role in adapting to salt and drought stress by regulating the internal distribution of the growth hormone auxin [17,18]. For many crops, H+-pyrophosphatases (H+-PP-ase) are critical proton pumps that play a pivotal role in maintaining cellular health under cold, salinity and drought stress by providing the energy required for ion sequestration and osmotic adjustment [19]. While vacuolar pumps provide the physical energy for stress tolerance in soybean, stress kinases provide the regulatory commands and detect environmental shifts to activate defense systems like proton pumps [20]. Also, stress kinases are known to play a leading role in early plant abiotic signaling and stress perception [21]. In soybean, GmSnRK2 was found to participate in the response to abscisic acid treatment, drought and cold stress [22,23]. The involvement of GmSTK12 in salt stress resistance has also been reported [24]. In the current study, these three genes were selected to represent three distinct key points of stress response in early seedling development, such as the transition from seed to seedlings. Analyzing the stress response of these specific target genes of interest represents a logical evolution of our team’s established research, which has focused on characterizing gene function in both model species and soybean crops [23,25,26,27].
The soybean cultivars evaluated here were selected to represent a diverse range of maturity groups prevalent in Europe to ensure the findings have regional agricultural relevance. Our research serves as a screening protocol to determine the stress responses of these varieties, as most European cultivars have not been pre-characterized as “tolerant” or “sensitive” to abiotic stress.
The aim of this study was to evaluate selected soybean cultivars from different maturity groups using a laboratory-controlled experimental approach. The line of the experiment followed a two-phase approach. Phase 1 was a seed and seedling vigor screen of eight European cultivars (Sahara, Shiva, Stumpa, Sibella, Stocata, Sinema, Danko 416 and Danko 417) across three MGs (000, 00, and 0-I), which have not been traditionally grown on the territory of Bulgaria, aiming to identify contrasting tolerance levels under prolonged stress. Long-term drought stress was induced by 20% and 30% PEG solutions. Salinity stress was caused by 150 mM and 300 mM NaCl solutions. The stressors were applied to the germinating seeds for a period of 12 days and compared with untreated control seeds. In Phase 2, we conducted short-term stress testing on two representative cultivars, Richy and Isidor, both MG 0-I varieties traditionally grown in Bulgaria, to identify contrasting levels of tolerance under short-term stress. Seeds and seedlings were subjected to salinity and drought stress for up to 72 h. Germination dynamics, germination percentage, survival rate and total germination index were determined. Additionally, the two-phase approach assessed seed vitality and seedling vigor, and provided gene expression analysis for three specific biomarkers—LAX6, H+-PP-ase and StrK2—related to abiotic drought and salinity stress during early seedling development.

2. Materials and Methods

2.1. Plant Material

The cultivars (cvs.) used in this research, detailed in Supplementary Table S1, were kindly provided by their respective manufacturers and breeders for the objectives of Work package 1 of the “Legume Generation” project. The private company “RAGT Seeds” (RAGT, France) operates large soybean breeding programs across all maturity groups from MG 000 to II for soybean production in all possible growing regions of Europe. In the current study, cultivars Sahara-000 (very early maturity group), Shiva-00, Stumpa-00, Sibella-00 (early) and Stocata-0-I and Sinema-0-I (middle-early) were selected. “Danko Hodowla Roslin” (DANKO, Poland DANKO) established a breeding program focusing on very early maturity (MG 000-0000) soybeans adapted to high latitudes and cooler environments such as Poland, with a focus on high yield and earlier maturation. In the current study, two DANKO cultivars were included: DS 22031-000 (Danko 416) and DS 22019-000 (Danko 417). Cv. Isidor is a French variety, categorized as group 0-I FAO 400–550 (middle-early), manufactured by Lidea/Euralis Semences (Lescar, France). In this study, it served as the official standard for comparison, a role it also held in several European registration trials. The Bulgarian National Program provided cv. Richy, a middle-early high-yielding variety of Bulgarian origin belonging to group 0-I by maturity (Certificate No. 10862 issued on 30 April 2010; created in the “Soybean Experimental Station—Pavlikeni” by the method of sexual hybridization between the cvs. Zvezda x Daniela 97).

2.2. Stress Induction and Germination Indexes

For the Phase 1 long-term stress treatment, the European cvs. Sahara-000, Shiva-00, Stumpa-00, Sibella-00, Stocata-0-I, Sinema-0-I, Danko 416 and 417 were used. For this purpose, 2 independent sets with 10 seeds per cultivar in two technical replicates were germinated in a glass Petri dish with filter paper moistened with 4 mL of a 150 mM or 300 mM solution of NaCl (salinity stress), and 20% or 30% PEG 6000 solution (drought stress) for a period of 12 days at room temperature. Distilled water was used for the control treatment. The observation of germinating seeds and the refreshment of the abiotic stress solutions was performed every two days, as 2 mL of the stress solution was added to the seeds. After 12 days, seedlings were placed in Magenta culture boxes on filter paper bridges, with the root part submerged in water. The Magenta boxes were placed in a growth chamber with the following parameters: temperature 20–22 °C, relative humidity 60–70%, photoperiod 16/8 h (day/night), and light intensity 150–300 µmol m−2 s−1. The seedling development data presented in the figures represent the mean values of two independent experimental sets in two biological replicates (n = 4). Both sets exhibited consistent seed germination rates and uniform development dynamics. Seedlings were monitored until the opening of the first pair of true leaves, at which point leaf samples were harvested for PCR analysis.
For the Phase 2 short-term treatment, the cvs. Richy and Isidor were used. Three independent sets with 10 seeds per cultivar were germinated in a glass Petri dish with filter paper moistened with 4 mL of 150 mM or 300 mM NaCl solution, 20% PEG 6000 solution and distilled water (control) for a period of 3 days/72 h. Afterwards, all the seeds were transferred to Petri dishes or Magenta culture boxes, and soaked in water filter paper for another 17 days. The refreshment of water was performed when needed. The experiment was conducted in a growth chamber. The observation of germinating seeds was done at several time points—3, 7, 10, 14 and 21 days post-germination (dpg). Using the collected data, we evaluated the germination dynamics for both cultivars by calculating the daily percentage of total seed germination. Furthermore, we determined key performance indicators, including the total germination index (TGI), germination percentage (G%) and survival rate (SR%). The TGI was obtained from the formula GI = Σ(Gt/Dt) = Σ(G1/1) + (G2/2) + …… + (Gn/n), where Gt is the number of germinated seeds on day t and Dt is the time corresponding to Gt in days [28]. The G% was calculated based on the maximum number of seeds that managed to germinate at any point in the experiment [29,30]. The SR was calculated as the percentage of germinated seeds that remained alive until the end of the experiment [30]. In our case, this was day 21.

2.3. Gene Expression Analyses

For the expression analyses, we selected three genes, including Glyma.01G204200, which encoded a calcium-independent, ABA-activated protein kinase and is a member of the SnRK2 (SNF1-related protein kinase) family. As an ortholog of AT4G33950, it was known to be activated by salinity and osmotic and drought stress. Another gene was Glyma.13G162800, which encoded a H+-translocating (pyrophosphate-energized) inorganic pyrophosphatase (H(+)-PPase) located in the vacuolar membrane, an ortholog of the Arabidopsis AVP1 (AT1G15690) gene. Glyma.04G252300 encoded auxin transporter-like protein 6 (LAX6), an ortholog of Arabidopsis thaliana AT1G77690 and Medicago truncatula Medtr3g072870 genes.
For the Phase 1 long-term stress treatment analyses, the total RNA was extracted from the first true leaves of the treated seedlings and controls. The samples were taken on day 16 for the controls and between days 23 and 25 for the seedlings obtained from the seeds treated with abiotic stress. For the Phase 2 short-term treatment analyses, the total RNA was extracted from leaf samples, detached from 16-day-old seedlings previously grown in water, and subsequently submerged in the stress solutions for 72 h. Control soybean seedlings were submerged in fresh water for 72 h. The leaf samples were taken before the stress induction (0 h), and at 24 h and 72 h post-treatment.
RNA isolation was performed with the RNA Plant Kit (EURx Ltd. Gdansk, Poland). One microgram of total RNA was reverse transcribed with the First Strand cDNA Synthesis Kit (Bio-Rad, Hercules, CA, USA). Relative expression levels were determined with the 7300 Real-Time qPCR System (Applied Biosystems, Foster city, CA, USA, http://www.appliedbiosystems.com, accessed on 17 March 2026). The qRT-PCR analyses were carried out in a total volume of 20 µL containing 5 µL of cDNA (diluted with RNase-free ddH2O at 1:7 ratio), 0.5 µL of gene-specific primers (10 µmol/L), 10 µL SYBR Green Mix (EURx Ltd. Gdansk, Poland), and 4 µL of RNase-free ddH2O. The PCR conditions were: 95 °C for 5 min, followed by 40 cycles of 95 °C for 15 s and 60 °C for 30 s. Primer specificity was confirmed via melting-curve analysis, performed at the end of every run to confirm a single, specific peak for each gene. Primers for the target genes (LAX6, H+-PP-ase, and StrK2) and reference genes were designed using Primer3 software, targeting an optimal melting temperature (Tm) of 58–60 °C and amplicon sizes between 110 and 145 bp (Table S2). Genomic information and gene models were retrieved from the PLAZA 5.0 platform [31], utilizing the Williams 82 (Wm82.a4.v1) genome assembly. To ensure normalization accuracy, ACTIN11 (Glyma.18G290800) and UBIQUITIN10 (Glyma.20G141600) were employed as internal controls. Both genes have been extensively validated as stable reference markers for Glycine max under drought and salinity stress [32,33]. Relative transcript abundance was calculated using one of the previous version of Biogazelle qBasePlus 2.0 (https://biogazelle-qbaseplus.software.informer.com/2.0/)—qBASE v1.3.5 software [34], and data were presented as the mean of two biological replicates, each consisting of three technical replicates to ensure biological representativeness. Primer specificity for each target gene was confirmed via PCR and gel electrophoresis. As illustrated by the LAX6 primer validation in Supplementary Figure S1, the resulting gel displayed a single PCR product at the expected 120 bp size.

2.4. Statistical Analyses

For the long-term stress study (Phase 1), gene expression data were presented as means (±SE) from two biological and three technical replicates (n = 2), with significance determined via one-way ANOVA. In the short-term study (Phase 2), germination dynamics, G%, SR%, and TGI were expressed as means (±SD) from three biological replicates (n = 3). These data were analyzed using two-way ANOVA to evaluate the effects of cultivar, treatment, time, and their interactions, followed by Tukey’s HSD post hoc tests and Student’s t-tests to identify specific differences between treatments and varieties.
Phase 2 expression levels were presented as means (±SD) from two biological replicates (n = 2), with Student’s t-tests and post hoc analysis used to compare transcript profiles between cultivars. All statistical analyses and data visualizations were performed using Microsoft Excel 365 and JASP (v 0.95.4), with a significance threshold of p ≤ 0.05.

3. Results

3.1. Phase 1—Long-Term Stress Induction

3.1.1. Water-Treated Seeds, Seedlings and Expression Profiles

Water-treated seeds (control) began to germinate on day 5 with the appearance of a 1–1.5 cm long root for all tested cultivars. After 5 days, the germinated seedlings were transferred to a Magenta box containing water. By day 8, all seedlings from cv. Sahara, from the maturity group 000, had developed their first true leaves. On day 12, seeds from all cultivars displayed either emerging or fully developed true leaves. By day 16, the first pair of true leaves had developed in all tested cultivars. The number of vigorous seedlings with well-developed open true leaves and roots on day 16 is shown in Figure 1A. Cultivars Sahara-000, Shiva-00 and Stumpa-00 produced 10 vigorous seedlings each, followed by cvs. Danko-416/417-000 with nine seedlings, Stocata-0-I with eight seedlings, Sinema-0-I with five and Sibella-00 with three vigorous seedlings.
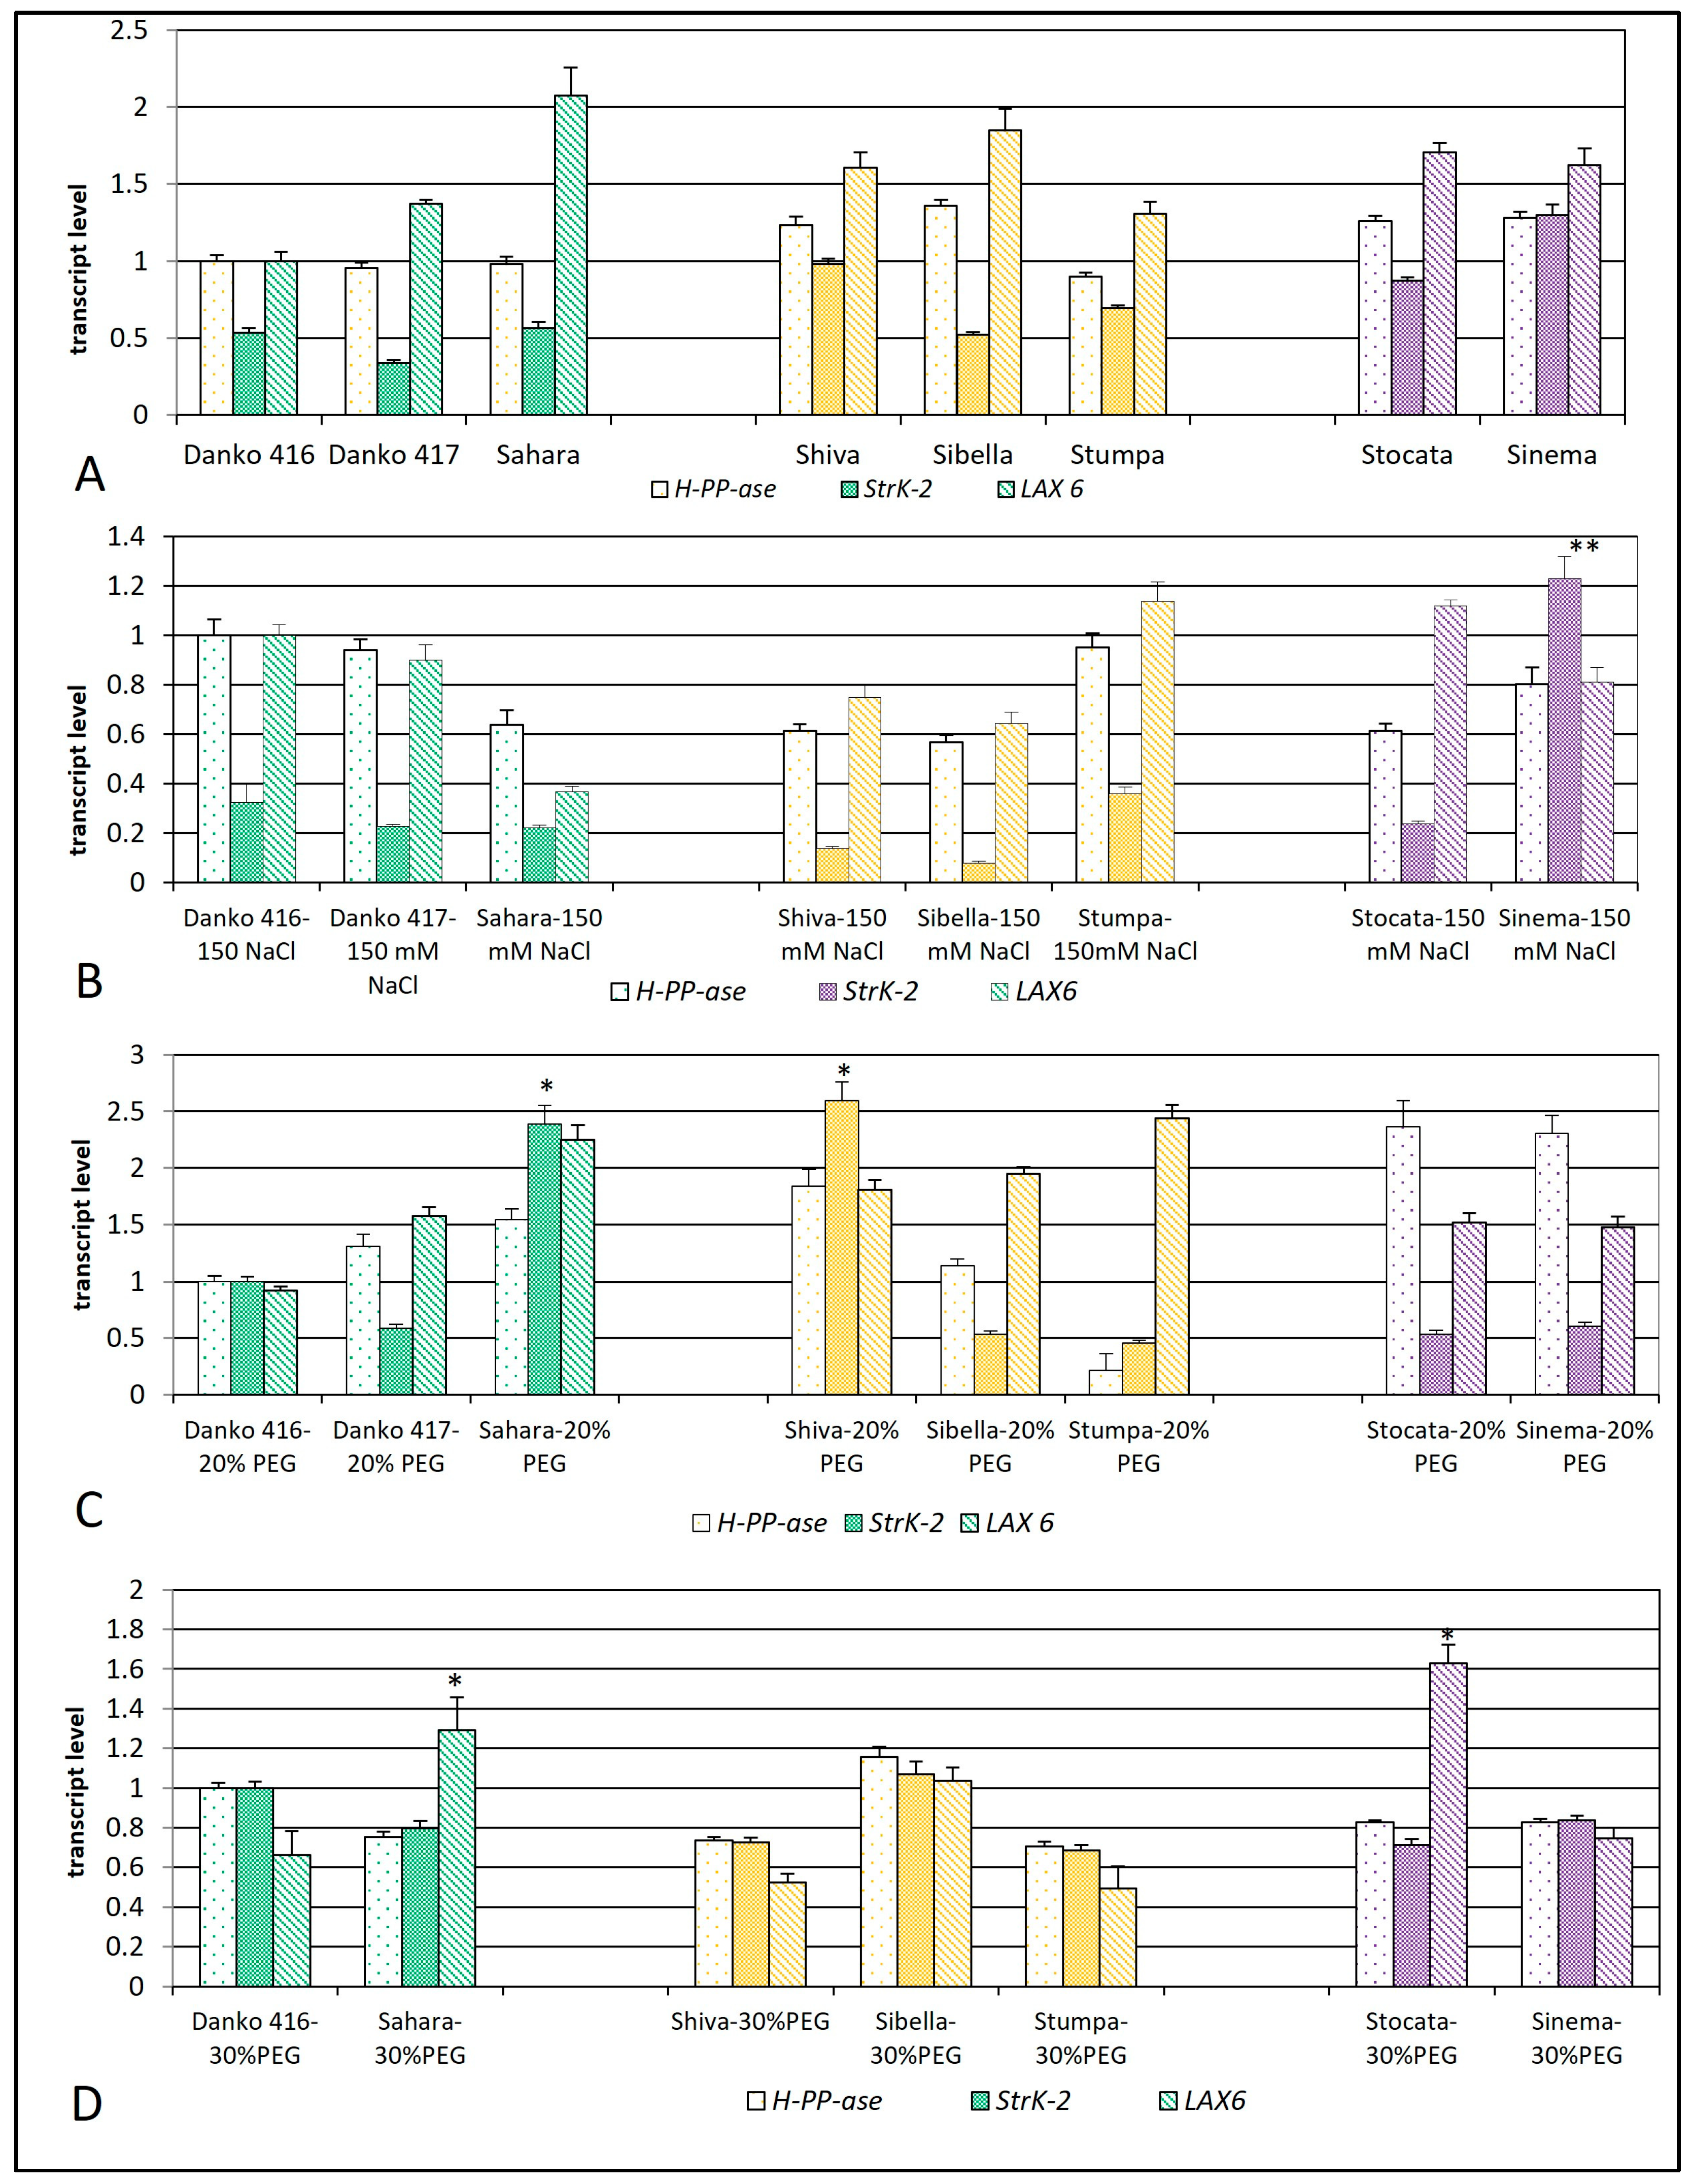
The cvs. from maturity group 000 shared the same tendency of transcript profiles of the three investigated genes for the control water treatment (Figure 2A). The trend line of transcript profiles from maturity group 00 was the same, but the relative transcript levels of H+-PP-ase and stress kinase were higher. The cvs. Stocata-0-I and Sinema-0-I shared a transcript profile similar to the aforementioned cultivars. The exception was cv. Sinema, with an equal level of H+-PP-ase and stress kinase and a low number of seedlings with developed true leaves. In cv. Sahara, which was the first to develop true leaves, the transcript level of the LAX6 gene was higher, which may be tentatively linked to vigorous seedling development within this genotype (Figure 1A and Figure 2A).

3.1.2. 150 mM NaCl-Treated Seeds, Seedlings and Expression Profiles

Moderate salinity stress (150 mM NaCl) delayed the onset of germination until day five across most cultivars (Figure 1B). While Danko 417-000 and Sibella-00 remained dormant, other varieties exhibited between three (Danko 416-000) and eight (Sinema-0-I) germinated seeds, featuring early root development (0.5–1.5 cm). On the seventh day of treatment, 10 seeds were germinated in cv. Stocata 0-I, with primary roots from 1.5 to 3 cm in length, followed by cvs. Danko 416-000, Sahara-000 and Sibella-00, but with shorter roots. On day 23 of the 150 mM NaCl salinity stress, seedling vigor was most pronounced in Sahara-000 and Stocata-0-I with eight seedlings, while Sinema-0-I was the most sensitive, with only three developed seedlings with true leaves and roots. Danko-416-000 displayed seven seedlings, Sibella-00—six seedlings, and Danko 417-000 and Stumpa-00—five, while Shiva-00 displayed four (Figure 1B). Both 0-I cultivars exhibited stunted leaf growth, producing significantly smaller true leaves relative to the control group.
Transcriptional profiling across maturity groups showed comparable baseline patterns: the 000 group shared similar gene expression patterns, whereas Stumpa-00 reached the highest expression level for StrK2 and LAX6 (Figure 2B). A significant divergence was noted in the 0-I group, where Sinema exhibited a sharp, statistically significant increase (p ≤ 0.01) in StrK2 expression level compared to Stocata.

3.1.3. 300 mM NaCl-Treated Seeds and Seedlings

Seed treatment with severe salt stress (300 mM solution of NaCl) was detrimental to all tested cvs. from different maturity groups (Figure 1C). Throughout the first 7 days, no germination was observed. Between days 7 and 9, the cvs. Sahara-000, Shiva-00, Sibella-00, Stumpa-00, and Stocata-0-I began to show initial root growth, with Stumpa-00 exhibiting the highest germination rate. On day 12, after the stress agent was replaced with water, cvs. Danko 416-000, Danko 417-000 and Sinema-0-I also began to germinate. However, from day 14 to 16, germinated seeds across all cultivars began to fail. This process of seedling loss continued until day 20, by which point all germinated seeds had died (Figure 1C). qRT-PCR analysis could not be conducted because the stunted growth prevented all cultivars from developing the first true leaves required for tissue sampling.

3.1.4. 20% PEG-Treated Seeds, Seedlings and Expression Profiles

Under the 20% PEG treatment, germination across all cultivars began between days 7 and 9, except for Danko 417-000, where the first germinated seeds were observed on day 14 (Figure 1D). During this period, cvs. Sahara-000, Sinema-0-I and Stumpa-00 showed the most progress, with root length reaching up to 1–2 cm. On day 12 of treatment cv. Sahara-000 and cv. Stumpa possessed nine and eight germinated seeds, respectively, with 3 cm long roots. In general, the seed germination peak for Sahara-000 was between days 8 and 18, with nine germinated seeds, while for Stumpa-00, it was between days 14 and 16 (nine seeds). Cv. Sinema-0-I was characterized with early germination on day 9 and maintained high germination up to the 20th day. By day 20, none of the tested cultivars had successfully developed true leaves; however, significant root growth was noted in cvs. Sahara-000, Stumpa-00, Sinema-0-I and Stocata-0-I, with root length reaching up to 10 cm. Cv. Sahara-000, followed by cv. Sinema-0-I, was characterized by the highest number of seedlings, with the first true leaves emerging on day 25. Although cvs. Sahara-000 and Stumpa-00 possessed seedlings with leaves on the 23rd day, they reached a total height of 14 cm.
The observed expression profiles of cv. Sahara-000, which produced nine vigorous seedlings with developed true leaves, showed a relative transcript level of StrK2 (2.38), which was nearly equal to the transcript level (2.59) of cv. Shiva-00, where only two seedlings with poorly developed true leaves were observed (Figure 2C). The other cvs. of maturity group 000, Danko 416 and Danko 417, developed only four and three seedlings with true leaves but the transcript levels of StrK2 were low (1.0 and 0.58). A low relative transcript level for StrK2 was also noted in cv. Stumpa-00, despite its high germination dynamic, with nine seedlings with developed true leaves. For the cvs. Sahara-000 and Stumpa-00, the levels of the LAX6 gene were higher, which correlated with higher seedling vigor. All of the seedlings were characterized by acceptable height and well-developed true leaves. In maturity group 0-I (Sinema and Stokata), the transcript profiles of three investigated genes were dominated by the highest absolute value for the H+-PP-ase transcript (Figure 2C).

3.1.5. 30% PEG-Treated Seeds, Seedlings and Expression Profiles

Across all cultivars subjected to 30% PEG, germination started on day 12, when the stress agent was replaced with water. The only exception was cv. Shiva-00, which had a single seed germinated on that day (Figure 1E). From days 14 to 25, varying numbers of seeds belonging to the cvs. Danko 416-000, Sahara-000, Sibela-00, Stokata-0-I and Sinema-0-I germinated and developed true leaves and roots. Notably, while the seedlings from cv. Danko 417-000 (2.5 in average number) germinated on day 18, but subsequently died after the 23rd day, Stumpa-00 produced eight surviving seedlings on day 16, which successfully developed their first true leaves and survived up to the 23rd day. Vigorous seedling survival following the 30% PEG treatment appeared more pronounced in cultivars from maturity groups 000 (cvs. Danko 416 and Sahara) and 00 (represented by Stumpa) under these experimental conditions (Figure 1E). Group 0-I (cvs. Stocata and Sinema), together with cv. Danko 416, showed the lowest number of surviving seedlings, and seedlings with developed true leaves. Molecular analysis revealed that cvs. Danko 416 and Sahara (group 000) exhibited nearly identical expression levels of StrK2 and H+-PP-ase (Figure 2D), while the relative expression level of the LAX6 gene was significantly higher in cv. Sahara-000 (p ≤ 0.05). Similarly, transcript levels for the three investigated genes were equal within group 00 (cvs. Shiva, Sibella, and Stumpa). In contrast, while cvs. Sinema and Stocata (group 0-I) had comparable StrK2 and H+-PP-ase levels, cv. Stocata displayed a significantly higher transcript level of the LAX6 gene (p ≤ 0.05; Figure 2D).

3.2. Phase 2—Short-Term Stress Induction

For subsequent detailed analyses, various indicators related to seed vitality were calculated for two selected varieties from maturity group 0-I. As a representative Bulgarian soybean variety, cv. Richy was chosen, and the French cv. Isidor was selected as a standard. The seed germination experiment was conducted under various stress conditions, specifically salinity (150 and 300 mM NaCl) and osmotic stress (20% PEG), to simulate drought conditions. The experimental layout compared a control against different concentrations of the stress agents. The seeds from the two cultivars were plated in Petri dishes with filter paper soaked in stress solutions for 3 days. Afterwards, the stress solutions were replaced with water, and the seeds were incubated for another 18 days. The control seeds were germinated in water for a total 21-day period. The experiment was conducted in three independent sets with 10 seeds per cultivar (n = 3).

3.2.1. Germination Dynamics and Seedling Development

Seedling development was visually observed for both cultivars. While the most important stages in the seed-to-seedling transition were documented, a comprehensive morphological and biometric analysis was omitted as it fell outside the main scope of this research. Germination progress was monitored at specific time intervals—3, 7, 10, 14 and 21 days post-germination (dpg) (Figure 3). In both cultivars, the control groups showed the most stable and sustained germination levels, starting early and remaining relatively high throughout the 21 days. In all stress treatments, the germination process was significantly delayed. The control group produced healthy-looking seedlings with shoots and roots. The seeds subjected to salinity stress exhibited a dose-dependent inhibition of growth. At 300 mM NaCl, germination and subsequent growth were severely suppressed compared to the 150 mM treatment. The 20% PEG treatment caused significant inhibition of radicle emergence and seedling vigor compared to the control. By 14 dpg, control seedlings had developed their first true leaves. Seeds subjected to higher stress environments (300 mM NaCl and 20% PEG) were characterized by significantly inhibited growth compared to the lower salt concentration, where elongation of the primary root was observed. During the period 14–21 dpg, further maturation of seedlings was noticed. Control groups possessed more leaves and longer roots, while the inhibitory effects of the high salinity concentration were more pronounced at this stage. Many seeds failed to develop beyond initial germination. Some of them exhibited short roots and shoot stunting, chlorosis and necrosis. After treatment with 150 mM NaCl and 20% PEG, cv. Richy was characterized by the emergence of first true leaves and a longer root around 17–20 dpg, compared to the Isidor seedlings, which displayed delayed development and their first true leaves opened after day 21.

3.2.2. Quantitative Germination Progress

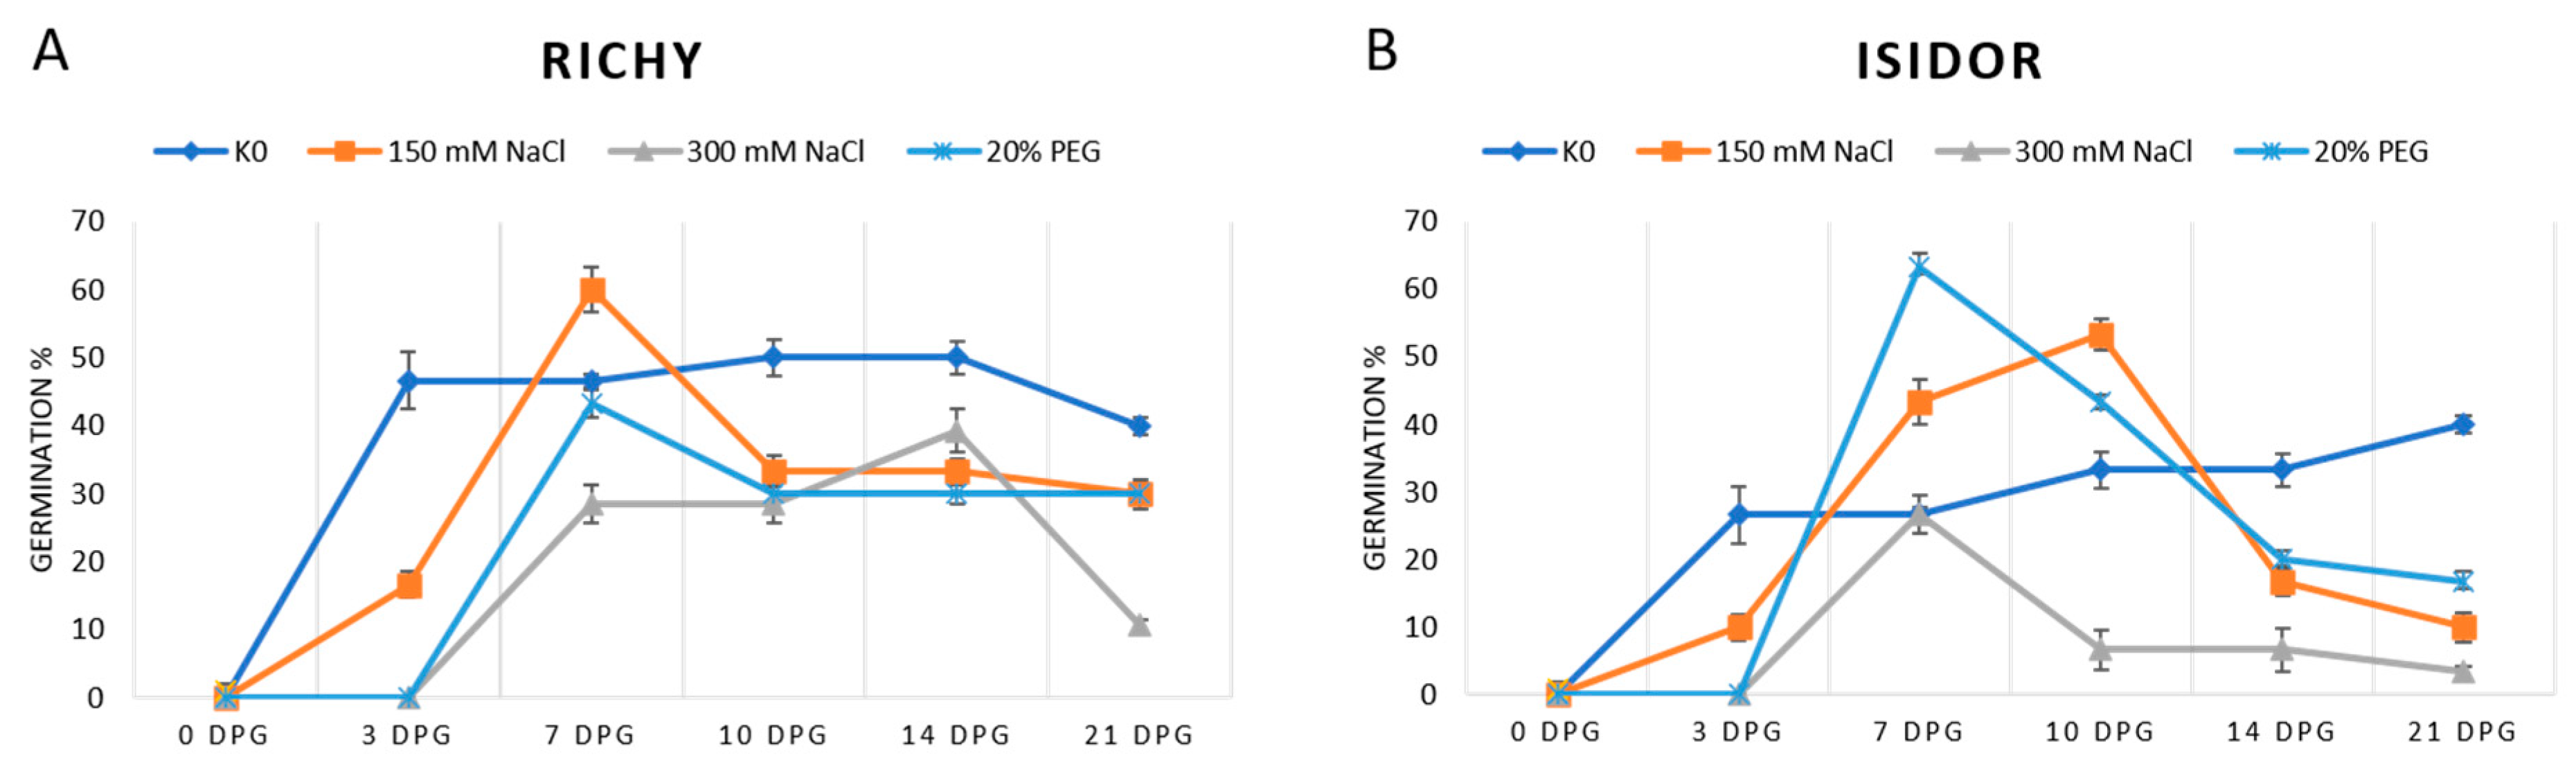
While control seeds began germinating by 3 dpg, most stressed seeds showed no significant activity until 7–10 dpg. The only exception was the 150 mM NaCl group, which actually managed to start germinating early. At 7 dpg, both cultivars possessed the highest germination percentage per day. In cv. Richy, after the slow start at 3 dpg, the 150 mM NaCl group actually surpassed the control (K0) at 7 dpg, reaching a peak value of 60% germination (Figure 3A). After treatment with 300 mM NaCl, the highest germination value was reached at 14 dpg before dropping sharply by day 21.
In cv. Isidor, the highest germination value occurred on day 7 under the 20% PEG treatment (Figure 3B), followed by a rapid decline. For the moderate salt treatment, the highest germination value was observed on day 10 (53.33%). While the control group remained stable through day 21, all stress groups—particularly the severe salinity group—showed significantly lower germination activity (Figure 3B).
The results of the two-way ANOVA (Table S3) indicated a highly significant interaction between treatment and time for both cultivars (p ≤ 0.001). This interaction confirms that the impact of abiotic stress on germination is not constant but fluctuates significantly throughout the 21-day period. Furthermore, the analysis of cultivar X treatment interaction at the final time point (Table S4) was also highly significant (p ≤ 0.01), indicating that the cultivars exhibited distinct responses to specific stressors.
Subsequent Tukey’s HSD post hoc analysis at 21 dpg revealed that cv. Richy exhibited significantly higher baseline vigor than cv. Isidor. Notably, the germination performance of cv. Richy under extreme salinity (300 mM NaCl) was comparable to Isidor’s performance under moderate drought (20% PEG). Conversely, Isidor showed a significant reduction in final germination across all stress treatments, identifying it as the more stress-sensitive cultivar.

3.2.3. Total Germination Index (TGI), Germination% (G%) and Survival Rate%(SR%)

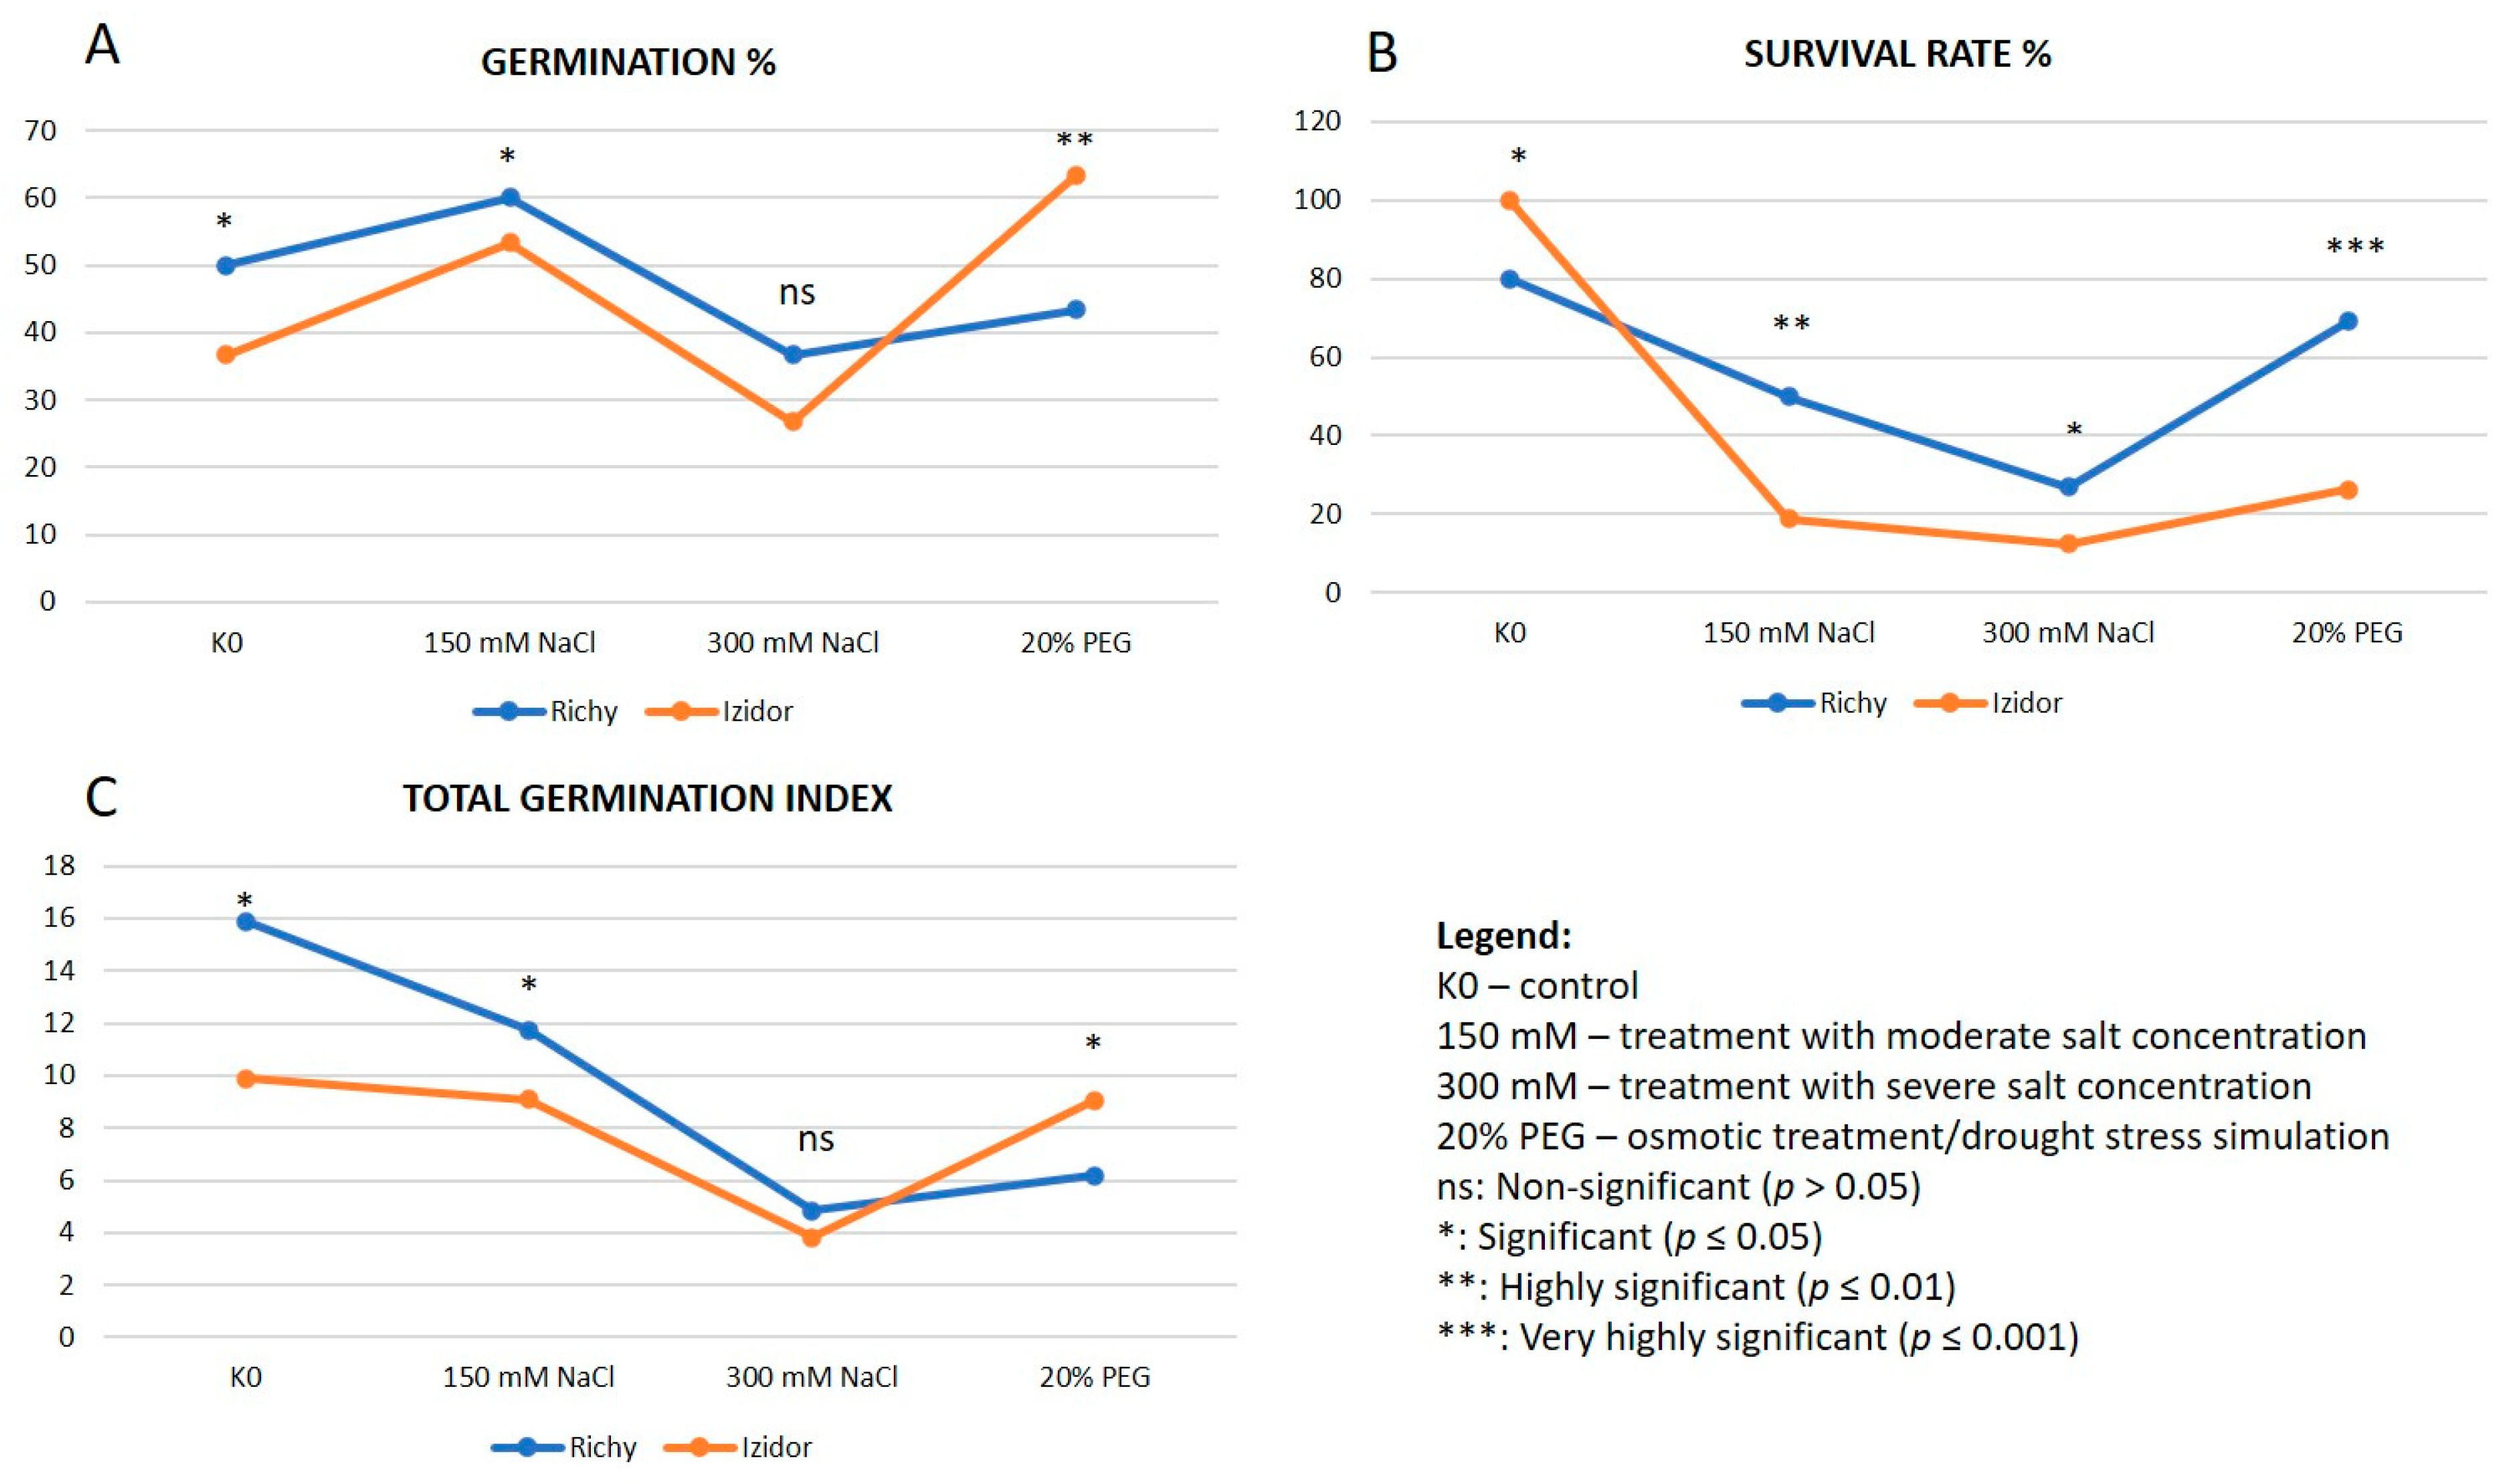
Furthermore, indicators related to the germination and survival of both cultivars were determined. These data are summarized in Supplementary Materials Table S5. Table S6 presents the data for the TGI. The analysis of germination and survival parameters revealed variations in the germination and survival patterns between the two soybean cultivars, Richy and Isidor, when subjected to salinity and drought stress. Germination percentage (G%) was calculated based on the maximum number of seeds that managed to germinate at any point during the experiment. This method defines the maximum viability observed at any point during the experimental period rather than just the final count. In our experiments, where abiotic stress from salinity and drought was applied, a seed might have germinated, but then subsequently died or rotted before the final count. Calculating based on the maximum/peak value of germination ensures that we record the seed alive and capable of germinating. The maximum number of germinated seeds was recorded at the peak moment for each variant. In our study, for cv. Richy, these peaks were as follows: K0—10 dpg (50%), 150 mM NaCl—7 dpg (60%), 300 mM NaCl—14 dpg (36.67%) and 20% PEG—7 dpg (43.33%); for cv. Isidor—K0—21 dpg (36.66%), 150 mM NaCl—10 dpg (53.33%), 300 mM NaCl—7 dpg (26.66%) and 20% PEG—7 dpg (63.33%) (Figure 4A). The obtained results suggested that cv. Richy possesses an earlier germination peak than cv. Isidor in the control group. It also reacted faster to the moderate salt concentration, reaching its highest point at 7 dpg, whereas Isidor lagged behind, with a germination peak at 10 dpg. On the other hand, Isidor reacted faster to extreme salt: the peak was at day 7, while Richy took twice as long, peaking at 14 dpg. Under drought stress, Isidor reached a significantly higher germination point than Richy at the same time point (7 dpg). Two-way ANOVA revealed highly significant differences in G% across treatments for both cultivars (p ≤ 0.001) (Table S7). Subsequent post hoc analysis indicated that, compared to the control and moderate salinity treatments, G% differences were significant for both cultivars (p ≤ 0.05). High salinity caused by the 300 mM NaCl solution served as the only treatment to cause a consistent reduction in germination capacity across both cultivars, and a non-significant difference was observed between the cultivars. After drought stimulation, Isidor performed significantly better (p ≤ 0.01) (Table S8).
The SR was calculated as the percentage of maximum germinated seeds that remained alive until the end of the experiment [30], which corresponded to day 21 (Table S5; Figure 4B). However, the graph for SR% illustrates a dramatic difference in how the two cultivars handle stress (Figure 4B). While Isidor had a higher SR in the control group (K0), its SR declined as soon as stress was introduced. The Richy variety maintained a significantly higher SR than Isidor in every stress treatment (150 mM NaCl, 300 mM NaCl, and 20% PEG) (Figure 4B). Under moderate salt stress (150 mM NaCl), Richy’s SR was approximately 50%, while Isidor’s dropped to below 20%. Even under extreme salt conditions, Richy’s SR remained at nearly 30%, whereas Isidor reached its lowest point (~12%). The most remarkable recovery occurred for Richy under 20% PEG treatment, where its SR rose up to ~70%. In contrast, Isidor only showed limited recovery up to ~25%. Two-way ANOVA revealed highly significant differences in seedling survival rates across treatments for both cultivars (p ≤ 0.001). Post hoc analyses statistically validated cv. Isidor as highly sensitive to abiotic stress (Tables S7 and S8). While it maintained a significantly higher survival rate under control conditions, the application of salinity and drought stress caused a statistically greater reduction in viability compared to cv. Richy, suggesting that Richy may possess higher capacity for adaptation under the tested stress threshold.
The GI was calculated based on the formula proposed by Andrew et al. (2021) [28]. The GI assigns greater importance to seeds that germinate first and serves as a powerful indicator of overall seed vigor, combining both the speed and the final success rate of germination. Across all treatments, Richy suggested a trend toward higher basal vigor under control conditions, maintaining a high TGI compared to Isidor (Figure 4C). Statistical analysis revealed significant differences (p ≤ 0.05) in the TGI between the cultivars under control and moderate stress conditions. Regarding salinity tolerance, at 150 mM NaCl, Richy maintained a better TGI of ~12, which was notably higher than Isidor’s control level. On the other hand, 300 mM NaCl represents the “lethal concentration” for both cultivars. The cultivars’ vigor dropped to its lowest levels—Richy ~5 and Isidor ~4. No significant difference (p > 0.05) was observed at the extreme 300 mM concentration. The drought treatment (20% PEG) was the only condition where Isidor surpassed Richy. Isidor’s TGI recovered to ~9, nearly matching its own control level. Conversely, Richy showed only a slight recovery to ~6. Two-way ANOVA confirmed highly significant differences in the TGI across all treatments for both cultivars (p ≤ 0.001). Post hoc analysis revealed that cv. Richy outperformed Isidor in K0 significantly (p ≤ 0.05) and maintained a higher TGI under moderate salt treatment (p ≤ 0.01) (Tables S7 and S8). Both cultivars showed nearly zero vigor after the application of severe salinity stress, and no significant difference was observed between them regarding this parameter. Conversely, cv. Isidor exhibited a statistically significant increase in the TGI following drought stress application, compared to Richy (p ≤ 0.05).

3.2.4. Expression Profiles

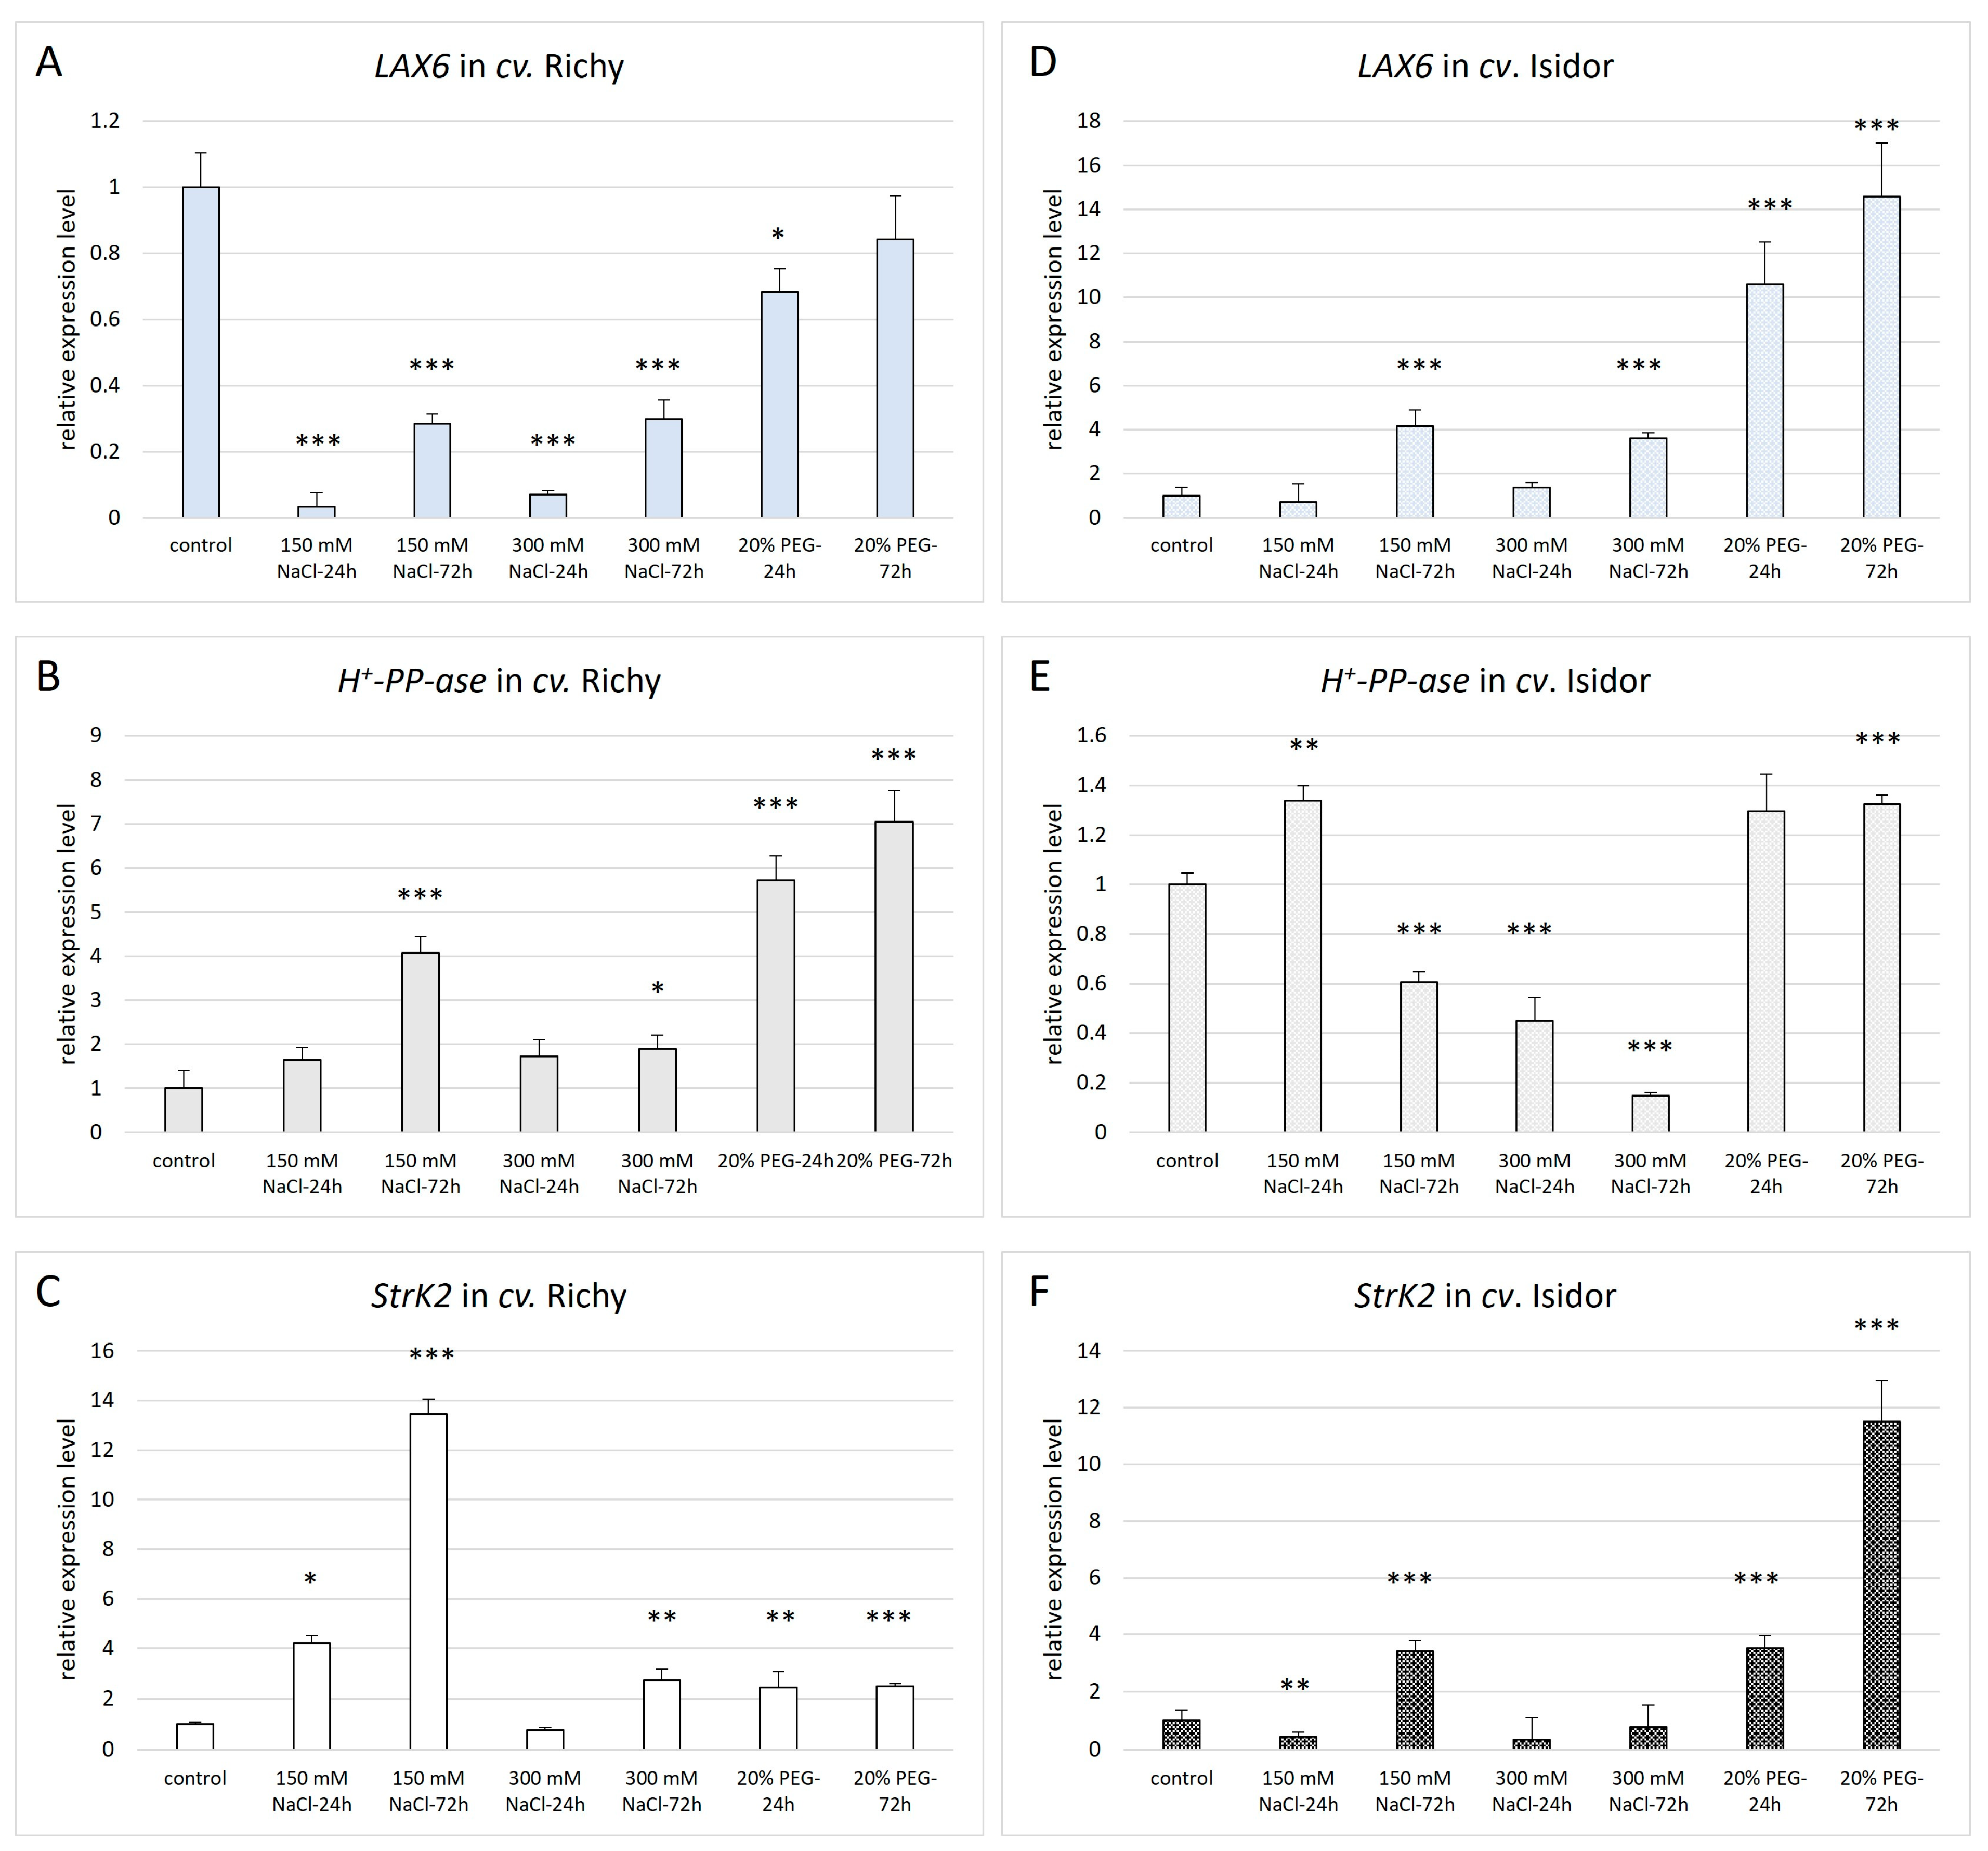
The 16-day-old seedlings from both cultivars previously grown in water were subjected to different stress solutions (150 and 300 mM NaCl, and 20% PEG) for 72 h. Controls continued their growth in water. Leaf samples were taken before the stress treatment and 24 h and 72 h later. The relative transcript levels of LAX6, H-PPase and SrK2 were determined (Figure 5) in cvs. Richy and Isidor. Student’s t-test was performed to compare each stress condition against the control, the expression level of which was normalized to 1.0, to check if the up/downregulation was statistically significant. In cv. Richy, LAX6 was severely suppressed by salt stress. At 24 h of 150 and 300 mM NaCl treatment, expression dropped significantly (p ≤ 0.0001). Between 24 h and 72 h in both salt concentrations, partial recovery was noticed, but transcript levels remained significantly lower than the control (p ≤ 0.0001). By the 72nd h of 20% PEG treatment, the expression level was not statistically different from the control, whereas at 24 h, a significant difference was observed (p ≤ 0.01) (Figure 5A). Post hoc result indicated that cv. Isidor had a significantly higher LAX6 response to stress than cv. Richy (p ≤ 0.001).
Unlike LAX6, the H-PP-ase gene responded most strongly to drought stress (Figure 5B). At the 24th and 72nd h, the gene expression level showed a highly significant increase (p ≤ 0.0001). Moderate salt (150 mM) triggered a significant enhancement in the expression level only after 72 h, while at 24 h, the increase was visible but not significant. The severe salt concentration led to lower gene expression compared to the 150 mM NaCl treatment at the same time point (72 h). The most significant increase was observed for the StrK2 expression level after 72 h of treatment with 150 mM NaCl (p ≤ 0.0001) (Figure 5C). The gene was strongly upregulated over time in response to moderate salt stress. At 300 mM NaCl (24 h), the expression dropped below the control non-significantly, but the plant recovered and showed significant upregulation by 72 h. For PEG conditions, StrK2 showed steady, significant upregulation at both time points (p ≤ 0.001; p ≤ 0.0001). Post hoc analyses indicated that Richy maintained significantly higher transcript levels of the H-PP-ase gene under prolonged stress (p ≤ 0.001), supporting its higher seedling survival rate.
After the expression analyses for the LAX6 expression level in cv Isidor, a highly significant response was found to the drought stress caused by 20% PEG at 24 h and 72 h, which represented the strongest response seen across all data obtained so far (Figure 5D). The salt response was delayed, as no significant change was noticed in the first 24 h. By the 72nd h, the gene was significantly upregulated after both the 150 mM and 300 mM NaCl treatments (p ≤ 0.0001). Interestingly, Isidor’s stress response was opposite to Richy’s regarding the expression of the LAX6 gene. The H-PP-ase expression level in Isidor (Figure 5E) was suppressed by salt over time (p ≤ 0.0001). At the 72nd h of 300 mM NaCl application, expression dropped to 0.148 (an 85% reduction). The only significant upregulation under salinity occur briefly at 24 h (150 mM), before the expression levels crashed (p ≤ 0.001). Under drought conditions, Isidor showed a modest but statistically significant 1.32-fold increase by the 72nd h. Similar to the LAX6 data, the StrK2 gene in Isidor exhibited a powerful, highly significant response to 20% PEG, reaching a greater than 11-fold increase by 72 h (p ≤ 0.0001; Figure 5F). After the application of 150 mM NaCl for 24 h, the gene was significantly suppressed (p ≤ 0.001), before recovering to a strong increase by 72 h (p ≤ 0.0001). According to the post hoc results, Richy was more responsive to salt via StrK2, whereas Isidor was more responsive to drought (p ≤ 0.001).

4. Discussion

For agriculture nowadays, abiotic stressors like drought, soil salinity, heat, and cold are the main reasons for sustainable yield loss [35]. In the context of climate change, the severe abiotic conditions of drought and heat destroy proper plant development from the germinating seed stage to mature plants [36]. Another major stress factor is increased soil salinity, which could be lethal for crops. This abiotic stress slows down the photosynthetic process and causes elevated oxidative stress [37].

4.1. Expression Pattern and Seedling Vigor Among Soybean Cultivars Subjected to Long-Term Salinity and Drought Stress

This two-phase study investigated how abiotic stress, specifically salinity and drought, affects seed germination and the development of vigorous seedlings across various soybean cultivars from different maturity groups. During the first phase, involving a 12-day treatment, germination was monitored under two levels of salt stress (150 mM and 300 mM NaCl) and two levels of drought stress (20% and 30% PEG 6000). In addition to tracking the germination process and seedling viability, this research analyzed the expression levels of three specific genes to understand the molecular responses to these stressors. The functions of these genes, responsible for drought and salinity stress tolerance, were established in our previous studies on soybean crops [23,25]. The H+-translocating inorganic pyrophosphatase (H+-PP-ase) is related to the response to water deprivation and salt stress, as well as the maintenance of the transmembrane electrochemical gradient [38,39]. The stress protein kinase is described as an abscisic acid (ABA) signaling component. This protein kinase is determined as sucrose non-fermentation (snf)-related protein kinase subfamily 2 (SnRK2), involved in the phosphorylation of transcription factors and subsequent expression of ABA-responsive genes. The role of ABA in plant development is to participate in adaptive responses to the abiotic stresses of drought and salinity [40,41]. The third gene examined in this study was an auxin transmembrane transporter. Our previous investigation using the model plants Medicago truncatula, Lotus japonicus and Arabidopsis thaliana confirmed its involvement in seedling vigor and plant development [42]. Very recent studies confirm the role of auxin transmembrane transporters in the answers to abiotic stresses [18,43]. The expression profiles of these three investigated genes were determined in seedlings when the first true leaf pair had opened, several days after the specific stress was applied and subsequently replaced with water. The transcriptional response varied significantly depending on the type and intensity of the abiotic stressor, as well as the recovery capacity of the specific soybean cultivars. In moderate stress conditions (150 mM NaCl), by day 23, most cultivars exhibited a downregulated profile, with stress kinase transcripts dropping below control levels. A notable exception was cv. Sinema, which maintained a high level of expression. Since this is a low-vigor cultivar, this signaling pattern might reflect a state of chronic stress rather than a successful adaptive response, though further replication is needed to confirm this trend. In many cases, low-vigor seeds often display high expression of specific mRNA transcripts, related to the seed’s attempt to overcome cellular damage [44]. Under 20% PEG (drought stress), high transcription levels correlate much more successfully with seedling survival and recovery. The cvs. Sahara and Shiva shared a significantly high expression level (p ≤ 0.05) compared to the control group or after treatment with 150 mM NaCl. Those two cultivars belong to two different maturity groups and differed significantly in the number of vigorous seedlings at day 25. Upon treating the seeds with a 30% PEG solution, the expression profile of the studied genes in all of the tested cultivars was nearly uniform, in the range of 0.7 to 1.0.
Moderate salt stress (150 mM NaCl) caused a two-fold decrease in H+-PPase transcript levels for cultivars across maturity groups 00 (Shiva, Sibella) and 0-I (Stocata, Sinema). This downregulation suggests that high salinity may inhibit the primary vacuolar proton pump, potentially disrupting ion sequestration. The overexpression of H+-PP-ases (like AVP1 or LfVP1) is a well-documented method for improving drought and salt tolerance by maintaining ion homeostasis [45]. Drought Stress (20% PEG) induced an increase in the H+-PP-ases transcript levels in the leaves detached from seedlings belonging to cvs. Sahara-000, Shiva and Sibella (00), with a more pronounced increase observed in cvs. Sinema and Stocata (0-I maturity group). Studies on maturity group variations indicate that early maturing haplotypes (like those in groups 000 and 00) have evolved specific accumulation patterns to adapt to high-latitude or stress-prone regions [46]. This demonstrates a physiological “ceiling” where the plant shifts from active adaptation to a baseline survival mode [47].
Based on previous research with model legumes [42], our team prioritized tracking the expression patterns of the LAX6 gene. In control seedlings of the Sahara, Shiva, and Stumpa cultivars (000, 00), high levels of the LAX6 transcript correlated with high seedling viability. However, cv. Sibella showed high expression despite having only three viable seedlings. The salt stress treatment (150 mM NaCl) resulted in decreased transcript levels across all cultivars. In the study by Yang et al. (2023) [43], it was reported that under salt stress treatment, most of the genes from the CcAUX/LAX family were highly expressed in roots, but low expression was found in stems and leaves. Upon treatment with 30% PEG, the expression level of this auxin transporter dropped almost two-fold, except in cv. Stocata, where its expression remained almost unchanged. On the other hand, an increase in the LAX6 transcript level was observed in seedlings grown from seeds treated with 20% PEG for cvs. Sahara, Shiva, Sibella and Stumpa. Also, general upregulation of the expression levels of the three studied genes was observed after treatment with the 20% PEG solution. This provides further proof that salt stress is more toxic than drought stress [48]. In general, gene expression patterns were genotype-specific and varied significantly between the individual cultivars, as seen in the distinct transcript levels of cultivars like Sahara, Sinema, Stumpa and Shiva. Within the maturity groups, the cvs. have similar expression profiles under both control conditions and stress treatments.

4.2. Expression Pattern and Seedling Vigor Among Soybean Cultivars Subjected to Short-Term Salinity and Drought Stress

In Phase 2, cultivars Richy (of Bulgarian origin) and Isidor (of French origin) exhibited divergent developmental patterns during the early stages of seedling growth under short-term salinity (NaCl) and drought (PEG) stress. Both cultivars belong to the semi-late/middle-early maturity group 0-I. Different indices related to the vigor and development of seedlings were analyzed, together with the relative expression levels of LAX6, H+-PP-ase and StrK. The type of stress drastically changed the outcome, regardless of the cultivar. Under control conditions, cv. Richy generally maintained higher germination than cv. Isidor. Cv. Richy showed significantly higher salt tolerance. At the control level cv. Richy had a higher baseline germination potential. These observations point to cv. Isidor being more sensitive to the applied stress. In general, cv. Richy exhibited a trend toward higher basal vigor and a sustained germination profile, whereas cv. Isidor may have utilized a distinct physiological mechanism to cope with stress. According to the salt treatment, cv. Richy reacted faster to the 150 mM NaCl treatment, with high sprouting on day 7. This suggests that moderate salinity may actually act as an activating agent for Richy, a trait not seen in Isidor. This is a well-known phenomenon, where low-level stress can upregulate gibberellic acid (GA) and downregulate abscisic acid (ABA), essentially preparing the seed for better establishment [49]. On the other hand, cv. Isidor reacted faster to extreme salt (300 mM NaCl), with higher germination at day 7. It appears that in Isidor, 20% PEG triggers rapid, but unstable germination, as evidenced by the fact that it surpassed the control. Seed priming with PEG is an osmotic technique that causes a rapid enhancement of some antioxidant enzymes in seedlings exposed to drought stress, which initiates uniform and faster germination [50]. For example, PEG-primed rice exhibited higher seed germination and an increase in the seedling growth rate [51].
Regarding survival and stress resilience, Isidor possessed a higher SR under ideal (control) conditions, but its viability dropped sharply upon the stress application. After salt treatment, Richy maintained a significantly higher SR across all salt treatments, whereas the SR in cv. Isidor dropped significantly. Upon drought stress, the most striking difference was that Richy’s survival rose to ~70%, whereas Isidor only marginally recovered to ~25%, confirming that it cannot maintain uniform germination during drought-like conditions. Cv. Richy possessed significantly higher GI than cv. Isidor among the treatments, except for the drought stress treatment. A non-significant difference was observed when severe stress (300 mM) was applied, indicating that this concentration is “lethal” for both cultivars. Previous studies have confirmed that with increasing levels of drought and/or salinity, all of the germination indices and morphological parameters, such as root and shoot length, weight, and vigor, decreased, while the average germination time was prolonged [52,53].
The molecular data for the LAX6, H+-PP-ase and StrK2 genes supported the seedlings’ vigor observations. In cv. Richy, the relative transcript level of LAX6 was downregulated no matter the time point or the type of stress treatment. The 20% PEG treatment resulted in the stabilization of expression during drought stress. Cv. Isidor possessed very high upregulation of LAX6 across all treatments. This is an indicator of the involvement of the LAX6 gene in the response to drought stress (PEG). In general, LAX genes exhibit inconsistent expression patterns under drought and salinity. In soybean, some of the differentially expressed GmLAX genes under drought and salt stress conditions are downregulated [17,18]. Eight CcAUX/LAX genes were found in the genome of C. cathayensis, which showed different expression profiles in different tissues after the application of abiotic stress drought and salinity. CcLAX3 expression was downregulated in roots and upregulated in leaves after moderate and severe drought stress. Under salt stress, most of the studied genes, including CcLAX3, were highly expressed in roots but poorly expressed in stems and leaves [43]. Tomato plants overexpressing SlWRKY3 showed increased expression of LAX3 genes and tolerance to drought stress [54]. H+-PP-ase responded with upregulation after the salt and drought treatment, which was most pronounced under 150 mM NaCl and 20% PEG at the 72nd h in cv. Richy, while in cv. Isidor the upregulation after salt exposure was higher at the 24th h. This result suggests a time-dependent salt response, but with opposite trends for both cultivars. After treatment with severe salt concentration, the gene expression change was not significant in comparison with the control. Most likely, high salinity might be stressing the plant’s capacity to upregulate this specific gene and inhibits its expression. Unlike the general response seen previously in cv Richy, the H+-PP-ase expression level in Isidor (Figure 5E) was suppressed by salt over time. It is known that the vacuolar proton pump plays a crucial role in salt tolerance mechanisms, driving to create proton gradients or maintain membrane potential and facilitate Na+ efflux mediated by the SOS1 transporter [55]. In cv. Richy, StrK2 was strongly upregulated in response to moderate salt over time, whereas after severe salt treatment, cv. Isidor struggled to upregulate the StrK2 gene. At both the 24 h and 72 h time points, the expression level remains below or near the control level with no statistical significance. The transcript level in Isidor showed an 11-fold increase under 20% PEG treatment, indicating that the gene is likely involved in the plant’s response to drought stress, was significantly upregulated after moderate salt stress, but struggled to upregulate the gene under severe salt. Previously obtained results confirm our findings regarding the upregulation of stress kinases during abiotic stress treatment [23] and their critical role in detecting environmental stimuli—like high salt or water deficit—and triggering protective genetic responses [56].

4.3. Future Perspectives

The findings of this study provide a foundation for further exploration into soybean cultivars. Our future laboratory work based on the collected data will focus on selecting the most promising genotypes to measure the physiological markers such as Relative Water Content (RWC), electrolyte leakage, proline accumulation, lipid peroxidation (LPO), ROS generation and antioxidant enzyme activity. Along with these biochemical assessments, in-depth phenotypic and morphometric analyses will be performed. Another option will be to focus on validating these laboratory observations through multi-year field experiments to evaluate how early maturing cultivars perform under naturally fluctuating environmental conditions. Furthermore, it would be beneficial to investigate whether stress exposure influences the vigor and stress response mechanisms in the offspring of the studied cultivars. Regarding the gene expression data, further research is needed to better understand the roles of auxin transport and stress kinase signaling in coordinating root and shoot development under limited conditions. These identified morphological, physiological and molecular markers could potentially support breeding programs aimed at developing soybean varieties specifically optimized for the evolving climate of Southeast Europe.

5. Conclusions

The experimental data collected from this study confirm that treatment with 300 mM NaCl has a detrimental effect on the germinating seeds. The moderate salt concentration of 150 mM NaCl affected the number of vigorous seedlings compared to the control but, despite that, their number remained higher than after treatment with 20% PEG. The treatment of seeds with a 30% PEG concentration led to a lower number of viable seedlings, except in cvs. Danko 416, Shiva and Sibella, where an elevated number of viable seedlings was observed. No viable seedlings developed for cv. Danko 417, confirming the genotype specificity of this process. For cv. Isidor, the salt treatment was more toxic than for cv. Richy, which points toward the potential involvement of the cultivar to salt stress adaptation. Conversely, cv. Isidor showed a remarkably rapid but transient response to drought stress. Collectively, these data provide preliminary insights into the expression profiles of the key marker genes (LAX6, H+-PP-ase, and StrK2) and the genotype-specific responses of the studied soybean cultivars to salinity and drought within their respective maturity groups. Consequently, the observed genotype-specific expression trends, based on molecular analyses with limited biological repeats serve as preliminary results which, in future investigations, should be confirmed with a higher number of repeats.

Supplementary Materials

The following supporting information can be downloaded at: https://www.mdpi.com/article/10.3390/crops6030057/s1, Figure S1: Specificity validation of LAX6 primers; Table S1: Characteristics of Soybean Cultivars and Breeding Programs; Table S2: Primers used for expression analyses and techical parameters for qRT-PCR; Table S3: Two-way Anova for Treatment x Time (Figure 3); Table S4: Two-way Anova for Cultivar x Treatment (Figure 3); Table S5: Indicators of germination and survival %; Table S6: Total germination index (TGI); Table S7: Two-way Anova for Cultivar x Treatment applied to (A) germination %, (B) survival rate and (C) total germination index (Figure 4); Table S8: Post-hoc analysis (Figure 4).

Author Contributions

Conceptualization, A.I.; methodology, M.R. (Miglena Revalska), M.R. (Mariana Radkova) and A.I.; validation, M.R. (Miglena Revalska), M.R. (Mariana Radkova) and A.I.; formal analysis, M.R. (Miglena Revalska), M.R. (Mariana Radkova) and A.I.; investigation, M.R. (Miglena Revalska), M.R. (Mariana Radkova) and A.I.; writing—original draft preparation, A.I. and M.R. (Miglena Revalska); visualization A.I. and M.R. (Miglena Revalska). All authors have read and agreed to the published version of the manuscript.

Funding

This research is funded by two projects: “Legume Generation” ID 101081329, funded by European Commission and KP-06-H86/3 funded by Bulgarian National Science Fund.

Institutional Review Board Statement

Not applicable.

Data Availability Statement

The data presented in this study are available on request from the corresponding author.

Acknowledgments

The authors would like to thank the Amandine Gras from RAGT seeds and Małgorzata Niewińska from DANKO for the soybean seeds.

Conflicts of Interest

The authors declare no conflicts of interest.

Abbreviations

The following abbreviations are used in this manuscript:
dpgDays post-germination
PEGPolyethylene glycol
TGITotal germination index
G%Germination percentage
SRSurvival rate

References

  1. Ge, L.; Yu, J.; Wang, H.; Luth, D.; Bai, G.; Wang, K.; Chen, R. Increasing seed size and quality by manipulating BIG SEEDS1 in legume species. Proc. Natl. Acad. Sci. USA 2016, 113, 12414–12419. [Google Scholar] [CrossRef] [Scilit] [PubMed]
  2. Liu, S.; Zhang, M.; Feng, F.; Tian, Z. Toward a “green revolution” for soybean. Mol. Plant 2020, 3, 688–697. [Google Scholar] [CrossRef] [Scilit] [PubMed]
  3. Staniak, M.; Szpunar-Krok, E.; Kocira, A. Responses of Soybean to Selected Abiotic Stresses—Photoperiod, Temperature and Water. Agriculture 2023, 13, 146. [Google Scholar] [CrossRef] [Scilit]
  4. Chaves, M.M.; Oliveira, M.M. Mechanisms underlying plant resilience to water deficits: Prospects for water-saving agriculture. J. Exp. Bot. 2004, 407, 2365–2379. [Google Scholar] [CrossRef] [Scilit] [PubMed]
  5. Khan, M.A.; Asaf, S.; Khan, A.L.; Ullah, I.; Ali, S.; Kang, S.M.; Lee, I.J. Alleviation of salt stress response in soybean plants with the endophytic bacterial isolate Curtobacterium sp. SAK1. Ann. Microbiol. 2019, 69, 797–808. [Google Scholar] [CrossRef] [Scilit]
  6. Grainger, C.M.; Rajcan, I. Characterization of the genetic changes in a multi-generational pedigree of an elite Canadian soybean cultivar. Theor. Appl. Genet. 2013, 127, 211–229. [Google Scholar] [CrossRef] [Scilit] [PubMed]
  7. Mandic, V.; Ðordevic, S.; Ðordevic, N.; Bijelic, Z.; Krnjaja, V.; Petricevic, M.; Brankov, M. Genotype and Sowing Time effects on Soybean Yield and Quality. Agriculture 2020, 10, 502. [Google Scholar] [CrossRef] [Scilit]
  8. Zając, T.; Oleksy, A.; Ślizowska, A.; Śliwa, J.; Klimek-Kopyra, A.; Kulig, B. Aboveground dry biomass partitioning and nitrogen accumulation in early maturing soybean ‘Merlin’. Acta Agrobot. 2017, 70, 1728. [Google Scholar] [CrossRef] [Scilit]
  9. Naydenova, G.; Radkova, M.; Iantcheva, A. Moldovan soybean varieties testing in the condition of North Bulgaria. Bulg. J. Agric. Sci. 2022, 28, 299–304. [Google Scholar]
  10. Deshmukh, R.; Sonah, H.; Patil, G.; Chen, W.; Prince, S.; Mutava, R.; Vuong, T.; Valliyodan, B.; Nguyen, H.T. Integrating omic approaches for abiotic stress tolerance in soybean. Front. Plant Sci. 2014, 5, 244. [Google Scholar] [CrossRef] [Scilit] [PubMed]
  11. Zia, R.; Nawaz, M.S.; Siddique, M.J.; Hakim, S.; Imran, A. Plant survival under drought stress: Implications, adaptive responses, and integrated rhizosphere management strategy for stress mitigation. Microbiol. Res. 2021, 242, 126626. [Google Scholar] [CrossRef] [Scilit] [PubMed]
  12. Poudel, S.; Vennam, R.R.; Shrestha, A.; Reddy, K.R.; Wijewardane, N.K.; Reddy, K.N.; Bheemanahalli, R. Resilience of soybean cultivars to drought stress during flowering and early-seed setting stages. Sci. Rep. 2023, 13, 1277. [Google Scholar] [CrossRef] [Scilit] [PubMed]
  13. Devi, J.; Sinclair, T.; Chen, P.; Carter, T. Evaluation of elite southern maturity soybean breeding lines for drought-tolerant traits. Agron. J. 2014, 106, 1947–1954. [Google Scholar] [CrossRef] [Scilit]
  14. Arya, H.; Singh, M.B.; Bhalla, P.L. Towards developing drought-smart soybeans. Front. Plant Sci. 2021, 12, 750664. [Google Scholar] [CrossRef] [Scilit] [PubMed]
  15. Cotrim, M.F.; Gava, R.; Campos, C.N.S.; de David, C.H.O.; de Assis Reis, I.; Teodoro, L.P.R.; Teodoro, P.E. Physiological performance of soybean genotypes grown under irrigated and rainfed conditions. J. Agron. Crop Sci. 2021, 207, 34–43. [Google Scholar] [CrossRef] [Scilit]
  16. Wu, N.; Feng, Y.; Jiang, T.; Li, Z.; Liu, Y.; Yuan, M. Genome-wide study and expression analysis of soybean ERF transcription factors and overexpression of GmERF205 enhances drought resistance in soybean. BMC Genom. 2025, 26, 726. [Google Scholar] [CrossRef] [Scilit] [PubMed]
  17. Chai, C.; Wang, Y.; Valliyodan, B.; Nguyen, H.T. Comprehensive analysis of the soybean (Glycine max) GmLAX auxin transporter gene family. Front. Plant Sci. 2016, 9, 282. [Google Scholar] [CrossRef] [Scilit]
  18. Yang, H.; Guo, W.; Cao, D.; Chen, H.; Chen, S.; Yang, Z.; Shan, Z.; Chen, L.; Zhou, X. Expression pattern of GmLAX genes under different stresses in soybean drought sensitive cultivar and tolerant cultivar. Oil Crop Sci. 2021, 6, 58–65. [Google Scholar] [CrossRef] [Scilit]
  19. Gaxiola, R.A.; Li, J.; Undurraga, S.; Dang, L.M.; Allen, G.J.; Alper, S.L.; Fink, G.R. Drought and salt-tolerant plants result from overexpression of the AVP1 H+-pump. Proc. Natl. Acad. Sci. USA 2001, 98, 11444–11449. [Google Scholar] [CrossRef] [Scilit] [PubMed]
  20. Song, Y.; Li, F.; Ali, M.; Li, X.; Zhang, X.; Ahmed, Z.F.R. Advances in Protein Kinase Regulation of Stress Responses in Fruits and Vegetables. Int. J. Mol. Sci. 2025, 26, 768. [Google Scholar] [CrossRef] [Scilit] [PubMed]
  21. Azupio, S.; Wang, Y.; Obeng, J.; Issah, A.K.; Chu, J.; Zhang, H.; Xie, Q.; Jiang, X. Calcium-dependent protein kinases as central hubs in plant abiotic stress signaling: Mechanisms and prospects for crop improvement. Front. Plant Sci. 2026, 16, 1711405. [Google Scholar] [CrossRef] [Scilit] [PubMed]
  22. Shen, X.; Nan, H.; Jiang, Y.; Zhou, Y.; Pan, X. Genome-Wide Identification, Expression and Interaction Analysis of GmSnRK2 and Type A PP2C Genes in Response to Abscisic Acid Treatment and Drought Stress in Soybean Plant. Int. J. Mol. Sci. 2022, 23, 13166. [Google Scholar] [CrossRef] [Scilit] [PubMed]
  23. Radkova, M.; Revalska, M.; Iantcheva, A. Unraveling the Function of Stress Kinase in the Progeny of Soybean Plants Grown from Low-Temperature Pretreated Seeds. Agriculture 2024, 14, 1731. [Google Scholar] [CrossRef] [Scilit]
  24. Liu, Y.; Zhou, J.; Chen, Y.; Yang, X.; Jiao, S.; Zhang, H.; Ma, X.; Zhai, H.; Bai, X. GmSTK12 Participates in Salt Stress Resistance in Soybean. Agronomy 2023, 13, 613. [Google Scholar] [CrossRef] [Scilit]
  25. Iantcheva, A.; Dincheva, I.; Nedeva, R.; Naydenova, G.; Badjakov, I.; Radkova, M.; Revalska, M.; Apostolov, A. An innovative approach for assessment of Bulgarian soybean cultivars. Biotechnol. Biotechnol. Equip. 2021, 35, 1099–1117. [Google Scholar] [CrossRef] [Scilit]
  26. Naydenova, G.; Dincheva, I.; Badjakov, I.; Radkova, M.; Revalska, M.; Iantcheva, A. Long-lasting low temperature pretreatment of soybean seeds enhance plant field performance and content of free metabolites. Bulg. J. Agric. Sci. 2022, 28, 1063–1074. [Google Scholar]
  27. Revalska, M.; Radkova, M.; Zhiponova, M.; Vassileva, V.; Iantcheva, A. Functional genomics of legumes in Bulgaria—Advances and future perspectives. Genes 2025, 16, 296. [Google Scholar] [CrossRef] [Scilit] [PubMed]
  28. Andrew, S.M.; Kombo, S.A.; Chamshama, S.A.O. Germination and seedling growth of Entandrophragma bussei harms ex engl. from wild populations. In Vegetation Index and Dynamics; IntechOpen: London, UK, 2021; pp. 177–192. [Google Scholar] [CrossRef] [Scilit]
  29. Czabator, F.J. Germination Value: An Index Combining Speed and Completeness of Pine Seed Germination. For. Sci. 1962, 8, 386–396. [Google Scholar] [CrossRef] [Scilit]
  30. Ranal, M.A.; Santana, D.G. How and Why to Measure the Germination Process? Rev. Bras. Botânica 2006, 29, 1–11. [Google Scholar] [CrossRef] [Scilit]
  31. Van Bel, M.; Silvestri, F.; Weitz, E.M.; Kreft, L.; Botzki, A.; Coppens, F.; Vandepoele, K. PLAZA 5.0: Extending the scope and power of comparative and functional genomics in plants. Nucleic Acids Res. 2022, 50, D1468–D1474. [Google Scholar] [CrossRef] [Scilit] [PubMed]
  32. Ma, S.; Wang, Z.; Miao, J.; Liu, Z.; Zhang, X.; Hu, J.; Sun, G. Validation of reference genes for real-time quantitative PCR and expression patterns of GmWRI1 in soybean. PLoS ONE 2013, 8, e60740. [Google Scholar] [CrossRef] [Scilit] [PubMed]
  33. Zhu, J.-H.; Xu, J.; Chang, W.-J.; Zhang, Z.-L. Isolation and Molecular Characterization of 1-Aminocyclopropane-1-carboxylic Acid Synthase Genes in Hevea brasiliensis. Int. J. Mol. Sci. 2015, 16, 4136–4149. [Google Scholar] [CrossRef] [Scilit] [PubMed]
  34. Hellemans, J.; Mortier, G.; De Paepe, A.; Speleman, F.; Vandesompele, J. qBase relative quantification framework and software for management and automated analysis of real-time quantitative PCR data. Genome Biol. 2007, 8, R19. [Google Scholar] [CrossRef] [Scilit] [PubMed]
  35. Bashir, K.; Matsui, A.; Rasheed, S.; Seki, M. Recent Advances in the Characterization of Plant Transcriptomes in Response to Drought, Salinity, Heat, and Cold Stress. F1000Research 2019, 8, 658. [Google Scholar] [CrossRef] [Scilit] [PubMed]
  36. Brás, T.A.; Seixas, J.; Carvalhais, N.; Jägermeyr, J. Severity of Drought and Heatwave Crop Losses Tripled over the Last Five Decades in Europe. Environ. Res. Lett. 2021, 16, 065012. [Google Scholar] [CrossRef] [Scilit]
  37. Alharby, H.F.; Hasanuzzaman, M.; Al-Zahrani, H.S.; Hakeem, K.R. Exogenous selenium mitigates salt stress in soybean by improving growth, physiology, glutathione homeostasis and antioxidant defense. Phyton-Int. J. Exp. Bot. 2021, 90, 373–388. [Google Scholar] [CrossRef] [Scilit]
  38. Schilling, R.K.; Tester, M.; Marschner, P.; Plett, D.C.; Roy, S.J. AVP1: One Protein, Many Roles. Trends Plant Sci. 2017, 22, 154–162. [Google Scholar] [CrossRef] [Scilit] [PubMed]
  39. Bhaskaran, S.; Savithramma, D.L. Co-expression of Pennisetum glaucum vacuolar Na+/H+ antiporter and Arabidopsis H+-pyrophosphatase enhances salt tolerance in transgenic tomato. J. Exp. Bot. 2011, 62, 5561–5570. [Google Scholar] [CrossRef] [Scilit] [PubMed]
  40. Inupakutika, M.; Devireddy, A.R.; Willmon, D.; Puppala, N.; Cho, Y. Genome-wide comparative analysis of genes encoding core components of ABA signaling pathway in legume family. Int. J. Comput. Bioinform. Silico Model. 2016, 5, 828–843. [Google Scholar]
  41. Shukla, V.; Mattoo, A.K. Sucrose non-fermenting 1-related protein kinase 2 (SnRK2): A family of protein kinases involved in hyperosmotic stress signaling. Physiol. Mol. Biol. Plants 2008, 14, 91–100. [Google Scholar] [CrossRef] [Scilit] [PubMed]
  42. Revalska, M.; Zehirov, G.; Vassileva, V.; Iantcheva, A. Is the auxin influx carrier LAX3 essential for plant growth and development in the model plants Medicago truncatula, Lotus japonicas and Arabidopsis thaliana? Biotechnol. Biotechnol. Equip. 2015, 29, 786–797. [Google Scholar] [CrossRef] [Scilit]
  43. Yang, Y.; Wang, J.; Xu, Y.; Abbas, F.; Xu, D.; Tao, S.; Xie, X.; Song, F.; Huang, Q.; Sharma, A.; et al. Genome-wide identification and expression analysis of AUX/LAX family genes in Chinese hickory (Carya cathayensis Sarg.) Under various abiotic stresses and grafting. Front. Plant Sci. 2023, 13, 1060965. [Google Scholar] [CrossRef] [Scilit] [PubMed]
  44. Zhang, Z.; Wang, X.; Guan, X.; Li, Y.; Peng, Z.; Li, G.; Jiang, F.; Chen, Q.; Feng, F.; Liu, P. Identification of Specific Long-Lived mRNAs Associated with Seed Longevity in Sweet Corn Based on RNA-seq. Agronomy 2026, 16, 375. [Google Scholar] [CrossRef] [Scilit]
  45. Rauf, M.; Shahzad, K.; Habib, I.; Alharthi, B.; Fiaz, S.; Kanwal, M.; Ahmed, M.; Ali, R.; Berkowitz, G.A.; Ali, A.; et al. Overexpression of Leptochloa fusca H+-pyrophosphatase (LfVP1) gene improves salinity and drought tolerance in tobacco. GM Crops Food 2025, 16, 575–590. [Google Scholar] [CrossRef] [Scilit] [PubMed]
  46. Jia, H.; Sun, B.; Jiang, B.; Wang, P.; Naser, M.; Qian, S.; Wang, L.; Zhang, L.; Sinegovskii, M.; Sun, S.; et al. Natural Variations in Key Maturity Genes Underpin Soybean Cultivars Adaptation Beyond 50° N in Northeast China. Int. J. Mol. Sci. 2025, 26, 3362. [Google Scholar] [CrossRef] [Scilit] [PubMed]
  47. de Nadal, E.; Posas, F. Osmostress-induced gene expression--a model to understand how stress-activated protein kinases (SAPKs) regulate transcription. FEBS J. 2015, 282, 3275–3285. [Google Scholar] [CrossRef] [Scilit] [PubMed]
  48. El-Katony, T.M.; Hassan, N.M.; Abo-Ismael, S.H.; Abdelfatah, S.N. NaCl salt stress and PEG water stress differentially affect germination and early seedling growth of two sesame (Sesamum indicum L.) cultivars. Discov. Life 2024, 54, 20. [Google Scholar] [CrossRef] [Scilit]
  49. Hasanuzzaman, M.; Fujita, M. Plant Responses and Tolerance to Salt Stress: Physiological and Molecular Interventions. Int. J. Mol. Sci. 2022, 23, 4810. [Google Scholar] [CrossRef] [Scilit] [PubMed]
  50. Lei, C.; Bagavathiannan, M.; Wang, H.; Sharpe, S.M.; Meng, W.; Yu, J. Osmopriming with Polyethylene Glycol (PEG) for Abiotic Stress Tolerance in Germinating Crop Seeds: A Review. Agronomy 2021, 11, 2194. [Google Scholar] [CrossRef] [Scilit]
  51. Goswami, A.; Banerjee, R.; Raha, S. Drought resistance in rice seedlings conferred by seed priming. Protoplasma 2013, 250, 1115–1129. [Google Scholar] [CrossRef] [Scilit] [PubMed]
  52. Rashidi, M.; Yadegari, M. The effect of salinity and drought stress on seed germination, seedling growth and biochemical changes in marigold. Adv. Environ. Biol. 2014, 8, 510–515. [Google Scholar]
  53. Hernández-Andrade, E.E.; Montoya-García, C.O.; Gómez-Merino, F.C.; Trejo-Téllez, L.I. Salinity Tolerance, Plant Growth, and Nutrient Partitioning in Three Mexican Huauzontle (Chenopodium berlandieri subsp. nuttalliae) Genotypes Under NaCl Stress. Crops 2026, 6, 43. [Google Scholar] [CrossRef] [Scilit]
  54. Hichri, I.; Muhovski, Y.; Žižková, E.; Dobrev, P.I.; Gharbi, E.; Franco-Zorrilla, J.M.; Lopez-Vidriero, I.; Solano, R.; Clippe, A.; Errachid, A.; et al. The Solanum lycopersicum WRKY3 Transcription Factor SlWRKY3 Is Involved in Salt Stress Tolerance in Tomato. Front. Plant Sci. 2017, 8, 1343. [Google Scholar] [CrossRef] [Scilit] [PubMed]
  55. Dong, T.; Yan, L.; Wang, J.; Niu, Y.; Wang, L. Salt Tolerance in Soybean (Glycine max L.): A Comprehensive Review of Molecular Mechanisms, Key Regulators, and Future Perspectives for Saline Soil Utilization. Plants 2025, 14, 3668. [Google Scholar] [CrossRef] [Scilit] [PubMed]
  56. Lu, P.; Dai, S.Y.; Yong, L.T.; Zhou, B.H.; Wang, N.; Dong, Y.Y.; Liu, W.C.; Wangm, F.W.; Yang, H.Y.; Li, X.W. A Soybean Sucrose Non-Fermenting Protein Kinase 1 Gene, GmSNF1, Positively Regulates Plant Response to Salt and Salt-Alkali Stress in Transgenic Plants. Int. J. Mol. Sci. 2023, 24, 12482. [Google Scholar] [CrossRef] [Scilit] [PubMed]
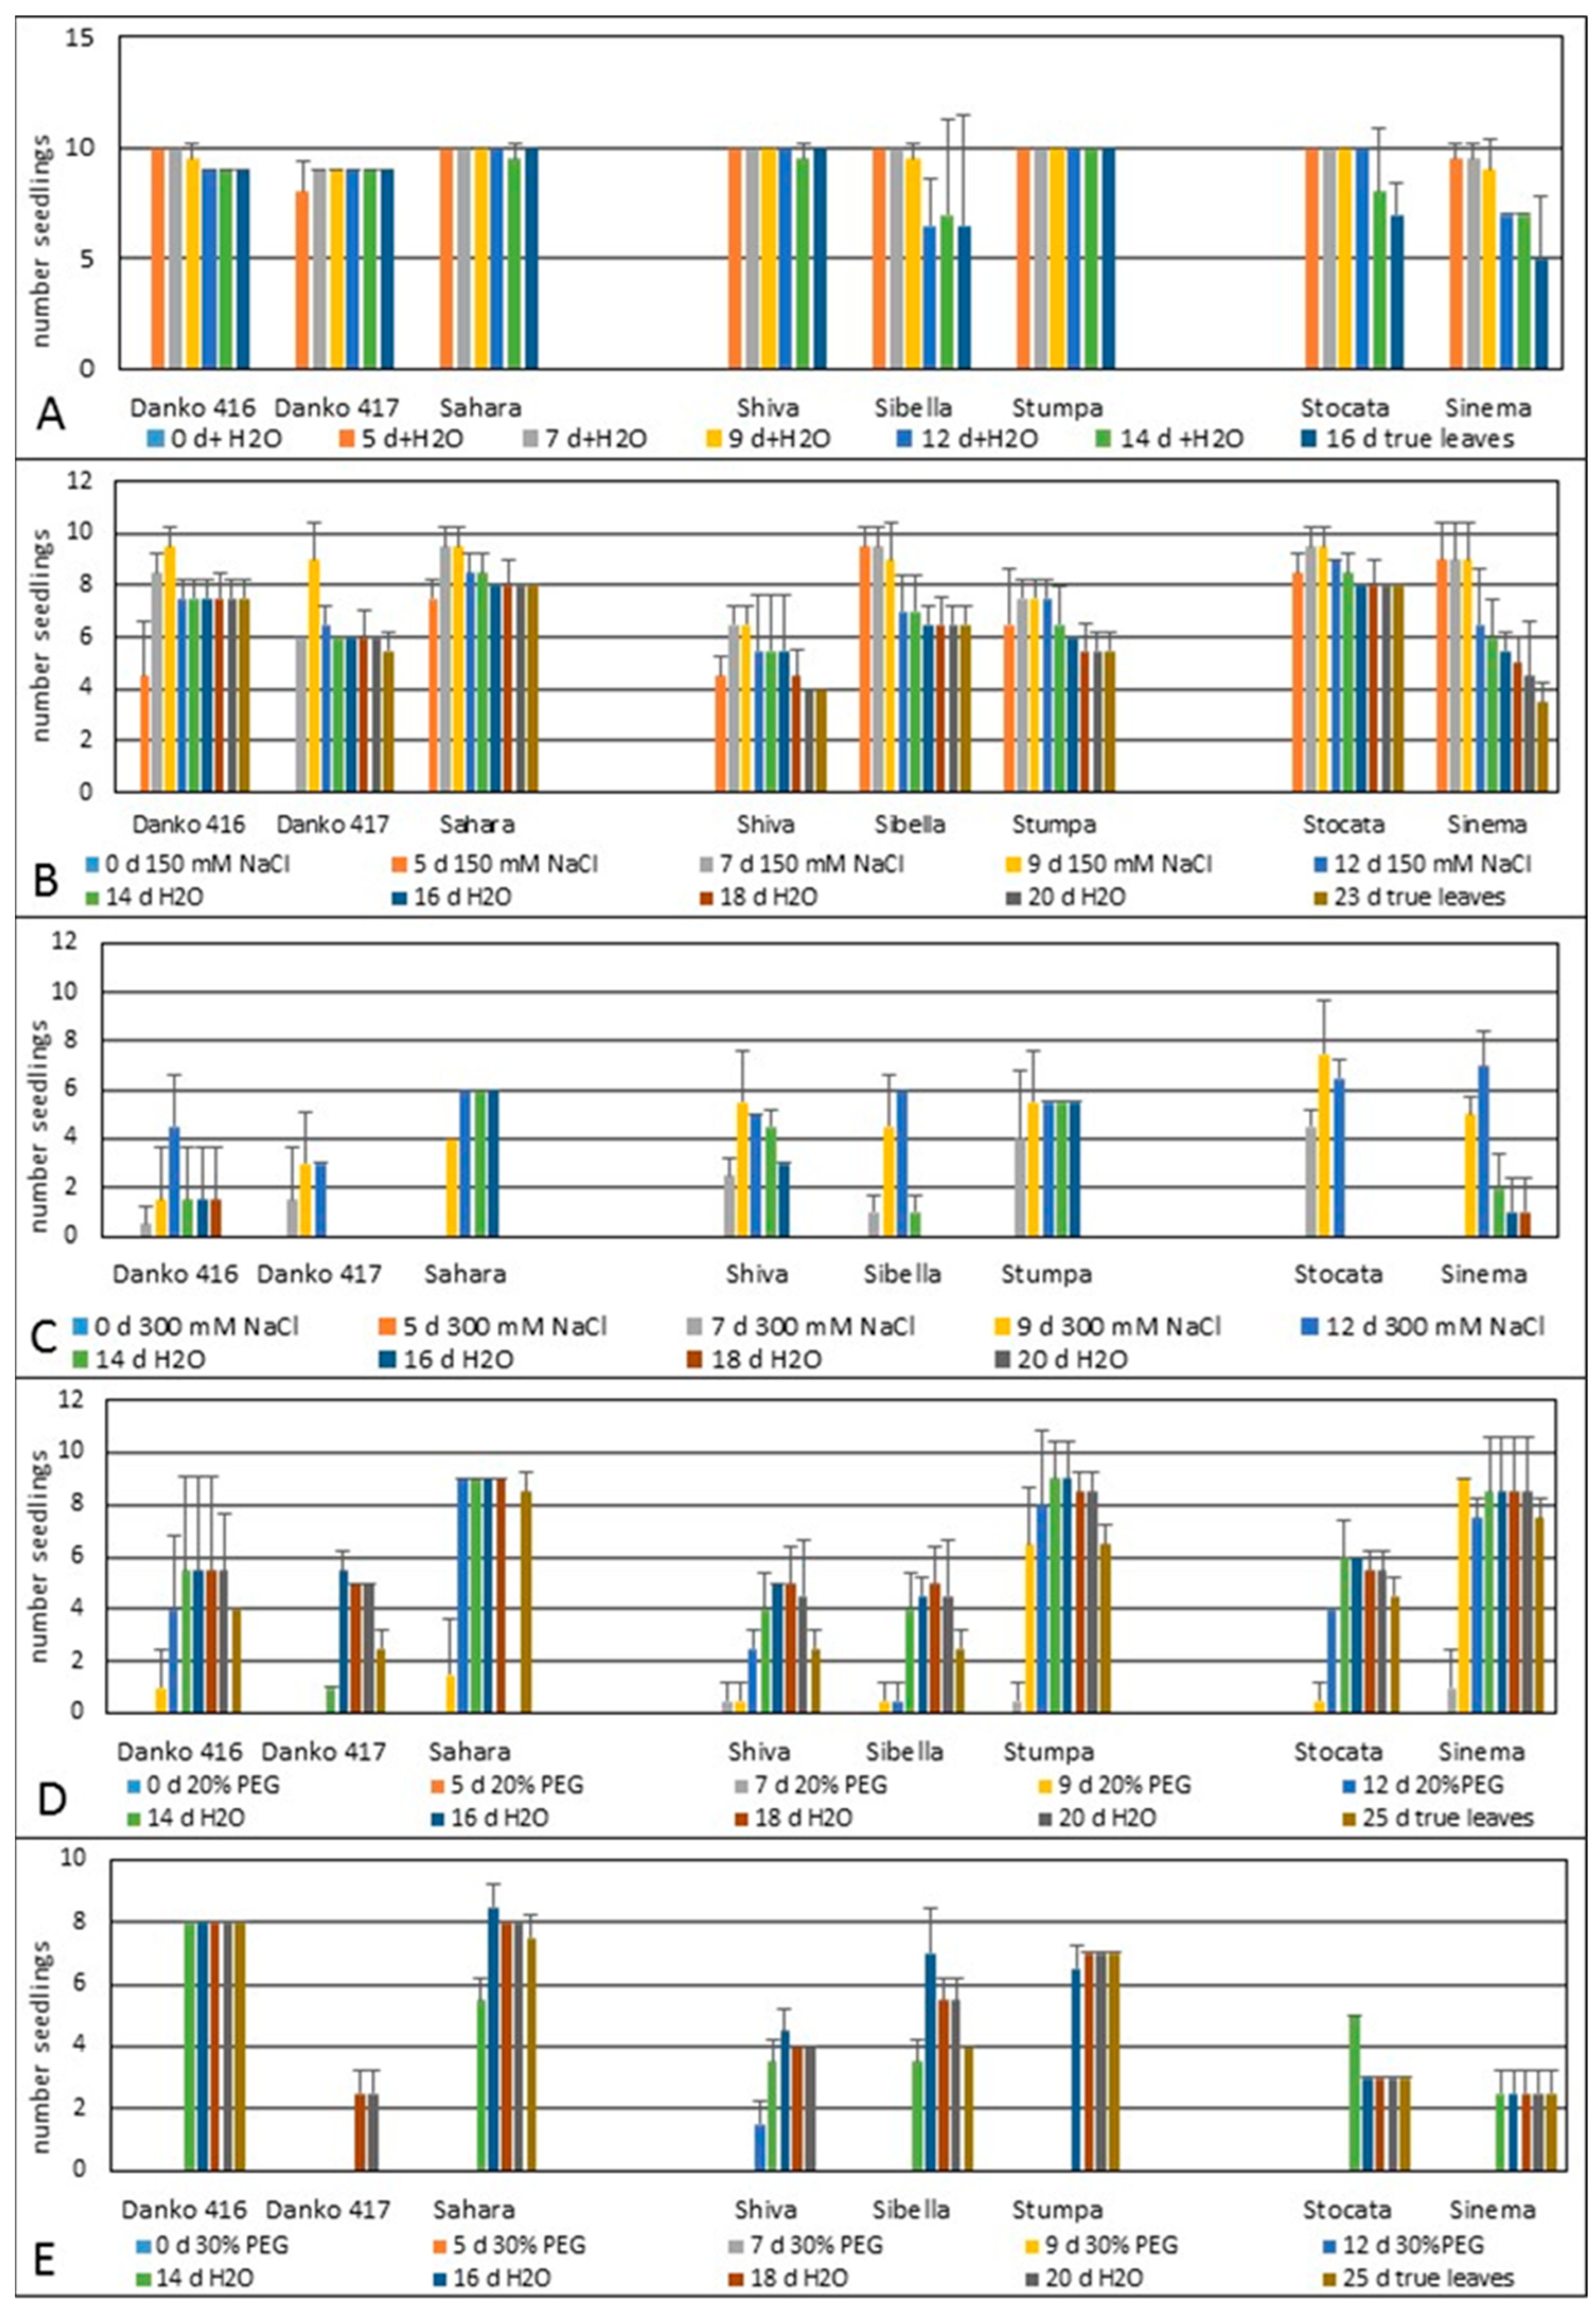
Figure 1. Germination dynamics and early seedling development of eight soybean cultivars from different maturity groups under different concentrations of salt and drought stress. (A) Control (H2O); (B,C) salt stress (150 mM and 300 mM NaCl); (D,E) drought stress (20% and 30% PEG). Data present mean number of seedlings ± SD.
Crops 06 00057 g001
Figure 2. Relative transcript level measured in leaves from the first true leaf pair in cvs. from three maturity groups. (A) Control (H2O); (B) salt stress (150 mM); (C,D) drought stress (20% and 30% PEG). Data present mean transcript level ±SE. Asterisks denote a statistically significant difference * p ≤ 0.05, ** p ≤ 0.01. Bar colors indicate maturity group: green—maturity group 000; orange—00; purple—0-I.
Crops 06 00057 g002
Figure 3. Germination dynamics of (A) Richy and (B) Isidor cultivars under abiotic stress conditions. Legend: K0—control; 150 mM—treatment with moderate salt concentration; 300 mM—treatment with severe salt concentration; 20% PEG—drought stress treatment; DPG—days post-germination. Data are presented as means ± SD (n = 3).
Crops 06 00057 g003
Figure 4. Comparative analysis of (A) final germination percentage, (B) seedling survival rate and (C) total germination index for soybean cultivars Richy and Isidor under salinity (NaCl) and drought (PEG) stress at 21 dpg. Values represent the mean ± SD (n = 3). Asterisks (*) indicate significant differences between cultivars at the same time point according to Student’s t-test: (*)—p ≤ 0.05; (**)—p ≤ 0.01; (***)—p ≤ 0.001.
Crops 06 00057 g004
Figure 5. Comparative relative expression profiles of LAX6, H+-PP-ase and StrK2 genes in soybean (Glycine max) cultivars Richy and Isidor under salinity and osmotic stress. (AC) Gene expression levels in cv. Richy for LAX6, H+-PP-ase, and StrK2, respectively; (DF) gene expression levels in cv. Isidor for LAX6, H+-PP-ase, and StrK2, respectively. Legend: K0—control; 150 mM—treatment with moderate salt concentration; 300 mM—treatment with severe salt concentration; 20% PEG—drought stress. Values represent the mean ±SD (n = 2). Asterisks indicate significant differences according to Student’s t-test: (*)—p ≤ 0.01; (**)—p ≤ 0.001; (***)—p ≤ 0.0001.
Crops 06 00057 g005
Disclaimer/Publisher’s Note: The statements, opinions and data contained in all publications are solely those of the individual author(s) and contributor(s) and not of MDPI and/or the editor(s). MDPI and/or the editor(s) disclaim responsibility for any injury to people or property resulting from any ideas, methods, instructions or products referred to in the content.