Article

Estimating the Vulnerability to Hydrometeorological Phenomena in Mexican Coffee Crops


by
Ofelia Andrea Valdés-Rodríguez
1 and
Fernando Salas-Martínez
2,*
1
El Colegio de Veracruz, Xalapa 9100, Veracruz, Mexico
2
Área Académica de Química, Instituto de Ciencias Básicas e Ingeniería, Universidad Autónoma del Estado de Hidalgo, Carr. Pachuca-Tulancingo km. 4.5, Mineral de la Reforma 42184, Hidalgo, Mexico
*
Author to whom correspondence should be addressed.
Crops 2026, 6(3), 50; https://doi.org/10.3390/crops6030050
Submission received: 31 January 2026 / Revised: 3 April 2026 / Accepted: 28 April 2026 / Published: 5 May 2026

Abstract

Coffee plantations are highly vulnerable to climatic factors. In this regard, the vulnerability of coffee agroecosystems to extreme hydrometeorological events has been underexplored. This research proposes a method to assess coffee plantations’ vulnerability to five phenomena that have led to disaster declarations in the municipalities where they are cultivated: extreme rainfall, tropical cyclones, floods, snow and low temperatures, and drought. This study considered coffee production, local climate information, hydrometeorological records, and environmental protection actions, spanning 22 years in the eastern state of Veracruz, Mexico. All data were normalized and evaluated for three production values: harvested area ratio, yield, and volume. The Exposition accounted for the number of events, correlating production data with phenomena to assess sensitivity, while the adaptive capacity was assessed by considering environmental protection actions. The results indicated that the most frequent phenomena were extreme rainfall, followed by tropical cyclones, snow and low temperatures, droughts, and floods. However, tropical cyclones accounted for the highest number of vulnerabilities, and drought caused the highest level of vulnerabilities. Snow and cold temperatures reduced vulnerabilities, and floods have non-statistical effects. In general, coffee agroecosystems have a low vulnerability index (6.21 on a scale of 15) due to their location within the local forest.

1. Introduction

Coffee is a worldwide drink made from the toasted seeds of the Coffea plant (mainly Coffea arabica L. and Coffea canephora, also known as Robusta). According to the International Coffee Organization (ICO), by May 2025, the 42 associated country members’ global coffee exports had totaled 12.65 million 60 kg bags. Mexico, considered part of the Central America and Mexico region, is one of the member countries. However, the last statistics indicate that Mexico has reported a decrease in its exports, with a net loss of 0.1 million bags [1]. The Mexican Agrifood system (SIAP) indicates that in 2024, harvested production totaled 1,056,317.46 tons. In this country, the state of Veracruz ranks second in national coffee production, with an average of 256,460.37 tons over a surface area of 145,187.6 ha [2]. According to the last reports, in Veracruz, most coffee plants belong to the species Coffea arabica [3], and the areas where coffee grows typically constitute forested agroecosystems with introduced and native multispecies, where the plants receive natural shade [4].
However, the geographic location of Veracruz in the eastern side of the country, along the Gulf of Mexico’s coast, places this region at risk of several climatic and hydrometeorological phenomena, such as frosts, snowfalls, hailstorms, low temperatures, droughts, tropical cyclones, and excessive rainfall, which may cause floods and landslides [5]. Therefore, coffee plantations in the region are exposed to these phenomena.
In addition to these events, the species Coffea arabica [6] is more vulnerable than Coffea canephora to adverse climatic conditions, pests, and diseases reported in the state [3]. Another critical component of this situation is that the available coffee plant breeding programs have focused mainly on developing coffee genotypes with higher yields and greater resistance to pests and diseases. However, they were not intended to produce genotypes adapted to the new environmental conditions resulting from climate change [7] or the strong hydrometeorological phenomena that may be experienced by a region, such as the territory of Veracruz.
Therefore, the vulnerability of eastern Mexican coffee agroecosystems needs to be redefined in light of the region’s current hydrometeorological conditions. Some studies on vulnerability in coffee plantations use precipitation data as the primary factor in their estimates [8], as well as drought, heat, and light stress [7], or water supply and temperature stress [9]. In contrast, one analyzed two phenomena (tropical cyclones and drought) in Central America over only two years [9], and another studied only floods and landslides in Indonesia [10]. However, none of them consider a wider range of hydrometeorological phenomena in their analyses. Nevertheless, hydrometeorological phenomena in the Veracruz territory have the highest historical frequency in the country [11]. Previous studies have documented that hydrometeorological phenomena can cause significant losses to some regional crops, with a 20-year record of accumulated costs totaling millions of dollars for pineapple and sugarcane and in the thousands for corn, lemon, and coffee [12].
For coffee agroecosystems in the state of Veracruz, this type of vulnerability assessment has not yet been conducted. This state has a territory of 71,823 km2, spanning five parallels. In this territory, there are seven mountain systems with altitudinal sites ranging from 0 m above sea level (masl) to 5610 masl, and 10 distinct climates are recorded [13]. Therefore, vulnerability to additional hydrometeorological events should be considered when modeling the behavior of coffee agroecosystems under climatic hazards.
In this regard, this research considers definitions provided by the Intergovernmental Panel on Climate Change (IPCC) [14], which describes vulnerability as the propensity or predisposition to be adversely affected by climate-related hazards. Under this definition, vulnerability is an internal property of a system composed of three main elements:
(1) The Exposition, which is described as the number of hazards or hydrometeorological events that the site registers during a period of time.
(2) The Sensitivity, described as the degree to which a system (people, ecosystems, or assets) is affected, either negatively or positively, by climate variability or change.
(3) The Adaptive capacity, described as the process of adjustment to actual or expected climate and its effects to moderate harm or exploit beneficial opportunities.
Since the state of Veracruz records dozens of hydrometeorological events each year [11], the magnitude of these events must be evaluated before they are included in any analysis. This research considered only extreme events that cause notable effects in the areas they impact as its first selection criterion. In Mexico, hydrometeorological phenomena that cause damage to inhabitants, infrastructure, and local livelihoods, such as crop and cattle losses that require governmental support, are considered hydrometeorological disasters and are recorded by the Mexican Center of Disaster Prevention [15]. Therefore, in this research, this hydrometeorological disaster database will serve as the primary tool for evaluating vulnerability in coffee plantations.
Under these circumstances, a strategy to evaluate the vulnerability of local coffee crops will provide an essential tool for determining the effects of extreme hydrometeorological phenomena and the capabilities to face them on the performance of this valuable product.
Therefore, this study aims to present a new approach to estimate the vulnerability of local production data (harvested area ratio, yield, and production volume) from coffee plantations in the state of Veracruz by implementing an index that accounts for their exposure, sensitivity, and adaptive capacity to hydrometeorological events recorded in the region.

2. Materials and Methods

2.1. Study Area Description

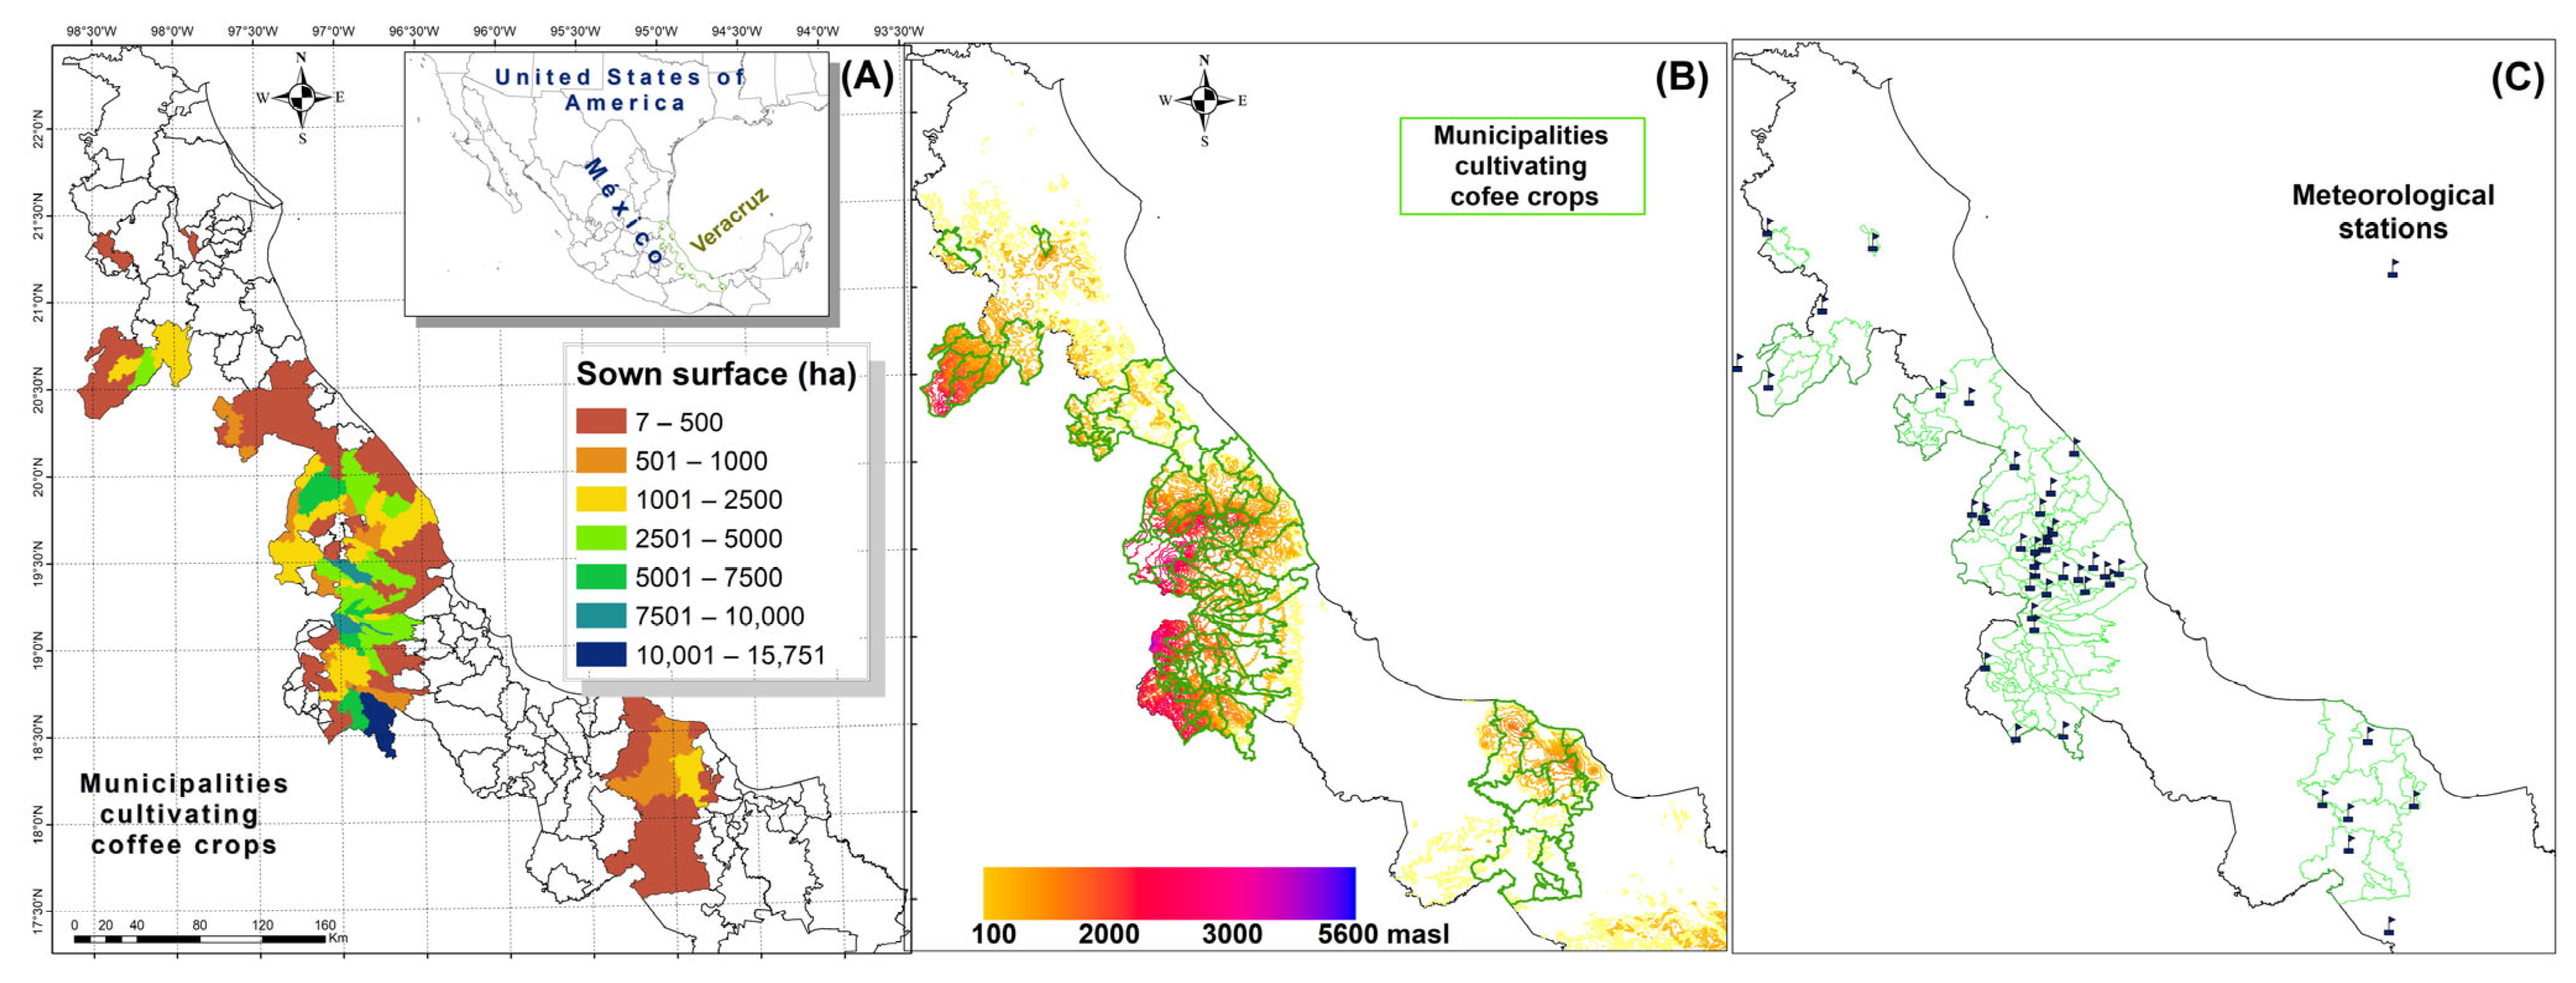
The study area is situated between latitudes 22°28′18” N and 17°08′13″ N and longitudes 93°36′29″ W and 98°40′54″ W. The region spans approximately 71,823.5 km2, and the state is divided into 212 municipalities [13]. In these municipalities, 106 cultivate coffee (Figure 1A) on a total area of 145,187 ha [2]. Most municipalities that cultivate coffee are located between 100 and 2000 masl (Figure 1B). The climates in the municipalities range from warm-humid to temperate-humid, and from warm-subhumid to temperate-subhumid [16]. According to local researchers, the coffee species cultivated in this region is Coffea arabica, with a mix of the Typica, Bourbon, Mundo Novo, Garnica, Costa Rica, Colombia, and Caturra varieties, documented in the central and southern areas of the state. However, there is no specific information on the location of each variety, as they are usually separated by plots within the same productive plantation [6,17,18,19,20].

2.2. Databases Used for the Study

Extreme hydrometeorological phenomena causing severe damage to the municipalities were obtained from the Mexican Disaster Prevention Center (CENAPRED) [15], which has been providing data for each site since 2000. Phenomena that cause disasters to inhabitants, infrastructure, or agrifood systems trigger a disaster declaration (DD), which the municipal government issues to request economic support from the national authorities to recover from the damage. This database was used because it contains information about the type of meteorological phenomena causing the disaster and because the disaster declaration is authorized by experts in meteorology, civil protection, and specialists from the CENAPRED, who verify the correct location, existence, and magnitude of the damage caused by the phenomenon to allow the DD [21], as detailed in Appendix A.
Meteorological information, such as temperature and precipitation, was obtained from the Mexican National Meteorological Service [22] at available sites (Figure 1C).
The cartographic information, including the locations of municipalities, soil use, soil type, and vegetation type, was downloaded from the Mexican National Institute of Geography and Statistics (INEGI) [23]. This information was used to discuss the results of the vulnerability assessments in relation to the sites’ natural conditions. The last National Agricultural Census was consulted to obtain percentages of damage to regional crops caused by hydrometeorological phenomena [24], which were then compared with the obtained vulnerabilities.
Coffee production data were obtained from the Mexican Agrifood System [2], which provides surface-sown, surface-harvested, yield, and volume data by year and municipality since 2003 up to 2024. In this study, the ratio of surface-sown to surface-harvested is treated as the harvested area ratio.

2.3. Phenological Information

The phenological information on coffee development was taken from a local research study that explains vegetative growth and fruit production throughout the year [3,20], and these data were corroborated with information from the National Agrifood System [25]. With this approach, it was possible to compare meteorological information and hydrometeorological phenomena with coffee production stages.

2.4. Data Processing

2.4.1. Meteorological Information

The selection of meteorological stations was based on having data available from 1990 to 2024 to derive their climatology, using the 30 years considered acceptable by the World Meteorological Organization [26]. Four hundred sixty-nine meteorological stations were located in the study region. Additionally, seven stations were added to the database to improve the interpolation of temperature and precipitation (Figure 1C). However, only 67 stations were operational during the analysis period, and among these, 35 lacked data after 2000, leaving only 35 stations with available data for the study period (1990–2023). Data from meteorological stations within municipalities were analyzed to estimate average maximum and minimum temperatures and accumulated precipitation by month. To determine extreme events, maximum and minimum values were also calculated. The Sen’s slope was estimated to assess time-dependent changes in temperature and precipitation at each station. These data were processed by scripts developed under the RStudio 2025.05.1 environment. The interpolation of temperature and precipitation points in the study area was performed with the Spline with barriers function of ArcGIS 10.8.
Figure 1. Location of the study region. (A) Municipalities cultivating coffee and the location of the available meteorological stations. (B) Altitudinal variation in the study region. (C) Location of the available meteorological stations. Source: elaborated by the authors with data from INEGI [27], SMN [22], and SIAP [2].
Crops 06 00050 g001

2.4.2. Disaster Declarations

In this research, the following main phenomena affecting the study region were considered: tropical cyclones, extreme rainfall, floods, cold temperatures, frost, snow, hailstorms, drought, and extreme temperatures. The definition of each specific phenomenon is provided in Appendix A.
For the record, disaster declarations for cold temperatures, frost, snow, and hailstorms were combined into a single event, snow and cold temperature, since cold weather was considered the leading cause of the disaster (Appendix A). Drought and extremely high temperatures were also grouped because high temperatures were recorded only in 2019 in municipalities with drought declarations. Disaster Declarations due to strong winds were excluded because such events occurred in only 4 of the 21 years in the study period [11]. Therefore, this study considered five grouped hydrometeorological phenomena: extreme rainfall, tropical cyclones, floods, snow and low temperatures, and droughts.

2.4.3. Correlations Between Productivity Data and Hydrometeorological Phenomena

For each municipality, the yearly harvested area ratio, production yield (tons ha−1), and volume (tons) were correlated with each Disaster Declaration reported on the site by year. Before the correlation analysis, the data sets were assessed for normality using the Shapiro–Wilk test, which indicated that 100% of the Disaster Declaration data were not normally distributed (p < 0.05). Therefore, the Spearman rank-order test was applied to determine correlations between productivity data and Disaster Declarations, with significance set at 0.05. These functions were implemented in RStudio 2025.05.1.

2.4.4. Estimating the Vulnerability of the Coffee Crops by Municipality

According to the IPCC vulnerability elements [28], for coffee agroecosystems, we propose that:
Exposition can be summarized as the hydrometeorological phenomena the municipality experiences. This approach was also used in previous works that considered exposure to specific meteorological events, such as drought, hurricanes, excessive precipitation, and extreme temperatures [9], as well as extreme temperatures and frost [29] and floods [10], to determine vulnerability in coffee plantations.
Sensitivity can be measured as the correlation between phenomena at the site and their production values, since a previous study used this correlation to integrate a measure of the system’s sensitivity in coffee farms [9].
Adaptive capacity can be defined as the actions implemented by production units to achieve environmental benefits. This approach is considered in the IPCC’s recommendations for policymakers [30].
Therefore, our approach estimates vulnerability as a function of exposure, sensitivity, and adaptive capacity, as shown in Equation (1).
Vulnerability = Exposition + SensitivityAdaptive capacity
Since there are several approximations to determine vulnerability, we chose an additive rather than a multiplicative frame because we observed values close to zero in several municipalities and hydrometeorological event counts, which, in a multiplicative approach, would yield values close to zero (lower vulnerability) or higher (greater vulnerability) [31].
For the Exposition, we considered the number of hydrometeorological phenomena affecting each municipality and normalized the data using Equation (2).
HP = A n A t ϵ 0 ,   1
where HP is the normalized hydrometeorological phenomenon, An is the number of phenomena, and At is the maximum value of the phenomena in the region.
For the Sensitivity, we estimated the correlation between production data and hydrometeorological phenomena affecting each municipality. This approach was considered because a negative correlation between each phenomenon and the site’s production data would indicate the site’s sensitivity to that phenomenon. Therefore, only the negative correlations were considered in the model (Equation (3)):
ρ H P =   max 0 , ρ ϵ 0 ,   1
where ρ represents the Spearman rank correlation for each hydrometeorological phenomenon and productive data, ranging from 0 to −1.
Adaptive capacity was obtained from the National Agricultural Statistical System [24], which provided municipal-level data and percentages of actions performed for environmental protection relative to the total number of agricultural productive units at the site until 2022. This method considers only the social aspects of adaptive capacity as a first approximation, as there is no specific information on cultivars in the 106 municipalities studied. There, we assume agricultural activities to protect the environment may benefit their regions. The adaptive capacity can be defined as in Equation (4):
AC   =   N u m b e r   o f   a g r i c u l t u r a l   u n i t s   i m p l e m e n t i n g   e n v i r o n m e n t a l   a c t i o n s T o t a l   n u m b e r   o f   a g r i c u l t u r a l   u n i t s
The total vulnerability by municipality and hydrometeorological phenomenon is represented as Equation (5):
Vt = HP + ρ HP AC
Establishing a framework for adaptive capacity requires in situ collection of information from coffee farms and local conditions, as previous work with coffee producers in this region has found [32,33]. In this research, we propose a broader analysis of 106 municipalities; therefore, we used the latest census from the National Agricultural Statistical System [21], which provided municipal-level data and percentages of actions taken for environmental protection relative to the total number of agricultural productive units at each site, up to 2022. The previous 2007 census did not provide the same information; thus, we assume that these past activities have increased local producers’ capacity to withstand hydrometeorological phenomena. The adaptive capacity was defined as the average percentage of these actions (Equation (6)):
AC =   ( E E C + R W C + P L F + F P + M P D + D P F + O A ) 7 ϵ 0 ,   1
EEC represents electric energy reduction; RWC represents reduction of water consumption; PLF represents planting living fences to control erosion; FP represents prevention of fires; MPD represents monitoring pests and diseases; DPF represents proper disposal of pesticides; and OA represents other actions for the environment that are not explained in the census. We assigned the same value to each activity because there is still no prior evaluation of these activities and their impacts on coffee crops in the study area. Other authors estimating vulnerability in the agricultural sector have also proposed a first approach that can be tested in future research to improve the approximation [34], while others consider soil erosion and infrastructure by municipality [35]; however, coffee plantations in Veracruz are located under shade polycultures [4,19], where soil erosion is not the same as in other agricultural lands.
The total vulnerability by municipality and hydrometeorological phenomenon is represented by Equation (7):
Vt = HP + abs ( ρ HP )     AC                                                         ϵ 0 ,   2
The maximum vulnerability will occur when the municipality has the highest exposure to the hydrometeorological event, reports the strongest negative correlation between the event and productive values, and has no reported environmental protection actions. The lowest vulnerability will occur when there is no exposure, when the correlation between the phenomenon and productive values is not negative, or when the adaptive capacities are higher than the Exposition and the Sensitivity values.
Equation (6) will allow us to identify the municipality with the highest vulnerability to one specific hydrometeorological phenomenon recorded in the study region.
Since we are only focusing on positive vulnerabilities, the final vulnerability by phenomenon and productive value can be represented as indicated in Equation (8):
F ( Vt )   =   V t     i f   V t > 0 0   i f   V t 0
The total vulnerability can be estimated as the sum of each vulnerability by event and productive values.
VT = n = 1 5 V h p n A + n = 1 5 V h p n Y + n = 1 5 V h p n V
where n represents the number of phenomena, A represents the harvested area ratio, Y represents the yield, and V represents the production volume. Since the data were normalized to 1, the maximum value is 15.0, and the minimum is 0.0. Equation (9) will allow us to identify the municipality with the highest vulnerability to hydrometeorological phenomena recorded in the study region.

2.4.5. Statistical Validation of the Resulting Vulnerabilities by Phenomenon

To ensure the reliability and consistency of the results across the three production dimensions (harvested area ratio, production yield, and volume), the following statistical tests were performed: (1) Spearman’s rank correlation: since the data are normalized and may not follow a normal distribution, Spearman’s non-parametric test is used to measure the monotonic relationship between the calculated vulnerability and the hydrometeorological phenomena. A high positive correlation indicates that the equation correctly scales with the primary hydrometeorological driver. (2) Significance testing (p-value): this tests the null hypothesis that there is no association between the variables. A p-value < 0.05 allows us to reject the null hypothesis, confirming that the vulnerability results are statistically significant and not due to random chance.

3. Results

3.1. Disaster Declarations in the Study Area

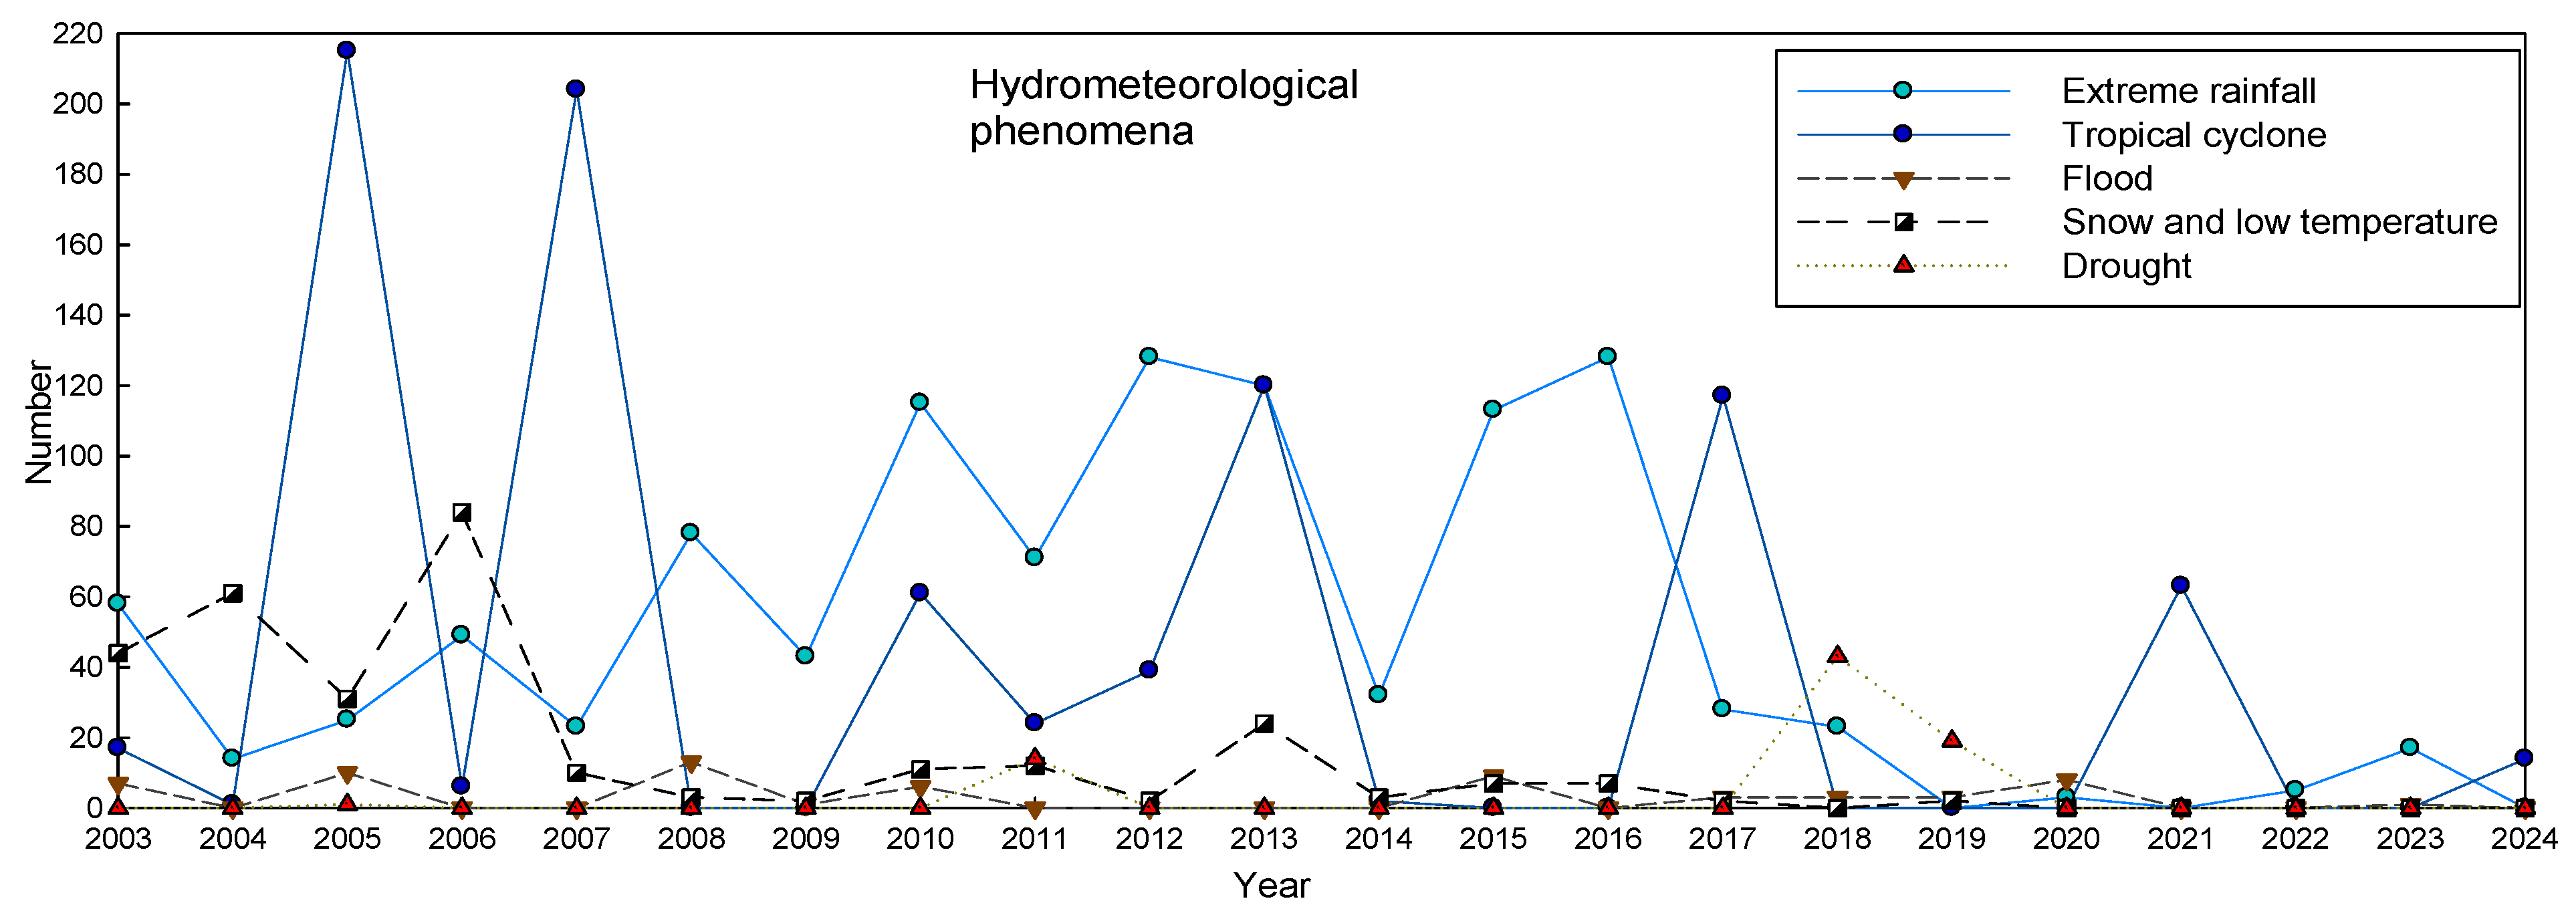
The municipalities cultivating coffee recorded 2570 disasters caused by hydrometeorological phenomena (Figure 2). The highest number of events was attributed to extreme rainfall (1096), followed by tropical cyclones (883), and snow and low temperatures (318). Events attributed to snow and low temperatures have progressively led to fewer disaster declarations since 2013, when 24 were issued. However, extreme rainfall caused disasters every year except in 2019, 2021, and 2024.
The Sen’s slope of the meteorological variables from the available stations in the region is shown in Table 1. Cumulative precipitation shows a positive increment in 43% of the sites, a negative increment in 49%, and no increment in 9%; however, none of them were statistically significant. For temperatures, 60% of stations show a maximum temperature increase, of which 52% are statistically significant. For the minimum temperature, 51% have positive slopes, of which 94% are statistically significant, while for the 49% with negative slopes, 59% are significant. For the significant data, the maximum monthly increment in maximum temperature is 0.03 °C, while the maximum monthly increment in minimum temperature is 0.01 °C.
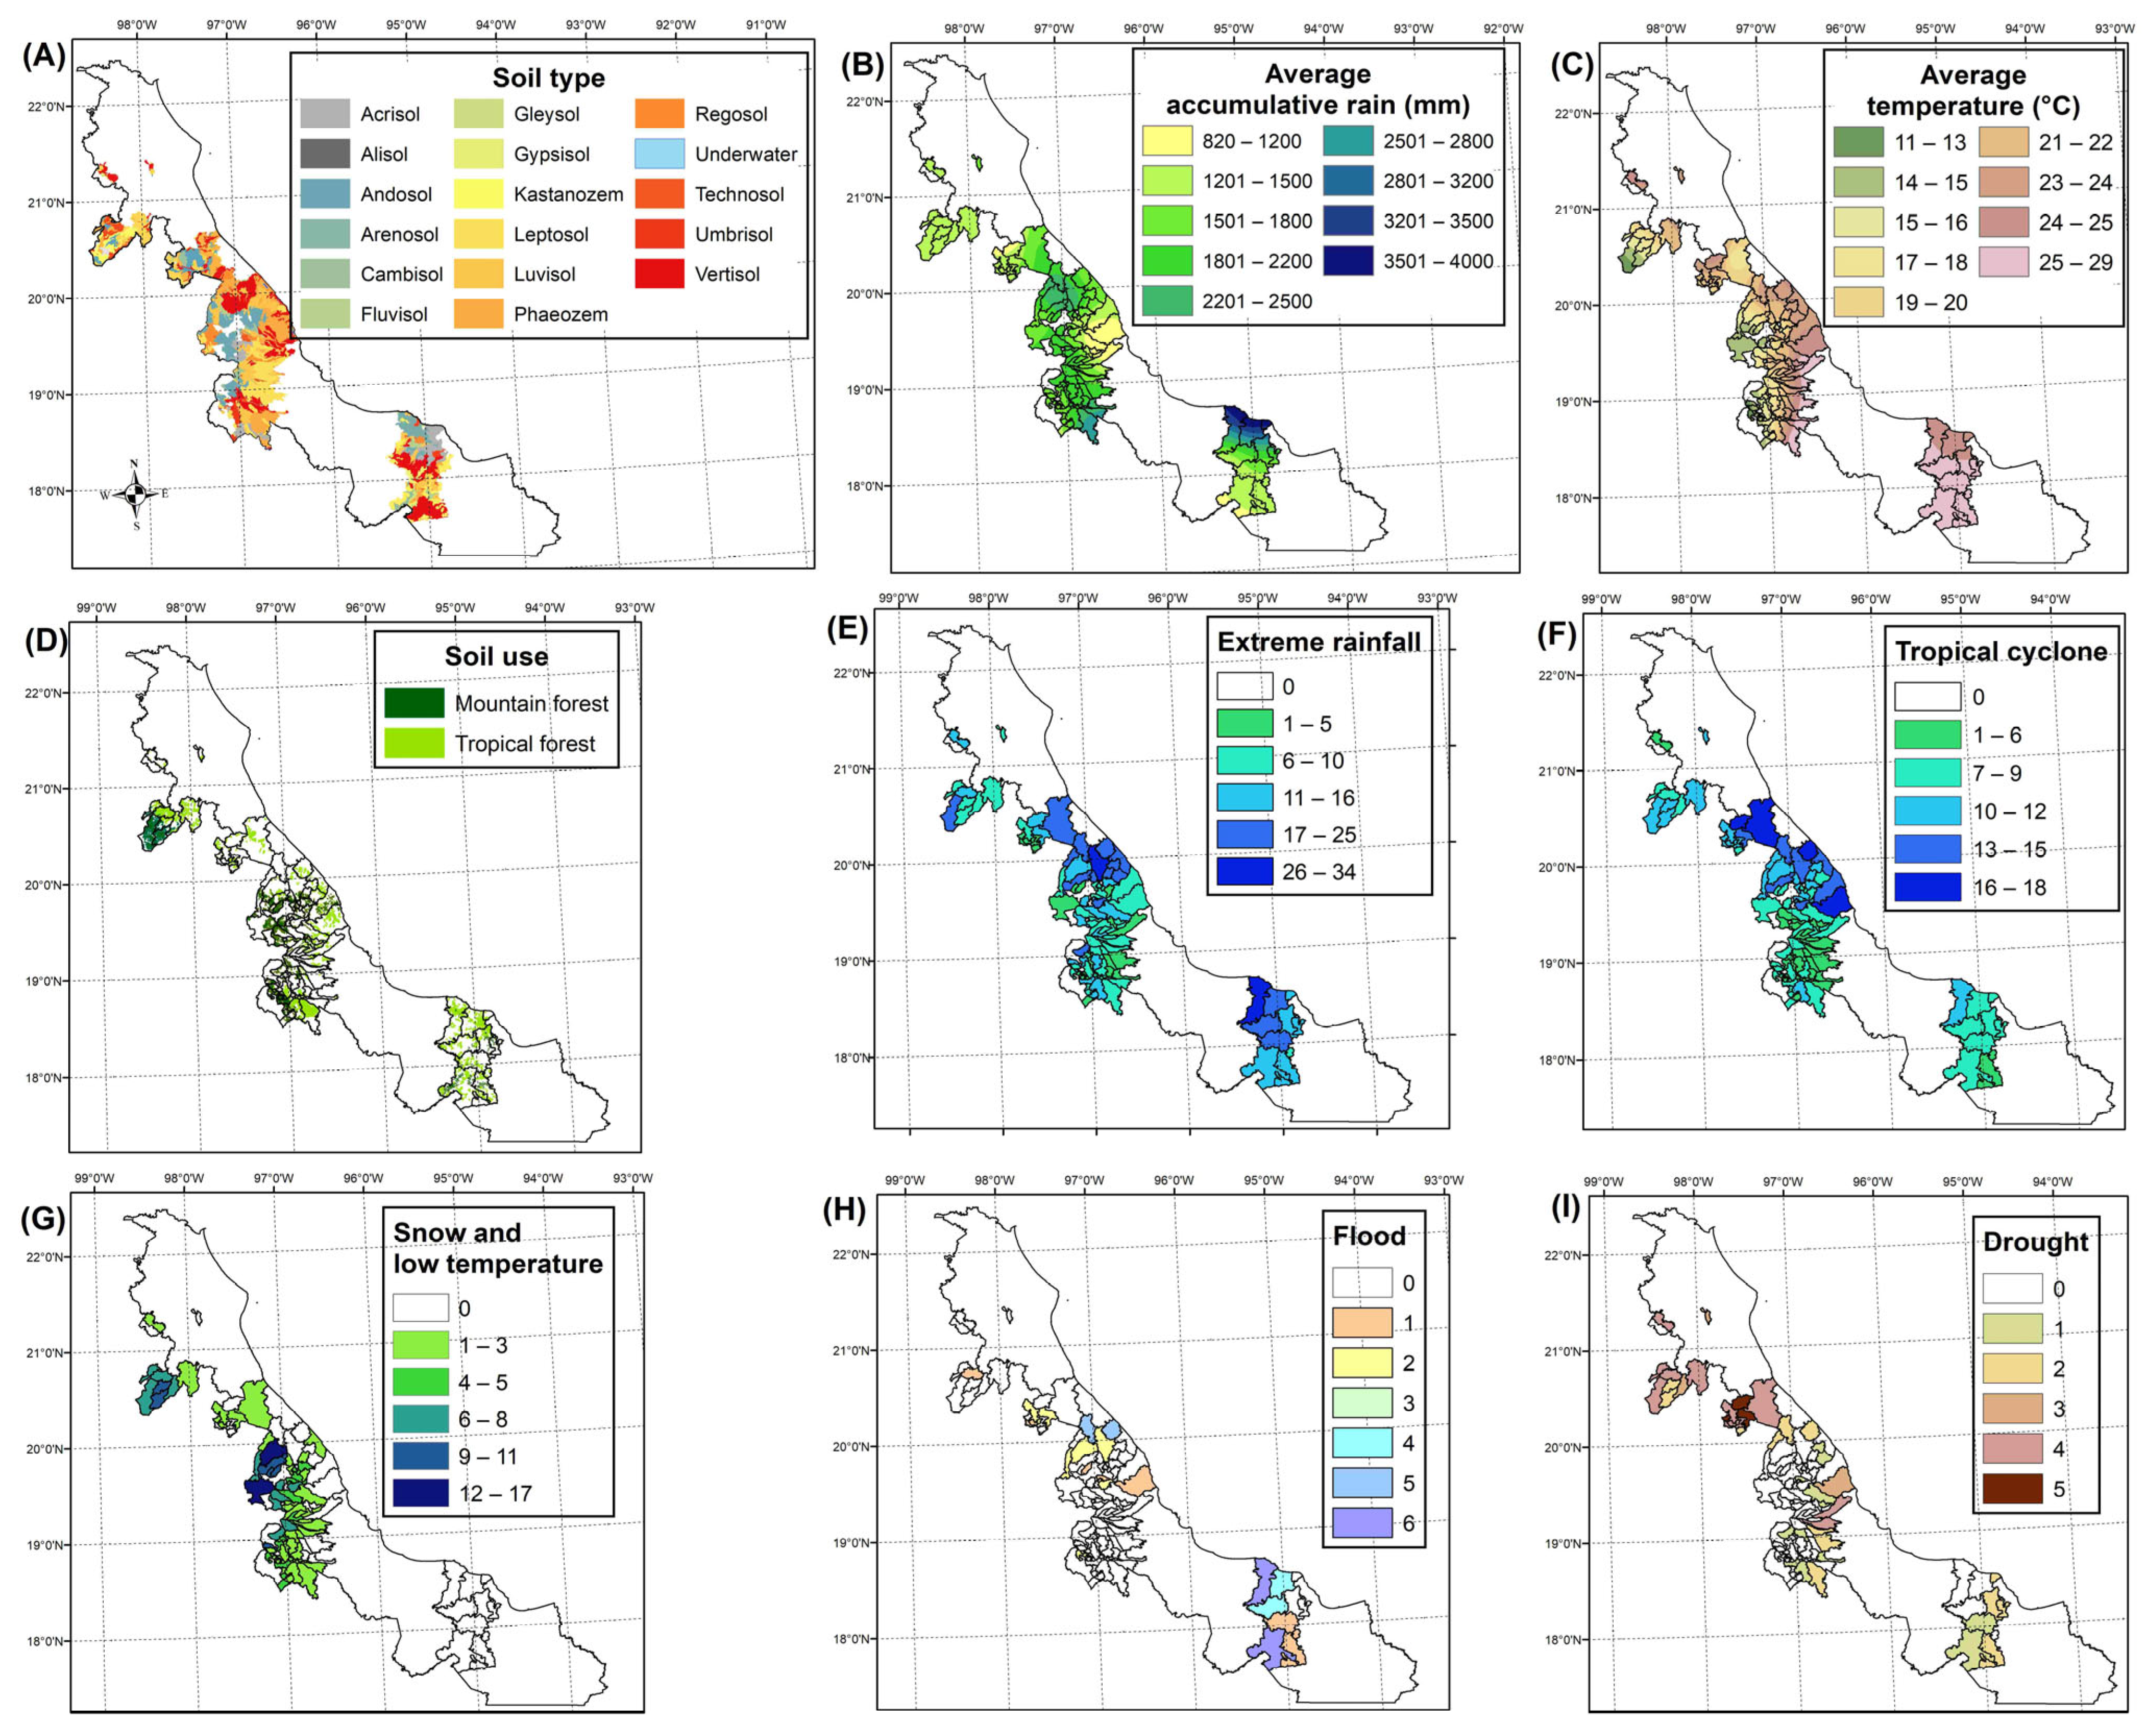
Figure 3A–E shows the agroclimatic conditions of the study area. Figure 3A shows the soil types in the study areas. The highest percentage is Andosol at 20% of the territory, which was most abundant in the central region; followed by Luvisol at 18% of the land and most abundant in the northern region; and Phaeozem at 17% and most abundant in the central area. Andosols are of volcanic origin, Luvisols have a high clay content, and Phaeozems are rich in organic matter [36]. The accumulated precipitation is shown in Figure 3B, where the southern side has the highest values. The average temperature (Figure 3C) indicates that the warmest areas are on the southwestern side, while the coldest places are located on the western side, where the highest altitudes are located. Figure 3D shows the soil use attributed to coffee agroecosystems [4], which are forestal uses. Temperate forests are labeled as mountain forests, while warm forests are labeled as tropical forests.
The distribution of hydrometeorological events that led to disaster declarations over the study period is shown in Figure 3E–I. There is a higher number of rainfall-related disasters on the southeastern side, below parallel 19°, with nine municipalities recording more than 20 events (Figure 3E); this is the region that also has the highest precipitation levels (Figure 3B). Tropical cyclones have the highest number of records between parallels 20° and 21°, with four sites recording more than 15 events during the study period (Figure 3F). The third-most-disruptive events were snow and low temperatures in the highest mountains on the western side, with four sites recording more than 6 events and one site recording 13 (Figure 3G). These regions coincide with lower temperature ranges (Figure 3C). Floods are most recorded on the southeastern side of the study area (below parallel 19°, Figure 3I). The highest number of drought disasters is recorded in three municipalities on the northwestern side of the study area (Figure 3H).

3.2. Correlations with Disaster Declarations

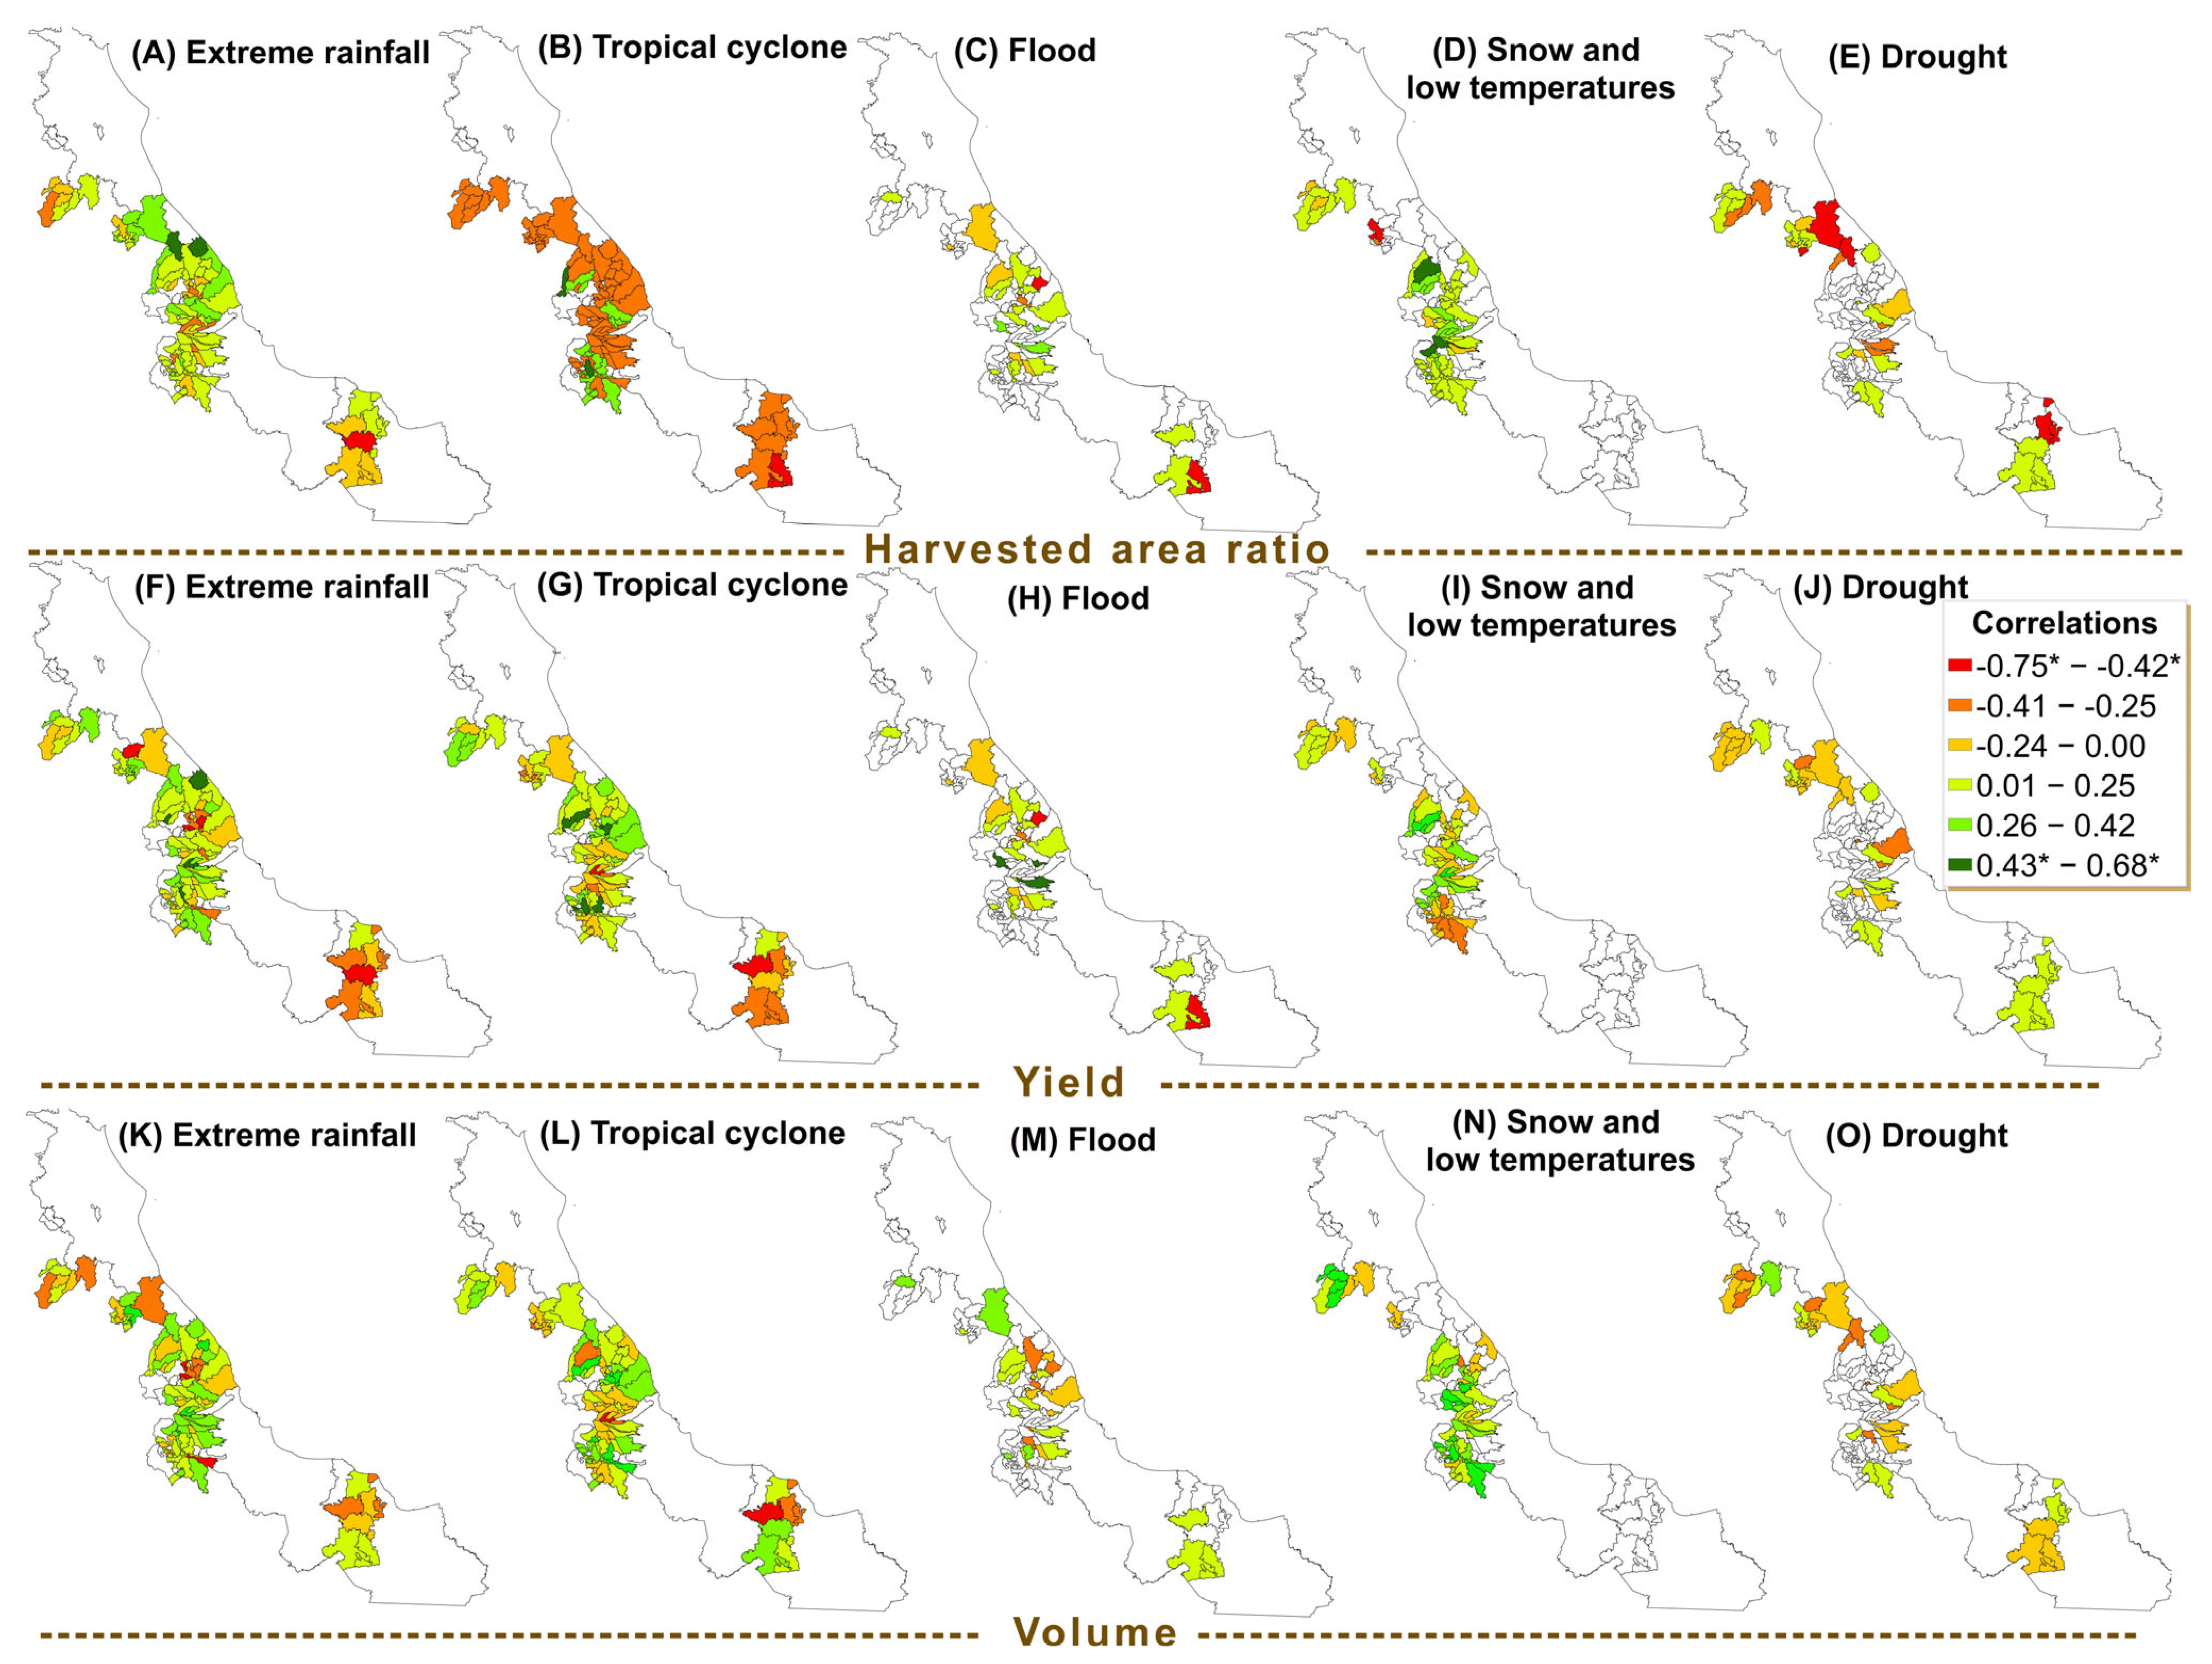
The Spearman correlations between disaster declarations and the harvested area ratio indicate that droughts had the most substantial adverse effect on surface harvested area, with statistically significant negative correlations in five municipalities, followed by tropical cyclones and snow and low temperatures in three sites, and extreme rainfall in two sites (Figure 4A–E). For yield, five significant negative correlations are reported for extreme rainfall, followed by tropical cyclones with two (Figure 4F–J). For volume, extreme rainfall has six significant negative correlations, followed by tropical cyclones with two (Figure 4K–O).

3.3. Vulnerability to Hydrometeorological Phenomena

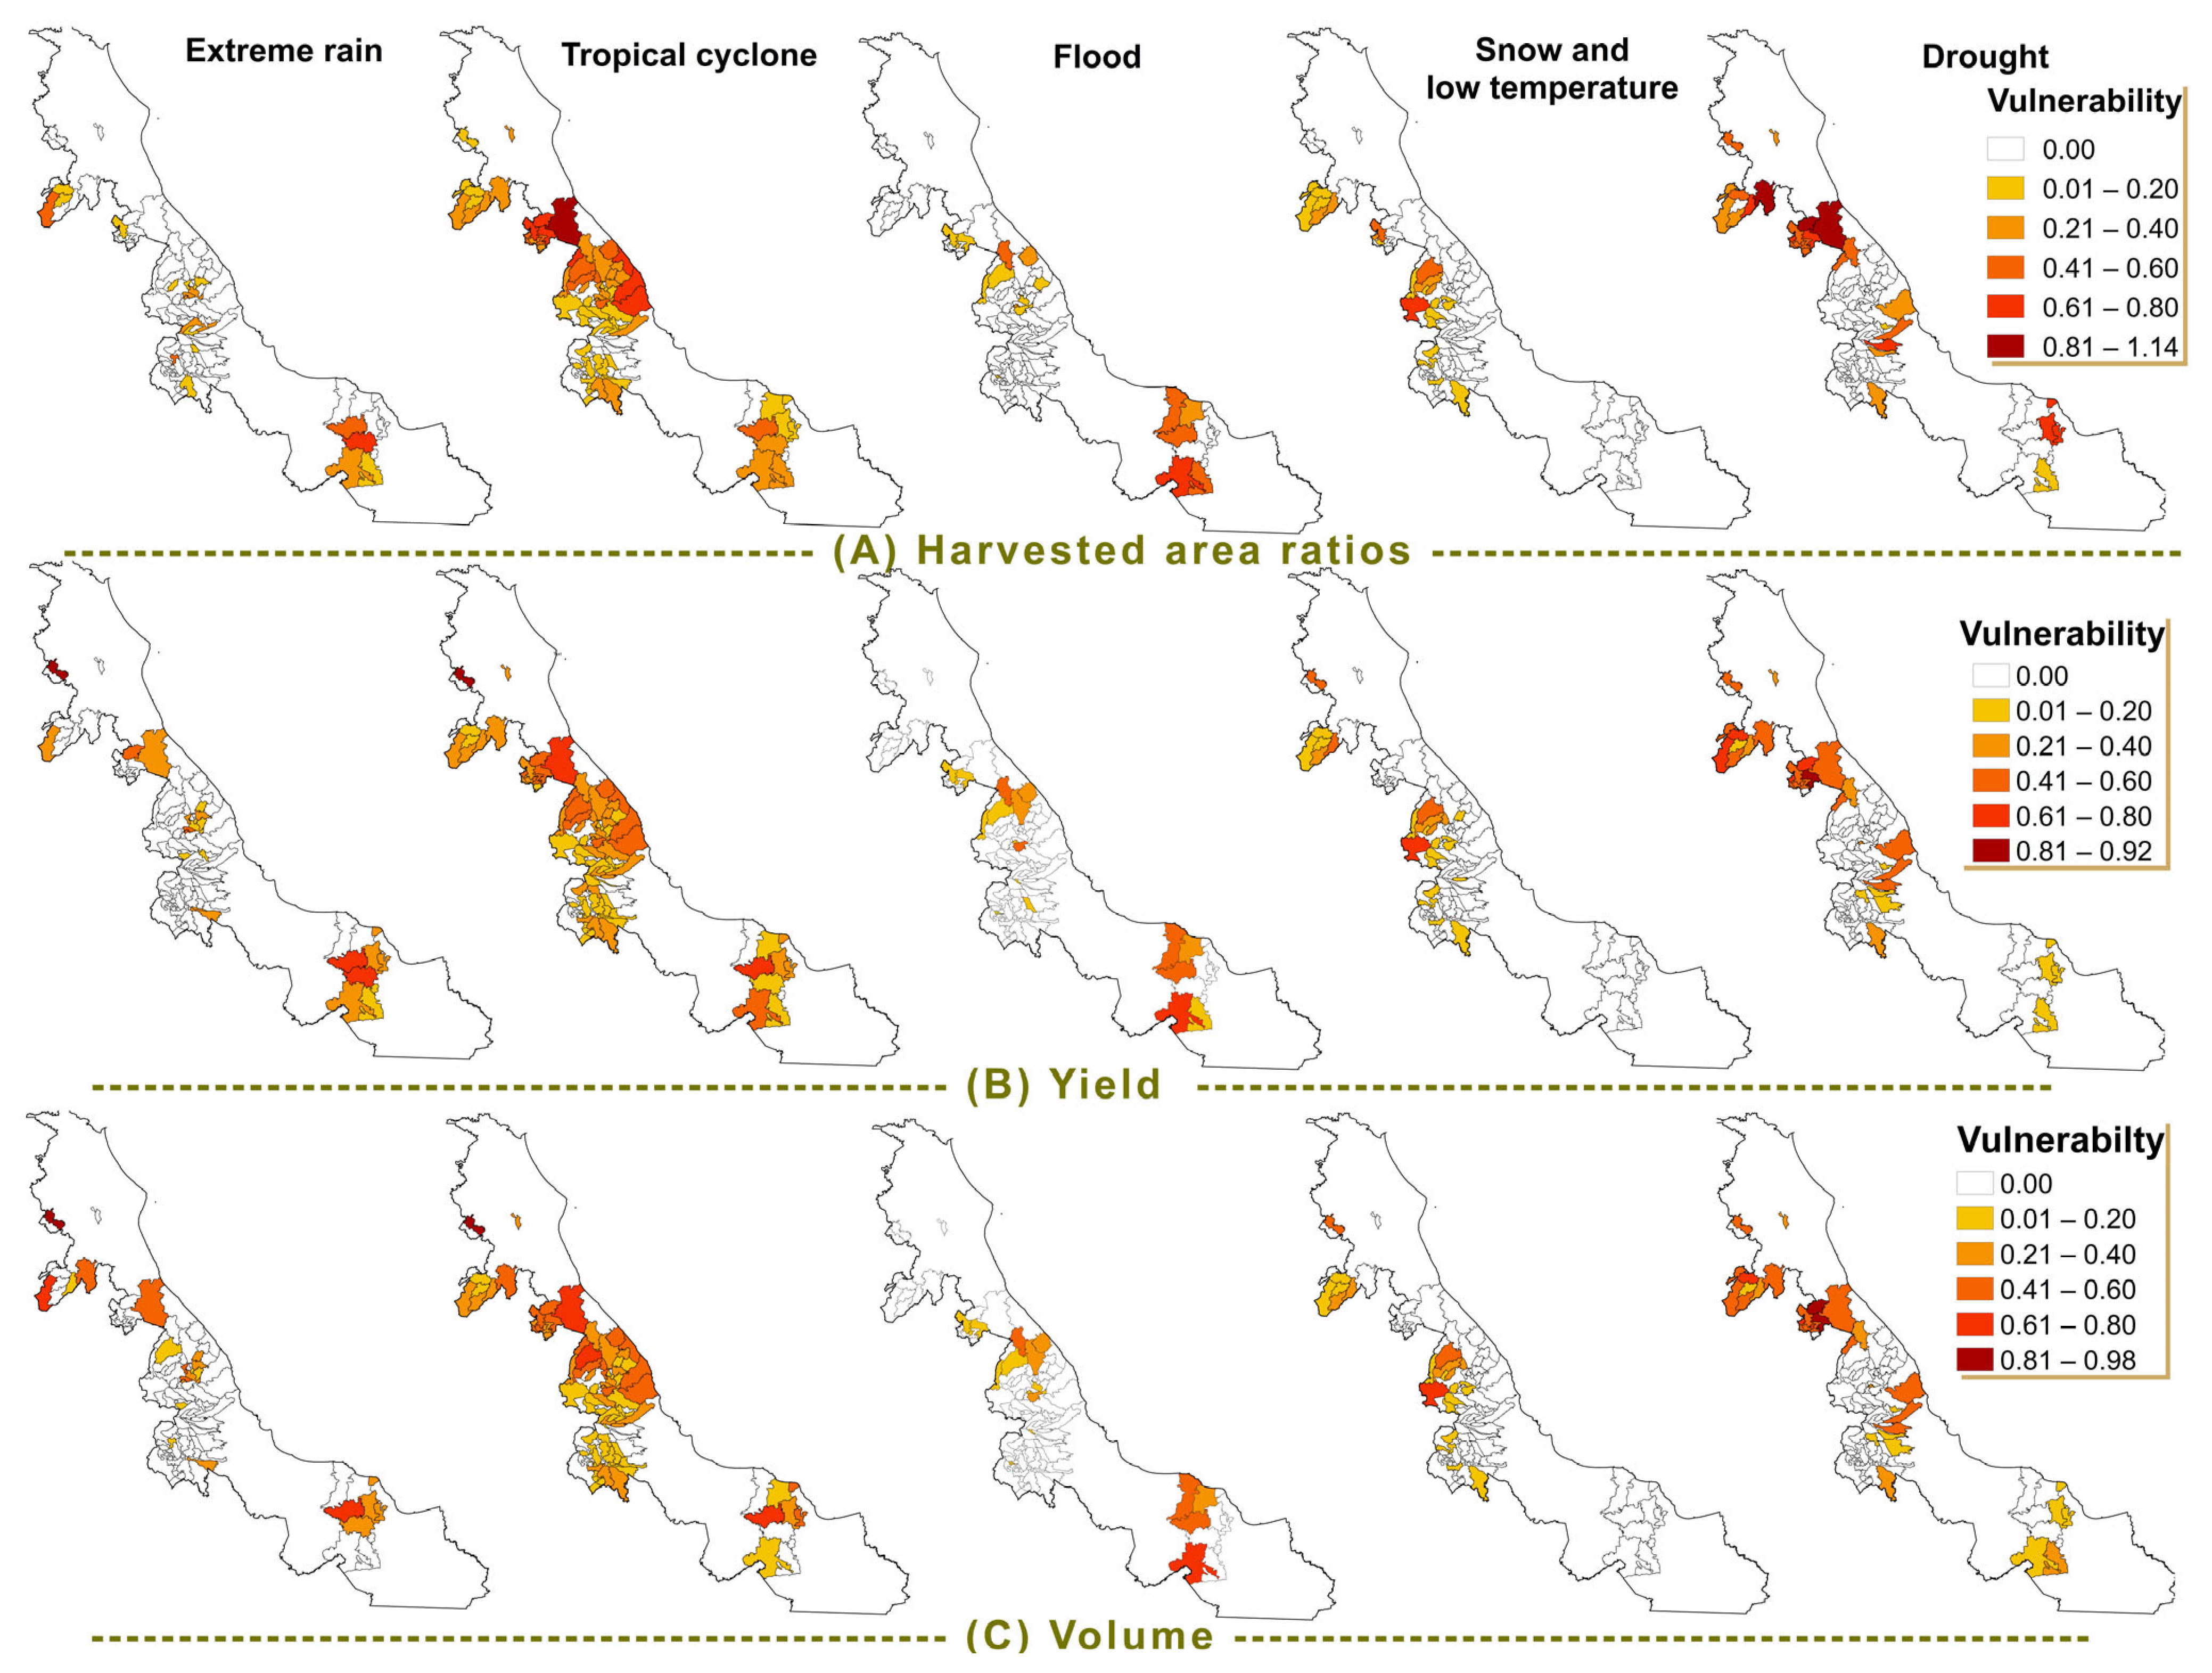
The vulnerability of coffee crop productivity to each hydrometeorological phenomenon is shown in Figure 5. For the three production values, the highest vulnerability was due to drought. Papantla, on the northern side of the study region, accounted for 57% of the maximum possible harvested area ratio. For production yield and volume, Espinal was the most vulnerable, with 46% and 49% of the maximum possible values, respectively. Tropical cyclones ranked second in vulnerability values (42% of the maximum possible), followed by extreme rainfall (41% of the maximum possible). In contrast, snow and low temperatures and floods ranked lowest in vulnerability (31% of the maximum possible). Eleven municipalities reported zero vulnerability to hydrometeorological phenomena because they did not negatively correlate with them, their production values were not affected by them, or their adaptive capacity was higher than their exposure and sensitivity.
Table 2 shows the significance of the production vulnerability by each hydrometeorological phenomenon. The harvested area ratio is significantly positive for tropical cyclones and droughts but significantly negative for snow and low temperatures. Yield is highly significant for extreme rains, tropical cyclones, floods, and droughts. The volume is significant for extreme rainfall, tropical cyclones, and droughts. Tropical cyclones show the strongest positive association with the three production data sets, followed by droughts and extreme rainfall.

3.4. Phenomena, Climate, and Phenology of Coffee Plants

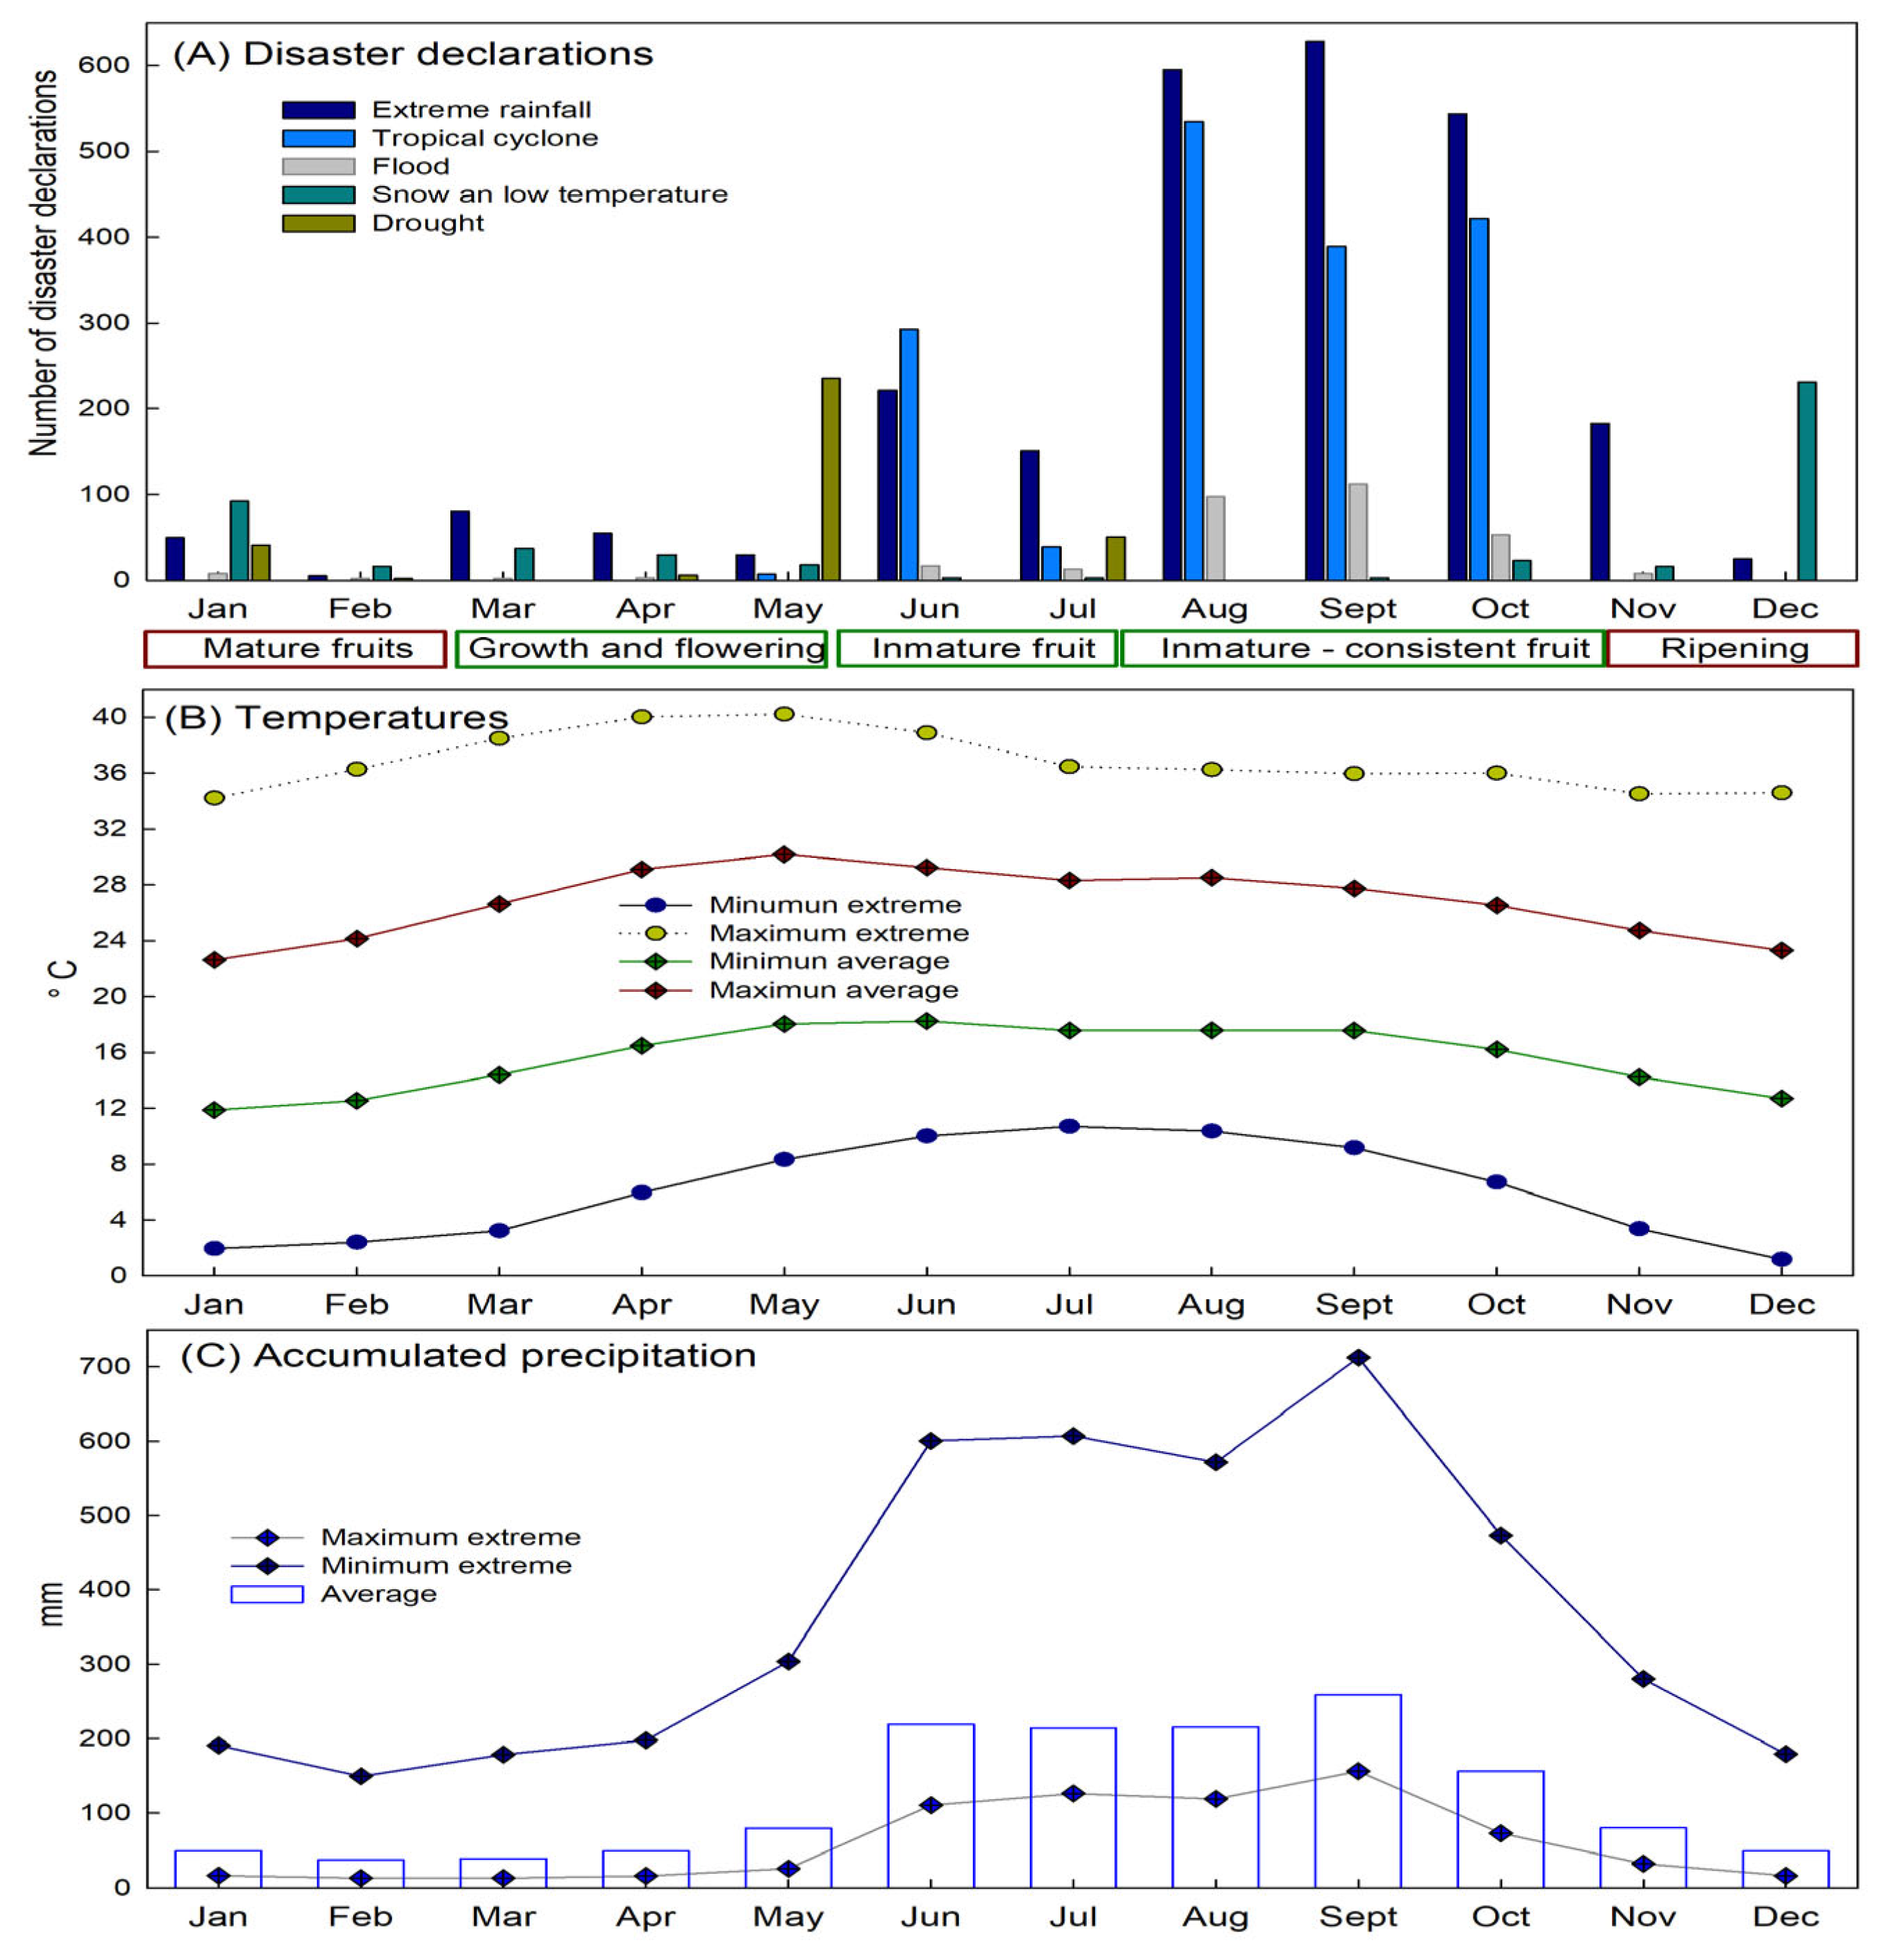
The occurrence of hydrometeorological phenomena that lead to disaster declarations throughout the year is shown in Figure 6A. September is the month with the most extreme rainfall and floods, followed by August and October. August is the month with the most tropical cyclones, followed by October and September. Snow and cold temperatures have the highest records during December, followed by January. Finally, the highest number of droughts is recorded during May.
The maximum and minimum temperatures are shown in Figure 6B, and the accumulated rain is presented in Figure 6C. The highest temperatures are recorded in May, averaging 24 °C, and the lowest are recorded in January, averaging 17 °C.
September has the highest rainfall, with 253 mm accumulated, followed by June and August, with 215 and 209 mm, respectively. During December, January, February, March, and April, the average accumulated precipitation is only 44 mm.
According to local data and scientific research, the vegetative period for coffee plants in the study region lasts from March to May, when water deficits during the driest months (February to April) and the onset of rains at the end of May promote flowering [37]. The fruits develop from June to October. During the colder months (January, February, November, and December), coffee fruits ripen and, when mature, can be harvested, usually in January and February [20,38].
Figure 6. Disaster declarations, average temperatures, and accumulated precipitation during the months of the year in the study region. Source: elaborated by the authors with data from SMN [22], CENAPRED [39], and [3,20].
Crops 06 00050 g006

3.5. Vulnerability and Extreme Meteorological Data

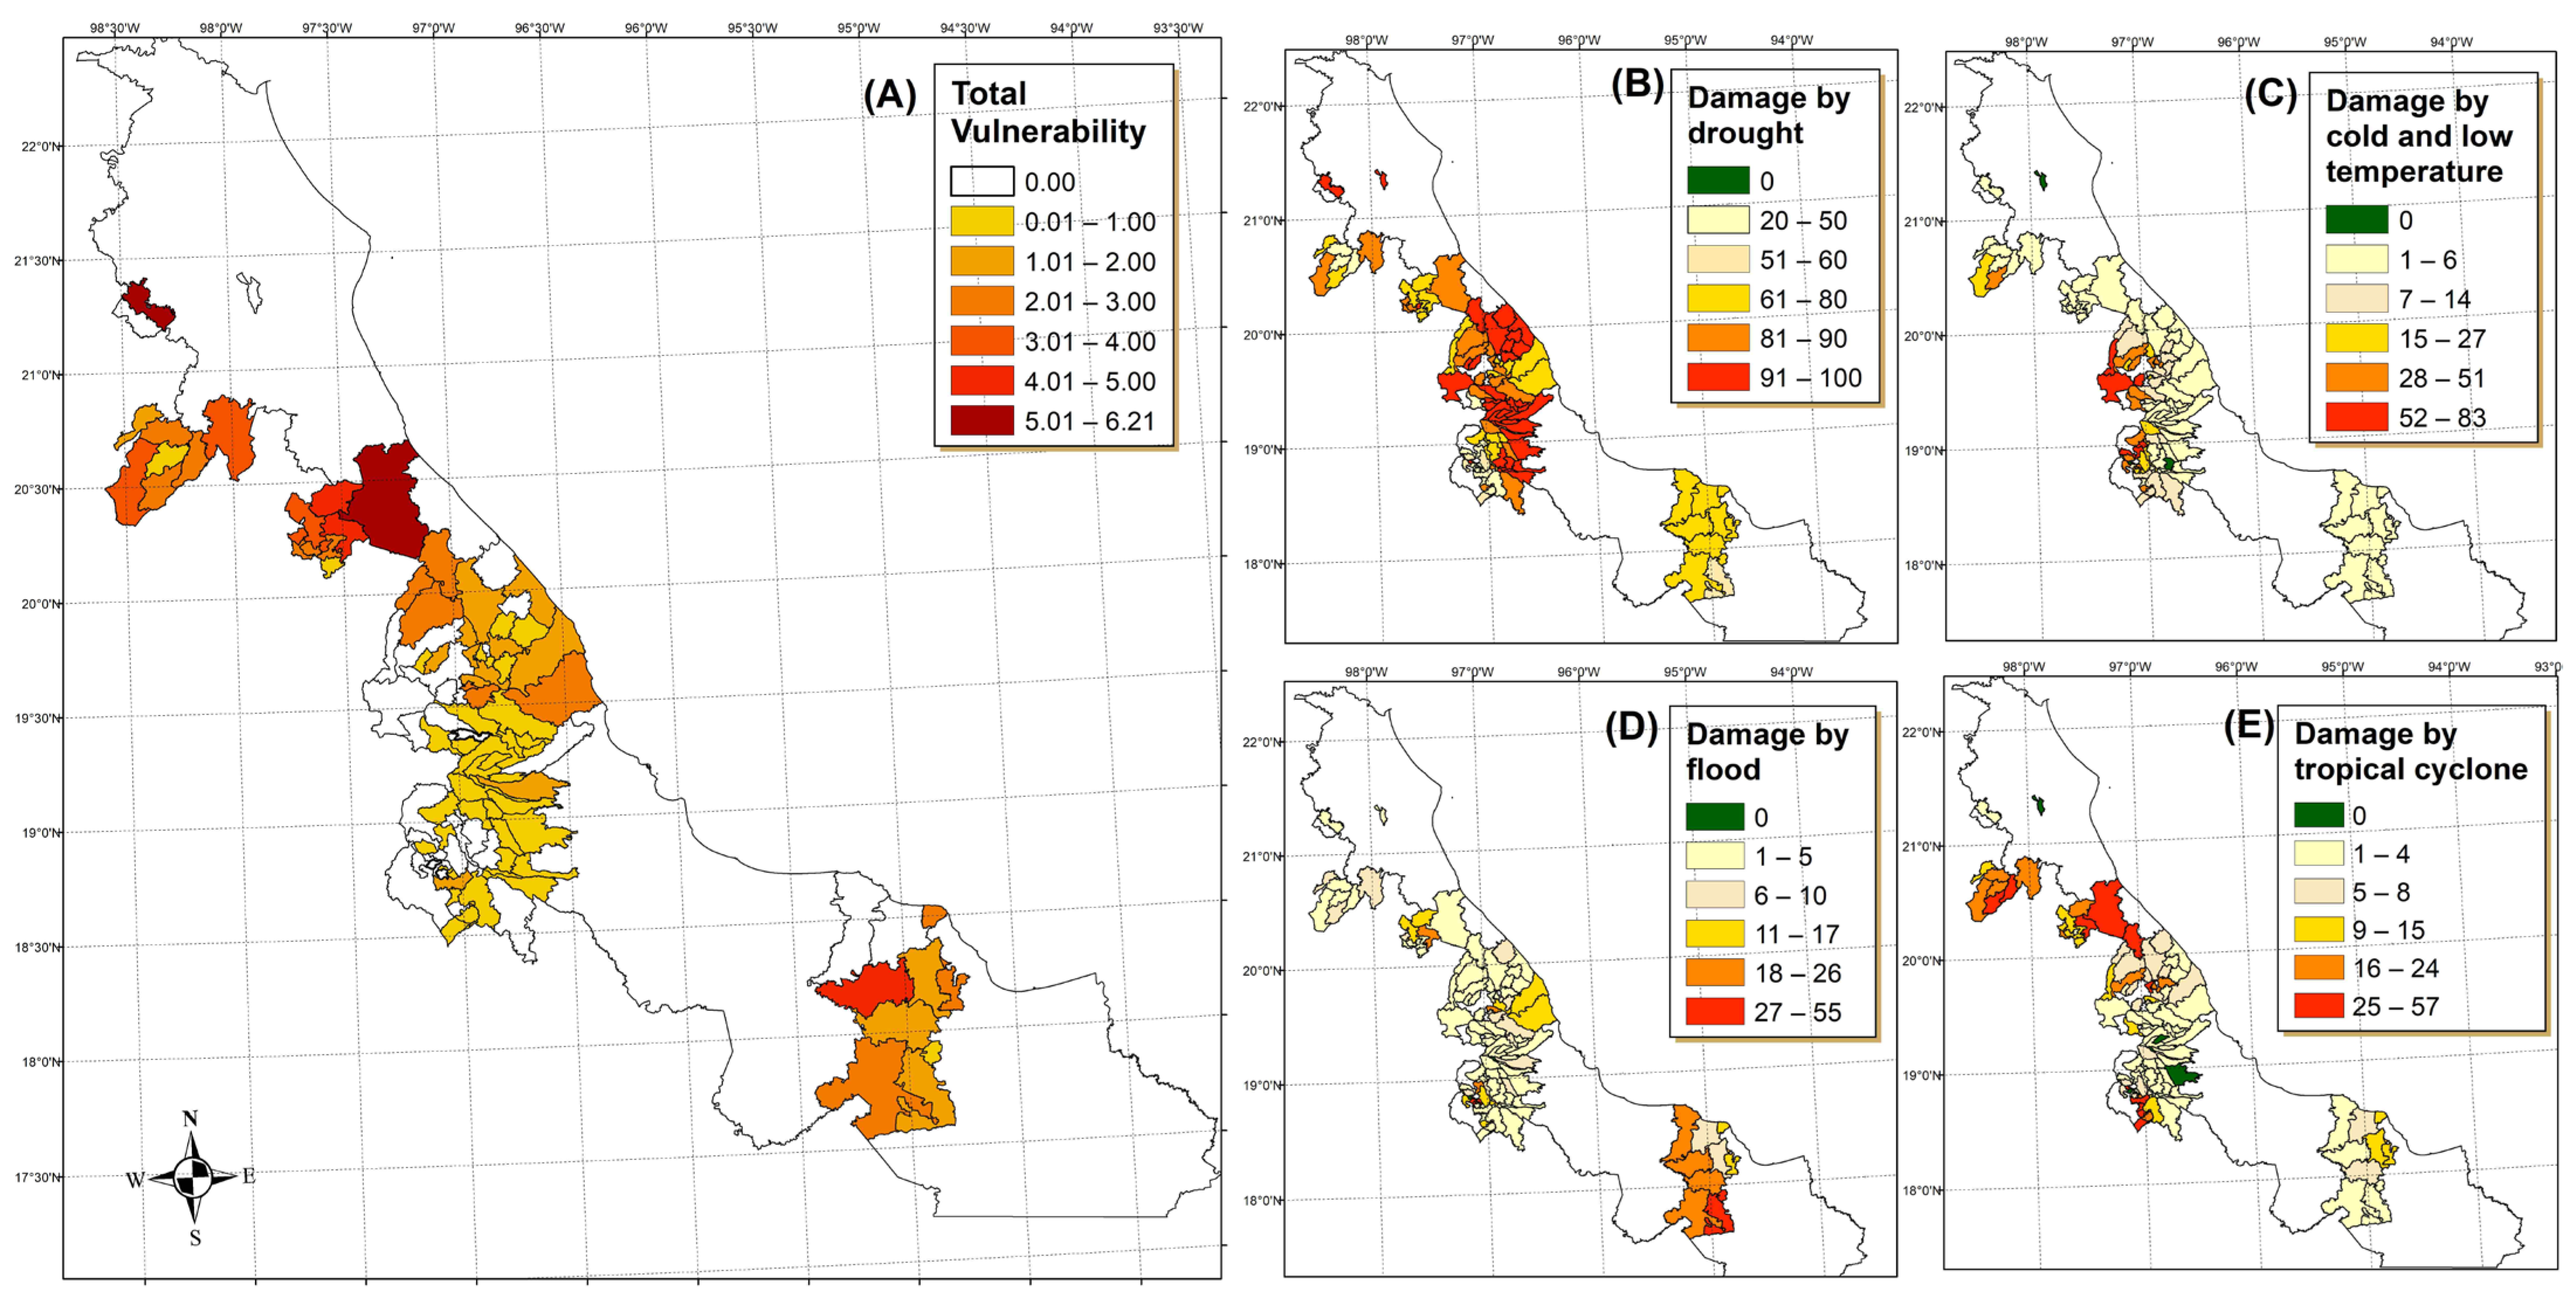
The total vulnerability and the extreme hydrometeorological phenomena affecting other crops in the study site are shown in Figure 7. The highest vulnerability (6.21) is recorded in one municipality on the northwestern side of the study area (Platón Sánchez), followed by Papantla (5.15), both on the northern side of the study region. Third place belongs to Hueyapan de Ocampo in the south (4.66) (Figure 7A). According to the last agricultural census [24], the site with the highest vulnerability (Platón Sánchez) has the highest percentage of agrarian damage by droughts (Figure 7B), followed by Papantla and Hueyapan de Ocampo. The lowest vulnerabilities are located at the center of the study area, where agricultural damage from snow and low temperatures, floods, and tropical cyclones is low (Figure 7C–E).

4. Discussion

4.1. Hydrometeorological Phenomena Causing Disaster Declarations

The high number of extreme rainfall events in the study region is related to its geographical location along the Gulf of Mexico coast, where 18 tropical storms and 12 hurricanes have impacted the area from 2003 to 2024 [40]. The hurricane season lasts from June to November, when temperatures in the Atlantic Ocean are higher and the air is unstable, allowing moisture-laden warm air near the surface to rise and cool rapidly as it ascends, leading to the development of thunderstorms. They reach the study region after crossing the Yucatan Peninsula. During their impact, the rains can last three to four days, and the combination of orography and air circulation accounts for about 80% of the year’s total rainfall [16]. In 2005, 2007, 2010, 2013, and 2017, when the highest number of disaster declarations due to tropical cyclones occurred, five hurricanes (two category 1 and four category 2) impacted the central area of the study region. For these categories, the wind speed in the local zone ranged from 119 km/h to 154 km/h. The rainfall these phenomena caused ranged from 300 to 355 mm in 24 h, which is also associated with extreme rainfall events across the zone [41].
The tropical cyclone paths and impacts mainly affect the area between parallels 19° 30′ and 20° 30′, where the most affected municipalities are located. Tropical cyclones from the Pacific side have also reached the area below parallel 18°; therefore, extreme rainfall and flooding are more frequent in the southern part of the study region [40]. Even though there are no official records of coffee plantations being affected by these events in the study region, in the state of Chiapas, where coffee plantations cover almost 250,000 ha, there are records of coffee plantations being lost to hurricanes and floods [42]. Additionally, in Puerto Rico, coffee plantations declined by 5% after a category 3 hurricane [43].
Disaster declarations due to snow and cold temperatures have their highest records in areas above parallel 19° 25′ and meridian −97°, with altitudes of 1600 masl, where two mountain systems are located. These places receive polar winds from November to March, and temperatures can be below 0 °C [44], affecting rural communities and local crops. In these places, coffee plantations are scarce, with less than 500 ha per municipality, and there are no records of plant losses due to snow or cold temperatures; however, studies of coffee plants indicate that temperatures below 13 °C may produce leaf damage in 7 to 12% of the plants, while temperatures below 4 °C may cause necrosis in leaves [45].
Drought, which mainly affects the northwestern part of the study region, is periodic nationwide and has been reported in previous research, especially in the central area [46,47]. For coffee crops, one municipality reported 20 ha lost in 2019, during the highest drought period. Unfortunately, the reasons for the loss are not documented in official records, nor is there a disaster declaration due to drought at this site [11]. Therefore, this loss cannot be directly attributed to drought, but it may have been caused by it. As shown in Figure 6C, the region has a season with very low precipitation that typically lasts from December to mid-May and a short semi-dry season between July and August. In the region, the intensity of drought has been associated with the El Niño-Southern Oscillation (ENSO), which causes fewer tropical cyclones and affects the entire area, especially the northern side [16], where climates are warm, subhumid, or humid with abundant rains during the summer; this can provoke Disaster Declarations when precipitation levels are below normal, as in 2005, 2011 and 2019, when the highest droughts were reported in Veracruz [13,48].

4.2. Correlations Between Hydrometeorological Phenomena and Coffee Production

Although extreme rainfall and tropical cyclones were the most frequent phenomena in the region, this research found that drought is the phenomenon with the greatest significant decrease in harvested area ratio, especially in municipalities with disaster declarations due to drought. However, yield and production volume did not show a significant correlation at these sites. This result may indicate that, at the affected sites, coffee plants in some areas may have lost total production. For example, in 2011, 49 disaster declarations due to drought were issued, and by 2012, the area of coffee crops had decreased by 11,121 ha in the regional statistics. Research on drought in six Coffea arabica genotypes (Catimor, Marsellesa, Starmaya, and three hybrids of Caturra, Timor, and Sarchimor) shows that prolonged drought can reduce production by up to 50% by lowering the photosynthetic rate, decreasing vegetative growth, and affecting flowering and yield [7].
Extreme rainfall and tropical cyclones were the second cause of the harvest rate reduction, with 4% and 9% reductions in 2013 and 2005, respectively, when the highest numbers of tropical cyclones and rains occurred, indicating that at these sites, some plants may have been lost since their yield and production volume were also significantly reduced.
Excessive rainfall was associated with a 9% decrease in harvested surface area, a 10% decrease in yield, and an 18% decrease in production volume during 2016, the year with the highest number of rainfall-related disasters. Although rainfall triggers flowering in Coffea trees, studies of Coffea arabica in Central America indicate that extreme rainfall during flowering can cause substantial yield reductions [38]. Studies in the study region found that accumulated precipitation above 3000 mm decreases yield [49], which might be associated with extreme rainfall that increases the severity of leaf rust in coffee trees, as documented at the study site [3].
Tropical cyclones mainly affected the center and southeastern side of the study region. In 2005, they caused the most significant total production reduction, with −2% in harvest surface rate, −6% in yield, and −7% in production volume. In general, municipalities in the path of hurricanes (northern for the Atlantic and southern for the Pacific Ocean) are the most negatively affected in their harvested area ratios (Figure 4B), with a −44% decrease in yield and a 39% decrease in production volume at the four most affected sites. These places are located between 25 and 35 km from the coast, where winds can reach up to 130 km/h, thereby affecting the entire width of the state [40,41]. In Veracruz, most coffee plants are protected by native forest trees [4]; however, during hurricane periods (Figure 6A), when coffee plants are just beginning to fruit or their fruits are maturing, strong winds can cause unripe fruit to fall. Research in the neighboring state of Oaxaca reported a 61% decrease in coffee yield following a category 4 hurricane that impacted its coast 13 years earlier [50].
Floods affected only two municipalities, with significant negative impacts, because coffee plants are usually cultivated on mountain sites [4]. Yet, these two sites range from 40 to 380 masl [13] and are highly susceptible to flooding. In the affected municipalities, the highest losses due to flooding were −28% in production volume and −4% in yield during 2008. In this regard, floods have been reported to cause coffee tree losses in the neighboring state of Chiapas [42]. However, floods were also recorded during years with extreme rainfall or tropical cyclones (2005, 2010, and 2020). Therefore, for these years, it is not possible to determine whether the extreme rainfall, hurricanes, floods, or their combined events affected the coffee plantations.
Snow and low temperatures were very limited to two sites on the northwestern side of the study region, where minimum temperatures can reach −1 to 2 °C. Still, average winter temperatures range from 10 to 15 °C (Figure 3I) [22], with effects observable only on the harvest surface rate. Therefore, extreme minimum temperatures and snow do not significantly affect production values at the study site. Here, it is also important to consider that Coffea arabica originated in the cool highlands of Africa and is therefore more adapted to temperate regions [51].
For drought, five municipalities showed a significant negative correlation with surface harvest rate, although yield and production volume were not significantly affected. In the affected municipalities, the harvest rate decreased by 10% in 2018, when high temperatures and drought were recorded. A combination of these two extreme hydrometeorological phenomena is associated with increased stress on coffee trees and increased pests and diseases, such as root-knot nematodes (Meloidogyne spp.), soil fungi, leaf rust (Hemileia vastatrix), leaf-cutter ants, and coffee fruit borers (Hypothenemus hampei) [49].

4.3. Vulnerability of Coffee Crops to Hydrometeorological Phenomena

The coffee crops’ highest vulnerability to drought indicates that this phenomenon can cause the most serious damage to the plants in the study area. Other studies have documented similar results when correlating drought with coffee leaf rust, as this phenomenon can decrease plant tolerance to the disease [9]. Even in the absence of disease, as in controlled experiments, yield can be highly affected by drought: a 14% decrease in soil water content over two growing seasons can result in a 75% yield reduction in Coffea arabica genotypes similar to those cultivated in this study area [7]. A review of several studies and future projections indicated that drought, rather than higher temperatures, is the most important factor in reducing coffee production, because plants can adapt to high temperatures when they receive a constant supply of water [52]. Regarding the estimated adaptive capacity, the five municipalities with the highest vulnerability to drought average only 29% of the maximum possible adaptive capacity. One study in the central region of Veracruz found that shade management and water recycling activities, such as those integrated into our index, help mitigate the effects of extreme heat and drought in coffee plantations [32].
Nevertheless, although drought had the highest vulnerability values, the number of affected municipalities was lower than that for tropical cyclones because only 33 sites were vulnerable to drought. In contrast, 82 were vulnerable to tropical cyclones. The municipality with the highest vulnerability to tropical cyclones (Papantla) combines a low sown area (10.12 ha on average during the study period) with 17 disaster declarations due to tropical cyclones and a low adaptive capacity, with only 34% of the maximum possible. This site is located along the paths of tropical cyclones [22,40]. On the contrary, Hueyapan de Ocampo, with the second-highest vulnerability to tropical cyclones, combines a low exposure to tropical cyclones (only eight disaster declarations) with a high sensitivity to them (with significant negative correlations between tropical cyclones and the three production values), plus a low adaptive capacity, with only 26% of the maximum possible. These results mean that the municipalities with low adaptive capacity and high sensitivity to tropical cyclones are more vulnerable to these phenomena. Similar results have been reported for other coffee crop plantations in Puerto Rico [36] and Oaxaca, Mexico [45], with hurricanes reducing the area of coffee plantations for more than a decade after the events. Nevertheless, increases in adaptive capabilities, such as tree diversification and shade-restoration programs, enhance the resilience of coffee plantations and, therefore, reduce their vulnerability [53].
The third spot for the number of affected municipalities by vulnerabilities was due to extreme rainfall. At the two most affected sites, exposure to extreme rainfall averaged 20 disaster declarations; the three production values showed significant negative correlations; and adaptive capacity was only 32% of the maximum possible. In these cases, the three key elements were combined to produce a high vulnerability: high exposure, high sensitivity, and low adaptive capacity. In this regard, most studies addressing coffee’s vulnerability to rain focus on low rainfall [7,8,19,46]; however, one study from Central America indicates that extreme rainfall can decrease yield if it happens during the flowering stage, because flowering intensity decreases with rainfall intensity [38].
The vulnerability to snow and low temperatures ranked fourth among municipalities, with 25 sites. These results are explained by the fact that these phenomena are limited to the highest altitudes of the municipalities (more than 2000 masl [13]), where coffee plantations are not located due to temperature limitations for coffee plants [6]. Therefore, even if the municipality reports this phenomenon, it does not necessarily mean that the entire area was affected. Unfortunately, the database of disaster declarations and the agricultural census only include these data [11,24]. Thus, seeking an alternative to this variable is recommended, such as in situ meteorological data. However, meteorological stations are scarce at mountain sites, and climatic information from CHIRPS Databases, for example, tends to limit the real performance of in situ phenomena [22,54].
The low vulnerability to flooding, with only 17 municipalities affected, can be explained by the fact that coffee plants are mainly not located in low-altitude areas or in areas susceptible to flooding, due to their root sensitivity to excessive water [55]. In addition to these results, the highest number of flood-related disasters is limited to only two sites in the study region [11], which is contrary to other studies that reported a high number of flooding events affecting coffee plantations [10].
Table 3 shows the correlations between the production vulnerability of coffee agroecosystems and general agricultural disasters caused by hydrometeorological phenomena in the region. These results are congruent with our vulnerability estimation data from Table 2. There are significant negative correlations between yield and vulnerability, indicating that sites with lower yield are more vulnerable than those with higher yield. Higher yields indicate better agronomic practices and educational strategies to reduce vulnerabilities in coffee plantations, as documented with Indonesian coffee growers [56].
The forest surface in each municipality is also negatively correlated with the vulnerability. Although the forest effect is not statistically significant, these results indicate that coffee plants located in forested sites, rather than on agricultural lands, are more resilient to extreme climatic events, thereby helping attenuate climate change and improve biodiversity, which, in turn, impacts their productivity [57,58,59].
Regarding the correlations with disasters reported in the agricultural census, hurricanes are positively and significantly correlated with vulnerability values, indicating that our estimates corroborate the view that the damage caused by these phenomena significantly affects coffee production. On the contrary, the significant negative correlation between vulnerability and snow and low temperatures indicates that warmer temperatures are not suitable for coffee plants in areas where it is cultivated, such as low-altitude areas and the southern side of the study region. According to local studies, the optimal temperature range for Coffea arabica yield in the region is 17–21 °C [49]. Thus, sites with warmer climates, where low temperatures are not recorded, are more vulnerable than those in colder climates. Coffea arabica is a plant with a limited temperature range (18 to 23 ° C); flowering does not occur at temperatures above 28–33 °C, and prolonged temperatures above 30 °C cause plant abnormalities, such as leaf yellowing and the formation of tumors at the base of the stem [37]. Therefore, the temperature increases projected by the IPCC climate change scenarios [60] pose a significant challenge for coffee production, especially in warmer areas, such as the southern part of the study region.
In this research on coffee agroecosystems, it can be assumed that they are more vulnerable to tropical cyclones and droughts than to extreme rainfall, flooding, snow, and low temperatures. The positive significance between phenomena and production values corroborates our assumption. However, a more detailed approach should be considered, especially for extreme rainfall, which is more frequent than tropical cyclones. Still, there is a negative correlation between these phenomena and the harvested area ratio, suggesting that they may be beneficial to the mountain sites where coffee plants are located [4], rather than the lower altitudes, where they can cause greater damage and trigger a disaster declaration [21].
Overall, the vulnerability levels obtained with this method are considered low, with a maximum value of 6.21, representing 41% of the total possible value (15.0), and an average regional vulnerability of 1.23, representing only 8% of the maximum possible. These results indicate that these crops are not highly affected by the hydrometeorological disasters in the study area. The reasons may be that these agroecosystems are primarily located under the shade of local forest trees, as reported in local research [4,17,18,58], and that they integrate a polyculture scheme, thereby improving plant biodiversity and resilience [19,59]. Another significant factor we can test in future research is soil type. —Andosols are the most abundant in the study region, which are considered fertile because they are rich in organic carbon and minerals. At the same time, Luvisols have an adequate texture and pH levels suitable for coffee roots [61], therefore providing appropriate substrates for coffee plantations and enhancing their resilience.

4.4. Limitations of the Proposed Vulnerability Index

Although this research contributes to a general vulnerability evaluation in a large-scale area, the fact that the production sensitivity was assessed as the correlation between production data and the number of hydrometeorological phenomena represents a constraint that did not consider agronomic and environmental factors such as the following: (1) the specific plant varieties’ behavior and agronomic management due to the lack of statistical information from the whole region; (2) the local climatic data, due to the low coverage of meteorological stations along the municipalities; (3) local soil types and erosion data due to missing information on the georeferencial location of coffee plantations; and (4) water availability at the local farms that can contribute to reducing vulnerability.
The use of hydrometeorological Disaster Declarations that depend on administrative resources [21], instead of specific local phenomenological data, to consider the exposition values also represents constraints in this vulnerability index, which can be solved by determining coffee plant locations and environmental data at the sites (these data were not available at the time of this research); this situation therefore represents a challenge for national and state authorities that has remained largely ignored despite the problem having been identified in past research [62,63].
As part of these limitations, we also recommend improving the estimation of vulnerability by taking into consideration physiological aspects, such as phytopathological diseases and plagues [3], and socioeconomic data, such as productive conversion to other crops [64], small producers abandoning their lands and living on coffee farms of middle to large producers [18], and the new productive associations in the region [65]. However, for specific information, taking all these factors into account would make it more difficult to estimate vulnerability across a larger area, as some authors recommend [51].
Finally, the two correlation sets between agronomical disasters in the area (Table 3) and hydrometeorological phenomena and vulnerabilities (Table 2) obtained in this research represent exploratory findings that should be validated in future investigations.

5. Conclusions

Although extreme rainfall has the highest exposure values in the region, the highest vulnerability of coffee agroecosystems to hydrometeorological phenomena that trigger Disaster Declarations on the eastern side of Mexico is due to drought, with the harvested area ratio being the most affected. In contrast, tropical cyclones cause the greatest number of vulnerabilities and are significantly correlated with harvested area ratio, yield, and volume production.
Though in some places there are significant sensitivities to phenomena such as extreme rainfall and floods, when each site is factored in, the evidence shows a low impact. One reason for these results may be that coffee plants are cultivated under the shade of the native forests. Therefore, the systems are more resilient to these extreme climatic factors. Finally, the negative correlation between cold temperatures and vulnerability indicates that municipalities affected by these phenomena have a higher future potential under climate change scenarios.
However, these results still represent a first approximation to estimate the vulnerability of coffee plantations in the state of Veracruz, and other social, economic, and environmental factors should be considered in future research, as this topic is under-researched in the study area.

Author Contributions

Conceptualization, O.A.V.-R. and F.S.-M.; methodology, O.A.V.-R. and F.S.-M.; software, O.A.V.-R. and F.S.-M.; validation, O.A.V.-R.; formal analysis, O.A.V.-R. and F.S.-M.; investigation, O.A.V.-R.; resources, O.A.V.-R.; data curation, O.A.V.-R. and F.S.-M.; writing—original draft preparation, O.A.V.-R.; writing—review and editing, O.A.V.-R. and F.S.-M.; visualization, O.A.V.-R. and F.S.-M.; supervision, O.A.V.-R. and F.S.-M. All authors have read and agreed to the published version of the manuscript.

Funding

This research was supported by the National grants from the Mexican Secretary of Science, Humanities, Technology, and Innovation (SECIHTI).

Data Availability Statement

Data is available upon request. Official data is available in the links provided at the references.

Conflicts of Interest

The authors do not have conflicts of interest.

Abbreviations

The following abbreviations are used in this manuscript:
SMNNational Meteorological Service
CENAPREDNational Center for Disaster Prevention
SIAPNational Agrifood System
INEGINational Statistics and Geography Institute

Appendix A

1. Disaster Declarations were developed as a management tool to help assess the impacts of hydrometeorological events such as severe hailstorms, hurricanes, river flooding, flash flooding, heavy rain, heavy snowfall, tornadoes, tropical storms, severe droughts, high winds, and severe frost.
2. The process for issuing a DISASTER DECLARATION involves various levels of public administration (municipal, state, and national), government agencies (National Civil Protection Commission), and an expert assessment body (National Meteorological Service), which is responsible for analyzing the occurrence and nature of the hydrometeorological phenomenon. In this regard, the issuance of a DISASTER DECLARATION validates the impacts of a natural phenomenon, which are demonstrated through expert assessment. Therefore, these declarations serve as a threshold for determining the vulnerability of human activities and the general population to this phenomenon.
3. For each phenomenon that a DISASTER DECLARATION can generate, “technical verification considerations” are provided; these are clearly defined and aid in the analysis of the phenomenon:
(a) Heavy rainfall or extreme fall: Daily rainfall is considered heavy when, upon comparison with the monthly record of maximum 24 h rainfall—based on historical data available at the representative weather station for the municipality under study—such rainfall exceeds 90% of the values in the sample.
If there is no reference weather station in the area of interest, the rainfall value will be estimated using interpolation techniques based on data from neighboring stations in the region affected by the natural disturbance; furthermore, the estimated magnitude will be verified using satellite imagery and radar data, and its atypical nature will be analyzed in relation to regional statistics.
(b) Tropical cyclones: The Saffir–Simpson scale is utilized for categorizing these phenomena, the heavy rainfall they generate, and winds strong enough to cause damage. Regarding strong winds, the maximum sustained winds are determined in accordance with the World Meteorological Organization’s standards, as recorded by the national observation and measurement network administered by the National Water Commission (CONAGUA).
(c) Flooding: This is defined as the accumulation of water in areas that are not normally submerged, caused by rainfall typical of the affected region within the watershed.
To confirm the occurrence of both riverine and storm flooding, such flooding must be the result of severe or extreme rainfall. Precipitation data generated by the hydroclimatological network will be used, along with synoptic or automated meteorological data and information on water levels and flows in water bodies provided by the national hydrological and hydrometric network administered by CONAGUA.
(d) Snowfall and cold weather (snow and low temperatures in our manuscript): This refers to an event in which the daily temperature is 0 °C or lower and falls at or below the 5th percentile, based on the distribution of extreme minimum temperatures over 30-year periods or existing data series.
To declare a severe frost emergency, in addition to the two conditions mentioned above, the frost must persist for 48 h or more in the affected region.
If there is no weather station in the area of interest, the minimum temperature will be estimated based on data from neighboring CONAGUA weather stations, weather radars, or numerical models.
(e) Drought: This refers to a prolonged period (a season, a year, or several consecutive years) characterized by a precipitation deficit relative to the statistical average over several years (generally 30 years or more). Drought is a normal and recurring feature of the climate; for the purposes of applying these Guidelines, a drought shall be considered severe when (1) the precipitation deficit corresponds to a probability of occurrence equal to or less than ten percent (i.e., such a deficit occurs in one or less than one out of every ten years); or (2) this situation has not occurred five or more times in the last ten years. Furthermore, to assess this situation, rainfall regions are classified according to the Köppen climate classification.
Finally, a DISASTER DECLARATION is to be issued for any of the phenomena described and considered in our study. Spatial thresholds or limits are established based on climatological data for the affected site (temperatures, precipitation, and winds).
Source: Diario Oficial de la Federación (2021). ACUERDO por el que se emiten los Lineamientos de Operación Específicos para atender los daños desencadenados por fenómenos naturales perturbadores. https://dof.gob.mx/nota_detalle_popup.php?codigo=5626531 (accessed 20 February 2026) [21].

References

  1. International Coffee Organization. ICO Statistics; International Coffee Organization: London, UK, 2025; pp. 1–11. [Google Scholar]
  2. SIAP, (Servicio de Información Agroalimentaria y Pesquera). Estadística de Producción Agrícola. Available online: https://nube.agricultura.gob.mx/datosAbiertos/Agricola.php (accessed on 30 September 2024).
  3. Pale-Ezquivel, I.; Musule, R.; Pineda-López, M.D.R.; Alarcón-Gutiérrez, E.; Sánchez-Velásquez, L.R. Temporal Progress of Coffee Leaf Rust and Environmental Conditions Affecting Severity in Veracruz State, Mexico. Coffee Sci. 2023, 18, e182047. [Google Scholar] [CrossRef]
  4. Hernández-Martínez, G.; Vera Espíndola, R.; De la Rosa Portilla, A. El Café de México, 1st ed.; Cafecol A. C.: Xalapa-Enríquez, México, 2019. [Google Scholar]
  5. SPC, (Secretaría de Protección Civil del Estado de Veracruz). Atlas de Riesgos Del Estado de Veracruz. Available online: http://www.atlasnacionalderiesgos.gob.mx/AtlasEstatales/?&NOM_ENT=VeracruzdeIgnaciodelaLlave&CVE_ENT=30 (accessed on 30 November 2025).
  6. Hernández-Martínez, G.; Manson, R.H.; Hernández, A.C. Quantitative Classification of Coffee Agroecosystems Spanning a Range of Production Intensities in Central Veracruz, Mexico. Agric. Ecosyst. Environ. 2009, 134, 89–98. [Google Scholar] [CrossRef]
  7. Sarzynski, T.; Vaast, P.; Rigal, C.; Marraccini, P.; Delahaie, B.; Georget, F.; Nguyen, C.T.Q.; Nguyen, H.P.; Nguyen, H.T.T.; Ngoc, Q.L.; et al. Contrasted Agronomical and Physiological Responses of Five Coffea arabica Genotypes under Soil Water Deficit in Field Conditions. Front. Plant Sci. 2024, 15, 1–15. [Google Scholar] [CrossRef]
  8. Martins, L.D.; Eugenio, F.C.; Rodrigues, W.N.; Brinati, S.V.B.; Colodetti, T.V.; Christo, B.F.; Olivas, D.B.L.; Partelli, F.L.; Amaral, J.F.T.d.; Tomaz, M.A.; et al. Adaptation to Long-Term Rainfall Variability for Robusta Coffee Cultivation in Brazilian Southeast. Am. J. Clim. Change 2018, 7, 487–504. [Google Scholar] [CrossRef]
  9. Bacon, C.M.; Sundstrom, W.A.; Stewart, I.T.; Beezer, D. Vulnerability to Cumulative Hazards: Coping with the Coffee Leaf Rust Outbreak, Drought, and Food Insecurity in Nicaragua. World Dev. 2017, 93, 136–152. [Google Scholar] [CrossRef]
  10. Azzahra, S.; Hamid, A.H.; Nugroho, A.; Zulkarnain; Wahyuni, W. Assessing the Vulnerability of Gayo Coffee Households towards Floods and Landslides in Central Aceh-Indonesia. IOP Conf. Ser. Earth Environ. Sci. 2021, 686, 012016. [Google Scholar] [CrossRef]
  11. CENAPRED, (Centro Nacional de Prevención de Desastres). Sistema de Consulta de Declaratorias. Available online: http://www.atlasnacionalderiesgos.gob.mx/apps/Declaratorias/ (accessed on 22 February 2026).
  12. Valdés-Rodríguez, O.A. Declaratorias de Desastre y Su Afectación En Los Cultivos de Temporal Más Valiosos de Veracruz. Ecosistemas Y Recur. Agropecu. 2025, 12, 1–21. [Google Scholar] [CrossRef]
  13. INEGI, (Instituto Nacional de Estadística y Geografía). Aspectos Geográficos Veracruz; INEGI: Aguascalientes, México, 2022. [Google Scholar]
  14. Pörtner, H.-O.; Roberts, D.C.; Adams, H.; Adelekan, I.; Adler, C.; Adrian, R.; Aldunce, P.E.; Ali, R.A.B.; Friedl, B.B.-; Kerr, R.B.; et al. Climate Change 2022: Impacts, Adaptation and Vulnerability; Pörtner, H.-O., Roberts, D.C., Tignor, M., Poloczanska, E.S., Mintenbeck, K., Alegría, A., Craig, M., Langsdorf, S., Löschke, S., Möller, V., Eds.; Cambridge University Press: Cambridge, UK, 2019; ISBN 9781009157896. [Google Scholar]
  15. Gobierno de México Centro Nacional de Prevención de Desastres. Available online: https://www.gob.mx/cenapred (accessed on 11 March 2025).
  16. Ruiz Barradas, A.; Tejeda Martínez, A.; Miranda Alonso, S.; Flores Zamudio, R.H. Climatología. In Atlas del Patrimonio Natural, Histórico y Cultural de Veracruz; Florescano, E., Ortíz Escamilla, J., Eds.; Gobierno del Estado de Veracruz: Xalapa, Mexico, 2010; pp. 65–84. ISBN 9786079513153. [Google Scholar]
  17. Gasperín-García, E.M.; Platas-Rosado, D.E.; Zetina-Córdoba, P.; Vilaboa-Arroniz, J.; Dávila, F.M. Calidad de Vida de Los Cafeticultores En Las Altas Montañas de Veracruz, México. Agron. Mesoam. 2022, 34, 50163. [Google Scholar] [CrossRef]
  18. Hernández-Solabac, J.A.M.; Nava-Tablada, M.E.; Díaz-Cárdenas, S.; Pérez-Portilla, E.; Escamilla-Prado, E. Migración Internacional y Manejo Tecnológico Del Café En Dos Comunidades Del Centro de Veracruz. Trop. Subtrop. Agroecosystems 2011, 14, 807–818. [Google Scholar]
  19. Quiróz-Guerrero, I.; Pérez-Vázquez, A.; Velasco-Velasco, J.; Benitez-Badillo, G. Resiliencia Del Agroecosistema Café Ante El Cambio Climático. Trop. Subtrop. Agroecosystems 2022, 25, 1–10. [Google Scholar]
  20. Parada-Molina, P.C.; Cerdán-Cabrera, C.R.; Cervantes-Pérez, J.; Barradas, V.L.; Ortiz-Ceballos, G.C. Impact of Climate on Water Status, Growth, Yield, and Phenology of Coffee (Coffea arabica) Plants in the Central Region of the State of Veracruz, Mexico. PLoS ONE 2025, 20, e0319670. [Google Scholar] [CrossRef]
  21. SSPC, (Secretaría de Seguridad y Protección Ciudadana). ACUERDO Por El Que Se Emiten Los Lineamientos de Operación Específicos Para Atender Los Daños Desencadenados Por Fenómenos Naturales Perturbadores. D. Of. De La Fed. 2021. Available online: https://dof.gob.mx/nota_detalle_popup.php?codigo=5626531 (accessed on 20 February 2026).
  22. SMN, (Servicio Meteorológico Nacional). Información Estadística Climatológica. Available online: https://smn.conagua.gob.mx/es/climatologia/informacion-climatologica/informacion-estadistica-climatologica (accessed on 30 October 2024).
  23. INEGI, (Instituto Nacional de Estadística y Geografía). Biblioteca Digital de Mapas. Available online: https://www.inegi.org.mx/app/mapas/ (accessed on 14 January 2026).
  24. INEGI, (Instituto Nacional de Estadística y Geografía). Censo Agropecuario 2022. Available online: https://www.inegi.org.mx/programas/ca/2022/#tabulados (accessed on 16 December 2025).
  25. SIAP, (Servicio de Información Agroalimentaria y Pesquera). Panorama Agroalimentario. La Ruta de La Transformación Agroalimentaria 2018–2024; Ornelas Ruíz, P., Ed.; Secretaría de Agricultura y Desarrollo Rural: Mexico City, Mexico, 2024. [Google Scholar]
  26. WMO, (World Meteorological Organization). Guide to Climatological Practices, 100th ed.; World Meteorological Organization: Geneva, Switzerland, 2023; ISBN 978-92-63-10100-6. [Google Scholar]
  27. INEGI, (Instituto Nacional de Estadística y Geografía). Mapa Topográfico de Veracruz de Ignacio de La Llave. Available online: https://www.inegi.org.mx/app/mapas/ (accessed on 10 January 2024).
  28. Pörtner, H.-O.; Roberts, D.C.; Adams, H.; I. Adelekan, C.A.; Adrian, R.; Aldunce, P.; Ali, E.; Begum, R.A.; BednarFriedl, B.; Kerr, R.B.; et al. 2022: Technical Summary; Pörtner, H.-O., Roberts, D.C., Tignor, M., Poloczanska, E.S., Mintenbeck, K., Alegría, A., Craig, M., Langsdorf, S., Löschke, S., Möller, V., Eds.; Cambridge University Press: Cambridge, UK, 2019; ISBN 9781009157896. [Google Scholar]
  29. Dias, C.G.; Martins, F.B.; Martins, M.A. Climate Risks and Vulnerabilities of the Arabica Coffee in Brazil under Current and Future Climates Considering New CMIP6 Models. Sci. Total Environ. 2024, 907, 167753. [Google Scholar] [CrossRef]
  30. IPCC, (Intergovernmental Panel on Climate Change). AR6 Synthesis Report. Available online: https://www.ipcc.ch/report/ar6/syr/summary-for-policymakers (accessed on 11 February 2026).
  31. Il Choi, H. Assessment of Aggregation Frameworks for Composite Indicators in Measuring Flood Vulnerability to Climate Change. Sci. Rep. 2019, 9, 19371. [Google Scholar] [CrossRef] [PubMed]
  32. Ruiz-García, P.; Monterroso-Rivas, A.I.; Conde-Álvarez, A.C. Nature-Based Solutions Contribute to Improve the Adaptive Capacity of Coffee Farmers: Evidence from Mexico. Agriculture 2025, 15, 1390. [Google Scholar] [CrossRef]
  33. Rubiano-Guzmán, M.J.; Bonilla-Moheno, M.; López-Binnqüist, C.; Zabala, A.; Arnés, E.; Rivera-Núñez, T. Perceptions, Sustainability and Forest Cover Associated to Public Programs for Coffee Production in the Sierra de Zongolica, Mexico. Land Use Policy 2026, 165, 107978. [Google Scholar] [CrossRef]
  34. Badillo-Márquez, A.E.; Aguilar-Lasserre, A.A.; Miranda-Ackerman, M.A.; Sandoval-González, O.O.; Villanueva-Vásquez, D.; Posada-Gómez, R. An Agent-Based Model-Driven Decision Support System for Assessment of Agricultural Vulnerability of Sugarcane Facing Climatic Change. Mathematics 2021, 9, 3061. [Google Scholar] [CrossRef]
  35. Monterroso Rivas, A.I.; Conde Álvarez, C.; Gómez Diaz, J.D.; Gay Garcia, C.; Villers Ruiz, L.; López García, J. Sensitivity of Mexico’s Farmers: A Sub National Assessment of Vulnerability to Climate Change. In Climate Change—Socioeconomic Effects; InTech: London, UK, 2011; pp. 325–340. [Google Scholar]
  36. INEGI, (Instituto Nacional de Estadística y Geografía). Edafología. Available online: https://www.inegi.org.mx/temas/edafologia/ (accessed on 12 February 2023).
  37. Unigarro, C.A.; Cayón Salinas, D.G.; León-Burgos, A.F.; Flórez-Ramos, C.P. Flowering and Fruiting of Coffea arabica L.: A Comprehensive Perspective from Phenology. Plants 2025, 14, 3396. [Google Scholar] [CrossRef]
  38. Lara-Estrada, L.; Sucar, L.E.; Rasche, L. Inferring Multiple Coffee Flowerings in Central America Using Farmer Data in a Probabilistic Model. Ecol. Inform. 2024, 79, 102434. [Google Scholar] [CrossRef]
  39. Segob, S.d.G.d.M. Nota Metodológica. Available online: http://www.atlasnacionalderiesgos.gob.mx/apps/Declaratorias/# (accessed on 21 August 2023).
  40. NOAA (National Oceanic and Atmospheric Administration). Historical Hurricane Tracks. Available online: https://coast.noaa.gov/hurricanes/#map=5.51/20.377/-94.026&search=eyJzZWFyY2hTdHJpbmciOiJWZXJhY3J1eiwgTcOpeGljbyIsInNlYXJjaFR5cGUiOiJnZW9jb2RlZCIsIm9zbUlEIjoiMjQxNTc2MSIsImNhdGVnb3JpZXMiOlsiSDUiLCJINCIsIkgzIiwiSDIiLCJIMSIsIlRTIiwiVEQiXSwieWVhcnMiOlsiMjAyM (accessed on 5 January 2024).
  41. SMN, (Servicio Meteorológico Nacional). Ciclones Tropicales En El Oceano Atlántico y Pacífico. Available online: https://smn.conagua.gob.mx/es/ciclones-tropicales/informacion-historica (accessed on 8 September 2023).
  42. Schroth, G.; Laderach, P.; Dempewolf, J.; Philpott, S.; Haggar, J.; Eakin, H.; Castillejos, T.; Moreno, J.G.; Pinto, L.S.; Hernandez, R.; et al. Towards a Climate Change Adaptation Strategy for Coffee Communities and Ecosystems in the Sierra Madre de Chiapas, Mexico. Mitig. Adapt. Strateg. Glob. Change 2009, 14, 605–625. [Google Scholar] [CrossRef]
  43. Thompson, J.; Lugo, A.E.; Thomlinson, J. Land Use History, Hurricane Disturbance, and the Fate of Introduced Species in a Subtropical Wet Forest in Puerto Rico. Plant Ecol. 2007, 192, 289–301. [Google Scholar] [CrossRef][Green Version]
  44. Arellano Guerrero, F.N.; Farías Nuñez, O.A.; Gómez Camacho, J.; López, H.R.; López Trujillo, J.A.; López Quiroz, M.; Loranca Domínguez, Y.; Lunagomez Cruz, D.; Ojeda Lerma, Z.; Pascual Ramirez, R.; et al. Reporte Anual Del Clima En México 2024; Comisión Nacional del Agua: México City, México, 2024. [Google Scholar]
  45. Batista-Santos, P.; Lidon, F.C.; Fortunato, A.; Leitão, A.E.; Lopes, E.; Partelli, F.; Ribeiro, A.I.; Ramalho, J.C. The Impact of Cold on Photosynthesis in Genotypes of Coffea Spp.—Photosystem Sensitivity, Photoprotective Mechanisms and Gene Expression. J. Plant Physiol. 2011, 168, 792–806. [Google Scholar] [CrossRef]
  46. Salas-Martínez, F.; Valdés-Rodríguez, O.A.; Palacios-Wassenaar, O.M.; Márquez-Grajales, A.; Rodríguez-Hernández, L.D. Methodological Estimation to Quantify Drought Intensity Based on the NDDI Index with Landsat 8 Multispectral Images in the Central Zone of the Gulf of Mexico. Front. Earth Sci. 2023, 11, 1027483. [Google Scholar] [CrossRef]
  47. Salas-Martínez, F.; Valdés-Rodríguez, O.A.; Palacios-Wassenaar, O.M.; Márquez-Grajales, A. Analysis of the Evolution of Drought through SPI and Its Relationship with the Agricultural Sector in the Central Zone of the State of Veracruz, Mexico. Agronomy 2021, 11, 2099. [Google Scholar] [CrossRef]
  48. SMN, (Servicio Meteorológico Nacional). Monitor de Sequía En México. Available online: https://smn.conagua.gob.mx/es/climatologia/monitor-de-sequia/monitor-de-sequia-en-mexico (accessed on 22 February 2026).
  49. Gabriel-Hernández, L.; Barradas, V.L. Panorama of Coffee Cultivation in the Central Zone of Veracruz State, Mexico: Identification of Main Stressors and Challenges to Face. Sustainability 2024, 16, 802. [Google Scholar] [CrossRef]
  50. Altamirano, G.N.; Rico, B.C.; Cruz, M.A.G.; Rindermann, R.S.; Hernández, S.C.; Baeza, J.L.; Rosa, E.G.d.l.; Reyes, U.I.L.; Hernández, A.M. Intensificación de La Producción En La Agricultura Orgánica: Caso Café. Rev. Mex. De Cienc. Agrícolas 2014, 5, 163–169. [Google Scholar] [CrossRef]
  51. Rahn, E.; Bunn, C.; Craparo, A. Projected Shifts in Coffee Production and Sustainability Due to Climate Changes. In Advances in Botanical Research; Academic Press: Cambridge, MA, USA, 2025; Volume 114, pp. 559–588. ISBN 9780443222948. [Google Scholar]
  52. DaMatta, F.M.; Avila, R.T.; Cardoso, A.A.; Martins, S.C.V.; Ramalho, J.C. Physiological and Agronomic Performance of the Coffee Crop in the Context of Climate Change and Global Warming: A Review. J. Agric. Food Chem. 2018, 66, 5264–5274. [Google Scholar] [CrossRef] [PubMed]
  53. Irizarry, A.D.; Collazo, J.A.; Vandermeer, J.; Perfecto, I. Coffee Plantations, Hurricanes and Avian Resiliency: Insights from Occupancy, and Local Colonization and Extinction Rates in Puerto Rico. Glob. Ecol. Conserv. 2021, 27, e01579. [Google Scholar] [CrossRef]
  54. Vega-Camarena, J.P.; Brito-Castillo, L.; Farfán, L.M.; Avalos-Cueva, D.; Palacios-Hernández, E.; Monzón, C.O. Evaluation of the CHIRPS Database in Association with Major Hurricanes in Mexico. Atmosphere 2026, 17, 118. [Google Scholar] [CrossRef]
  55. Aceves Navarro, L.A.; Rivera Hernández, B.; López Castañeda, A.; Palma López, D.J.; González Mancillas, R.; Juárez López, J.F.; Aceves Navarro, L.A.; Rivera Hernández, B.; López Castañeda, A.; Palma López, D.J.; et al. Áreas Potenciales y Vulnerabilidad Del Cultivo de Café Tipo Robusta (Coffea Canephora P.) Al Cambio Climático En El Estado de Tabasco, México. Nova Sci. 2018, 10, 369–396. [Google Scholar] [CrossRef]
  56. Fachruddin, F.; Pramulya, R.; Ariska, N.; Aulia, M.R.; Dahlan, D. Education and Vulnerability Strategies of Coffee Farmers in Facing the Climate Change in Kekuyang Village, Aceh Tengah District. Bul. Pengabdi. Bull. Community Serv. 2025, 5, 11–18. [Google Scholar] [CrossRef]
  57. Hylander, K.; Nemomissa, S.; Fischer, J.; Zewdie, B.; Ayalew, B.; Tack, A.J.M. Lessons from Ethiopian Coffee Landscapes for Global Conservation in a Post-Wild World. Commun. Biol. 2024, 7, 714. [Google Scholar] [CrossRef]
  58. Sánchez-Morales, L.P.; Valdés-Rodríguez, O.A. Estimación y Valoración Económica de CO2 Mediante Software I-Tree En Agroecosistemas Cafetaleros de Veracruz, México. Trop. Subtrop. Agroecosystemas 2025, 28, 48. [Google Scholar] [CrossRef]
  59. Tebkew, M.; Asfaw, Z.; Worku, A. The Role of Agroforestry Systems for Addressing Climate Change Livelihood Vulnerability of Farmers of Northwestern Ethiopia. Heliyon 2024, 10, e36196. [Google Scholar] [CrossRef]
  60. IPCC, (Intergovernmental Panel on Climate Change). Interactive Atlas. In Climate Change 2021—The Physical Science Basis; Cambridge University Press: Cambridge, UK, 2025; pp. 1927–2058. [Google Scholar]
  61. Gómez-González, R.; Palma-López, D.J.; Obrador-Olan, J.J.; Ruiz-Rosado, O.; Gómez-González, R.; Palma-López, D.J.; Obrador-Olan, J.J.; Ruiz-Rosado, O. Densidad Radical y Tipos de Suelos En Los Que Se Produce Café (Coffea arabica L.) En Chiapas, México. Ecosistemas Y Recur. Agropecu. 2018, 5, 203–215. [Google Scholar] [CrossRef]
  62. Luna-Díaz-Peón, A.; Valdés-Rodríguez, O.A. Implicaciones de Las Bases de Datos Climatológicas Del Estado de Veracruz Sobre Investigaciones de Cambio Climático: Tres Estudios de Caso. Quehacer Científico En Chiapas 2019, 14, 15–20. [Google Scholar]
  63. Luna Díaz Peón, A.; Valdes Rodríguez, O.A.; Solís Villanueva, J. Información Climatológica de Veracruz, México. In Sustentabilidad del Desarrollo: Desafíos y Propuestas; Herández Cortés, N., Nava Tablada, M., Ruelas Monjardín, L., Eds.; Gobierno del Estado de México: Xalapa, Mexico, 2018; pp. 163–173. ISBN 9786077253518. [Google Scholar]
  64. Nazario-Lezama, N.; Estrella-García, A.G.; Ramírez-Martínez, A.; Sánchez-Hernández, S.; Osorio-Acosta, F. Factors That Affect the Productive Conversion of Coffea arabica to Citrus Latifolia in N Tlaltetela, Veracruz, Mexico. Trop. Subtrop. Agroecosystems 2025, 2, 28. [Google Scholar] [CrossRef]
  65. Rojas Herrera, J.J.; Olguín Pérez, A.M. Origen, Desarrollo y Perspectivas de Las Cooperativas Cafetaleras de Huatusco, Veracruz. LiminaR Estud. Soc. Y Humanísticos 2018, 16, 119–133. [Google Scholar] [CrossRef][Green Version]
Figure 2. Disasters caused by hydrometeorological events in the municipalities cultivating coffee from 2003 to 2024. Source: elaborated by the authors with data from CENAPRED [11].
Crops 06 00050 g002
Figure 3. Agroclimatic conditions (AD) and disasters caused by hydrometeorological events (EI) in municipalities cultivating coffee from 2003 to 2024. Source: elaborated by the authors with data from INEGI [23], SMN [22], and CENAPRED [11].
Crops 06 00050 g003
Figure 4. Correlations between production surface rate, yield, and volume with disaster declarations due to hydrometeorological events. The * indicates significant correlations (p < 0.05). Source: elaborated by the authors with data from SIAP [2] and CENAPRED [11].
Crops 06 00050 g004
Figure 5. Vulnerability levels between production surface rate, yield, and volume with disaster declarations due to hydrometeorological events. Source: elaborated by the authors.
Crops 06 00050 g005
Figure 7. (A) Total vulnerability of coffee crops to hydrometeorological events. (B) Damage caused by drought to other regional crops. (C) Damage caused by snow and low temperatures to regional crops. (D) Damage caused by floods to regional crops. (E) Damage caused by tropical cyclones to regional crops during the last 10 years. Source: elaborated by the authors.
Crops 06 00050 g007
Table 1. Sen’s slope of meteorological data from the 35 available stations in the region.
VariableAccumulated PrecipitationMaximum TemperatureMinimum Temperature
Positive trends152118
Negative trends171417
No trends300
Number of significant positives01117
Number of significant negatives0410
The lower numbers indicate that these data were not available at the meteorological station or that the Sen’s slope was not calculated due to incomplete data.
Table 2. Correlation between the frequency of phenomena and their vulnerability values.
PhenomenonExtreme RainfallTropical CycloneFloodSnow and Low TemperatureDrought
Production DataN ρ p_ValueN ρ p_ValueN ρ p_ValueN ρ p_ValueN ρ p_Value
Harvested
area ratio
200.4200.065250.856 *0.00050.6320.2526−0.812 *0.049160.614 *0.011
Yield230.529 *0.009350.560 *0.00060.845 *0.03460.1770.624210.890 *0.000
Volume210.479 *0.028330.679 *0.00050.7070.1825−0.3000.738190.893 *0.000
* Indicates statistical significance (p < 0.05), N: number of municipalities with vulnerability, ρ : Spearman rank correlation.
Table 3. Spearman correlations between vulnerability of coffee production, agricultural disasters from the National Census, and forest surfaces in municipalities.
Coffee Crops% of Disasters in the National Agricultural Census
Harvested Area RatioYieldVolumeDroughtFloodsHurricanesSnow and Low Temperature% of Forested Surface
0.017−0.226 *−0.1880.0130.1130.359 *−0.230 *−0.104
* Indicates statistical significance (p < 0.05). % The percentage of disasters is related to the total agricultural products that each municipality cultivates [24].
Disclaimer/Publisher’s Note: The statements, opinions and data contained in all publications are solely those of the individual author(s) and contributor(s) and not of MDPI and/or the editor(s). MDPI and/or the editor(s) disclaim responsibility for any injury to people or property resulting from any ideas, methods, instructions or products referred to in the content.