Abstract
Rice is an indispensable crop in East and Southeast Asia, and the study of its biological characteristics has important value. We observed that different cultivars of rice have different levels of resistance to the brown planthopper (BPH), Nilaparvata lugens. In this study, transcriptome sequencing was used to analyze the differentially expressed genes (DEGs) of three rice varieties caused by BPH damage combined with physical stimulation and controls. We performed weighted correlation network analysis (WGCNA) and found a module positively related to physical stimulation. KEGG analysis showed that this module is strongly related to the ribosome pathway. Through comparative analysis with controls, we found the differential genes of each cultivar after BPH damage; through trend analysis, we found the differential genes shared by the three varieties after BPH damage. The KEGG/GO enrichment analysis of these genes found that they are mainly functionally concentrated in signal transduction, redox reactions, etc. The results of this research will be helpful to study the molecular mechanism of the BPH-rice interaction, identify resistance genes, and facilitate further studies on molecular resistance breeding and pest control.
1. Introduction
Rice (Oryza sativa L.) is one of the most important food crops. It has a long history of cultivation and consumption and is a primary source of food for more than half the world’s population. [1,2,3]. It is reported that rice is the third most produced crop in the world, after sugarcane and maize [4]. The brown planthopper (BPH), Nilaparvata lugens (Stål), a monophagous phytophagous insect, is acknowledged as one of the most important pests of rice [5,6]. The BPH is a piercing and sucking insect that sucks the juice from the phloem of rice sheath tissue, and it transmits viruses associated with grassy stunt and ragged stunt diseases, which could lead to millions of tons of rice being damaged or even complete losses [7,8,9]. In view of the importance of rice, BPH control has long attracted serious attention from farmers, governments, and agricultural researchers. Various pest control strategies, including agricultural, chemical, and biological control have been used for BPH management [10,11,12]. However, the most effective strategy for managing the BPH is the use of chemical insecticides. Despite their high efficacy, the overuse of these insecticides has led to the development of insect resistance and environmental pollution. Thus, there is an urgent need to develop a new, safe, and environmentally friendly pest management strategy.
A multi-layered approach that includes chemical, physical, biological, and genetic methods has been developed to enhance rice resistance to the BPH [13,14]. The BPH shows wing dimorphism for both sexes: adults with full wings (macropterous form) and adults with truncated wings (brachypterous form) [15,16]. Macropterous adults are potential migrants and are responsible for colonizing new fields. Their migrations, however, are influenced by a number of factors, such as food, geography, and meteorological factors [17,18]. Therefore, it is difficult to accurately forecast when and where the migrants will land, and once the migrants settle down and produce the next generation of BPHs in a non-resistant rice field, economic loss will be inevitable. Hence, we believe BPH-resistant rice breeding is one of the best control methods.
Host-plant resistance (HPR) is a result of co-evolution and has played an important role in integrated pest management (IPM) [19,20,21,22]. HPR affects the host selection process or makes plants less suitable than normal plants for insect growth, survival, or reproduction [23,24,25]. Depending on whether the causal factors are internal or external stimuli, resistance can be divided into constitutive resistance and induced resistance [26]. As phloem-feeding insects, BPHs stay at the base of the rice tillers, probe into the phloem with their piercing/sucking mouthpart, release saliva secretions, and suck the plant sap [27,28]. In BPH-resistant rice, with the exception of constitutive resistance, physical probing, sucking, and salivary secretions are all capable of triggering induced resistance [29,30].
Transcriptome analysis has been shown to be an effective approach to detecting plant–insect interactions. Many transcriptome studies have analyzed the response of rice to BPH invasion. Li et al. compared the gene expression differences before and after infection with BPHs of the resistant rice variety “Rathu Heenati”; a total of 23 anti-BPH candidate genes were screened out from the analysis of expression patterns, and the SA content was significantly increased after infection with BPHs [31]. By comparing the differences in gene changes caused by BPH and striped stem borer (SSB) infestation in rice, multiple signaling pathways and gene expression patterns, including phytohormone biosynthesis, signal transduction, secondary metabolites, defense responses, and transcription factors, were found to be significantly different [32]. Studying the different types of responses induced by the BPH in rice plants will help us further understand the molecular mechanisms of pest recognition, response, and activation of different signaling pathways.
In this study, to investigate BPH resistance in different rice cultivars at the RNA level, we generated transcriptomic data for three rice cultivars, namely, Guanghui 308 (GH308, an insect-resistant cultivar), Yuehe Simiao (HR05, an insect-resistant cultivar), and TN1 (a highly susceptible rice cultivar). These RNA sequence reads were intended to provide new data to analyze BPH resistance in different rice varieties.
2. Materials and Methods
2.1. Insects and Plants
The BPH strain was originally collected in 2018 from a rice field in Fuzhou, Fujian Province, China, and was maintained in insect-proof greenhouses at 28 ± 1 °C under a 14:10 photoperiod, and 60 ± 5% relative humidity on TN1 rice plants. Nine rectangular plastic basins (length: 40 cm; width: 20 cm; height: 10 cm) filled with soggy soil were set up. In each basin, thirty seeds of GH308, HR05, and TN1 were planted in the soil and arranged in three lines, as shown in Figure 1. To ensure 100% emergence, all tested seeds were healthy and soaked in water for 24 h before sowing. The nine basins of seeds were grown in a greenhouse for 10 days to two leaves.
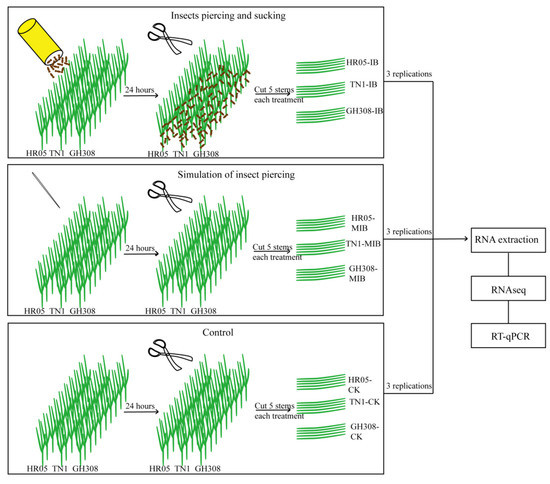
Figure 1.
Experimental flow chart. Sample collection, transcriptome sequencing, and bioinformatics analysis. Three rice cultivars (GH308, HR05, and TN1) were exposed to BPH feeding and subjected to mechanical damage to simulate insect piercing, or kept unharmed (control). After 24 h, the stems were collected for transcriptome analysis (n = 3).
2.2. Sample Collection
The 9 basins of seedlings were divided into three groups—two treatments and one control,—and set up as follows: In group 1, for each basin, 300 BPH nymphs (3rd–4th instar) were released and allowed to freely move and feed on the 30 seedlings for the next 24 h. Then, five stems of each rice cultivar were cut, put into three cryo tubes and quickly stored in a −80 °C refrigerator. The tubes were labeled GH308-IB, HR05-IB, and TN1-IB. In group 2, the stems of each seedling were pricked 10 times randomly every hour for 24 h, as a simulation of insect piercing, and then five stems of each rice cultivar were cut, put into three cryo tubes, and quickly stored in a −80 °C refrigerator (labeled GH308-MIB, HR05-MIB, and TN1-MIB). In group 3, the last three basins were not subjected to any treatment and were designated as controls. After 24 h, the stems were collected as described above (labeled GH308-CK, HR05-CK, and TN1-CK) (Figure 1).
2.3. RNA Extraction and Sequencing
The total RNA of rice stems was isolated by using TRIzolTM Reagent (Invitrogen, CA, USA) and treated with DNase I (RNase-free) (Novagen, Shanghai, China) according to the manufacturer’s instructions. Stringent RNA quality control (RNA integrity number, purity, and concentration) was analyzed using an Agilent 2100 Bioanalyzer. Then, the total RNA was sent to QianTang Biotech Co. Ltd. (Suzhou, China) for sequencing.
The total RNA (more than 2 μg) extracted from each sample was used to construct the cDNA libraries. Firstly, polyadenylated RNAs (mRNAs) were purified and retrieved using magnetic beads coated with poly-T oligo. Then, the mRNAs were fragmented and subjected to reverse transcription. Lastly, a single “A” base was added to the dscDNAs, and specific Illumina adapters were ligated to the repaired ends. Fragments of about 200 bp were purified and retrieved from the gels. The fragments were enriched via PCR to construct the fragmented cDNA library, and the Illumina Novaseq6000 was used for sequencing. The quality values and information of PE reads were generated using base-calling procedures and Illumina sequencing by synthesis.
2.4. Quality Control and Correlation Analysis of Transcriptome Data
The data volume and quality of each sample met the normal transcriptome data quality standards (Table S1) [33,34]. In order to evaluate the reliability of the transcriptome data, we used the correlation function in the R statistical language to conduct a Pearson correlation test, which was used to evaluate the differences within the sample group. The color depth indicates the strength of the correlation. Correlation coefficients ranging from 0.8–1.0 represent an extremely strong correlation; those ranging from 0.6–0.8 represent a strong correlation; those ranging from 0.4–0.6 represent a moderate correlation; and those ranging from 0.2–0.4 represent a weak correlation. The correlations within the sample group were all greater than 0.75, indicating that the biological replicate samples within the group had a high level of consistency (Figure 2).
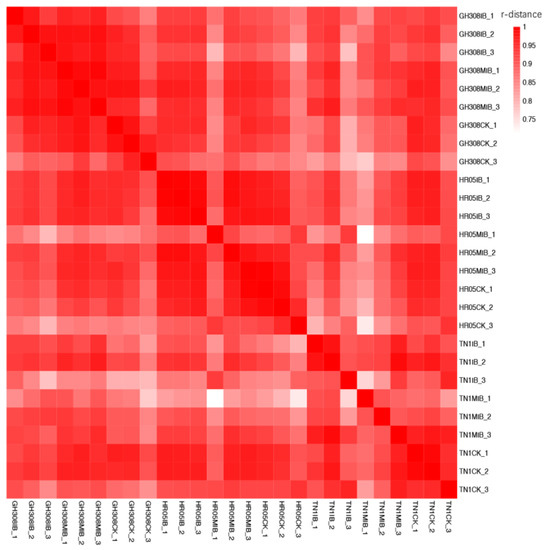
Figure 2.
Correlation heat map of all samples. The dark red color indicates a high level of correlation between samples, while the white color indicates a low ratio of correlation.
2.5. Transcriptome Analysis
The FastQC21 program was used to control the quality of the raw data and produce statistics about the size and quality data. Illumina adapters and RNA-seq reads with low quality were trimmed using trimmomatic (https://www.bioinformatics.babraham.ac.uk/projects/fastqc/) (accessed on 1 May 2022). After filtering, clean reads were aligned to the Nipponbare reference genome using HiSAT23. The resulting BAM files were subjected to the HTseq program 24 for read counting. Differentially expressed genes (DEGs) were identified with the DEseq2 package, with the following cutoffs: |logFC| > 2, Padj < 0.05, and FDR < 0.05.
Finally, the functional implications of these differentially expressed genes were investigated using Gene Ontology (GO) and the Kyoto Encyclopedia of Genes and Genomes (KEGG). For GO annotation, three aspects of gene function were tested: molecular function, cellular component, and biological process. After that, based on the KEGG database, which integrates genomic, chemical, and system function information, we linked genes to macrosystem functions and visualized the analysis results.
2.6. Trend and WGCNA Analysis
The OmicShare online trend analysis tool (https://www.omicshare.com/tools/Home/Soft/trend) (accessed on 15 May 2022) was used to analyze the trends of the above-mentioned differential genes. The parameter settings were as follows: the number of trends was 20; the data were preprocessed with log2; the p-value for significant trends was 0.05; and the fold change was 2.
The WGCNA R package was used to perform weighted analysis on all genes. The procedure is as follows: import the FPKM list and corresponding phenotype data list; check and filter the FPKM list; and remove rows that contain invalid values or whose mean FPKM is less than 0.5; screen the β values (1–30) and construct a proximity matrix and a topological matrix; use the dissimilarity between genes to cluster genes; and then use the dynamic cutting method to cut the tree into different modules (the minimum number of genes in each module is 30) and merge the modules.
2.7. Real-Time Fluorescence Quantitative PCR
In order to verify the accuracy of our RNA-seq analysis. An AP2 domain-containing protein gene (forward: 5′-TGTATGGTCCCACAGCACG-3′; reverse: 5′-CATTAGCCACGATGAAAGG-3′) and a Sub1C gene (forward: 5′-CGGCAACGCCAAGACCAA-3′; reverse: 5′-TCGGAGCAGCACTCGATGAG-3′) were randomly selected for qRT-PCR analysis. The total RNA (1 μg) of each sample was used for qRT-PCR analysis with the PrimeScript® RT reagent Kit following the instructions (Takara, Dalian, China), and the actin gene (forward: 5′-TATTGTCAACAACTGGGATG-3′; reverse: 5′-TCATAGGAGCCTCGGTCA-3′) was used as a housekeeping gene. The TB Green Premix Ex TaqTM Ⅱ (Takara) was used for the qRT-PCR, with the following protocol: 94 °C for 3 min, 94 °C for 20 s for 40 cycles, and 60 °C for 34 s in the real-time PCR system. The 2−ΔΔt method was used for the relative quantification of genes.
3. Results
3.1. Identification of DEGs in Response to BPH
To investigate the difference between BPH-damaged rice samples and control samples (CKs) without any treatment, DEGs were identified by comparing BPH-damaged rice samples to control samples (CKs) without any treatment. In GH308, 2527 genes were differentially expressed in BPH-damaged samples compared to CK, of which 446 genes were up-regulated and 2081 genes were down-regulated. In HR05, 1962 genes were differentially expressed, of which 919 were up-regulated and 1043 were down-regulated. In addition, 584 genes showed differential expression in TN1, of which 132 were up-regulated and 452 were down-regulated (Figure 3). Then, we performed KEGG analysis on the DEGs of the three rice cultivars. It was shown that BPH-damaged rice samples had many significantly differentially expressed genes, and the differences in the number of varied genes were also significantly different among the three rice cultivars (Tables S2–S4).
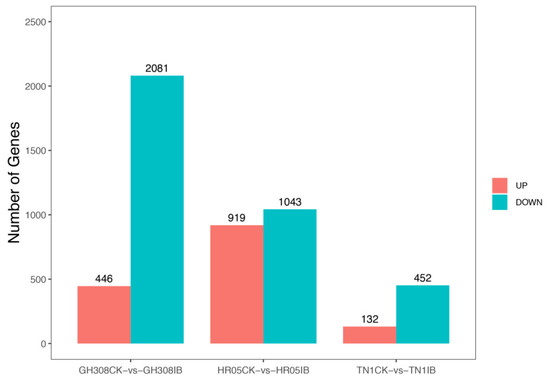
Figure 3.
Statistics of differentially expressed genes in response to BPH stress.
3.2. Consistently Regulated Genes in the Three Rice Cultivars under BPH Stress
To identify consistently regulated genes that might be related to BPH resistance, the aforementioned genes were subjected to trend analysis. These genes were enriched into 20 model gene sets, 2 of which showed consistent up-regulation (Figure 4a) or down-regulation (Figure 4b) patterns in response to the BPH across all of the tested rice cultivars. However, other gene sets showed inconsistent responses to the BPH in all three rice cultivars, with some of them being up-regulated, some down-regulated, and some unchanged (Figure 4c–f). A total of 235 protein-coding genes were up-regulated after BPH damage in Module a, while 689 genes were down-regulated in Module b. In the analysis of up-regulated genes (Padj < 0.05), some were enriched at the molecular function level, most of which are related to redox reactions, such as GO: 0016684 oxidoreductase activity; GO: 0004601 peroxidase activity, acting on peroxide as acceptors; and GO: 0016209 antioxidant activity. Some were enriched at the biological process level, mainly focusing on the redox reaction process and cell detoxification, such as GO: 0097237 cellular response to toxic substance; GO: 1990748 cellular detoxification; GO: 0042744 hydrogen peroxide catabolic process; GO: 0017001 antibiotic catabolic process; GO: 0098754 detoxification; GO: 0098869 cellular oxidant detoxification; GO: 0009636 response to toxic substance; and GO: 0042743 hydrogen peroxide metabolic process. In the analysis of down-regulated genes (Padj < 0.05), there was a series of terms related to plant response to stress, such as GO: 0009408 response to heat; GO: 0009266 response to temperature stimulus; GO: 1901700 response to oxygen-containing compound; GO: 0042221 response to chemical; GO: 0042542 response to hydrogen peroxide; GO: 0050896 response to stimulus; GO: 0042493 response to drug; and GO: 0000302 response to reactive oxygen species. KEGG analysis showed (p < 0.05) that the genes of the two modules were enriched in six different pathways, mainly related to signal transduction, organic acid metabolism, and starch and sucrose metabolism (Figure 5a,b).
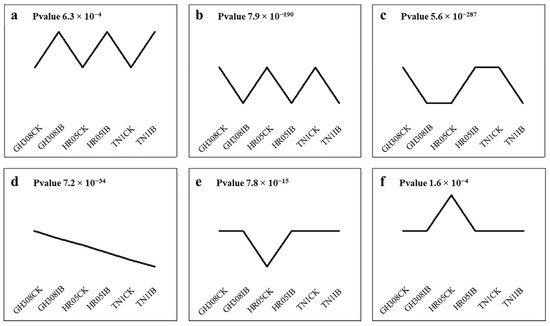
Figure 4.
Six expression patterns (a–f) of DEGs were found in different rice samples. GH308, HR05, and TN1 are the three rice varieties. CK indicates control samples. IB represents rice samples that were infected by BHPs. Each module was statistically significant, with p values < 0.05.
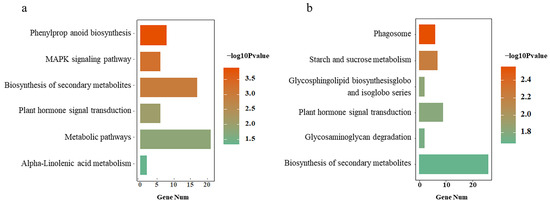
Figure 5.
Functional annotation of consistent DEGs in the three rice varieties. KEGG pathway analysis of 235 up-regulated genes (a) and 689 down-regulated genes (b). The x-axis represents the number of genes in each pathway, and the y-axis shows the top six enriched KEGG pathways. Colors in the bar plots indicate statistical significance in log format.
Transcription factors (TFs) play important roles in the growth and development of plants [32]. We further analyzed the function of TFs in response to the BPH. A total of 73 TFs were identified from the genes that were present in Modules a and b (Figure 6). These genes belong to a series of functionally important TF families, including AP2-EREBP (eight genes), bHLH (eight), MYB (eight), ARF (six), G2-like (four), and NAC (four) (Figure 6). In addition, these TF genes were sorted from high to low according to their average expression level in the tested samples. Notably, the top four genes were consistently up-regulated after BPH treatment. The gene with the highest expression level was a B-box zinc finger family protein with an unknown function. The second gene was OsCOL4, which is a constitutive flowering repressor, and the following two genes were two ethylene-responsive element binding proteins, suggesting that ethylene played an important role in response to the BPH (Table S5).
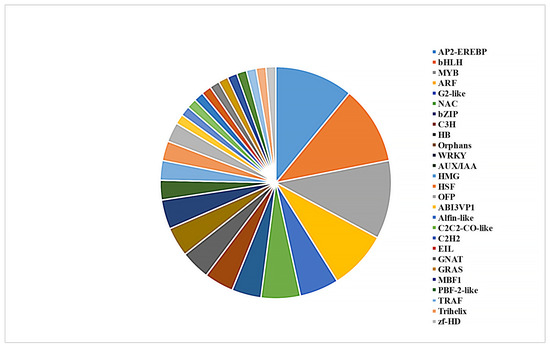
Figure 6.
Identification of differentially expressed transcription factors with consistent expression patterns among the three rice cultivars.
3.3. WGCNA Analysis of Different Experimental Conditions
In order to further study the difference between BPH-damaged, artificially damaged, and control samples, we performed WGCNA analysis on the 27 samples (Figure 7). A total of 23 related gene modules were screened. There was no module with a high correlation with the BPH-damaged samples; however, there was a module with a high correlation with the physically damaged samples (Figure 8). There are 254 genes in this module, and we performed KEGG on the gene list. The KEGG enrichment results show that there is only one pathway related to the ribosome pathway (p < 0.05). There are 254 genes in this module, of which 95 are involved in the ribosomal pathway. This suggests that the process of ribosome synthesis is likely indispensable in the process of physical stimulation.
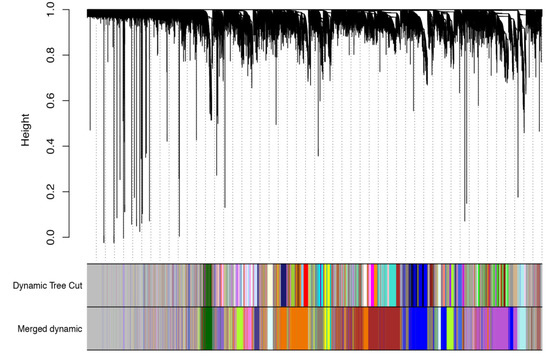
Figure 7.
WGCNA co-expression analysis of 27 rice samples. The upper panel shows gene clusters based on their expression patterns. Genes that cluster in the same clade share a similar expression pattern. The gene clusters are further indicated using different colors in the lower panel.
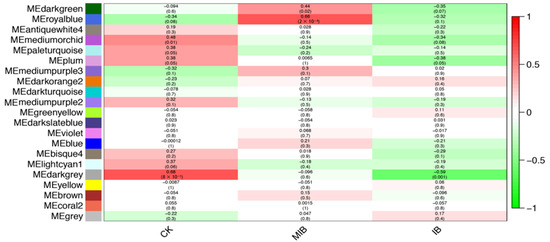
Figure 8.
Correlation between identified co-expression modules and sample treatments. The x-axis includes three different treatments. CK indicates control samples without any treatment. MIB indicates artificially damaged samples without BPH infection. IB indicates rice samples with BPH infection. The y-axis shows different co-expression modules. The color indicates correlation values ranging from −1 to 1. These values are also listed in the upper line of each module block. A higher value indicates a high correlation, and vice versa. In addition, p values are presented in each module block with parentheses citing them.
3.4. Technical Validation
We validated the accuracy of our RNA-seq analysis based on qRT-PCR. An AP2 domain containing protein gene and a Sub1C gene were randomly selected for testing. Our analysis showed that these genes in RNA-seq agreed with the results of the qRT-PCR. The qRT-PCR results and RNA-seq analysis were highly consistent, which supports the accuracy of our analysis (Figure 9).
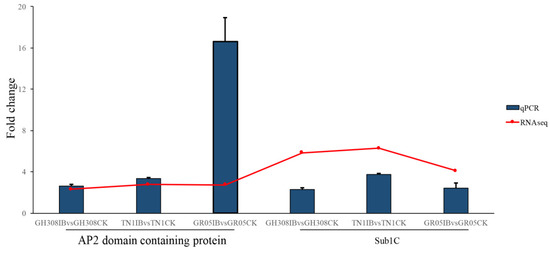
Figure 9.
Validation of RNA-seq results using qRT-PCR. An AP2 domain-containing gene and a Sub1C gene were randomly selected for testing. The blue column represents the fold change of the qPCR quantification of each gene between BPH-treated and control samples, and the red dot represents the fold change of the RNA-seq quantification in the same comparison.
4. Discussion
Pest management is an enormous task around the world, as the increasing risk of pest damage causes public health issues as well as global food shortages due to decreased productivity of key food commodities [22,35]. A series of approaches have been introduced into pest control, including molecular resistance breeding [36,37,38]. The introduction of the Bt protein confers resistance to bollworms, saving millions of dollars in cotton production [39]. However, the genetic modification approach has not been used in rice production in China thus far. Despite the merits of the aforementioned integrated pest control strategies, molecular breeding of pest-resistant cultivars serves as an optimized option to prevent pest damage without introducing new risks for human health.
Rice is one of the most important food resources for humans. The breeding of resistant rice varieties in response to BPH damage is urgently needed. To investigate the potential functional genes that are involved in rice plant responses to BPH damage, we produced and analyzed RNA-seq data collected from three different rice varieties. In response to BPH treatment, a total of 924 genes showed consistent, regulated expression patterns in the three rice varieties. These genes were mainly core genes in rice, involved in basic biological processes such as signal transduction and secondary carbohydrate and glycan metabolism. A similar result was reported by Li et al. [32], who found that both SSB and BPH infestation could induce up-regulation of the SA signal transduction gene NPR1, which can activate the downstream plant defense response. Based on the functional annotation, we speculated that these genes are likely indispensable in transmitting the physical stimuli and chemical signals of the BPH to the metabolic network through a series of signaling pathways. Previous studies showed that plant hormones were essential in response to the BPH [31,32]. Through GO and KEGG analysis, we found that after BPH damage, rice undergoes relatively large changes in the redox reaction, cell wall synthesis, hormone regulation, and signal transduction, and a series of genes that respond to stress are activated. Our research also found that BHP treatment elevated the expression of ethylene-responsive elements at the mRNA level. This result also implies that rice needs a phytohormone-responsive defense response to BPH feeding.
Transcription factors play an important role in regulating gene expression and signaling. In this study, a total of 73 TFs were identified in response to the BPH. These genes belong to a series of functionally important TF families, including AP2-EREBP, bHLH, MYB, ARF, G2-like, NAC, and WRKY. The gene with the highest expression level is a B-box zinc finger family protein with an unknown function. The second gene is OsCOL4, which is a constitutive flowering repressor, and the following two genes are two ethylene-responsive element binding proteins, suggesting that ethylene played an important role in response to the BPH. In recent years, the AP2-EREBP, NAC, MYB, and WRKY TF families have been reported to be associated with herbivorous feeding [40,41,42]. For example, the AP2-EREBP TF family has been shown to positively regulate TrypPI activity and play an important role in rice resistance to chewing-mouthpart insects [43]. Studies on the defense response of Arabidopsis to chewing-mouthpart insects have shown that the MYB TF family is associated with plant resistance to the butterfly (Pieris rapae) [44]. Recent studies have reported that the MYB, G2-like, and NAC TF families may be involved in the insect defense response of rice [32,45]. All these results suggest that AP2-EREBP, MYB, G2-like, NAC, and WRKY may play important roles in rice plant defenses against BPH.
We also observed inconsistent DEGs among the three different rice varieties in response to BPH treatment, including 1689 in GH308, 1352 in HR05, and 66 in TN1. The first enriched KEGG pathways of the DEGs in the three respective rice varieties were secondary metabolite biosynthesis, hormone signal transduction, and brassinosteroid biosynthesis, suggesting that these genes and differentially regulated pathways likely contribute to variety-specific resistance to the BPH. Our research provides a theoretical basis for the screening of resistance genes and the breeding of insect-resistant crops in the future.
5. Conclusions
Transcriptome sequencing and analysis were performed in this study, and we obtained a genome-wide transcript profile of rice damaged by the brown planthopper. Thousands of genes were found to be differentially expressed after BPH damage. Through GO and KEGG analysis, we found that after BPH damage, rice undergoes relatively large changes in the redox reaction, cell wall synthesis, hormone regulation, and signal transduction, and identified TFs (AP2-EREBP, MYB, G2-like, NAC, and WRKY) that may play an important role in rice plant responses to the BPH. However, the molecular function of some genes remains unclear and requires further study. This information will undoubtedly be of great help in the research of the molecular mechanisms of the interaction between the BPH and rice plants and molecular resistance breeding. Furthermore, understanding insect-host interactions is critical to developing new genetic control strategies to reduce the occurrence of insect pests and to taking sustainable and effective measures for pest control and the spread of insect-borne pathogens.
Supplementary Materials
The following supporting information can be downloaded at: https://www.mdpi.com/article/10.3390/crops3010005/s1, Table S1: Description of data quality; Table S2: results of KEGG analysis on the DEGs of the GH308; Table S3: results of KEGG analysis on the DEGs of the HR05; Table S4: results of KEGG analysis on the DEGs of the TN1; Table S5: list of 73 of transcription factors (TFs).
Author Contributions
Conceptualization, L.S. and Z.Z.; methodology, L.S. and H.H.; software, J.Z.; validation, Z.J.; formal analysis, H.H.; investigation, L.S., H.H., J.Z. and Z.J.; resources, Z.Z.; data curation, L.S. and H.H.; writing—original draft preparation, L.S. and H.H.; writing—review and editing, L.S., H.H. and Z.Z.; visualization, L.S.; supervision, L.Q.; project administration, L.Q.; funding acquisition, L.S. and Z.Z. All authors have read and agreed to the published version of the manuscript.
Funding
This research was funded by the special project of the research institutes of basic research and public service in Fujian, China, grant number 2020R1023006, and a project of the Fujian Academy of Agricultural Sciences in Fujian, China, grant number YC2021016.
Data Availability Statement
The data that support the findings of this study are available from the authors upon reasonable request.
Conflicts of Interest
The authors declare no conflict of interest.
References
- Khush, G.S. Green revolution: Preparing for the 21st century. Genome 1999, 42, 646–655. [Google Scholar] [CrossRef] [PubMed]
- Wang, W.; Mauleon, R.; Hu, Z.; Chebotarov, D.; Wing, R.A.; Ruan, J.; Zhang, G.; Wei, C.; Alexandrov, N.; McNally, K.L.; et al. Genomic variation in 3010 diverse accessions of Asian cultivated rice. Nature 2018, 557, 43–49. [Google Scholar] [CrossRef] [PubMed]
- Cheng, F.; Xu, Q.; Xu, Z.J.; Chen, W.F. Effect of rice breeding process on improvement of yield and quality in China. Rice Sci. 2020, 27, 363–367. [Google Scholar] [CrossRef]
- Patel, S.; Singh, C.P. Seasonal incidence of rice stem borer, Scirpophaga incertulas (Walker) on different varieties of rice in relation to weather parameters. J. Entomol. Zool. 2017, 5, 80–83. [Google Scholar]
- Brar, D.S.; Virk, P.S.; Jena, K.K.; Khush, G.S. Breeding for resistance to planthoppers in rice. In Planthoppers: New Threats to the Sustainability of Intensive Rice Production Systems in Asia; International Rice Research Institute: Metro Manila, Philippines, 2009; pp. 401–428. [Google Scholar]
- Haliru, B.S.; Rafii, M.Y.; Mazlan, N.; Ramlee, S.I.; Bashir, Y.R. Recent strategies for detection and improvement of brown planthopper resistance genes in rice: A review. Plants 2020, 9, 1202. [Google Scholar] [CrossRef]
- Cabauatan, P.Q.; Cabunagan, R.C.; Choi, I.R. Rice viruses transmitted by the brown planthopper Nilaparvata lugens (Stål). In Planthoppers: New Threats to the Sustainability of Intensive Rice Production Systems in Asia; International Rice Research Institute: Metro Manila, Philippines, 2009; pp. 357–368. [Google Scholar]
- Cheng, X.Y.; Zhu, L.L.; He, G.C. Towards understanding of molecular interactions between rice and the brown planthopper. Mol. Plant 2013, 6, 621–634. [Google Scholar] [CrossRef]
- Jing, S.L.; Zhao, Y.; Du, B.; Chen, R.Z.; Zhu, L.L.; He, G.C. Genomics of interaction between the brown planthopper and rice. Curr. Opin. Insect Sci. 2017, 19, 82–87. [Google Scholar] [CrossRef]
- Ghosh, A.; Chatterjee, M.L.; Samanta, A. Field evaluation of some new insecticides against brown planthopper Nilaparvata lugens (stål) in rice. J. Entomol. Res. 2010, 34, 35–37. [Google Scholar]
- Prashant, S.T.; Gowda, D. Evaluation of efficacy of insecticides against brown planthopper (bph), Nilaparvata lugens (stal.) in rice ecosystem. Environ. Ecol. 2015, 33, 228–231. [Google Scholar]
- Patil, S.D.; Patil, H.M.; Bhoite, K.D.; Kusalkar, D.V. Evaluation of insecticides against brown plant hopper, Nilaparvata lugens (stal) in rice, Oryza sativa L. J. Pharmacogn. Phytochem. 2020, 9, 1865–1868. [Google Scholar]
- Visarto, P.; Zalucki, M.P.; Nesbitt, H.J.; Jahn, G.C. Effect of fertilizer, pesticide treatment, and plant variety on the realized fecundity and survival rates of brown planthopper, Nilaparvata lugens (Stål) (Homoptera: Delphacidae)-generating outbreaks in Cambodia. J. Asia Pac. Entomol. 2001, 4, 75–84. [Google Scholar] [CrossRef]
- Zhang, X.; Liao, X.; Mao, K.; Zhang, K.; Wan, H.; Li, J. Insecticide resistance monitoring and correlation analysis of insecticides in field populations of the brown planthopper Nilaparvata lugens (Stål) in China 2012–2014. Pestic. Biochem. Phys. 2016, 132, 13–20. [Google Scholar] [CrossRef] [PubMed]
- Xu, H.J.; Xue, J.; Lu, B.; Zhang, X.C.; Zhou, J.C.; He, S.F.; Ma, X.F.; Jiang, Y.Q.; Fan, H.W.; Xu, J.Y.; et al. Two insulin receptors determine alternative wing morphs in planthoppers. Nature 2015, 519, 464–467. [Google Scholar] [CrossRef] [PubMed]
- Xu, H.J.; Zhang, C.X. Insulin receptors and wing dimorphism in rice planthoppers. Phil. Tran. R. Soc. B. 2017, 372, 20150489. [Google Scholar] [CrossRef] [PubMed]
- Qi, H.; Jiang, C.; Zhang, Y.; Yang, X.; Cheng, D. Radar observations of the seasonal migration of brown planthopper Nilaparvata lugens (Stål) in Southern China. Bull. Entomol. Res. 2014, 104, 731–741. [Google Scholar] [CrossRef]
- Bao, Y.X.; Ding, W.W.; Xie, X.J.; Lan, P.; Lu, M.H. Statistical analysis on the influence of the landfalling strong tropical cyclones in the catastrophic migrations of Nilaparvata lugens (Stål) in China. J. Trop. Meteorol. 2014, 1, 8–16. [Google Scholar]
- Sharma, H.C.; Ortiz, R. Host plant resistance to insects: An eco-friendly approach for pest management and environment conservation. J. Environ. Biol. 2002, 23, 111–135. [Google Scholar]
- Savary, S.; Horgan, F.; Willocquet, L.; Heong, K.L. A review of principles for sustainable pest management in rice. Crop Prot. 2012, 32, 54–63. [Google Scholar] [CrossRef]
- Trapero, C.; Wilson, I.W.; Stiller, W.N.; Wilson, L.J. Enhancing integrated pest management in GM cotton systems using host plant resistance. Front. Plant Sci. 2016, 7, 500. [Google Scholar] [CrossRef]
- Véronique, L.; Boissot, N.; Gallois, J.L. Host plant resistance to pests and pathogens, the genetic leverage in integrated pest and disease management. Integr. Pest Dis. Manag. Greenh. Crops 2020, 9, 259–283. [Google Scholar]
- Mookiah, S.; Sivasubramaniam, B.; Thangaraj, T.; Govindaraj, S. Host Plant Resistance. In Molecular Approaches for Sustainable Insect Pest Management; Omkar, Ed.; Springer: Singapore, 2021; pp. 1–56. [Google Scholar]
- Eyles, A.; Bonello, P.; Ganley, R.; Mohammed, C. Induced resistance to pests and pathogens in trees. New Phytol. 2010, 185, 893–908. [Google Scholar] [CrossRef] [PubMed]
- Sandhu, R.K.; Sarao, P.S.; Sharma, N. Antibiosis in wild rice accessions induced by Nilaparvata lugens (Stål) feeding. Phytoparasitica 2020, 48, 801–812. [Google Scholar] [CrossRef]
- Zandt, P.A.V. Plant defense, growth, and habitat: A comparative assessment of constitutive and induced resistance. Ecology 2007, 88, 1984–1993. [Google Scholar] [CrossRef] [PubMed]
- Wang, Y.; Tang, M.; Hao, P.; Yang, Z.; He, G. Penetration into rice tissues by brown planthopper and fine structure of the salivary sheaths. Entomol. Exp. Appl. 2008, 129, 295–307. [Google Scholar] [CrossRef]
- Ji, R.; Yu, H.; Fu, Q.; Chen, H.; Ye, W.; Li, S. Comparative transcriptome analysis of salivary glands of two populations of rice brown planthopper, Nilaparvata lugens, that differ in virulence. PLoS ONE 2013, 8, e79612. [Google Scholar] [CrossRef] [PubMed]
- Hao, P.; Liu, C.; Wang, Y.; Chen, R.; Tang, M.; Du, B. Herbivore-induced callose deposition on the sieve plates of rice: An important mechanism for host resistance. Plant Physiol. 2008, 146, 1810–1820. [Google Scholar] [CrossRef] [PubMed]
- Jena, K.K.; Kim, S.M. Current status of brown planthopper (bph) resistance and genetics. Rice 2010, 3, 161–171. [Google Scholar] [CrossRef]
- Li, C.Y.; Luo, C.; Zhou, Z.H.; Wang, R.; Ling, F.; Xiao, L.T.; Lin, Y.J.; Chen, H. Gene expression and plant hormone levels in two contrasting rice genotypes responding to brown planthopper infestation. BMC Plant Biol. 2017, 17, 57. [Google Scholar] [CrossRef] [PubMed]
- Li, H.P.; Zhou, Z.H.; Hua, H.X.; Ma, W.H. Comparative transcriptome analysis of defense response of rice to Nilaparvata lugens and Chilo suppressalis infestation. Int. J. Biol. Macromol. 2020, 163, 2270–2285. [Google Scholar] [CrossRef] [PubMed]
- Xue, J.; Bao, Y.Y.; Li, B.L.; Cheng, Y.B.; Peng, Z.Y.; Liu, H.; Xu, H.J.; Zhu, Z.R.; Lou, Y.G.; Cheng, J.A.; et al. Transcriptome analysis of the brown planthopper Nilaparvata lugens. PloS ONE 2010, 5, e14233. [Google Scholar] [CrossRef]
- Sun, X.Y.; Wang, Z.Y.; Gu, Q.S.; Li, H.L.; Han, W.L.; Shi, Y. Transcriptome analysis of Cucumis sativus infected by Cucurbit chlorotic yellows virus. Virol. J. 2017, 14, 18. [Google Scholar] [CrossRef] [PubMed]
- Seifi, A.; Visser, R.G.F.; Bai, Y. How to effectively deploy plant resistances to pests and pathogens in crop breeding. Euphytica 2013, 190, 321–334. [Google Scholar] [CrossRef]
- Hammond, K.K.E.; Parker, J.E. Deciphering plant-pathogen communication: Fresh perspectives for molecular resistance breeding. Curr. Opin. Biotech. 2003, 14, 177–193. [Google Scholar] [CrossRef] [PubMed]
- Hairmansis, A.; Nasution, A.; Utami, D.W. Introgression of bacterial blight resistance gene Xa7 into popular indonesian rice varieties through backcross and molecular breeding. IOP Conf. Ser. Earth Environ. Sci. 2020, 457, 012050. [Google Scholar] [CrossRef]
- Xiao, N.; Wu, Y.Y.; Li, A.H. Strategy for use of rice blast resistance genes in rice molecular breeding. Rice Sci. 2020, 27, 263–277. [Google Scholar]
- Lu, Y.H.; Wu, K.M.; Jiang, Y.Y.; Guo, Y.Y.; Desneux, N. Widespread adoption of Bt cotton and insecticide decrease promotes biocontrol services. Nature 2012, 487, 362–365. [Google Scholar] [CrossRef] [PubMed]
- Zhou, G.; Wang, X.; Yan, F.; Wang, X.; Li, R.; Cheng, J.; Lou, Y.G. Genome-wide transcriptional changes and defence-related chemical profiling of rice in response to infestation by the rice striped stem borer Chilo suppressalis. Physiol. Plant. 2011, 143, 21–40. [Google Scholar] [CrossRef] [PubMed]
- Ralph, S.; Oddy, C.; Cooper, D.; Yueh, H.; Jancsik, S.; Kolosova, N.; Bohlmann, J. Genomics of hybrid poplar (Populus trichocarpa × deltoides) interacting with forest tent caterpillars (Malacosoma disstria): Normalized and full-length cDNA libraries, expressed sequence tags, and a cDNA microarray for the study of insect-induced defences in poplar. Mol. Ecol. 2006, 15, 1275–1297. [Google Scholar]
- Donze-Reiner, T.; Palmer, N.A.; Scully, E.D.; Prochaska, T.J.; Koch, K.G.; Heng-Moss, T.; Sarath, G. Transcriptional analysis of defense mechanisms in upland tetraploid switchgrass to greenbugs. BMC Plant. Boil. 2017, 17, 46. [Google Scholar] [CrossRef]
- Lu, J.; Ju, H.P.; Zhou, G.X.; Zhu, C.S.; Erb, M.; Wang, X.P.; Wang, P.; Lou, Y.G. An EAR-motif-containing ERF transcription factor affects herbivore-induced signaling, defense and resistance in rice. Plant. J. 2011, 68, 583–596. [Google Scholar] [CrossRef]
- De Vos, M.; Denekamp, M.; Dicke, M.; Vuylsteke, M.; Van Loon, L.C.; Smeekens, S.C.; Pieterse, C. The Arabidopsis thaliana transcription factor AtMYB102 functions in defense against the insect herbivore Pieris rapae. Plant. Signal. Behav. 2006, 1, 305–311. [Google Scholar] [CrossRef] [PubMed]
- Wang, Y.B.; Guo, H.M.; Li, H.C.; Zhang, H.; Miao, X.X. Identification of transcription factors potential related to brown planthopper resistance in rice via microarray expression profiling. BMC Genom. 2012, 13, 687. [Google Scholar] [CrossRef] [PubMed]
Disclaimer/Publisher’s Note: The statements, opinions and data contained in all publications are solely those of the individual author(s) and contributor(s) and not of MDPI and/or the editor(s). MDPI and/or the editor(s) disclaim responsibility for any injury to people or property resulting from any ideas, methods, instructions or products referred to in the content. |
© 2023 by the authors. Licensee MDPI, Basel, Switzerland. This article is an open access article distributed under the terms and conditions of the Creative Commons Attribution (CC BY) license (https://creativecommons.org/licenses/by/4.0/).