1. Introduction
Urban transportation systems in many countries, including Sri Lanka, face significant challenges due to inadequate road infrastructure, rapid increases in traffic volumes, and the coexistence of heterogeneous vehicle types [
1]. Under mixed traffic conditions, the interaction of various classes of vehicles creates numerous design-related challenges, primarily due to the non-uniformity in their static and dynamic characteristics [
2]. To address this variability, all vehicle types are commonly converted into a standard performance unit known as the Passenger Car Equivalent (PCE) (also referred to as the Passenger Car Unit, PCU). PCE is typically expressed as PCEs per hour, PCEs per lane per hour, or PCEs per kilometre of lane. The PCE was first introduced in the US Highway Capacity Manual (HCM) and has since been widely used in traffic and highway design to estimate road capacity and forecast future traffic volumes.
PCE factors currently practiced in Sri Lanka are more than 20 years old and no longer represent prevailing traffic conditions. Despite significant changes in traffic composition, vehicle operating characteristics, roadway conditions, and travel behaviour over the past two decades, these values have not been updated due to two fundamental challenges in developing locally calibrated PCE factors: first, identifying a suitable estimation methodology and applying it correctly, which often requires specialized expertise in traffic engineering and PCE analysis; second, obtaining high-quality traffic data, as conventional traffic surveys are time-consuming, labour-intensive, and expensive. In addition, the accuracy and consistency of data collected through conventional methods are often questioned, particularly under mixed traffic conditions where vehicle interactions are highly complex. Consequently, periodic updates of PCE values, which are essential for accurate traffic analysis, signal design, and roadway planning, are rarely undertaken despite their importance.
Most existing analytical approaches for estimating PCE values rely on field data collected under the assumption of traffic homogeneity. However, this assumption does not adequately represent the mixed traffic conditions commonly observed in developing countries, where considerable variability exists in driver behaviour, vehicle characteristics, and roadway geometry, including signalised intersections, unsignalized intersections, and roundabouts [
3,
4]. Even among signalized intersections, substantial differences in geometric layout influence key operational parameters such as saturation flow rate, green time allocation, and signal cycle length. Consequently, traffic heterogeneity must be properly accounted for to ensure accurate estimation of these parameters and to provide a common basis for traffic analysis and design. Despite this need, most recent local studies have focused on mid-block roadway sections rather than intersections, even though vehicle behaviour at intersections differs significantly from that on lanes. This highlights the need for locally calibrated intersection-specific PCE values to improve the estimation of intersection operating parameters, including signal phasing and timing. Furthermore, the rapid diversification of Sri Lanka’s vehicle fleet over the past 15 years, driven by the importation of new vehicle categories with varying physical and operational characteristics [
5], further emphasizes the necessity of periodically updating PCE values to accurately reflect prevailing traffic conditions. Although future updates may be required to accommodate emerging vehicle categories, many new vehicle types can be incorporated within the existing classification framework provided their operational and manoeuvring characteristics are comparable to those of established categories.
The heterogeneous nature of Sri Lankan traffic further complicates PCE estimation. Roads accommodate vehicles with widely varying physical and operational characteristics, while weak lane discipline, inconsistent headway maintenance, and diverse driving behaviours contribute to highly variable traffic operations [
6,
7]. Vehicle speeds are influenced not only by vehicle performance but also by drivers’ tendency to select the most advantageous path through the traffic stream rather than strictly adhering to lane markings [
8]. Such complex interactions make the estimation of PCE values using conventional heuristic approaches particularly challenging. Although several studies worldwide have developed PCE values under different roadway and traffic conditions, their findings are often context-specific, underscoring the need for estimation methods that accurately capture the characteristics of heterogeneous traffic in countries such as Sri Lanka.
In addition, traffic mix in Sri Lanka differs substantially from that in developed countries. In developed countries, cars typically constitute 70–80% of the traffic stream, whereas in Sri Lanka they account for only about 20–30%. Instead, motorcycles and three-wheelers dominate the traffic mix, comprising approximately 50% and 20% of the vehicle population, respectively. Traffic composition also varies across regions and over time, with rural areas generally exhibiting higher proportions of motorcycles and three-wheelers than urban areas. Moreover, ongoing socio-economic, demographic, and income changes continue to influence vehicle ownership patterns and traffic composition. These characteristics highlight the importance of periodically updating locally calibrated PCE values to ensure they accurately represent prevailing traffic conditions and support reliable traffic flow analysis.
Manual traffic data collection is labour-intensive, prone to human error, and often unreliable at complex urban intersections with heterogeneous traffic. It is limited by observer fatigue, safety concerns, and short observation durations, reducing data accuracy, consistency, and scalability. Fixed, closed-circuit television (CCTV) systems offer automation but require multiple cameras for full coverage, increasing cost and complexity while still facing occlusion, distortion, and position-dependent limitations. These challenges often result in incomplete data and reduced accuracy in vehicle detection, classification, and the extraction of key traffic parameters [
9].
2. Literature Review
2.1. Methods Used in PCE Calculations
The concept of Passenger Car Equivalent (PCE) was first introduced in the Highway Capacity Manual (HCM) 1965 to quantify the influence of trucks and buses within a traffic stream. It was defined as the number of passenger cars displaced by a truck or bus under prevailing roadway and traffic conditions. Similarly, the Transport and Road Research Laboratory (TRRL) defined the PCE concept by relating the impact of different vehicle types on traffic performance. According to the TRRL, on any given road section under prevailing traffic conditions, if the addition of one vehicle of a particular type per hour reduces the average speed of the remaining vehicles by the same amount as the addition of ‘X’ average passenger cars per hour, then that vehicle is considered equivalent to X PCUs. In the case of bottlenecks, particularly at intersections under saturated conditions, if a particular vehicle type requires X times the service time of an average passenger car, it is also considered equivalent to X PCEs [
10].
Earlier editions of the HCM, including HCM 1950, adopted a single equivalency factor of 2.0 to represent the effect of heavy vehicles on multilane highways. This simplified representation was later refined to better reflect varying operating conditions. The HCM 2000 definition of PCE is the number of passenger cars displaced by a single heavy vehicle of a specific type under prevailing roadway, traffic, and control conditions [
11]. A PCE is therefore a numerical factor used to convert a mixed traffic stream into an equivalent stream consisting solely of passenger cars. Two fundamental principles guide the estimation of PCE values for capacity analysis. First, passenger car equivalency is directly linked to the concept of level of service (LOS). Second, all factors that contribute to the overall impact of non-passenger vehicles on traffic stream performance must be considered when determining appropriate PCE values measuring passenger car equivalents [
12].
A review of existing research indicates that PCE values are dynamic and influenced by multiple interacting factors rather than being fixed constants. Studies show that vehicle characteristics such as dimensions, power, acceleration–deceleration capability, and braking performance affect space occupancy and manoeuvrability relative to passenger cars. Traffic stream characteristics, including mean stream speed, speed variability, longitudinal and lateral gaps, traffic composition, and pedestrian interference, significantly modify vehicle interactions, particularly under heterogeneous traffic conditions [
13,
14,
15]. Roadway characteristics such as pavement width, number of lanes, alignment, gradient, intersection type, sight distance, and regulatory controls also affect operating conditions and, in turn, PCE values [
13,
15]. In addition, environmental and terrain conditions (e.g., roadside obstructions, plain or hilly terrain, embankments or tunnels) and climatic conditions (rain, fog, mist) influence speeds and headways [
14,
16]. Finally, traffic control measures, including posted speed limits, vehicle segregation, access control, and signalization, further affect traffic dynamics and equivalency factors. Collectively, the literature confirms that PCE values vary with prevailing traffic, geometric, environmental, and control conditions [
14].
Table 1 presents a summary of previous studies on Passenger Car Equivalent (PCE) estimation, categorised according to the traffic parameters used to determine PCE values.
In summary, the suitability of PCU determination methods depends on traffic composition, roadway conditions, and data availability. Headway-based and queue discharge flow-based methods are particularly appropriate for signalised intersections, as they directly represent the space–time consumption of different vehicle types under saturated and heterogeneous traffic conditions. Among these, the headway-based method is relatively simple to understand and implement, making it easier for non-experts to apply and interpret, while still providing reliable estimates of PCU values under mixed traffic conditions. Speed, delay, and travel time-based methods are more suited to uninterrupted flow where speed–flow relationships are stable, but they may not fully capture complex vehicle interactions and lateral movements common in mixed traffic environments. Vehicle-hour and volume-to-capacity ratio approaches are generally applied at a planning level and under congested conditions, though they tend to oversimplify individual vehicle impacts. Simulation-based methods provide greater flexibility by modelling heterogeneous behaviour explicitly; however, their reliability depends on rigorous calibration using local traffic data [
14,
39,
40].
2.2. PCE in Developing Countries
Recent Sri Lankan studies demonstrate a clear shift toward facility-based PCE estimation. For expressways, Ref. [
41] evaluated PCE factors using Chandra’s speed–area method combined with Greenshield’s traffic flow relationships, highlighting differences between design assumptions and observed operational conditions. For uninterrupted midblock sections, Ref. [
42] estimated PCE values for four different road types under mixed traffic conditions in Colombo using projected vehicle area and mean stream speed as primary variables. Similarly, Ref. [
43] examined PCE estimation for two-lane roads, demonstrating the influence of opposing traffic and lateral interaction on equivalency factors. Ref. [
44] extended this analysis to four-lane urban roads, emphasizing that PCE values vary with traffic composition, lane discipline, and geometric configuration.
Methodologically, Sri Lankan studies have predominantly relied on Chandra’s method, which defines PCE as a function of the ratio of mean speeds and projected vehicle areas [
42,
43]. Across South Asia, intersection-based PCE studies frequently adopt multiple linear regression under saturated flow conditions, incorporating volume-to-capacity ratios and discharge characteristics to estimate equivalency factors [
45]. Unlike uninterrupted midblock sections, intersection analyses account for start-up lost time, queue discharge rate, and signal timing effects, which significantly influence vehicle equivalency. The literature confirms that static PCE values derived from homogeneous traffic assumptions are unsuitable for heterogeneous traffic environments typical of Sri Lanka and neighbouring South Asian countries [
10,
45].
Early work by Ref. [
10] established baseline Passenger Car Equivalent (PCE) values for Sri Lankan road conditions, providing the foundation for subsequent research on heterogeneous traffic behaviour. However, substantial changes in traffic demand, vehicle composition, and driving behaviour, including weak lane discipline, have rendered these values less representative of current traffic conditions, necessitating periodic recalibration and facility-specific PCE estimation [
41,
44]. Given the strong influence of local traffic and roadway characteristics on PCE values, the use of context-specific estimates is essential for accurate traffic analysis and design [
10,
42].
2.3. Video-Based Traffic Data Collection
Contemporary Sri Lankan studies increasingly utilize video-based data collection to extract vehicle speeds, classifications, and projected areas. Ref. [
42] employed synchronized videography to determine vehicle speeds and geometric characteristics under mid-block conditions, while Ref. [
41] extracted entry and exit times from expressway CCTV systems to compute speeds and peak-hour traffic volumes. Compared with conventional manual surveys, video-based data collection improves accuracy, enables post-processing verification, and reduces observer bias [
45].
However, drone-based videography further enhances traffic data collection by providing an elevated, unobstructed view of the study area, enabling detailed observation of lane utilization, queue formation, discharge behaviour, turning movements, and lateral vehicle interactions [
45]. Unlike fixed roadside cameras, drones require no permanent roadside infrastructure such as poles, power supply, or communication systems, making them particularly suitable for developing countries where the installation and maintenance of such facilities are often constrained by limited space, financial resources, and skilled personnel. Their rapid deployment also allows the same equipment to be used at multiple sites without additional installation costs, making large-scale data collection more cost-effective. Furthermore, because drones are deployed only during survey periods, they eliminate the risks of theft, vandalism, and ongoing maintenance commonly associated with permanently installed camera systems. Compared with fixed roadside cameras, drones also minimise blind spots and capture complex heterogeneous traffic movements more effectively. These advantages make drone-based videography particularly well suited for intersection-based Passenger Car Unit (PCU) and Passenger Car Equivalent (PCE) studies in South Asian traffic environments, where high proportions of motorcycles and three-wheelers create complex traffic interactions [
42,
45].
3. Methodology
This study addresses the limitations of outdated and context-insensitive Passenger Car Equivalent (PCE) values in Sri Lanka by developing an accurate, cost-effective, and adaptable methodology for estimating intersection-specific PCE factors. Sri Lanka’s highly heterogeneous traffic composition, together with continuous socio-economic and demographic changes that influence vehicle ownership and travel patterns, necessitates the periodic recalibration of PCE values to ensure they remain representative of prevailing traffic conditions.
As discussed in the introduction, developing locally calibrated PCE values involves two fundamental challenges: identifying an appropriate estimation methodology and acquiring high-quality traffic data cost-effectively. Conventional traffic surveys are labour-intensive, time-consuming, and expensive, making regular updates difficult. To overcome these challenges, this study combines a robust PCE estimation methodology with drone-based traffic data collection, providing an efficient and economical approach for capturing detailed intersection traffic characteristics without the need for permanent roadside infrastructure. The following sections describe the adopted estimation methodology and the data collection procedure in detail.
3.1. PCE Calculation
Previous studies have established that the PCE is not static but varies with traffic and geometric conditions [
46]. Many researchers have proposed methods for estimating PCE values based on changes in performance measures such as headway, density, speed, travel time, delay, vehicle-hours, and queue discharge [
21,
30,
33,
47]. At signalized intersections, vehicle headway provides a more accurate representation of the effective space and time required for vehicular movement than other traffic parameters. Headway inherently captures the combined effects of vehicle size, acceleration characteristics, driver behaviour, and interactions with surrounding vehicles under mixed traffic conditions. As a result, the majority of studies investigating Passenger Car Equivalent (PCE) at signalised intersections have employed the headway method [
2,
20,
23,
24]. Therefore, this study uses vehicle headway, a measure of area occupancy, as the primary parameter for estimating PCE values, as it effectively reflects cumulative vehicular interactions within the traffic stream. Additional advantages of the headway method include its simplicity, minimal data requirements, and suitability for field-based studies in heterogeneous traffic environments such as those in Sri Lanka.
As proposed by Ref. [
23], PCE values for through and right-turn movements can be computed by comparing the adjusted mean headways of specific vehicle types with those of passenger cars performing the same movements at the signalised intersection. In this headway-ratio method, the passenger car unit for through/right-turn vehicles compares the headways of a given vehicle type with those of straight-through/right-turn vehicles in the intersection. Equation (1) denotes the comparison.
where
is the average headway of a car followed by a car;
is the average headway of a type vehicle followed by a type vehicle;
is the average headway of a car followed by a type x vehicle;
is the average headway of a type vehicle followed by a car.
If this condition is not met, a corrective factor obtained by the least-squares method is applied to the respective samples, as shown in Equation (2).
where
—the number of headways for car following car;
—the number of headways for car following type vehicle;
—the number of headways for type vehicle following car;
—the number of headways for type vehicle following type vehicle;
—mean headways for car following car;
—mean headways for car following type vehicle;
—mean headways for type vehicle following car;
—mean headways for type vehicle following type vehicle.
Adjusted mean headways for a car following a car can be calculated as depicted in Equation (3).
where
is the adjusted mean headway for a car following a car;
is the uncorrected mean headway;
is the correction factor.
Similarly, the adjusted mean headways for type
vehicle following type
vehicle can be calculated as shown in Equation (4).
where
is the adjusted mean headway for type vehicle following type vehicle;
is the uncorrected mean headway;
is the correction factor.
Hence, by dividing Equation (4) by Equation (3), the PCE can be calculated as shown in Equation (5):
Turning manoeuvres were grouped into two categories, Through Only (TO) and Right Turn Only (RO), excluding the left-turning traffic since left-filtering lanes are available in all directions at all selected sites in this study. Although sites were selected with saturated traffic flow conditions, which is the maximum constant departure rate of queues from the stop line of an approach lane during the green signal period [
23], left-turns are permitted through the filtering lane during all phases (yielding to oncoming traffic or pedestrians), resulting in non-saturate flow conditions often. That is the objective of providing a left-filtering lane; hence, left-turning traffic was not considered.
The average headway of each vehicle in each movement type has been analysed against the intermediate headway of a car in the same movement type. The headway method is the basic approach to this data analysis. In a signalized intersection, the analysis is commenced on the assumption that vehicles being discharged from a traffic signal will leave at their capacity or a saturated flow condition. Drone data collection was carried out during the daytime when saturated flow conditions exist. Time lapses are considered in the data record since they are a trackable parameter for intersection movements. More than 5000 vehicle movements were considered in this study across five sites. Because the PCE values for each vehicle class were measured repeatedly across the same five sites, a Friedman test, the nonparametric equivalent of a repeated-measures ANOVA, was conducted to assess whether the PCE values were consistent across the five sites. Additionally, the coefficient of variation (CV) was calculated for each vehicle class to evaluate the variability and stability of the estimated PCE values across the study sites.
3.2. Data Collection
Vehicle movement data were collected exclusively through drone video recordings to obtain accurate, unobstructed observations at signalized intersections, addressing the second challenge. Compared to fixed ground-level (or elevated) cameras, drones offer several advantages: they provide flexible manoeuvrability for optimal viewing angles; capture all approaches, turning movements, queues, pedestrian crossings, and bicycle flows in one frame; easily avoid obstructions such as buildings or vegetation (no blind spots from poles, trees, or signal heads—a common CCTV issue); and reduce the need for multiple static installations which avoids practical issues of site labour-intense work—making the method both comprehensive and cost-effective. Importantly, drone operations enable frequent data acquisition without interfering with traffic flows with limited prior planning.
Data were collected at five selected signalized intersections that exhibited high traffic demand, heterogeneous vehicle compositions, and no roadside parking along their approaches. Drone footage was captured during morning and evening peak periods at each location, in approximately 22–25-min-long video clips for each location, recording the movement of every vehicle in both directions. The video files were analysed using Adobe Premiere to extract temporal headways for different vehicle category combinations within each turning movement. A 1 m × 1 m grid layer and a timestamp layer were superimposed on the video footage to facilitate accurate identification of vehicle positions and movement times. The videos were recorded at 29 frames per second, resulting in 29 frames for each second of footage. Considering the accuracy requirements and practicality of manual analysis, frames were extracted at 0.5-s intervals (approximately every 14–15 frames). These extracted frames were used to identify vehicle categories and measure the headways between consecutive vehicles. Using the extracted frames, vehicle-following events, such as a motorcycle (MC) followed by a three-wheeler (3 W) within the same turning movement, were identified, and the corresponding headways were manually recorded. This process was repeated for all possible combinations of vehicle categories observed at the intersection. Multiple headway observations were obtained for each vehicle pair, and the average headway value was calculated to represent the interaction between the respective vehicle categories for subsequent PCE analysis. For analysis, vehicles were classified into ten distinct categories. These categories were used to determine PCE factors based on vehicle size, type, and movement patterns. Categories considered are: (1) Passenger Car (PC), (2) Passenger Car—Small (PCS), (3) Van (VN), (4) Motorcycle (MC), (5) Three-Wheeler (TW), (6) Medium Bus (MB), (7) Large Bus (LB), (8) Commercial Vehicle—Small (SCV), (9) Commercial Vehicle—Medium (MCV), (10) Commercial Vehicle—Large (LCV).
The study sites were selected to represent a range of intersection characteristics and traffic conditions within an urban area, where rapid development, increased travel demand, and diverse land-use patterns have contributed to complex heterogeneous traffic operations. The selected intersections experience significant traffic volumes generated by a combination of residential, commercial, and administrative activities, making them suitable locations for investigating intersection-specific Passenger Car Equivalent (PCE) values under prevailing Sri Lankan traffic conditions.
In addition to traffic demand and functional importance, several geometric and operational factors were considered during site selection to ensure reliable traffic data collection and analysis. The selected intersections have saturated traffic flow conditions, clear road and lane markings, minimal roadside parking activity, and unobstructed driver sight distances, with no significant roadside developments affecting vehicle movements. These conditions reduce external disturbances and allow for more accurate observation of vehicle trajectories, lane utilization, and intersection operations.
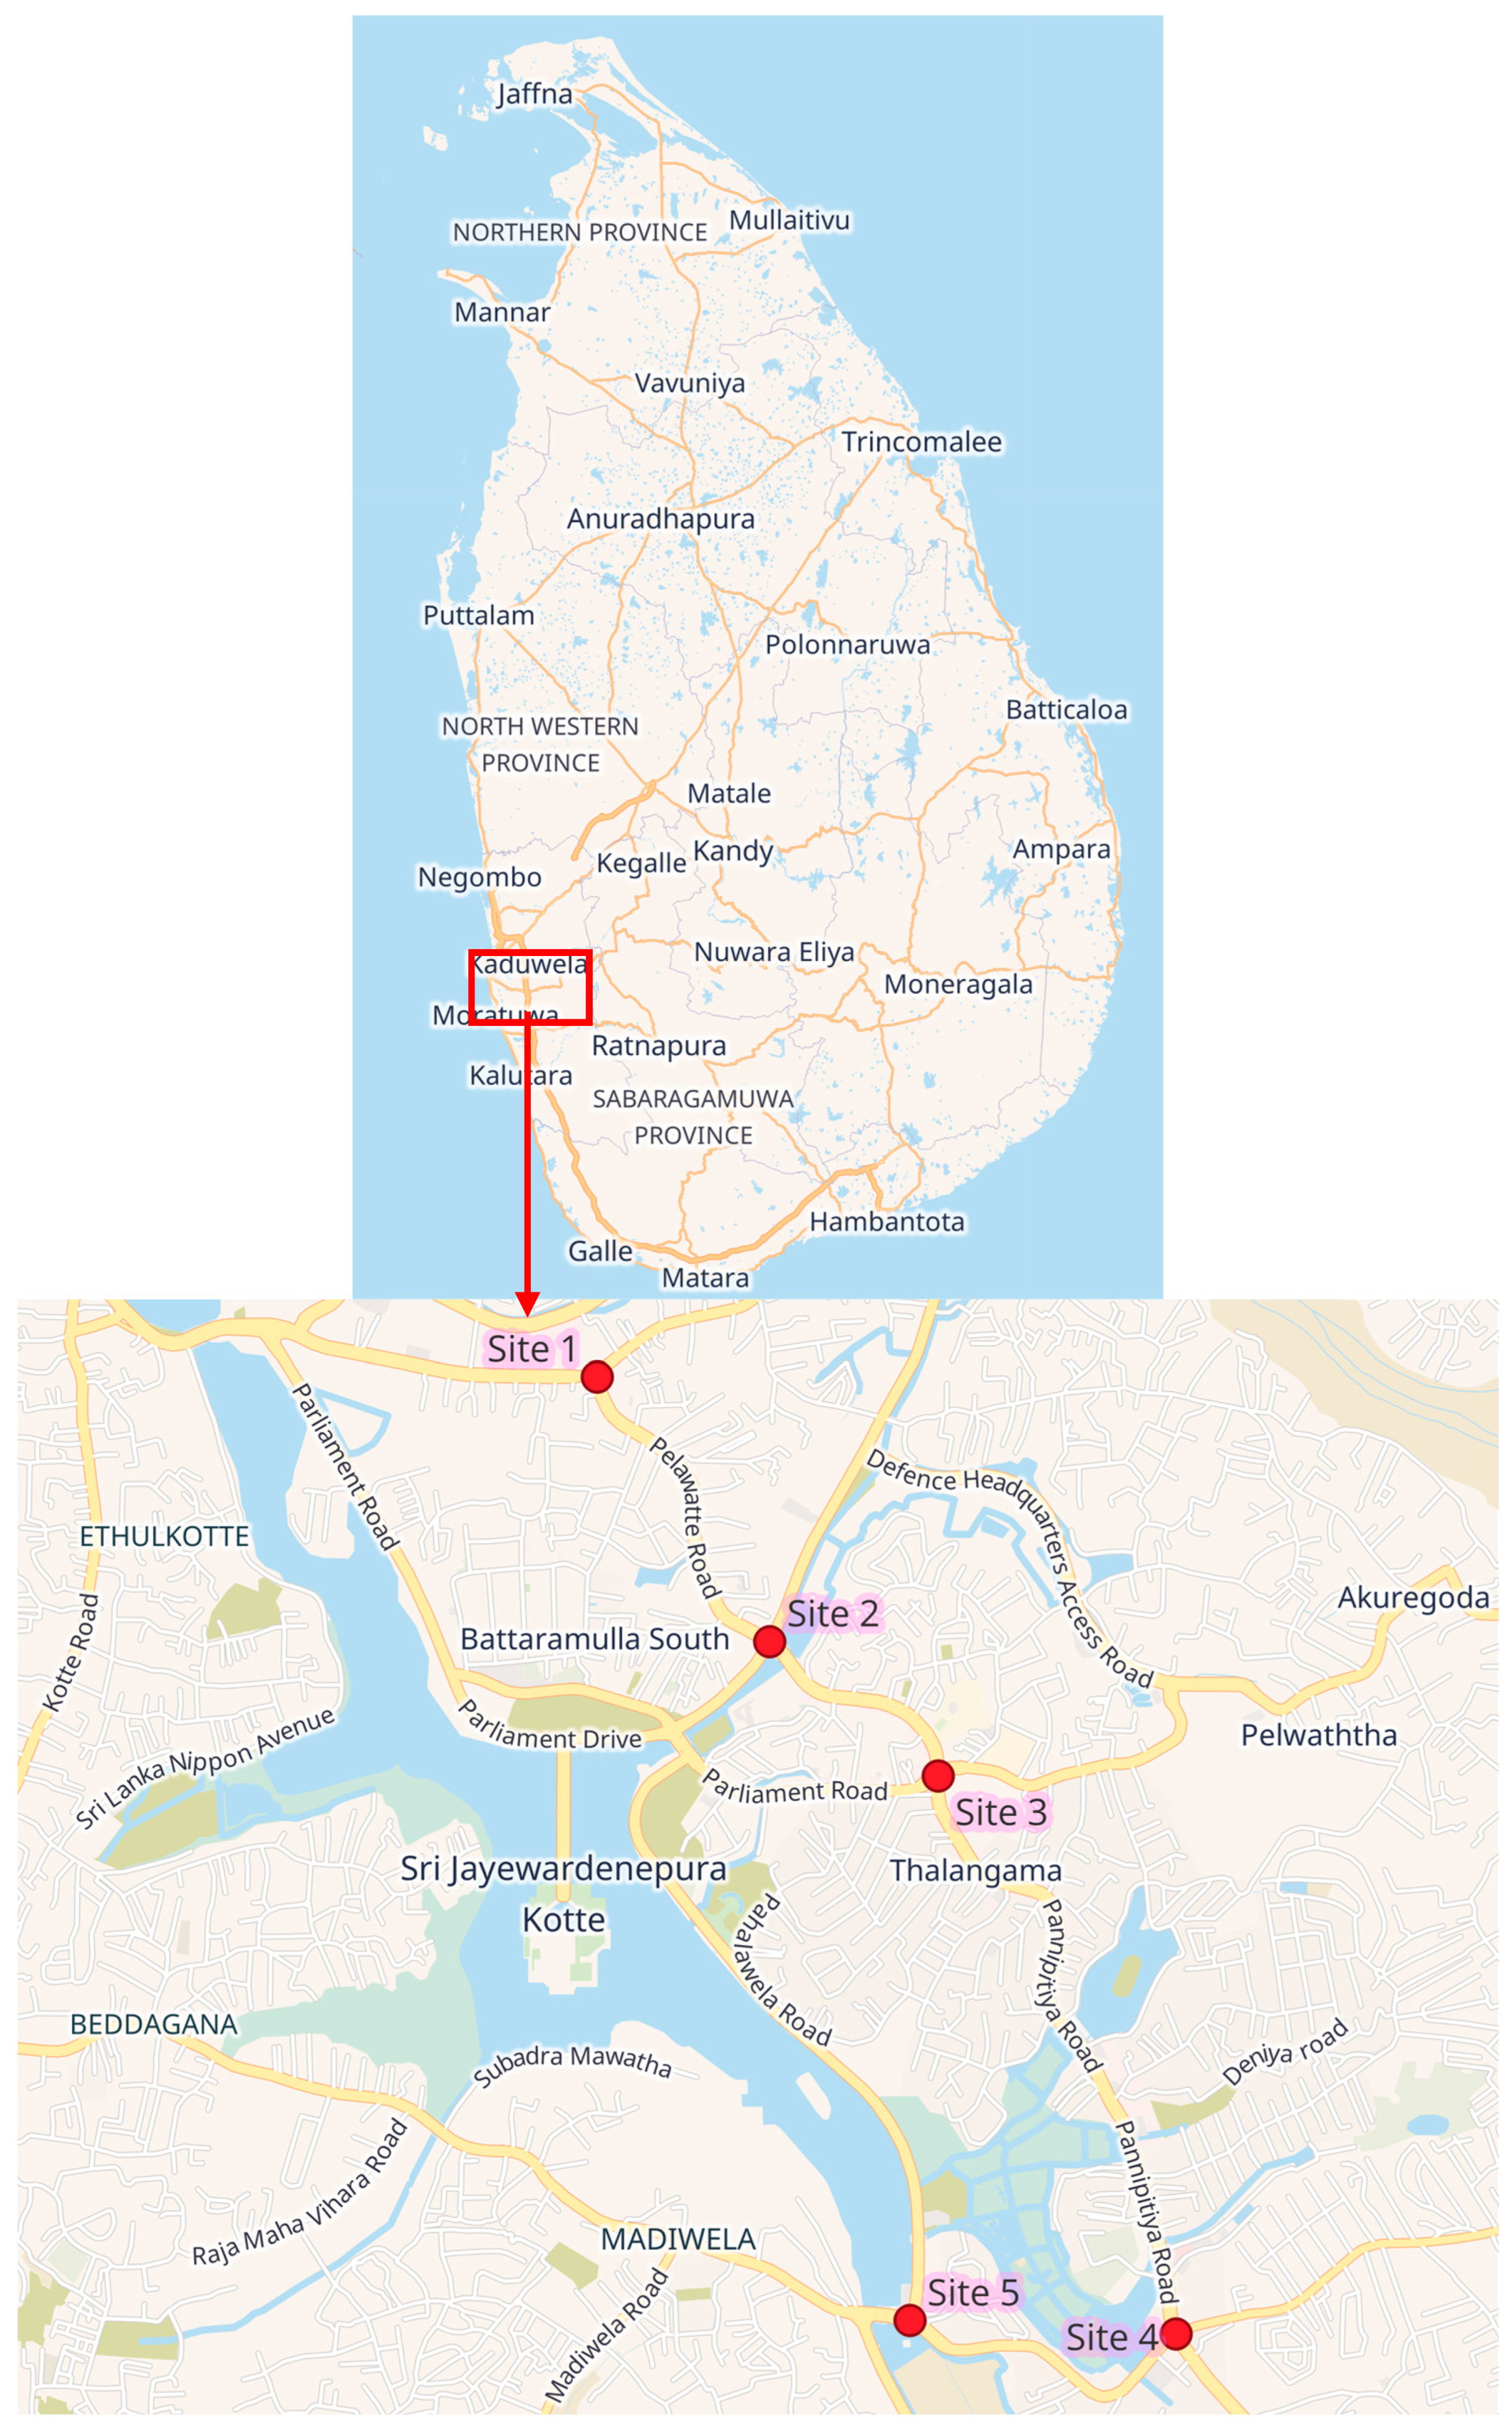
Battaramulla Intersection and Palamthuna Intersection were selected due to their strategic importance within the administrative capital region, where commuter movements associated with government offices, private-sector workplaces, and daily urban activities generate substantial peak-period congestion. Pelawatta Intersection represents a high-demand residential–commercial corridor with consistently high traffic volumes, while Thalawathugoda Intersection was included due to its role as a major transport hub connecting several important road corridors, including the A4 corridor, resulting in complex traffic interactions and heavy peak-hour flows. Although Kimbulawala Intersection is comparatively less prominent, it was selected because it functions as an important commercial–residential node with connectivity to major surrounding corridors, providing variation in traffic characteristics. Collectively, these five intersections capture a diverse range of traffic conditions, including variations in traffic demand, land-use influence, roadway connectivity, and vehicle interactions, while maintaining suitable geometric and operational characteristics for data collection. This diversity is essential for developing representative and locally calibrated PCE factors, particularly under Sri Lanka’s heterogeneous traffic conditions where vehicle composition and operational behaviour vary significantly across locations. The five selected intersections are located along the Battaramulla–Thalawathugoda urban corridor, as shown in
Figure 1.
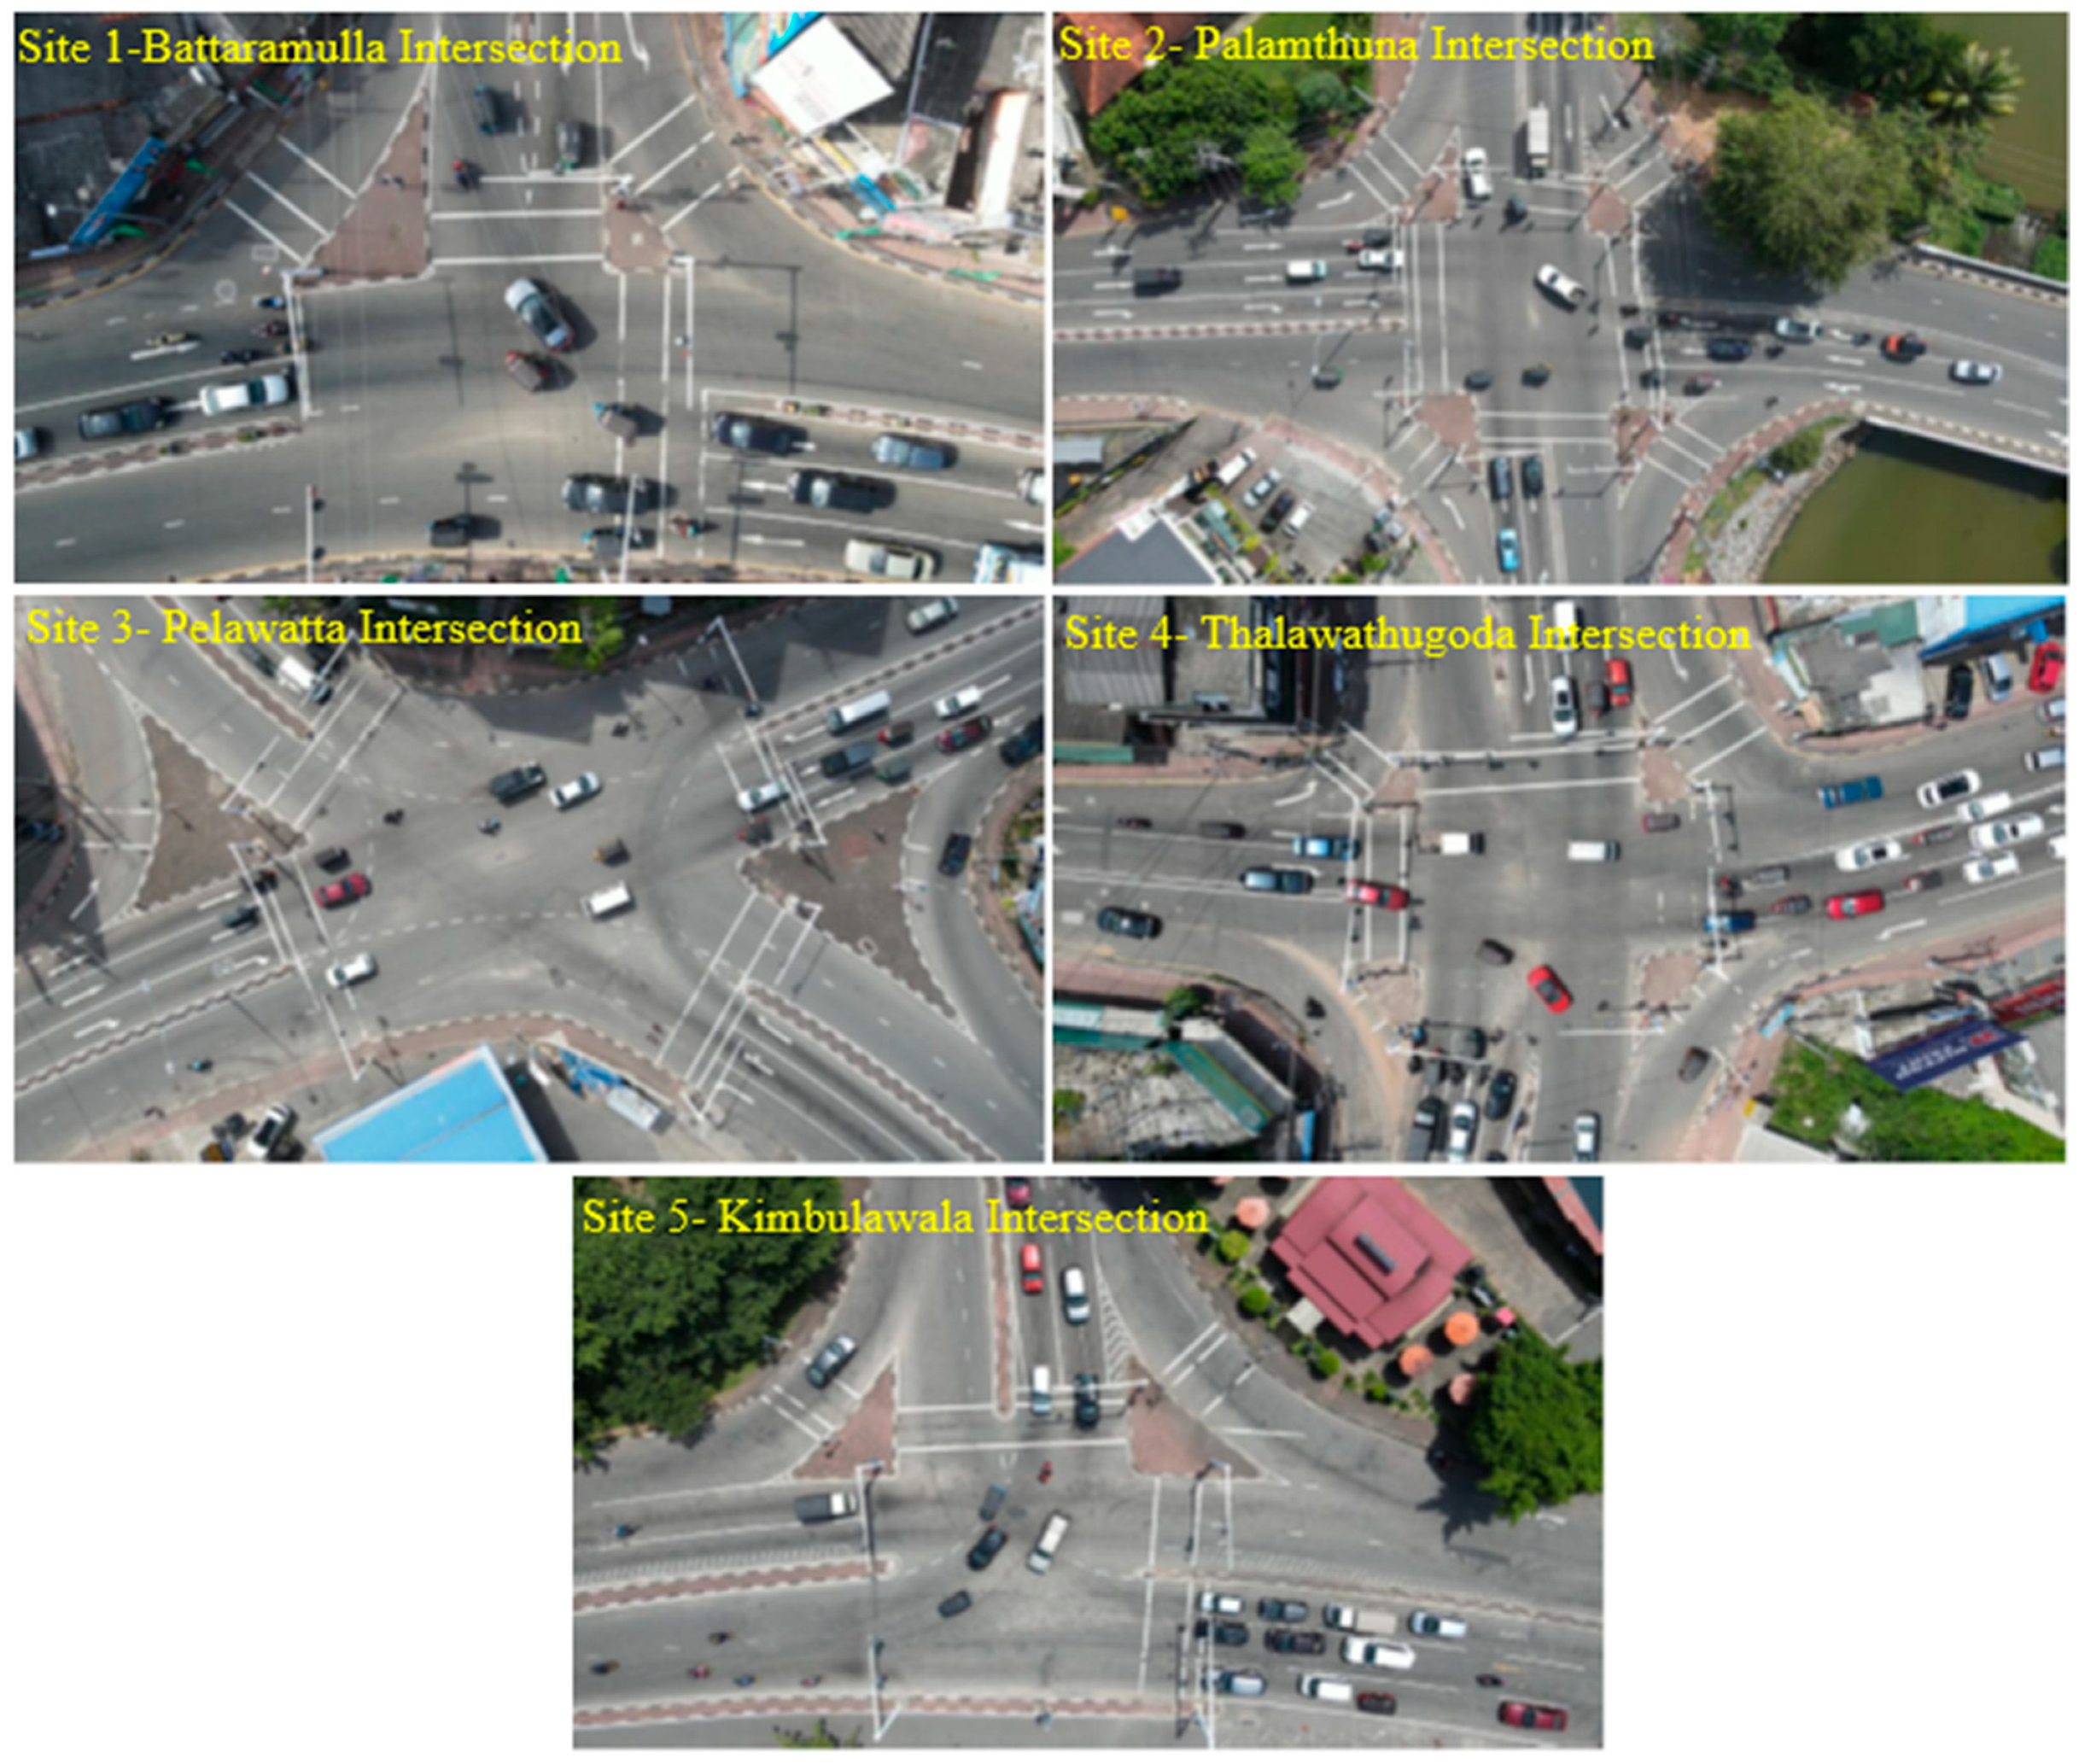
Figure 2 depicts the drone images taken at each site, indicating the intersection layout and the number of lanes from each approach.
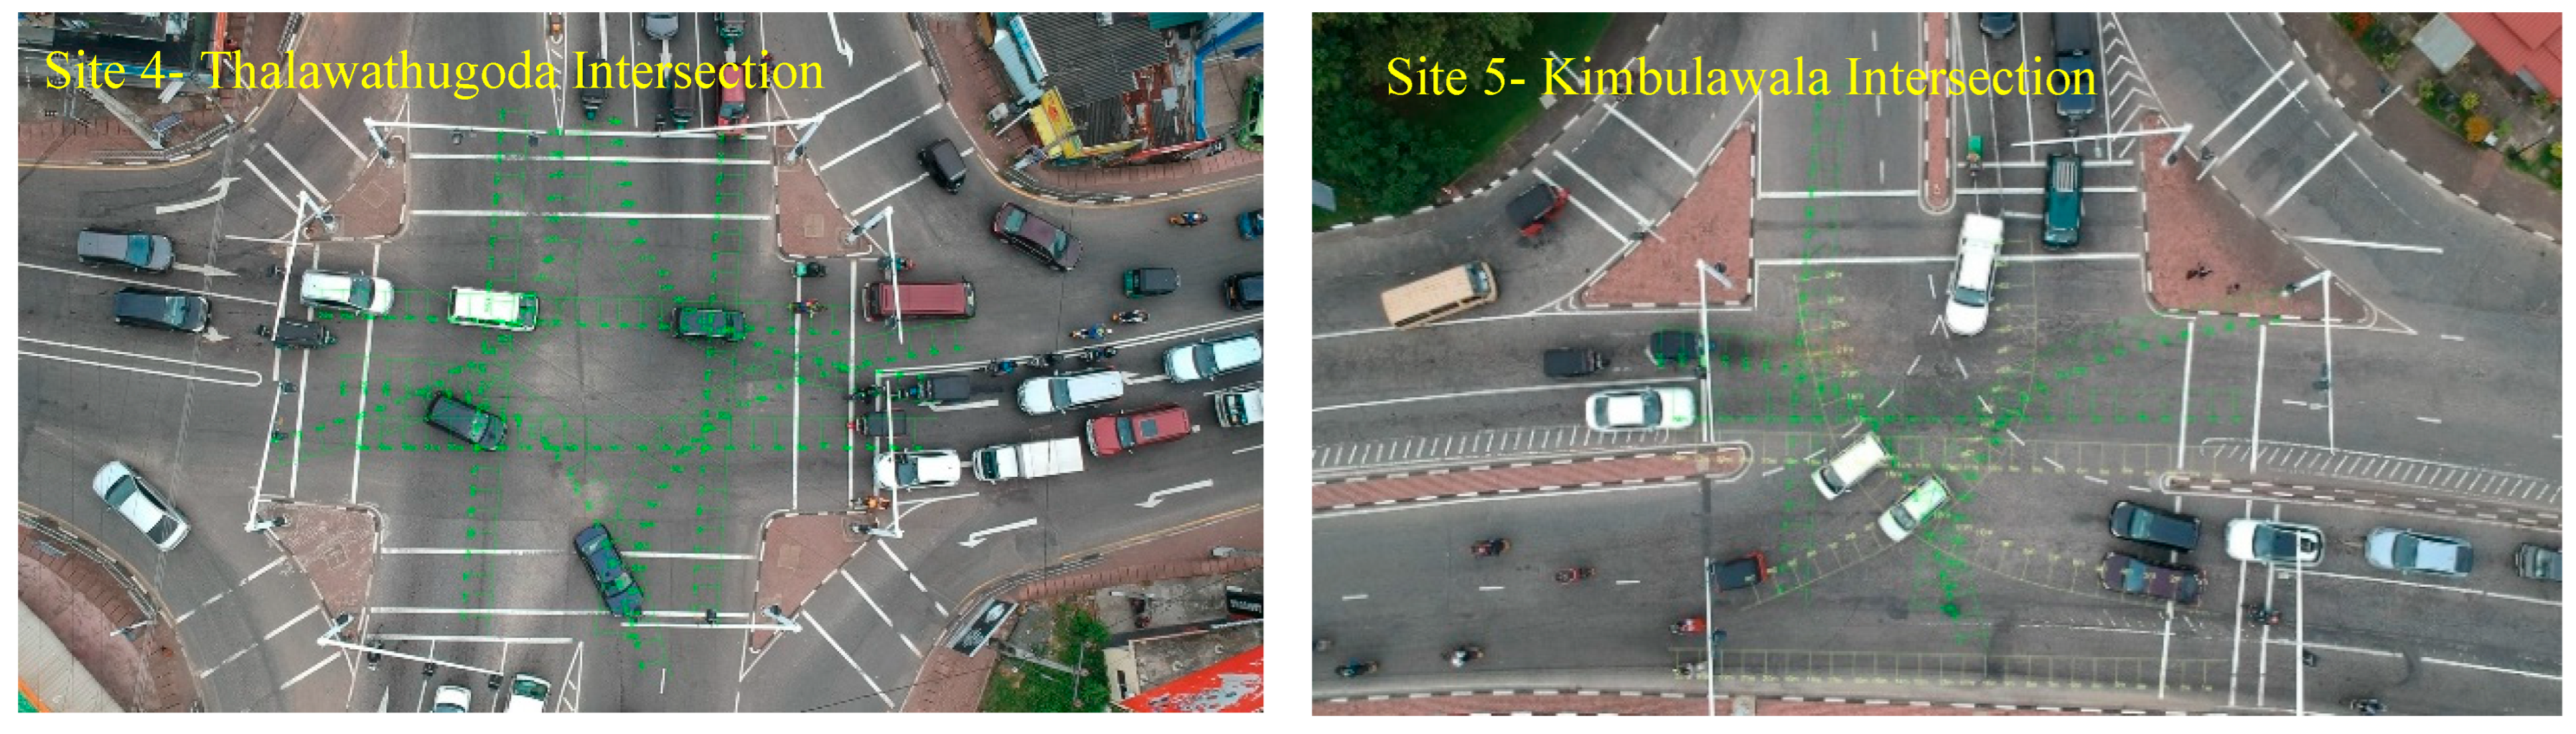
Drone imagery provided both contextual and bird’s-eye views of each site, supporting accurate extraction of vehicle trajectories and interactions. For example, trajectories are shown in
Figure 3 for two selected sites, sites 4 & 5.
4. Results and Discussion
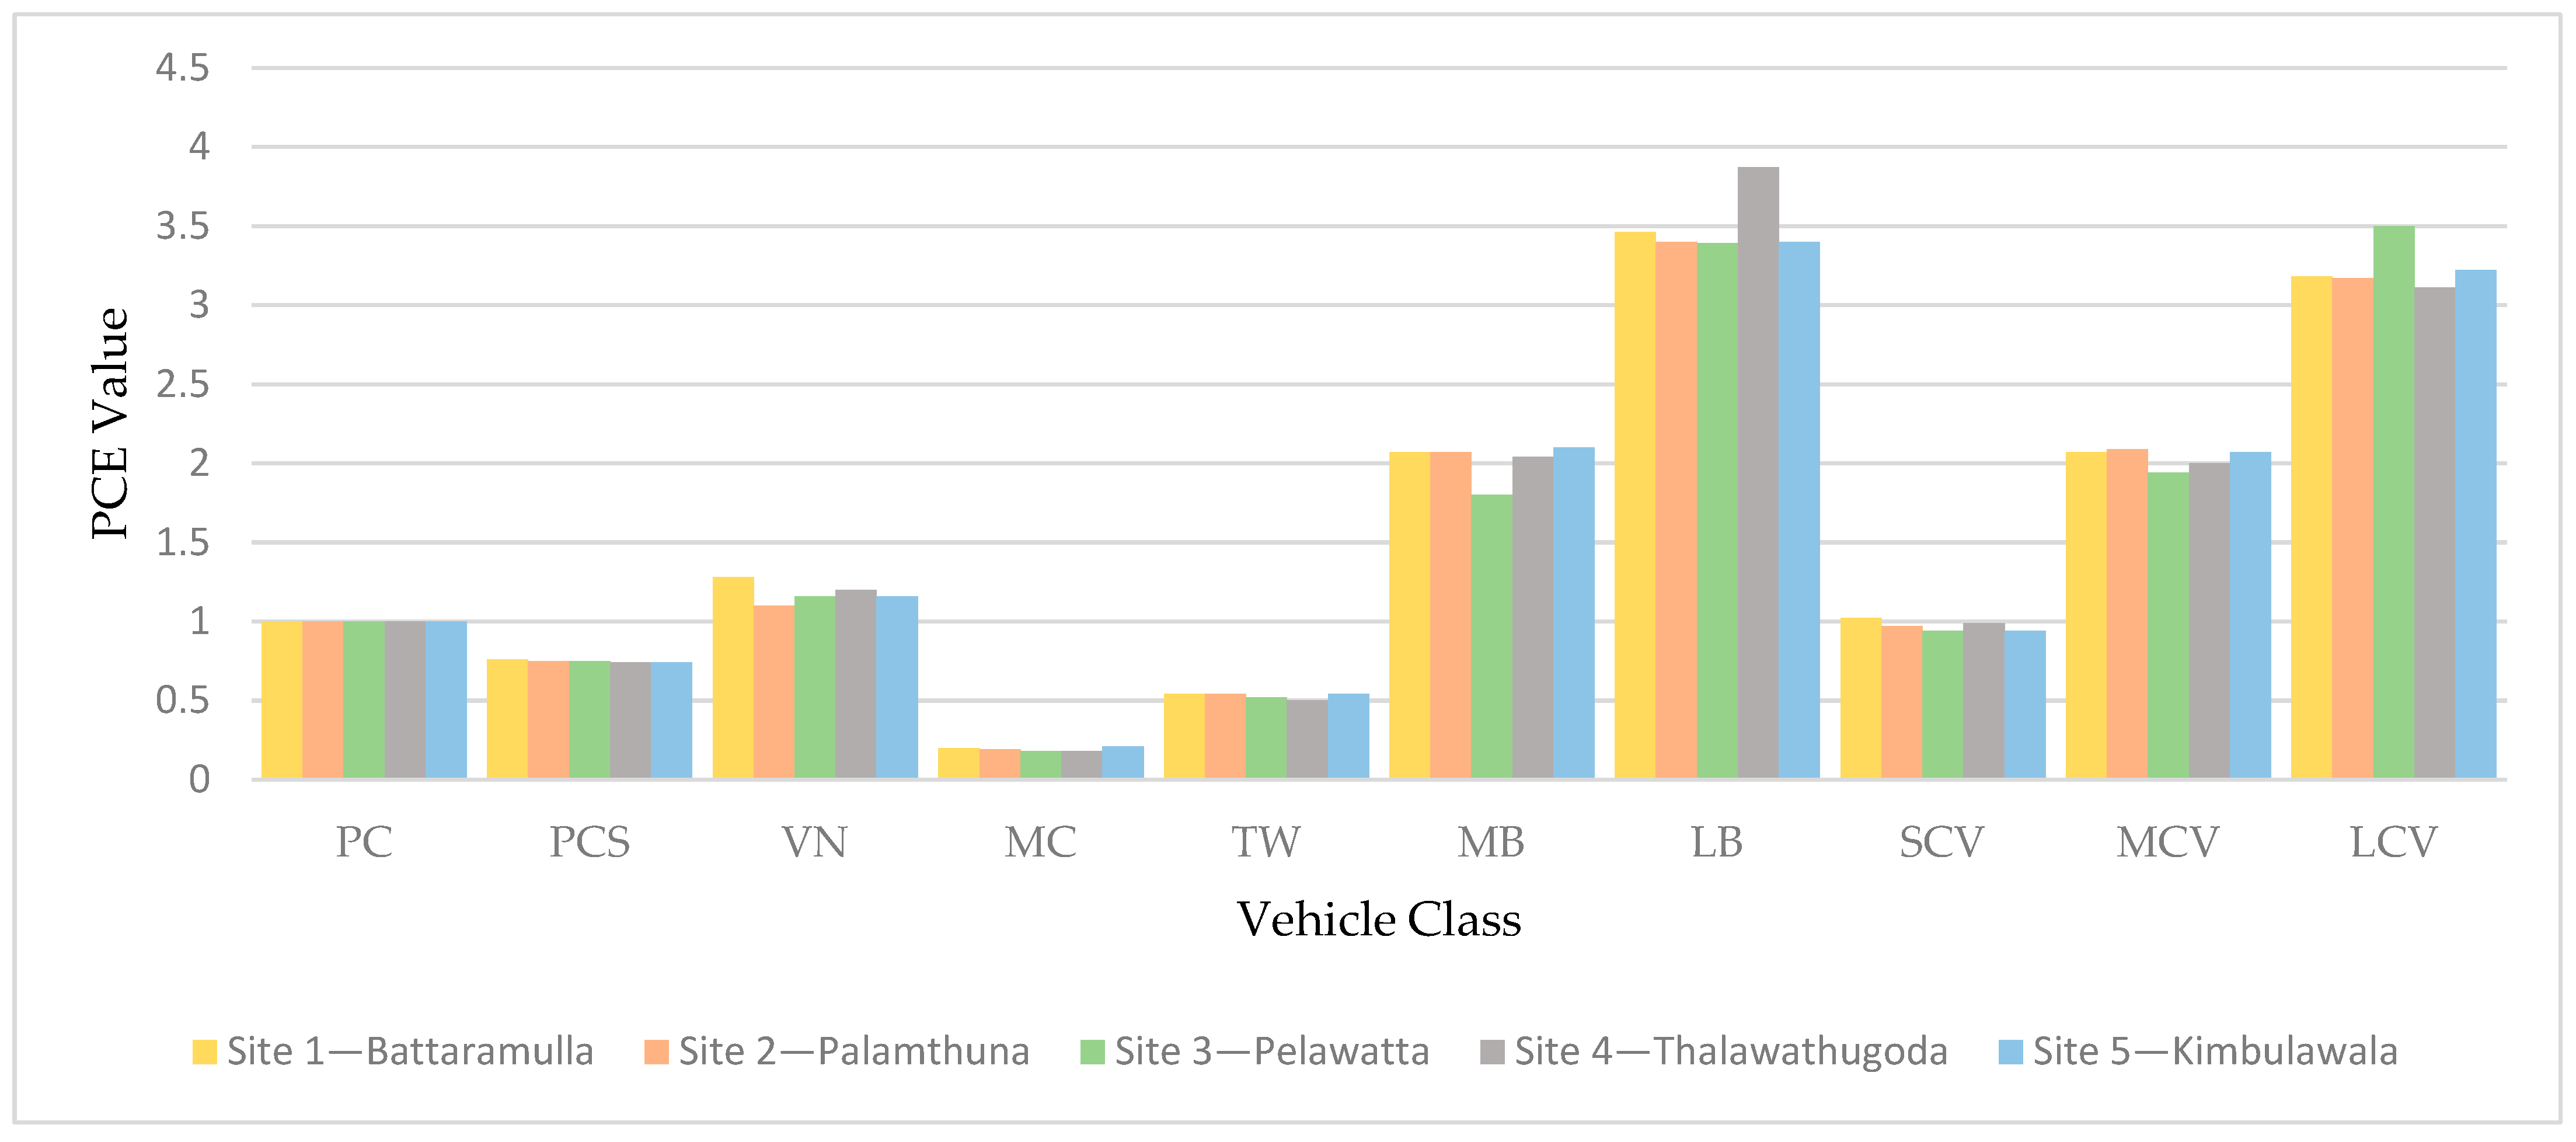
The data analysis was conducted for each vehicle class defined above, across all five sites, and for right-turn and through movements. A summary of the calculated PCE values using the basic headway method for multi-class vehicles across five sites is shown in
Table 2 and
Figure 4.
For each vehicle class, the PCE values estimated across the five study sites showed only marginal variation, as illustrated in
Figure 4 and statistically quantified using the coefficient of variation (CV). In all cases, the CV values were below 10%, indicating low variability and suggesting that the PCE values across sites do not differ substantially from their mean. This confirms that the mean PCE value can be considered representative for each vehicle class. Furthermore, the Friedman test indicated no statistically significant differences in PCE values across the five sites (
χ2(4) = 9.31,
p = 0.054). Therefore, the null hypothesis of equal median PCE values across sites could not be rejected, suggesting that the estimated PCE values were consistent among the study sites. In other words, the differences among sites were not statistically significant at the 5% level, indicating that PCE values remained generally stable across the study locations.
Since the analysed data followed a normal distribution, the simple arithmetic mean was calculated, and the final (average) PCE values are presented in
Table 3.
As discussed earlier, the only study to estimate PCE values for signalised intersections in Sri Lanka was conducted in 1996, which covered three types of traffic scenarios: highway sections (two-lane undivided road and four-lane divided road), signalised intersections, and roundabouts. In recent years, while a few studies have focused on highway sections and expressways, signalised intersections have not been revisited. The present study addresses this gap by examining signalised intersections.
Table 4 compares the resulting PCE values with those from the 1996 study, as well as with values from other studies covering different road sections, providing a general perspective on how PCE values have evolved over time.
Over the years, PCE values in Sri Lanka have shown some variation across vehicle classes and road types, reflecting changes in traffic composition and vehicle characteristics. Small passenger cars (PCS) and motorcycles (MCs) show some decline compared to earlier estimates. Light and medium commercial vehicles (LCVs, MCVs) and larger vehicles such as buses (LB, MB) show noticeable increases in recent studies, particularly on modern roads and expressways, indicating a greater impact on traffic flow than previously estimated.
Focusing specifically on signalised intersections, the 1996 study Ref. [
10] ( provides the only prior benchmark for comparison. Compared with the current study, motorcycles and three-wheelers show slightly lower PCE values than those reported in 1996, indicating a reduced relative impact on intersection operations. In contrast, larger vehicles, particularly medium buses (MBs) and large buses (LBs), exhibit considerably higher PCE values in the present study, reflecting their increased influence on intersection capacity. This increase can be attributed not only to the inherent operational characteristics of buses, such as their larger dimensions, lower acceleration and deceleration capabilities, and longer clearance times, but also to the complex interactions between buses and other road users under mixed traffic conditions. Poor lane discipline and unpredictable manoeuvring behaviour of smaller vehicles, particularly motorcycles and three-wheelers, may increase the difficulty of bus movements through signalised intersections. To maintain operational safety and avoid conflicts with smaller vehicles, bus drivers may adopt more conservative driving behaviour by maintaining larger following gaps and requiring longer time intervals to enter, cross, or clear intersections. These increased headways can contribute to higher observed PCE values for buses.
Furthermore, the increase in bus PCE values is particularly important considering the growth in bus volumes and the continued reliance on public transport in urban areas of Sri Lanka. A higher proportion of buses within the traffic stream can significantly reduce intersection discharge rates, increase queue formation, and contribute to longer delays, especially during peak periods. Therefore, underestimating bus PCE values could lead to inaccurate capacity estimations and inappropriate signal timing designs.
However, the impact of commercial vehicles (small, medium, and large) has generally decreased in the current study compared with the 1996 values, possibly due to improvements in vehicle technology, roadway infrastructure, and operating conditions. Overall, the results indicate that while the relative impact of small vehicles has remained relatively stable and commercial vehicles have become less influential, buses have become a more critical factor affecting congestion at signalised intersections. It should be noted that road conditions in 1996 were inferior to those observed at present in terms of infrastructure quality, maintenance, and operational conditions. In addition, vehicle characteristics, environmental conditions, and driver behaviour have changed considerably over time. With the advancement of Sri Lanka’s road infrastructure and changes in traffic composition, the physical and operational environment has evolved, necessitating the development of updated PCE values that accurately represent current traffic conditions. The observed changes in PCE values over time highlight the importance of periodically updating PCE factors to ensure reliable traffic analysis, intersection capacity estimation, and signal design practices.
Since comparing PCE values at signalised intersections with those from other road sections is not directly relevant, PCE values from signalised intersections in other developing countries are compiled and presented in
Table 5.
A comparison of PCE values for signalised intersections across developing countries shows notable differences in vehicle impacts. Motorcycles (MCs, 0.19) and three-wheelers (TWs, 0.53) in Sri Lanka contribute less to congestion compared to India (MC: 0.4–0.5, TW: 0.61–1.0) and IRC standards. In contrast, medium buses (MBs, 2.02) and large buses (LBs, 3.50) in Sri Lanka have higher PCEs than most other countries, reflecting their greater influence on intersection capacity. Light and medium commercial vehicles (LCVs: 3.24, MCVs: 2.03) are comparable to values reported in India and Liberia, while small passenger cars (PCS, 0.75) and small commercial vehicles (SCVs, 0.97) show a moderate impact. Overall, these results indicate that small vehicles contribute relatively less to congestion in Sri Lanka, whereas buses and heavier vehicles exert a greater effect, emphasizing the need for locally derived PCE values to accurately represent traffic conditions.
The newly developed PCE values provide important practical implications for traffic signal design and capacity analysis in Sri Lanka by offering updated and locally representative factors that better reflect current traffic conditions, vehicle characteristics, and driver behavior. The revised values can improve the accuracy of intersection capacity estimates, signal timing plans, and level-of-service evaluations by accounting for the increased impact of large buses and heavy vehicles, while avoiding overestimation of the influence of smaller vehicles such as motorcycles and three-wheelers. These findings highlight the need to incorporate updated PCE values into future revisions of national design guidelines, replacing outdated values derived from earlier traffic conditions. Regular updates of PCE values based on changing vehicle composition and infrastructure development will ensure that signalized intersection design practices remain responsive to evolving traffic demands and provide more reliable guidance for future transportation planning and operations.
5. Conclusion and Recommendations
The literature review demonstrates that a wide range of methodologies have been developed and applied worldwide to estimate Passenger Car Equivalent (PCE) factors for different vehicle categories under varying traffic and geometric conditions. Among these approaches, the headway-based method has been identified as one of the most appropriate techniques for heterogeneous traffic environments due to its ability to capture the interaction effects among different vehicle classes. Accordingly, the essential headway method was adopted in this study to estimate PCE factors for signalised intersections under prevailing Sri Lankan traffic conditions.
The comparison between the PCE values derived in this study and the currently applied values highlights notable variations, confirming that existing PCE factors no longer adequately represent present-day traffic conditions, vehicle characteristics, and driver behaviour. These findings emphasize the importance of periodically updating PCE values to ensure that traffic analysis and intersection design practices are based on realistic and current traffic characteristics. The results also demonstrate that PCE factors should not be considered as fixed values, but rather as dynamic parameters influenced by changes in vehicle composition, roadway environment, and operating conditions.
The updated PCE values developed through this study provide a more accurate basis for estimating signalised intersection capacity, evaluating traffic performance, and developing appropriate signal timing strategies. These values will assist traffic engineers and planners in analysing traffic flow variations and improving intersection design decisions. Furthermore, the adopted methodology can be extended to other intersection types, including roundabouts and unsignalized intersections, enabling the development of locally representative PCE values for a wider range of traffic conditions.
The drone-based data collection approach used in this study proved to be an effective alternative to conventional traffic survey methods by providing a comprehensive aerial perspective of vehicle movements while reducing manpower requirements, survey errors, and data collection limitations. The method enables efficient, consistent, and rapid collection of high-quality traffic data, making it suitable for repeated applications under diverse traffic and environmental conditions.
Considering the continuous evolution of vehicle characteristics, traffic composition, and roadway infrastructure in Sri Lanka, regular revision of PCE values is essential to maintain the accuracy of traffic engineering practices. Therefore, the PCE factors currently specified in national design guidelines should be updated to reflect contemporary traffic conditions and revised periodically as traffic characteristics continue to change. The integration of drone-based data collection with a systematic analytical framework provides a practical, efficient, and cost-effective approach for achieving such updates.
Overall, this study addresses the limitations associated with outdated PCE values and the challenges of conventional data collection by developing updated, locally calibrated PCE factors for signalised intersections in Sri Lanka. The developed values improve the reliability of traffic flow analysis, signal timing, and intersection capacity evaluation, while providing a valuable technical foundation for future revisions of national design guidelines and improved roadway planning and management.
6. Limitations and Future Directions
This study has several limitations that should be considered when applying the developed PCE values. The derived values are primarily representative of urban signalised intersections and may not fully reflect traffic conditions in rural areas, where vehicle composition and operating characteristics can differ. However, the drone-based data collection approach and the developed methodology provide a practical and economical framework for deriving context-specific PCE values in such environments. In addition, the study was conducted along a single major corridor serving traffic to Colombo. Although this corridor represents significant urban traffic conditions and is suitable for intersection operational analysis, future studies covering a wider range of locations would improve the general applicability of the results.
While drone-based monitoring offers significant advantages, its application may be affected by operational constraints such as weather conditions, battery limitations, and regulatory requirements. Future research should further validate the methodology under different traffic and environmental conditions and extend its application to other facilities, including roundabouts, unsignalized intersections, expressways, and rural road networks. These efforts will support the development of comprehensive and regularly updated PCE values for future traffic engineering applications and guideline revisions.