Article

Assessment of Passenger Car Equivalency for Increased Heavy Vehicles Percentage on Urban Multilane Roads—A Field-Based Study


by
Nawaf M. Alshabibi
Urban and Regional Planning Department, Imam Abdulrahman Bin Faisal University, Dammam 34221, Saudi Arabia
Future Transp. 2026, 6(2), 85; https://doi.org/10.3390/futuretransp6020085
Submission received: 10 March 2026 / Revised: 7 April 2026 / Accepted: 8 April 2026 / Published: 11 April 2026

Abstract

Heavy vehicles leave a significant impact on passenger vehicles, which results in traffic instability. The size, acceleration, and behaviour of heavy vehicles notably influence the traffic flow. Considering this, traffic engineers have developed Passenger Car Equivalency (PCE) to examine the capacity, Level of Service (LOS), and flow of the urban roads. The aim of this study is to analyze the King Abdulaziz (KA) freeway in Dammam, Saudi Arabia, where heavy vehicles represent 35% of the peak hour traffic, which exceeds the PCE value given in the Highway Capacity Manual (HCM). This study addresses the given gap by employing the saturation headway approach. The study findings reveal PCE values of 1.78 for moving towards the port and 1.81 for coming from the port, respectively. These values are in line with the patterns of HCM, as the indication of low PCE denotes the appearance of increased heavy vehicles. Furthermore, the LOS was known to be of level E, reflecting frequent delays and slowdowns. The capacity in operations was reduced by 44–45%, thus emphasizing the requirement for strategic traffic approaches with functional interventions for heavy vehicle routes.

1. Introduction

In recent decades, regarding freeway characteristics, rapid growth in population has led to an increased demand for transportation. This has caused traffic congestion, which has become a serious challenge [1]. According to Pawar et al. [2], urbanization has increased the number of vehicles, which gives rise to more crowded roads. Ultimately, this creates more vehicle queuing, slower speeds, and extended travel time. Furthermore, it also contributes to road accidents, energy demand, and pollution. According to previous studies, traffic congestion has been identified as one of the major issues in urban road networks across the world, and this has impacted the capacity of traffic to move swiftly and the reliability of travelling within the urban road network [2]. According to reports on global traffic, London was positioned at the top of the list of congested cities, where drivers lost about 156 h a year as a result of congestion. On the same note, other cities like Chicago, Boston, and New York also experienced heavy delays in the course of travelling. Dammam has been cited as one of the most congested cities in Saudi Arabia, with drivers reported to have lost about 8 h of their time in traffic jams in the year 2022 [3]. Heavy vehicles (HVs) have distinct physical and maneuvering features, which affect the traffic flow. The large size and steering style of these heavy vehicles exert behavioural and psychological influences on the drivers of the adjacent vehicle. Understanding the concept of headways is important for studying the characteristics of traffic flow. These have been distinguished into two types, namely time and space headways. Time headways are easier to measure in terms of capacity and saturation flow. Headways are used to control traffic signals and identify gaps at unsignalized intersections. Moreover, the headways of various vehicles are different. For instance, trucks occupy a large space, with more time required to accelerate compared to other vehicles, and thus have larger headways. Therefore, recognizing these differences is notably important in congested areas where larger headways contribute to traffic saturation [4]. Studies have observed that heavy vehicle (HVs) and passenger drivers behave differently when changing lanes on freeways [5] and arterial roads [6]. Studies by Huddart and Lafont [7] and Sayer et al. [8] reported that when following heavy vehicles, passenger vehicle drivers maintain shorter headways than when following passenger vehicles. Another study by Brackstone et al. [9] reported similar findings in that, compared to a heavy vehicle, a passenger vehicle produced less headway space in a vehicle lineup. Likewise, Rakha et al. [10] demonstrated that heavy vehicles exhibit slow acceleration power as compared to passenger vehicles. To evaluate the traffic volume more precisely, the Passenger Car Equivalency (PCE) factor was introduced in the American Highway Capacity Manual [11]. The HCM defines PCE as “The number of passenger cars displaced by a single heavy vehicle of a particular type under prevailing roadway, traffic, and control conditions” [11]. Lately, the King Abdulaziz (KA) freeway in Saudi Arabia has faced growing problems of traffic congestion, delays, and road safety concerns due to the increasing proportion of HVs. A PCE value of 1.5 was previously adopted, as recommended by the HCM. However, no calibration studies have been found in the literature. According to the Highway Capacity Manual [12], the PCE value decreases with an increasing percentage of HVs, and the latest version of HCM provides data for up to 20% HVs. Many countries have performed extensive recalibrations of PCE values for a wide range of terrains and traffic conditions. The PCE values for different HVs have been outlined by the HCM (2016), as presented in Table 1 [12]. For level terrain, the recommended PCE value is 1.85 for HVs for 20% or greater traffic stream, thus lacking calibration for higher levels.
Researchers have evaluated PCE calibration at signalized intersections [13,14,15,16,17,18], HVs’ behaviour at roundabouts [19,20,21,22,23,24,25], level highways [26], level highways under over-saturated conditions [26,27,28,29], uncongested flow [30], roads with gradients [31], and uninterrupted flow conditions [32]. Few studies have specifically focused on level highways during free-flow conditions [30,33], characteristic freeway segments [34], HVs at signalized intersections (based on delays) [15], or using vehicle-hours of road utilization [35].
Various methodologies have been adopted on the basis of speed, density, and headway [36,37,38]. Among these, the headway approach is mostly preferred due to its simplicity in measuring flow density [32]. Additionally, microsimulation software have been utilized to offer real-world traffic flow conditions [39,40,41,42]; however, their accuracy relies on rigorous calibration and validation against real-world data [43]. Additionally, driving behaviour in any region is strongly influenced by socio-economic conditions, passenger and freight transport dynamics, patterns of land use, and accessibility [44,45,46,47]. These factors contribute to differences in traffic conditions and behaviour. For instance, the 2020 study on public transportation in the Dammam Metropolitan Area (DMA) identified that transportation and freight mobility in Saudi Arabia are different from that in the USA [47]. Despite these differences, transportation agencies in Saudi Arabia still use Texas Transportation Institute (TTI)-based models for transportation planning studies, assuming that trip generation, travel demand, and behaviour are similar to those in the U.S. As both countries have varying socio-economic conditions, land usage, and driving patterns, these models are not completely accurate. Thus, investigating local traffic parameters is equally important for decision making, model calibration, and proposing solutions for highways with high proportions of HVs.
This reliance on imported models, with limited literature available in the Saudi Arabian context, has created a significant gap. This emphasizes the need for studies specific to the region and conditions of Saudi roadways. To address this gap, the study determines the current PCE values for the King Abdulaziz (KA) freeway and compares them with the values given in [12]. It also aims to evaluate the current proportion of HVs on the KA freeway and to assess the prevailing Level of Service (LOS). The novelty of the study lies in its examination of HVs up to 35% on the KA seaport freeway, exceeding the 20% usual threshold established by existing models. The study provides insights for improving capacity assessments and for guiding effective traffic management practices in expanding HV traffic areas.

2. Materials and Methods

2.1. Study Area

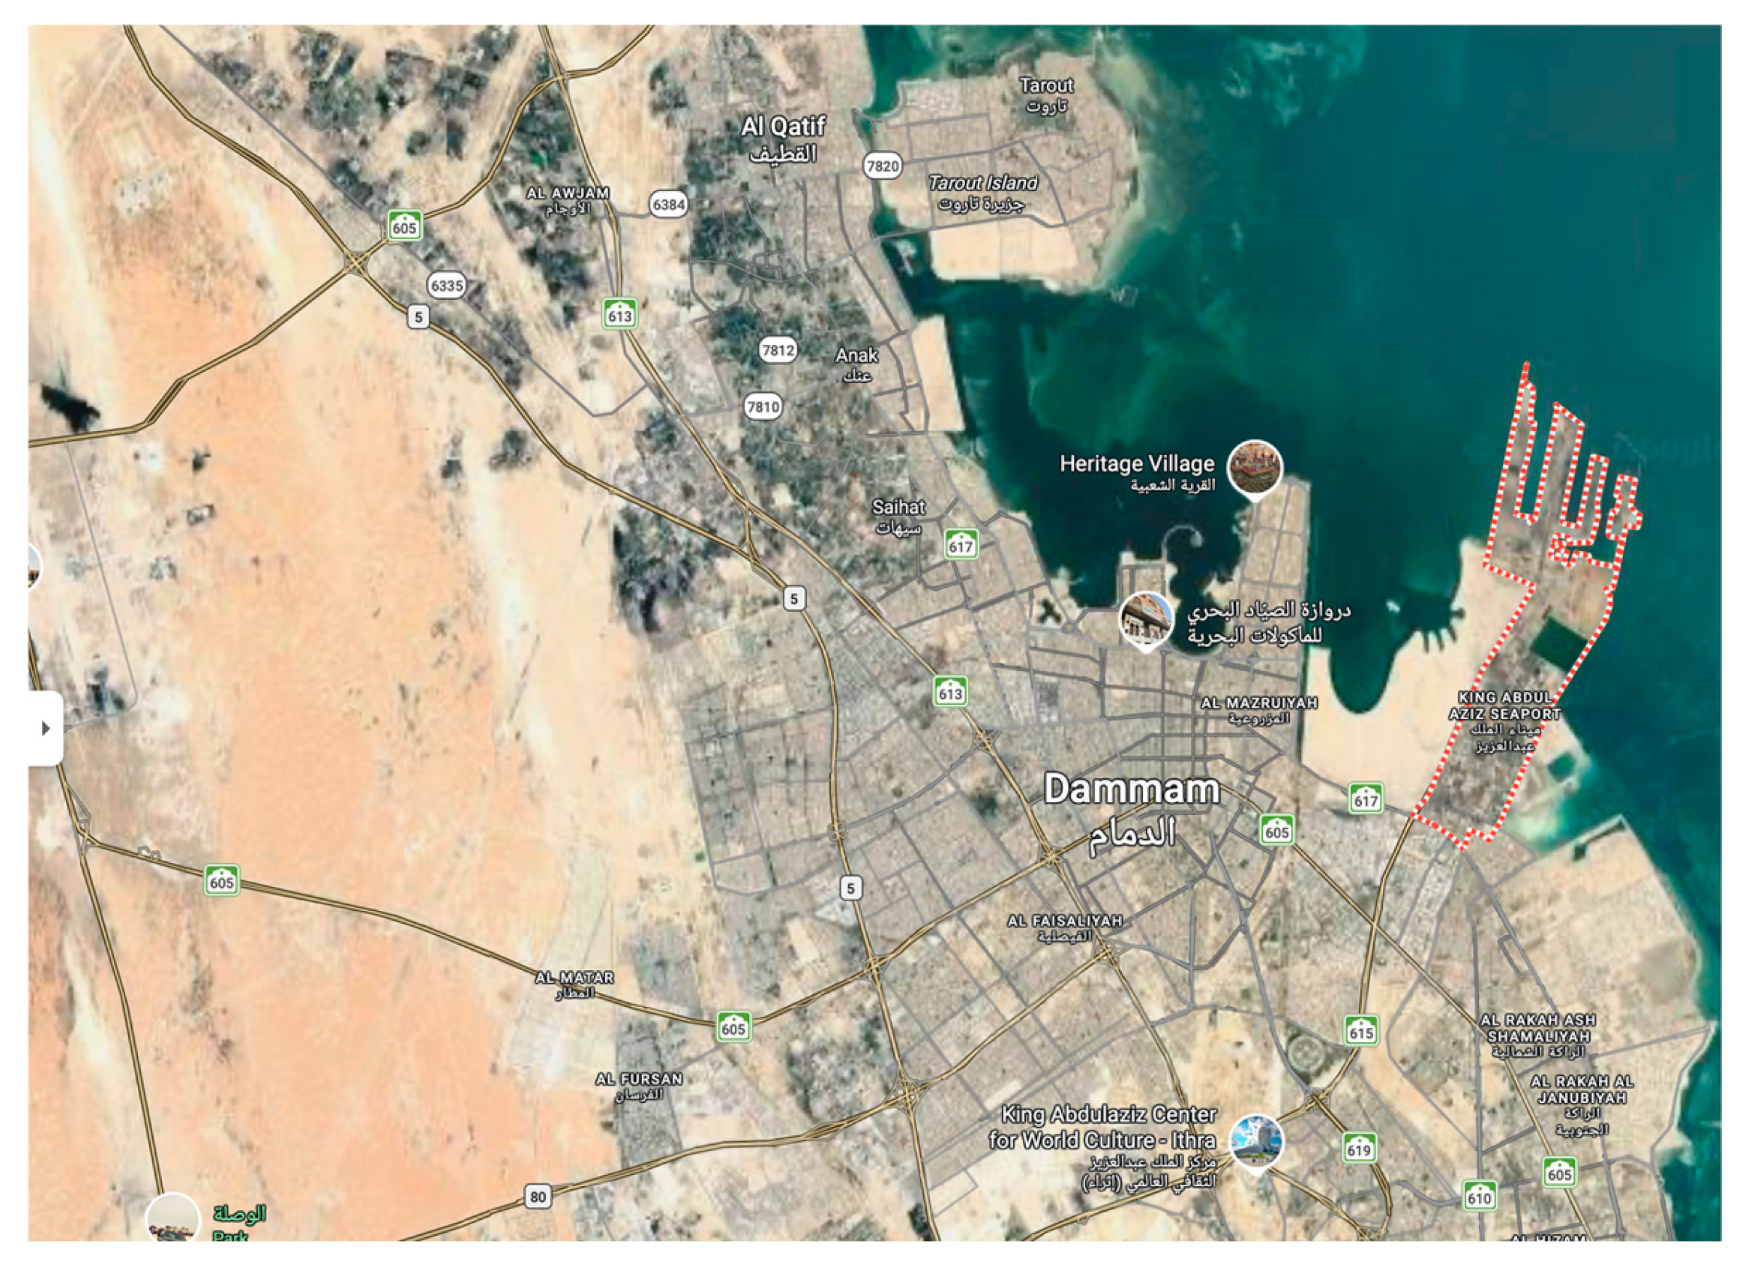
Saudi Arabia, one of the largest exporters of oil in the world, has developed nine seaports as an international way of conducting maritime trade. One of them is the King Abdulaziz (KA) Port, which is located in Dammam (Figure 1), the fourth-largest seaport in the country. The port is one of the main ports of entry for imports and exports to the eastern and central regions; it is found in the Eastern Province. KA Port is a high-throughput facility, and it handles a volume of at least 1.5+ million TEU annually, or nearly 200 containers per hour [48]. In 2019, operational mechanisms led to a reduction in the average truck turnaround time of KA Port to 45 min [48] due to operational improvements, making the port more efficient but, at the same time, causing a significant rise in the amount of heavy-vehicle (HV) traffic in the territory of the port itself and on the adjacent King Abdulaziz Freeway, where the issues of capacity and safety remain a serious concern [49].

2.2. Freeway Configuration

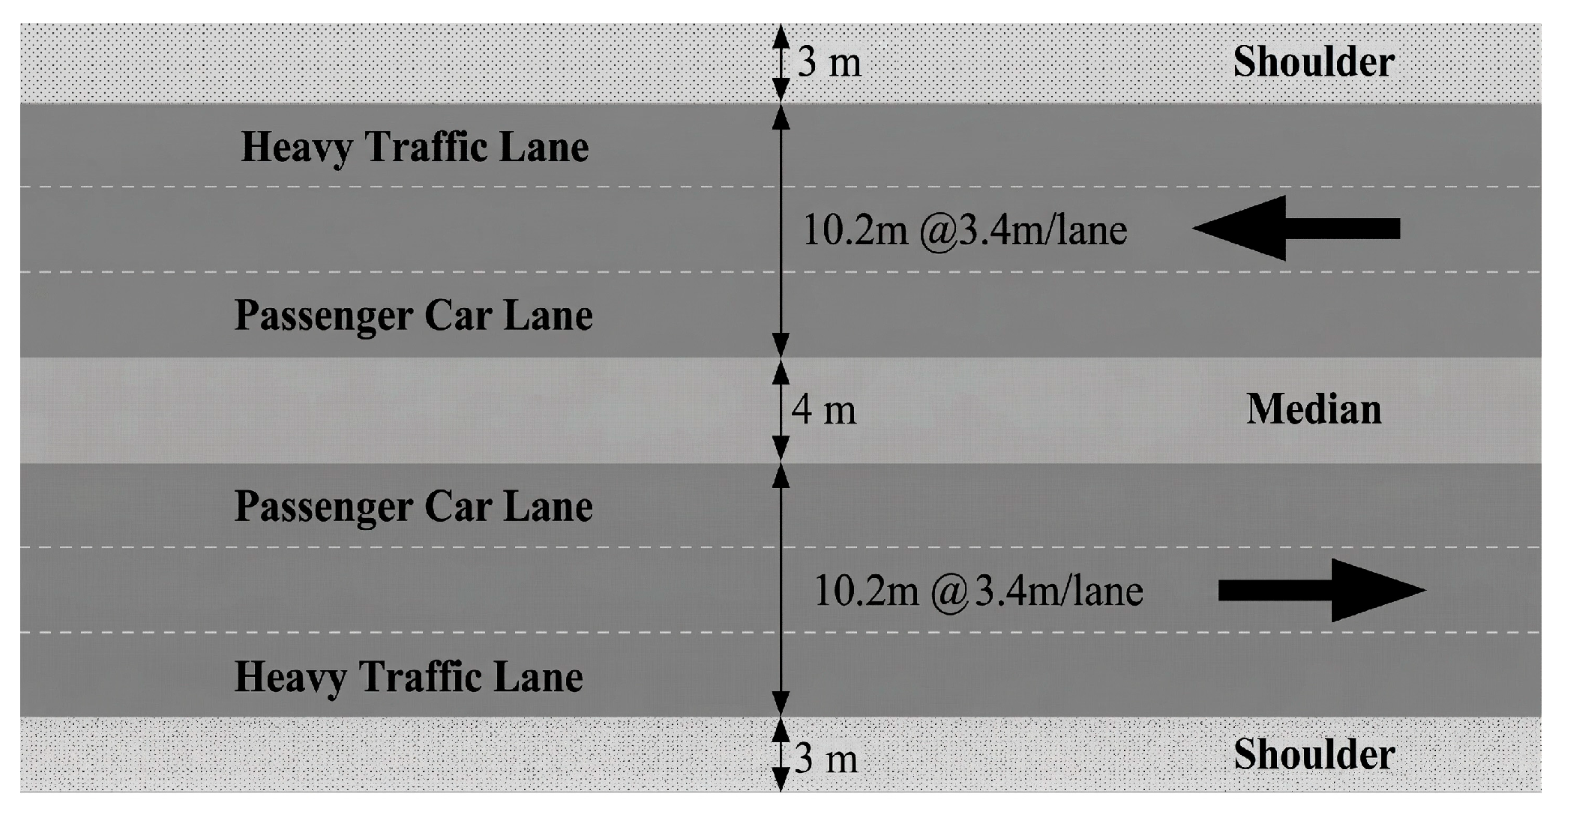
The survey of the field was performed on the King Abdulaziz Freeway, the only road that connects KA Port with the large expressways (Figure 1). The chosen segment is a standard section of freeway that is level in grade, does not contain intersections, mergers, divergers, or weaving lanes, and may be said to be free of disruption to traffic flow. The freeway has three lanes: the right one is used by heavy vehicles (54-foot container trucks heading to the port); the left one is used by passenger vehicles (PVs) only; the centre one has both types of vehicles. In this study, free-flow conditions define a continuous flow of vehicles whereby the flow of the vehicles is not affected by downstream bottlenecks, intersections, or signalized control. In these circumstances, drivers are relatively steady in their speeds with minimal forced deceleration, and headway behaviour can be attributed to the natural vehicle-following nature of the vehicle rather than the influence of congestion. To conduct the analysis, the left lane was considered as the base lane (PVs only), and the middle and right lanes were considered mixed lanes (PVs and HVs), as shown in Figure 2.

2.3. Data Collection

Nine successive weekdays were used to gather traffic data in the morning and evening, peak hours for the free-flow condition. The data were gathered on various days of the week and on peak hours to minimize the effect of time on the data and deliver a better representation of the actual commuting traffic situation. For each direction of travel, both ways towards the port and outside the port were observed to obtain the entire dynamics of the operations. The time interval between consecutive vehicles that pass a fixed point of observation was measured through the Saturation Headway method. This is a well-known technique for calculating the flow and density properties [32], and it was employed individually on each type of lane. Headways were recorded between the consecutive passenger vehicles in the base lane, but in the mixed lanes, it was recorded between both HV-HV and HV-PV. The validity and verification of the manually extracted data were assessed through continuous video recordings. A total of 38,568 valid observations of headway were made, that is, some 19,000 in each direction, as shown in Table 2. The PCE of mixed traffic depends on the proportion, type, and performance characteristics of heavy vehicles, such as the acceleration, deceleration, and power ratios [33,50].
It was observed in the field that most of the heavy vehicles were 54-foot container trucks that had similar physical and operational features. Hence, heavy vehicles were considered as one representative group to provide an adequate sample size and uniform comparison of the headway behaviour. The selection of observation sites and timing was performed in such a way that it would be more consistent in geometric characteristics, traffic structure, and the state of free flow. Since most HVs were 54-foot freight trucks, a single Passenger Car Equivalency (PCE) figure was calculated in the case of HVs.

2.4. PCE, Capacity, and Level of Service (LOS) Calculation

The PCE of HVs was determined by comparing the saturation headway difference in mixed traffic lanes with the base traffic lane. There are a number of methods that can be used to estimate Passenger Car Equivalency (PCE), and these are the speed-based, density-based, and simulation-based methods. It is common in the literature to use the headway ratio method in the investigation of traffic on freeways, since it is able to directly measure the effect of vehicle interaction, and it does not require as many assumptions about the behaviour of traffic. It has been shown in the previous literature that headway-based PCE estimation gives valid results in the case of steady flow and homogenous roadway geometry. Thus, this study made use of the headway ratio approach as an empirically supported practical approach. The calculation is outlined in Equation (1).
P C E H V = H m i x H b a s e
where P C E H V   denotes the Passenger Car Equivalency value of freeway, in passenger car units (PCU). H m i x   is the average saturation headway of mixed traffic lanes (in seconds) and H b a s e   is the average saturation headway of the base traffic lane (in seconds). Subsequently, the average saturation flow rate can be directly calculated from the recorded field data of average saturation headway as follows:
v = 3600 h
In which v is the saturation flow rate (veh/h lane/s), and h is the mean headway(s).
Since the lane-specific volume data could not be determined, the Level of Service (LOS) was evaluated qualitatively, as suggested in the Highway Capacity Manual [12]. The qualitative evaluation was backed by the observed headway distributions, flow stability, and the PCE-adjusted capacity approximations of the measured headways. This method gives a realistic simulation of the working conditions in mixed traffic and matches the methods used in past research [16,51,52,53,54].

2.5. Data Reduction and Analysis

The raw headway data were filtered to identify the observations that were made during saturated traffic flow. Standard statistical screening was used to identify outliers and extreme values and eliminate them (headways < 0.5 s or >30 s were excluded). Headways that were below 0.5 s and above 30 s were eliminated based on generally accepted filtering procedures in traffic flow research, so as to eliminate unrealistic driver behaviour and discontinuous traffic situations that are not indicative of stable vehicle-following behaviour. Consistency in data was also confirmed by comparing manual counts and time-stamped video recordings. A total of 31,773 valid saturation headways were used following the cleaning, as shown in Table 3. These are the conditions that are nearest to the theoretical capacity of every type and direction of lane.

2.6. Statistical Analysis

This study used the two-sample t-test with unequal variances (Welch’s two-sample t-test) to test the hypothesis that the mean saturation headways are different in the base (passenger-car) and mixed (heavy-vehicle) lanes. The Welch t-test was chosen as there were unequal sample sizes and the two traffic conditions might have a difference in variance. This is suitable when comparing independent samples of different sizes and variances, as is the case in the data on traffic flow. The level of significance was established as 0.05 (95% confidence).
H0: 
There is no statistically significant difference in the mean headways in the passenger-car lanes and the mixed-traffic lanes.
H1: 
There is a statistically significant difference in mean headways observed on passenger-car lanes and mixed-traffic lanes.
where h o and h 1 are the mean values of saturation headway of base traffic and mixed traffic lanes, respectively.
To assess the effect size, Cohen’s d was calculated in addition to the t-statistic and p-value, and the mean differences have been calculated with 95% confidence intervals. The cleaned headway data were analyzed statistically with Python (SciPy 1.11) and consisted of 31,773 observations. This is a robust process that made the difference in mean headways apparent when the difference in mean headways was observed, and it shows a statistically and practically significant difference in traffic-flow behaviour between lane types and directions.

3. Results

3.1. Comparison of Mean Saturation Headways

Descriptive statistical analysis showed that there were statistically significant differences in the mean saturation headways of the passenger-car lanes and the mixed (heavy-vehicle) lanes in both directions of travel, as shown in Table 4. In traffic flowing in the direction of the port, the average headway in passenger-car lanes was 2.69 ± 1.18 s, and in mixed lanes it was 4.78 ± 1.84 s. The difference of 2.09 s, obtained subsequently, was very significant (t (≈7 110) = −73.88, p < 10−16, 95% CI [−2.15, −2.03], Cohen’s d = 1.46) and represents a large effect size. For traffic out of the port, the mean headways increased in the passenger-car lane by 2.84 ± 1.16 s compared to the mixed lane as 5.14 ± 1.92 s, and the difference in mean of 2.30 s was also significant (t (≈7662) = −81.53, p < 10−16, 95% CI [−2.36, −2.24], Cohen’s d = 1.57). These results suggest that heavy-vehicle lanes are characterized by a longer headway and more variability, which are associated with slower acceleration and greater spacing and maneuverability.

3.2. Capacity and Passenger Car Equivalency

Based on the measured mean headways, lane capacities were calculated from Equation (2) v = 3600/h. The percentage reduction in the capacity was calculated by comparing the estimated flow rates based on the values of mean headway using the basic formula between flow and headway (Flow = 3600/mean headway). The variations between the passenger-car lane capacity and mixed lane capacity show the impact of the heavy cars on the performance of the traffic. As shown in Table 5, the resultant saturation flow rates of vehicles going towards the port were 1338 veh h−1 ln−1 and 753 veh h−1 ln−1 for passenger-car lanes and mixed lanes, respectively. The respective capacities of the traffic that moved away from the port were 1268 h−1 ln−1 and 700 h−1 ln−1. The Passenger Car Equivalency (PCE) values that were obtained were 1.78 (to-port) and 1.81 (from-port), meaning that one heavy vehicle has a flow effect equivalent to about 1.8 passenger cars. The relatively low PCE values in comparison with the HCM recommended value of 1.85 for heavy vehicles could be explained by the fact that the geometry of the roadway is slightly uniform, there are no steep gradients, and the composition of heavy vehicles is also made up by a majority of container trucks, which makes the behaviour of the headway more stable. These values mean that the effective lane capacity would present a 44–45% decrease when the heavy vehicles are present, which clearly shows how significant the effect is on throughput.

3.3. Level of Service Evaluation

The measured average headways are also in the range of Level of Service (LOS) D in passenger-car lanes and Level of Service (LOS) E in mixed lanes according to the lane-capacity guidelines in the Highway Capacity Manual [12]. This loss of LOS demonstrates the adverse effect of the presence of heavy vehicles on the stability of flow and the freedom of maneuver. The slightly increased PCE measure of the from-port direction is in line with the trucks having heavier loads with slower acceleration capability, thus having longer headways and more capacity losses. On the whole, these results suggest that the high percentage of heavy vehicles significantly reduces the performance of lanes in the seaport environment, which restricts the efficiency of operations and fosters the environment for congested flow regimes. The greater variability of headway and lower maneuverability in mixed traffic lanes support LOS classification. Such conditions are in line with HCM descriptions of LOS D and LOS E, during which the traffic flow becomes unstable, and drivers lose operating freedom. The HCM headway–flow relationships were used to interpret the LOS classification with a high headway variability and lower speeds, corresponding to LOS D-E operating conditions.

4. Discussion

The current research examined the impact of heavy vehicles (HVs) on the level of traffic performance within the King Abdulaziz (KA) Freeway, which is the main access route to the King Abdulaziz Port in Dammam. The analysis has found that the average saturation headway of HV lanes was very large compared to the passenger vehicle (PV) lanes in either of the directions, thus validating that HVs play a significant role in reducing the lane capacity and amplifying variation in flows. The increased headways found in mixed traffic suggest that HVs take more time to accelerate and decelerate and have larger clearance distances to ensure safety, resulting in low throughput in the otherwise stable flow conditions. The difference in Passenger Car Equivalency (PCE) values between the directions, which amounts to 1.81 in case of traffic on its way out of the port and 1.78 in case of traffic on its way into the port, can be explained by the operational and behavioural factors in the form of load differences, acceleration performance, and driving behaviour at the port gates. The difference between passenger-car-only lanes and mixed-traffic lanes can create behavioural variability, which is associated with the preference of lanes and the psychology of drivers. The headways of drivers in private passenger-car lanes might be shorter than those in mixed lanes, in which heavy vehicles affect lane-changing behaviour and acceleration behaviour. Leaving the port, drivers will tend to run at increased loads and reduced acceleration, which will augment their spatial requirements and headway and lead to high values of PCE. The results are in line with previous studies indicating HVs as a significant cause of disruption to the flow of multilane freeways [51,55]. Research carried out in Brazil and India has found greater values of PCE, which were about 2.0 to 2.2 in heterogeneous conditions and geometrically constrained conditions, which shows that the relatively small values of PCE in Dammam imply that they have well-designed and uniform corridors. However, the effective capacity depreciation of almost 45% on the KA Freeway highlights the harshness of HV effects even in the geometrically optimized design. The findings are consistent with Derse and Woensel [56], who highlighted that the flow heterogeneity along seaport corridors is increased by operational delays, as well as by lax driving behaviour in freight-dominated areas. Equivalent capacity losses in behaviour dependence have been recorded in European freight terminals and intermodal corridors in North America, where the operative conditions of stop-and-go at the boundaries of port gates have a great impact on the headway variance of HVs [57]. The trends in the headway patterns also represent the downgrading of the Level of Service (LOS) from D to E, which suggests that mixed lanes are operated near saturation. The result is similar to that of Ghanim and Abu-Lebdeh [4], who discovered that the presence of heavy vehicles is a major cause of queue formation and flow disruption in comparison to passenger vehicles. Wang et al. [58] then showed that when the port-access conditions are constrained, high HV concentration can cause the v/c ratio to exceed the critical values and, as a result, cause non-linear drops in capacity. Interestingly, the marginal effect of HVs on capacity increases less as congestion increases, with all vehicles experiencing the same constraint on speed. Wang et al. [58] have also shed light on this phenomenon.

4.1. Implications and Recommendations

The results of this study have significant impacts on the development and operation of freeways related to the seaport. The 44–45% capacity loss that is empirically observed, together with the PCE values at almost 1.8, justify the application of specific heavy-vehicle control and lane management. Operation efficiency can be significantly enhanced by devoted truck lanes or lane-restriction policies in cases when heavy-vehicle shares are more than 20–25%, as has been shown in recent assessments by Gonah et al. [59]. Chandra et al. [60] also found that lane segregation decreases turbulence along passenger lanes and improves steady flow at high-freight times. The constant flow of freight through the KA corridor is an important argument in favour of the implementation of Intelligent Transport Systems (ITSs) and dynamic lane control. Adaptive lane assignment, real-time vehicle monitoring, and speed harmonization in the domains of ITS intervention have been demonstrated to alleviate the instability of flows and decrease the variance of headway [61]. Such systems might be used to coordinate the dispatching of the trucks with the availability of the capacity in the freeway by integrating them with the port-gate operations, and this would help to smooth out the interaction between freeway and freight traffic. Furthermore, technologies of truck platooning and connected freight vehicle systems have shown promise in achieving effective headway reductions of 10–20% and in offsetting the apparent capacity losses without any physical extension [62]. The KA Freeway would be a good place to pilot these advanced coordination systems to determine their viability in mixed-flow conditions. The other critical implication relates to temporal demand management. Port-to-road resource alignment via off-peak scheduling and dynamic tolling has been shown to be practical in flattening the peak demand curves in other similar seaport corridors [58,63]. The incentives of pricing to the freight movements during the nighttime and the controlled windows for the access can be used to shift the traffic temporally, thus minimizing congestion at the same time as logistical efficiency is maintained. Such temporal shifts might be supported by complementary infrastructure like regional freight centres, which can provide staging and consolidation regions, not directly related to the main corridor. Dedicated infrastructure, ITS integration, and time-based control actions used jointly would lead to a net increase in throughput, a decrease in delays, and sustainable freight mobility in the rapidly urbanizing port regions.

4.2. Limitations and Future Research Direction

Despite the fact that this work presents solid empirical data on the heavy-vehicle effects on the traffic flow in the areas of seaport corridors, a number of limitations should be mentioned. The analysis was only restricted to one section of a freeway in stable geometrical and environmental conditions, which could be a barrier to the generalizability of the results to more complicated networks or to different terrain. The experiment relies on the observations of one seaport corridor and might not be a complete reflection of the traffic situation on other freeways with varying traffic structures or geometric factors. The data collection was performed during peak hours on weekdays, thus not covering the off-peak, nighttime, weekend, or holiday traffic conditions; additionally, the classification was limited to passenger and heavy vehicles, without the intermediate category of light trucks and buses. The heavy vehicles were considered as one category due to the prevailing container trucks. Headway characteristics could be affected by variations in loading conditions, engine performance, and driver behaviour. The influence of weather, light, and geometric curvature was not explicitly analyzed, but these factors may affect the behaviour of drivers and have an impact on headway formation.
Future research ought to build upon the current study by undertaking multi-site and multi-period analyses to observe time and regional changes in heavy vehicle behaviour. It would be possible to test other lane formations, freight schedule possibilities, and truck lane separation tactics by including microscopic traffic simulation models such as VISSIM or AIMSUN, calibrated with the existing dataset. Also, the driver behaviour models (especially car-following and acceleration response models) may provide a more intricate insight into the impact of load, performance, and perception differences on the variability in headway. Freight technology is rapidly changing, and, therefore, the implications of connected, automated, and platooned freight vehicles should be examined in the future. Research has revealed that these technologies are capable of minimizing the necessary headways, increasing stability, and improving safety in the mixed-traffic scenario [61,62]. By applying these studies to seaport access corridors, it might be possible to understand how automation might change traditional PCE and LOS measures. Also, linking traffic performance data to environmental and economic data, such as emissions, fuel consumption, and logistics expenses, would enable a comprehensive evaluation of the sustainability of the corridor. These multidimensional models can help to work out comprehensive freight management strategies that would be consistent in achieving economic productivity as well as environmental and mobility goals.
Altogether, the present paper supports the fact that heavy traffic causes a tangible and considerable impact on the efficiency of traffic flows in seaport-access corridors. The KA Freeway, despite its geometrical uniformity and high standards of design, suffers significant capacity losses due to the preponderance of freight traffic. The findings build on the fact that the management of these impacts draws on both infrastructure-based and operational approaches, which provide empirical evidence and can be supported by emerging transport technologies. Seaport corridors can be designed by using integrated policy, infrastructure interventions, and technology interventions in order to convert them into more efficient, resilient, and sustainable parts of national logistics networks.

5. Conclusions

This study adds an empirically based realignment of Passenger Car Equivalency (PCE) to urban multilane freeways of high heavy-vehicle (HV) composition, which is one of the few empirically based investigations rooted in the seaport corridor of Saudi Arabia. Using the saturation headway methodology, it was quantified that the capacity of the operation at the King Abdulaziz (KA) Freeway had reduced by a significant margin of 44–45%, and the values of PCE were 1.78 and 1.81 in the to and from directions, respectively. These results, as well as supporting previous international studies, increase the understanding of the effects of mixed-traffic flow dynamics in a region where the traits of imported traffic were often not effective in explaining local behavioural, economic, and infrastructural facts. What is new about the present inquiry is the contextualization of the role of PCE in the idiosyncratic logistic ecosystem of the Arabian Gulf, where freight peaks are driven by port, platooning behaviour by heavy trucks, and driving cultures that are socio-economically specific. In contrast to the calibration thresholds assumed by Highway Capacity Manual (HCM) [11], which assumes a maximum HV share of 20%, the given study provides empirical evidence about the substantial influence of the share on the capacity and Level of Service (LOS) at 35% of the HV share, which will provide practitioners and policymakers with actionable, region-specific calibration parameters. Its results challenge the continued use of the HCM-based model without regional adjustment and advocate the building of Saudi-specific traffic performance models with real freight movement attributes. Theoretically, the investigation highlights the necessity to redefine PCE as a moving parameter that is behaviorally contingent and changing, rather than as a fixed coefficient that varies with the freight intensity, acceleration capacity, and geometric homogeneity. In practice, the results suggest the need to have comprehensive management systems that integrate infrastructure-based solutions (specific truck lanes, off-peak relocation schedules) with the new technologies (ITS, platooning, connected freight systems) to alleviate congestion in the seaport corridors. Future studies ought to question PCE recalibration in changing geometric and environmental situations, micro-simulate with real empirical headway data, and extrapolate the study to hybrid freight systems with connected and automated vehicles. This study will provide the basis for a new generation of freight-mobility models that are relevant to the Gulf logistics networks, which are rapidly growing in size and complexity, requiring efficiency, sustainability, and resilience to coexist in more complicated traffic systems.

Funding

This research received no external funding.

Institutional Review Board Statement

Not applicable.

Informed Consent Statement

Not applicable.

Data Availability Statement

The raw data supporting the conclusions of this article will be made available by the authors on request.

Acknowledgments

The author is thankful to all the associated personnel in any reference that contributed to the purpose of this research.

Conflicts of Interest

The author declares no conflicts of interest.

Abbreviations

The following abbreviations are used in this manuscript:
TRBTransportation Research Board
CIConfidence Interval
SDStandard Deviation
dfDegrees of Freedom
SciPyScientific Python (Python library used for statistical analysis)
PCEPassenger Car Equivalency
HVsDirectory of open access journals
PVsPassenger Vehicles
LOSLevel of Service
KAKing Abdulaziz (Freeway/Port context)
HCMHighway Capacity Manual
PCUPassenger Car Units
DMADammam Metropolitan Area
TTITexas Transportation Institute
TEUTwenty-Foot Equivalent Unit
ITSIntelligent Transport Systems
VISSIMVehicle Interactive Simulation of Intelligent Mobility
AIMSUNAdvanced Interactive Microscopic Simulator for Urban and Non-Urban Ne works

References

  1. Muhammad, T.; Kashmiri, F.A.; Naeem, H.; Qi, X.; Chia-Chun, H.; Lu, H. Simulation study of autonomous vehicles’ effect on traffic flow characteristics including autonomous buses. J. Adv. Transp. 2020, 2020, 4318652. [Google Scholar] [CrossRef]
  2. Pawar, S.; Gupte, S.; Bhatt, K. Traffic congestion—Cause and solutions: A case study of Hadapsar Road, Magarpatta, Pune. Int. J. Sci. Res. Sci. Eng. Technol. 2018, 4, 953–955. [Google Scholar]
  3. INRIX. Global Traffic Scorecard. Available online: https://inrix.com/scorecard-2022/ (accessed on 31 October 2025).
  4. Ghanim, M.S.; Abu-Lebdeh, G. Characterization of heavy vehicle headways in oversaturated interrupted conditions: Towards development of passenger car equivalency factors. Int. J. Transp. Sci. Technol. 2022, 11, 589–602. [Google Scholar] [CrossRef]
  5. Moridpour, S.; Rose, G.; Sarvi, M. Effect of surrounding traffic characteristics on lane changing behavior. J. Transp. Eng. 2010, 136, 973–985. [Google Scholar] [CrossRef]
  6. Aghabayk, K.; Moridpour, S.; Young, W.; Sarvi, M.; Wang, Y.B. Comparing heavy vehicle and passenger car lane-changing maneuvers on arterial roads and freeways. Transp. Res. Rec. 2011, 2260, 94–101. [Google Scholar] [CrossRef]
  7. Huddart, K.W.; Lafont, R. Close driving—Hazard or necessity? In Proceedings of the PTRC Summer Annual Meeting, Brighton, UK, 10–14 September 1990. [Google Scholar]
  8. Sayer, J.R.; Bogard, S.E.; Funkhouser, D.S.; LeBlanc, D.J.; Bao, S.; Blankespoor, A.D.; Buonarosa, M.L.; Winkler, C.B. Integrated Vehicle-Based Safety Systems Heavy-Truck Field Operational Test Key Findings Report; University of Michigan, Transportation Research Institute: Ann Arbor, MI, USA, 2010. [Google Scholar]
  9. Brackstone, M.; Waterson, B.; McDonald, M. Determinants of following headway in congested traffic. Transp. Res. Part F Traffic Psychol. Behav. 2009, 12, 131–142. [Google Scholar] [CrossRef]
  10. Rakha, H.; Lucic, I.; Demarchi, S.H.; Setti, J.R.; van Aerde, M. Vehicle dynamics model for predicting maximum truck acceleration levels. J. Transp. Eng. 2001, 127, 418–425. [Google Scholar] [CrossRef]
  11. Transportation Research Board. Highway Capacity Manual; Transportation Research Board: Washington, DC, USA, 2000. [Google Scholar]
  12. Transportation Research Board. Highway Capacity Manual: A Guide for Multimodal Mobility Analysis, 6th ed.; Transportation Research Board; National Academies Press: Washington, DC, USA, 2016. [Google Scholar]
  13. Cuddon, A.P.; Ogden, K.W. The effect of heavy vehicles on saturation flows at signalised intersections. In Proceedings of the 16th Arab Conference, Perth, Australia, 9–13 November 1992. [Google Scholar]
  14. Kockelman, K.M.; Shabih, R.A. Effect of light-duty trucks on the capacity of signalized intersections. J. Transp. Eng. 2000, 126, 506–512. [Google Scholar] [CrossRef]
  15. Rahman, M.M.; Okura, I.; Nakamura, F. Measuring passenger car equivalents (PCE) for large vehicles at signalized intersections. J. East Asia Soc. Transp. Stud. 2003, 5, 1223–1233. [Google Scholar]
  16. Partha, S.; Mahmud, H.I.; Hossain, Q.S.; Islam, M.Z. Passenger car equivalent (PCE) of through vehicles at signalized intersections in Dhaka Metropolitan City, Bangladesh. IATSS Res. 2009, 33, 99–104. [Google Scholar] [CrossRef]
  17. Tianzi, C.; Shaochen, J.; Hongxu, Y. Comparative study of VISSIM and SIDRA on signalized intersection. Procedia Soc. Behav. Sci. 2013, 96, 2004–2010. [Google Scholar] [CrossRef]
  18. Ghasemlou, K.; Topal, A.; Tanyel, S.; Aydin, M.; Afshar, A.K. Investigation the effect of heavy vehicles on capacity of signalized intersections based on Bayes’ theorem. In Proceedings of the T&DI Congress 2014: Planes, Trains, and Automobiles, Chicago, IL, USA, 8–11 June 2014. [Google Scholar] [CrossRef]
  19. Akcelik, R.; Chung, E.C.S.; Besley, M. Performance of roundabouts under heavy demand conditions. Road Transp. Res. 1996, 5, 36–49. [Google Scholar]
  20. Akçelik, R. Evaluating roundabout capacity, level of service and performance. In Proceedings of the ITE 2009 Annual Meeting, San Antonio, TX, USA, 2009. [Google Scholar]
  21. Akçelik, R. An assessment of the Highway Capacity Manual 2010 roundabout capacity model. In Proceedings of the TRB International Roundabout Conference, Carmel, IN, USA, 18–20 May 2011. [Google Scholar]
  22. Liu, Y.; Guo, X.; Kong, D.; Liang, H. Analysis of traffic operation performances at roundabouts. Procedia Soc. Behav. Sci. 2013, 96, 741–750. [Google Scholar] [CrossRef]
  23. Lee, C. Developing passenger-car equivalents for heavy vehicles in entry flow at roundabouts. J. Transp. Eng. 2015, 141, 04015013. [Google Scholar] [CrossRef]
  24. Kang, N.; Nakamura, H. An analysis of heavy vehicle impact on roundabout entry capacity in Japan. Transp. Res. Procedia 2016, 15, 308–318. [Google Scholar] [CrossRef]
  25. Mathew, S.; Dhamaniya, A.; Arkatkar, S.; Joshi, G. Roundabout capacity in heterogeneous traffic condition: Modification of HCM equation and calibration. Transp. Res. Procedia 2017, 27, 985–992. [Google Scholar] [CrossRef]
  26. Krammes, R.A.; Crowley, K.W. Passenger car equivalents for trucks on level freeway segments. Transp. Res. Rec. 1986, 1091, 10–17. [Google Scholar]
  27. Al-Kaisy, A.F.; Hall, F.L.; Reisman, E.S. Developing passenger car equivalents for heavy vehicles on freeways during queue discharge flow. Transp. Res. Part A Policy Pract. 2002, 36, 725–742. [Google Scholar] [CrossRef]
  28. Al-Kaisy, A.; Jung, Y. Examining the effect of heavy vehicles on traffic flow during congestion. Road Transp. Res. J. 2004, 13, 3–14. [Google Scholar]
  29. Al-Kaisy, A.; Jung, Y.; Rakha, H. Developing passenger car equivalency factors for heavy vehicles during congestion. J. Transp. Eng. 2005, 131, 514–523. [Google Scholar] [CrossRef]
  30. Okura, I.S.N. Passenger car equivalents of heavy vehicles for uncongested motorway traffic from macroscopic approach. Doboku Gakkai Ronbunshu. 1995, 1995, 73–82. [Google Scholar] [CrossRef][Green Version]
  31. Gautam, A.; Das, A.; Rao, K.R.; Tiwari, G. Estimation of PCE values for hill roads in heterogeneous traffic conditions. Transp. Lett. 2018, 10, 83–91. [Google Scholar] [CrossRef]
  32. Roess, R.P.; Messer, C.J. Passenger car equivalents for uninterrupted flow. In Proceedings of the TRB Annual Meeting, Washington, DC, USA, 16–19 January 1984. [Google Scholar]
  33. Webster, N.; Elefteriadou, L. A simulation study of truck passenger car equivalents (PCE) on basic freeway sections. Transp. Res. Part B Methodol. 1999, 33, 323–336. [Google Scholar] [CrossRef]
  34. Al-Obaedi, J.T.S. Estimation of passenger car equivalents for basic freeway sections at different traffic conditions. World J. Eng. Technol. 2016, 4, 153–159. [Google Scholar] [CrossRef]
  35. Sumner, R.; Hill, D.; Shapiro, S. Segment passenger car equivalent values for cost allocation on urban arterial roads. Transp. Res. Part A Gen. 1984, 18, 399–406. [Google Scholar] [CrossRef]
  36. Huber, M.J. Estimation of passenger-car equivalents of trucks in traffic stream. Transp. Res. Rec. 1982, 869, 60–70. [Google Scholar]
  37. Elefteriadou, L.; Torbic, D.; Webster, N. Development of passenger car equivalents for freeways, two-lane highways, and arterials. Transp. Res. Rec. 1997, 1572, 51–58. [Google Scholar] [CrossRef]
  38. Tanyel, S.; Çalışkanelli, S.P.; Aydın, M.M.; Utku, S.B. An investigation of heavy vehicle effect on traffic circles. Tek. Dergi 2013, 24, 6479–6504. [Google Scholar]
  39. Stamos, I.; Maria, J.; Grau, S.; Mitsakis, E.; Mamarikas, S. Macroscopic fundamental diagrams: Simulation findings for Thessaloniki’s road network. Int. J. Traffic Transp. Eng. 2015, 5, 225–237. [Google Scholar] [CrossRef][Green Version]
  40. Giuffrè, O.; Grana, A.; Marino, S.; Galatioto, F. Passenger car equivalent for heavy vehicles crossing turbo-roundabouts. Transp. Res. Procedia 2016, 14, 4190–4199. [Google Scholar] [CrossRef][Green Version]
  41. Giuffrè, O.; Granà, A.; Giuffrè, T.; Tumminello, M.L.; Acuto, F. Passenger car equivalents for heavy vehicles at roundabouts. A synthesis review. Front. Built Environ. 2019, 5, 80. [Google Scholar] [CrossRef]
  42. Kessels, F. Introduction to traffic flow modelling. In Traffic Flow Modelling: Introduction to Traffic Flow Theory Through a Genealogy of Models; Springer: Cham, Switzerland, 2019; pp. 1–19. [Google Scholar] [CrossRef]
  43. Luk, J.; Stewart, D.; Walsh, D. Microsimulation traffic models—Usage, limitations and applications. In Proceedings of the 22nd ARRB Conference, Research into Practice, Canberra, Australia, 29 October–2 November 2006. [Google Scholar]
  44. Koushki, P.A. The effect of socio-economic development on household travel behavior in Saudi Arabia. Socio-Econ. Plan. Sci. 1988, 22, 131–136. [Google Scholar] [CrossRef]
  45. Daamen, W.; Hoogendoorn, S.P. Free speed distributions—Based on empirical data in different traffic conditions. In Pedestrian and Evacuation Dynamics 2005; Springer: Berlin/Heidelberg, Germany, 2007; pp. 23–34. [Google Scholar] [CrossRef]
  46. Al-Ahmadi, H.M.; Jamal, A.; Reza, I.; Assi, K.J.; Ahmed, S.A. Using microscopic simulation-based analysis to model driving behavior: A case study of Khobar-Dammam in Saudi Arabia. Sustainability 2019, 11, 3018. [Google Scholar] [CrossRef]
  47. Al-Rashid, M.A.; Nahiduzzaman, K.M.; Ahmed, S.; Campisi, T.; Akgün, N. Gender-responsive public transportation in the Dammam metropolitan region, Saudi Arabia. Sustainability 2020, 12, 9068. [Google Scholar] [CrossRef]
  48. Saudi Port Authority. King Abdulaziz Port Statistics and Operational Improvements; Saudi Port Authority: Riyadh, Saudi Arabia, 2020. [Google Scholar]
  49. Lu, X.L. The potential for using transit infrastructure for air freight cargo movement: Feasibility analysis of freight train operation logistics, Phase II. PATH Res. Rep. 2015. Available online: https://api.semanticscholar.org/CorpusID:54519925 (accessed on 7 April 2026).
  50. Keller, E.L.; Saklas, J.G. Passenger car equivalents from network simulation. J. Transp. Eng. 1984, 110, 397–411. [Google Scholar] [CrossRef]
  51. Cunha, A.L.; Setti, J.R. Truck equivalence factors for divided, multilane highways in Brazil. Procedia Soc. Behav. Sci. 2011, 16, 248–258. [Google Scholar] [CrossRef]
  52. Bains, M.S.; Ponnu, B.; Arkatkar, S.S. Modeling of traffic flow on Indian expressways using simulation technique. Procedia Soc. Behav. Sci. 2012, 43, 475–493. [Google Scholar] [CrossRef]
  53. Shalini, K.; Kumar, B. Estimation of the passenger car equivalent: A review. Int. J. Emerg. Technol. Adv. Eng. 2014, 4, 97–102. [Google Scholar]
  54. Ahn, S.; Coifman, B.; Gayah, V.; Hadi, M.; Hamdar, S.; Leclercq, L.; Mahmassani, H.; Menendez, M.; Skabardonis, A.; van Lint, H. Traffic flow theory and characteristics. In Centennial Papers; Transportation Research Board: Washington, DC, USA, 2019; Available online: https://onlinepubs.trb.org/onlinepubs/centennial/papers/AHB45-Final.pdf (accessed on 20 May 2025).
  55. Budhkar, A.K.; Maurya, A.K. Review of Passenger Car Equivalence Studies in Indian Context. In Proceedings of the International Conference on Emerging Frontiers in Technology for Rural Area (EFITRA-2012); International Journal of Computer Applications: Wilmington, DE, USA, 2012; pp. 19–23. [Google Scholar]
  56. Derse, O.; Van Woensel, T. Integrated People and Freight Transportation: A Literature Review. Future Transp. 2024, 4, 1142–1160. [Google Scholar] [CrossRef]
  57. Johnson, H.; Styhre, L. Increased energy efficiency in short sea shipping through decreased time in port. Transp. Res. Part A Policy Pract. 2015, 71, 167–178. [Google Scholar] [CrossRef]
  58. Wang, T.; Tian, X.; Wang, Y. Container slot allocation and dynamic pricing of time-sensitive cargoes considering port congestion and uncertain demand. Transp. Res. Part E Logist. Transp. Rev. 2020, 144, 102149. [Google Scholar] [CrossRef]
  59. Gonah, N.; Salama, H.; Ali, M.; Elsopky, M. An evaluation of the impact of truck-lane restriction strategies on traffic operation characteristics. Innov. Infrastruct. Solut. 2025, 10, 4. [Google Scholar] [CrossRef]
  60. Chandra, S.; Mehar, A.; Velmurugan, S. Effect of traffic composition on capacity of multilane highways. KSCE J. Civ. Eng. 2016, 20, 2033–2040. [Google Scholar] [CrossRef]
  61. He, S.; Ding, F.; Lu, C.; Qi, Y. Impact of connected and autonomous vehicle dedicated lane on the freeway traffic efficiency. Eur. Transp. Res. Rev. 2022, 14, 1. [Google Scholar] [CrossRef]
  62. Chowdhury, T.U.; Park, P.Y.; Gingerich, K. Estimation of appropriate acceleration lane length for safe and efficient truck platooning operation on freeway merge areas. Sustainability 2022, 14, 12946. [Google Scholar] [CrossRef]
  63. Chen, K.C.; Larry, S.T. Determination of Level of Service (LOS) on different roads in Kuching area (a case study). J. Civ. Eng. Sci. Technol. 2009, 1, 1–6. [Google Scholar] [CrossRef]
Figure 1. Location of King Abdulaziz highway to and from the seaport.
Futuretransp 06 00085 g001
Figure 2. Configuration of the multilane King Abdulaziz Freeway.
Futuretransp 06 00085 g002
Table 1. PCE values in [12].
% GradeLength (mi)Percentage of Trucks (Including Buses & RVs)
2%4%5%6%8%10%15%≥20%
≤0ALL2.392.182.122.072.011.961.891.85
Table 2. Field measurements of saturation headway.
DirectionPassenger Car LaneMixed Traffic LaneTotal Observations
To-port11,065841819,483
From-port11,323776219,085
Total22,38816,18038,568
Table 3. Reduced-field measurements of saturation headway.
DirectionPassenger Car Lane (veh/h)Mixed Traffic Lane (veh/h)Total
To-port10,610506115,671
From-port10,589551316,102
Total21,19910,57431,773
Table 4. Comparison of saturation headways between passenger-car and mixed heavy-vehicle lanes.
Directionn (PV)n (HV)Mean ± SD (PV) [s]Mean ± SD (HV) [s]Mean Difference [s]
(PV–HV)
Welch t (df)p (Two-Tailed)95% CI [s]Cohen’s d
To-port10,61050612.69 ± 1.184.78 ± 1.84−2.09−73.88 (≈7110)<10−16[−2.15, −2.03]1.46
From-port10,58955132.84 ± 1.165.14 ± 1.92−2.30−81.53 (≈7662)<10−16[−2.36, −2.24]1.57
Note: Welch’s two-sample t-test assuming unequal variances; significance level = 0.05.
Table 5. Estimated lane capacities and Passenger Car Equivalency (PCE).
DirectionMean Headway (PV) [s]Mean Headway (HV) [s]Capacity (PV) [veh h−1 ln−1]Capacity (HV) [veh h−1 ln−1]PCE = Hmix/H_baseCapacity
Reduction [%]
To-port2.694.7813387531.7844
From-port2.845.1412687001.8145
Disclaimer/Publisher’s Note: The statements, opinions and data contained in all publications are solely those of the individual author(s) and contributor(s) and not of MDPI and/or the editor(s). MDPI and/or the editor(s) disclaim responsibility for any injury to people or property resulting from any ideas, methods, instructions or products referred to in the content.