Abstract
Distracted driving is a major cause of road traffic crashes in Yaoundé. This is partly due to the scarcity of enforcement and a lack of evidence and investigation using the distraction safety performance indicator (SPI), hindering evidence-based interventions. This study aimed to address this evidence gap by evaluating the distraction SPI using a proven methodology. Data on distracted driving (handheld mobile device; interaction; eating/smoking/drinking) were collected from roadside observations on 36 randomly selected road sections carefully spread to cover the city. SPIs were computed and weighted with traffic volume to ensure the representativeness of the values. A total of 41,004 drivers were observed (38,248 in cars; 1116 in vans; 977 in trucks; 663 in buses). The prevalence of distracted driving in Yaoundé is 13.69% for the three distractions type combined. The prevalence is 7.84% for interaction, 4.89% for handled mobile device usage and 0.96% for eating/smoking/drinking. Leveraging these insights, a seven year (2024–2030) fighting strategy aimed at halving the prevalence was developed. The strategy contains interventions including legislation/enforcement, which have been proven to be effective. This study, pioneered in Yaoundé, provides stakeholders with evidence of the issue and measures to implement and can also be used when developing a road safety strategy. Future research should consider investigation at national level.
1. Introduction
Road traffic crashes have escalated into a global challenge over the years, and despite ongoing road safety initiatives, the situation remains alarming. Each year, over 1.19 million people die and 50 million sustain injuries in road traffic crashes worldwide, inflicting both human suffering and significant economic losses, typically amounting to 3% of a country’s Gross Domestic Product (GDP) [1]. Despite having only 60% of the world’s vehicles, low- and middle-income countries (LMICs) bear the brunt of road traffic deaths, accounting for a staggering 92% of fatalities [1], representing up to 6% of their GDP [2]. Distracted driving has long been recognized as a major causes of road traffic crashes across the world [3,4,5].
1.1. Generality
According to the National Highway Traffic Safety Administration (NHTSA), driver distraction is a “specific type of inattention that occurs when drivers divert their attention away from the driving task to focus on another activity instead” [6]. In 2019, in the United Sates, the NHTSA reported that 14% of all motor vehicle crashes were caused by distracted driving, 8% of which resulted in fatalities and 15% in serious injuries, amounting to 3142 deaths [7]. Similarly, the Canadian Automobile Association (CAA) revealed that 16% of all reported motor vehicle collisions (MVCs), as well as 10% of the deaths and 18% of the injuries, were due to distracted driving in 2019 in Canada [8]. In Europe, it is generally estimated that distracted driving accounts for 5 to 25% of all road traffic crashes [9].
Using a mobile phone device, eating or drinking, using a navigation system or interacting with passenger, if performed while operating a vehicle, are all examples of distracted driving [10,11,12,13,14]. Fundamentally, distracted driving can be classified as visual, manual and/or cognitive [15,16,17,18], and their compounding effects on driving performance and crash risk have been well established [19].
Distracted driving degrades driving performance [20,21,22,23,24,25,26,27,28,29,30] and increase the likelihood of crashes [31,32,33].
A meta-analysis of 33 studies showed that distracted driving increases mean reaction time by 0.25 s [22]. Distracted driving is also associated with fluctuations in vehicle speed [24], slower brake response [25] and increased aggression [34] due to the increased attention demand [33]. Mobile phone use increases the crash risk for car drivers by a factor of 3.6, especially dialing (×12) and texting (×6) [9]. However, there are many other distracted driving behaviors that are problematic for road safety [18,35]. Dingus reported, for instance, that the odds of having a crash increased when the distraction involved reaching for an object (Odds Ratio [OR] 9.1), reading or writing (OR 9.9) and eating or drinking (OR 1.8) [36].
Although it is an independent driver’s decision most of time, distracted driving can be influenced by several factors. According to [37], road width, road gradient and environmental conditions can affect distracted driving. Ref. [38] suggests that traffic density, traffic composition and traffic flow can also affect distracted driving. In addition, individual factors such as age, gender, attitudes towards driving and vehicle type and condition also play a role in driver distraction [39].
Despite the consequences of distracted driving, the phenomenon keeps on rising, due to the overconfidence of drivers in their capabilities of performing secondary task while driving [25], the increased availability and use of technology gadgets and devices inside vehicles [40,41] and the disregard of a driver towards the danger of distracted driving [42].
In Cameroon, as in numerous other African nations, road traffic fatalities are frequent, with distracted driving being a notable issue. Current data reveal that Cameroon’s traffic death rate is 11 per 100,000 people, despite the country having only 31,590 vehicles for every 100,000 inhabitants [1]. A 2010 study by the United Nations Economic Commission for Africa (ECA) had long presented distracted driving as one of the top three causes of road crashes in Cameroon [43]. A similar study by the ECA in 2018 reveled that distracted driving account for 30,67% of road traffic crashes in Cameroon [44].
Cameroon has a national law against distracted driving, although it only considers mobile phone use to be distracted driving. The penalty for using a mobile phone while driving is a fine of XAF 25,000 with the driving license being withdrawn and the vehicle impounded, even if there has been no crash, yet distracted driving still poses a major concern. In fact, an analysis of 2021 law enforcement agency statistics shows that distracted driving, especially mobile phone use while driving, is the second leading human related cause of crashes in Cameroon and the leading one in the Center Region, of which Yaoundé is the main city, accounting for a quarter of crashes in the region. These figures are potentially underestimated because law enforcement officers do not always report a particular distracting activity in crash reports, and also due to the complexities involved in determining if a distraction contributed to a crash [15,45,46].
Various interventions to address distracted driving have proven to be effective when correctly implemented. These include legislation and intensive enforcement [47], smart cameras for enforcement [48], public campaigns to raise awareness [49,50], a training program to combat distracted driving [51], infrastructure changes [52] and Advanced Driver Assistance Systems (ADAS) [53]. The implementation of effective targeted strategies towards distracted driving as well as the monitoring of their effectiveness requires in depth knowledge of the prevalence of distracted driving [40].
Surveys, naturalistic in-vehicle observation and field observation are the three main types of data collection that can be used to assess the prevalence of distracted driving [36,54,55,56]. Surveys consist of a driver self-reporting their distracted driving attitude, they can be advantageous for gathering data for a specific type of secondary task [57], or from drivers of a specified age range [58,59], but there are generally no means of verifying the information reported by drivers, making the prevalence of self-report distracted driving difficult to rely on for policy design.
Naturalistic observational studies employ a rigorous design involving volunteers driving vehicles equipped with sensors and cameras to record detailed driving behavior over extended periods. Stutts installed video cameras in 70 cars in America and found that drivers spent approximately 30% of their driving time engaged in distracting activities, such as conversing with passengers, eating/drinking, smoking and manipulating controls [60]. However, these studies are expensive and rely on a limited pool of volunteers, limiting their generalizability [14]. Criticism of this technique includes the potential bias of drivers altering their behavior due to the cameras’ presence [61].
Conducting field observations from outside the driver’s vehicle in an unobtrusive manner is one method that can be used to reduce the effects of the experimenter. This approach allows researchers to directly witness the events being investigated [36]. Stationary observation involves discreetly observing and recording drivers’ activities and demographic characteristics as they pass a selected location [15]. Vollrath observed 11,837 drivers at fixed location in three cities in Germany and found that 4.5% texted while driving [62]. Sullman conducted a similar study in England and identified talking to passengers, smoking and cell phone use as common distractions [14]. Another variation involves using cameras to capture images of drivers passing by, which are subsequently analyzed to detect the distracting behavior. Johnson observed drivers by revieing 40,000 high-quality digital photographs of drivers passing through a section of the New Jersey Turnpike, revealing that approximately 5% exhibited signs of distraction [63].
Stationary observation provides the patterns of driver behavior for a specific location, but the variation in driver behavior throughout a route, which could be affected by many roadside geometric factors (e.g., speed limit and median width), cannot be observed. This can be addressed by observing the driver’s behavior from a moving vehicle, which allows the observers to record each of the drivers on a given road section, even those traveling at high speed. Ref. [64] observed 1337 drivers passing a moving observation vehicle and found that handheld cell phone use was the most prominent distraction.
In general, field observations are the most effective method for obtaining the prevalence of distracted driving at a national level. One of the most recent and prominent projects in that regard was Baseline, a European project funded by the European Union whose objective was to produce national-level values for Road Safety KPIs (Key Performance Indicators), including distraction, for 18 European Union Member States. The distraction KPI is defined as the percentage of drivers not using a handheld mobile device and was collected by each country using field observations. The baseline results indicated that, overall, more than 90% of the drivers in the participating countries do not use a handheld mobile device while driving. The distracted driving national prevalence obtained by the European countries in the framework of the Baseline project allowed them to have a clear view of the situation, to design a targeted intervention and to set a national target that aligns with their road safety strategy [65,66].
In Cameroon, few studies have tried to investigate distracted driving, and more have focused on its effects on crash occurrence rather than its prevalence [67,68,69]. Estimates of the prevalence of distracted driving is unknown and evidence-based observation studies of distracted driving in Cameroon, including Yaoundé, are lacking, hindering the possibility of grasping the extent of the issues or planning and implementing an effective road safety strategy [40]. As a matter of fact, Cameroon’s ongoing strategic road safety plan (2021–2025), with the goal of reducing road deaths and serious injuries by 50% by 2025, does not include any targets, actions or activities related to distracted driving. The General Delegation for National Security (DGSN) revealed that distracted driving continues to be a major safety concern and the leading human-related cause of road traffic crashes in Yaoundé [70]. Thus, it is important to address the gaps in the data on the prevalence of distracted driving in Yaoundé so that an evidence-based strategy can be implemented, which is the intent of this work.
1.2. Aim
The aim of this work is to evaluate the distraction safety performance indicators in Yaoundé using a proven and well-defined methodology that is easily applicable, and to propose recommendations to reduce the amount of distracted driving and increase the overall safety and attractiveness of the city.
This paper is structured as follows: Introduction, Methods, Results, Discussion, and finally, Conclusions and Future Work.
To the best of the authors’ knowledge, this study constitutes the first ever field observation study at the scale of a city in Cameroon to investigate the prevalence of distracted driving. Therefore, this study is expected to be a valuable baseline contribution, providing the first empirical insights on the topic, which are crucial for proposing evidence-based strategies aimed at mitigating and monitoring distracted driving.
2. Methods
2.1. Study Context
The data for this study were obtained from one wave of field observation surveys conducted in November 2023 in Yaoundé. Yaoundé is the political capital of Cameroon; it has an urbanized area of 183 km2, an administrative limit of 304 km2 and is divided into seven councils (Yaoundé 1 to Yaoundé 7). It has a total of 4,100,000 inhabitants and a motorization rate (car per 1000 people) of 58, according to the Sustainable Urban Mobility Plan of the city [71]. Yaoundé covers a road network estimated at 4762 km with only 300 km asphalted, composed of 64 km of primary roads and 236 km of secondary and tertiary roads. Safety is a major issue affecting mobility in Yaoundé, where road traffic crashes cause around 1000 deaths and 5000 serious injuries per year with distracted driving being the most important cause of road crashes according to the General Delegation for National Security [70]. The field observation survey was a direct, live, roadside observation of distracted drivers at specific locations carried out by trained observers, an approved, validated and experimented method to collect distracted driving data and compute safety performance indicators at national, regional and city levels. In fact, this method, which was recommended by the European Commission (EC) Staff within the framework of the “EU Road Safety Policy Framework 2021–2030-Next steps towards “Vision Zero””, was equally recommended by the European Union project Baseline [72] and used by all 18 of the European countries with satisfactory results. In the Baseline project, when collecting data on motorways (high speed, multiples lanes), some countries used roadside observations at a fixed location (rest area, parling, behind safety barriers) for the closest lane (slow-speed lanes) as the visibility is higher and complemented this with observations from a moving vehicle in real traffic (for fastest lanes), with a driver and an observer on the backseat, which allowed them to observe overtaking and overtaken vehicles in different lanes.
This approach was not considered in addition to roadside observation as the study area is limited to urban roads, where the speed limit is limited to 60 km and where the number of lanes varies between 1 and 2 only.
The direct field observation survey was designed in strict accordance with the methodological requirements of the Baseline project [72].
2.2. Site Selection and Timing
The selection of the observation points was carried out by first randomly identifying the possible sections on the road network in which to conduct the survey, giving a higher probability to the more populous areas, but also considering the geographical distribution, and subsequently by identifying the observation points along these sections.
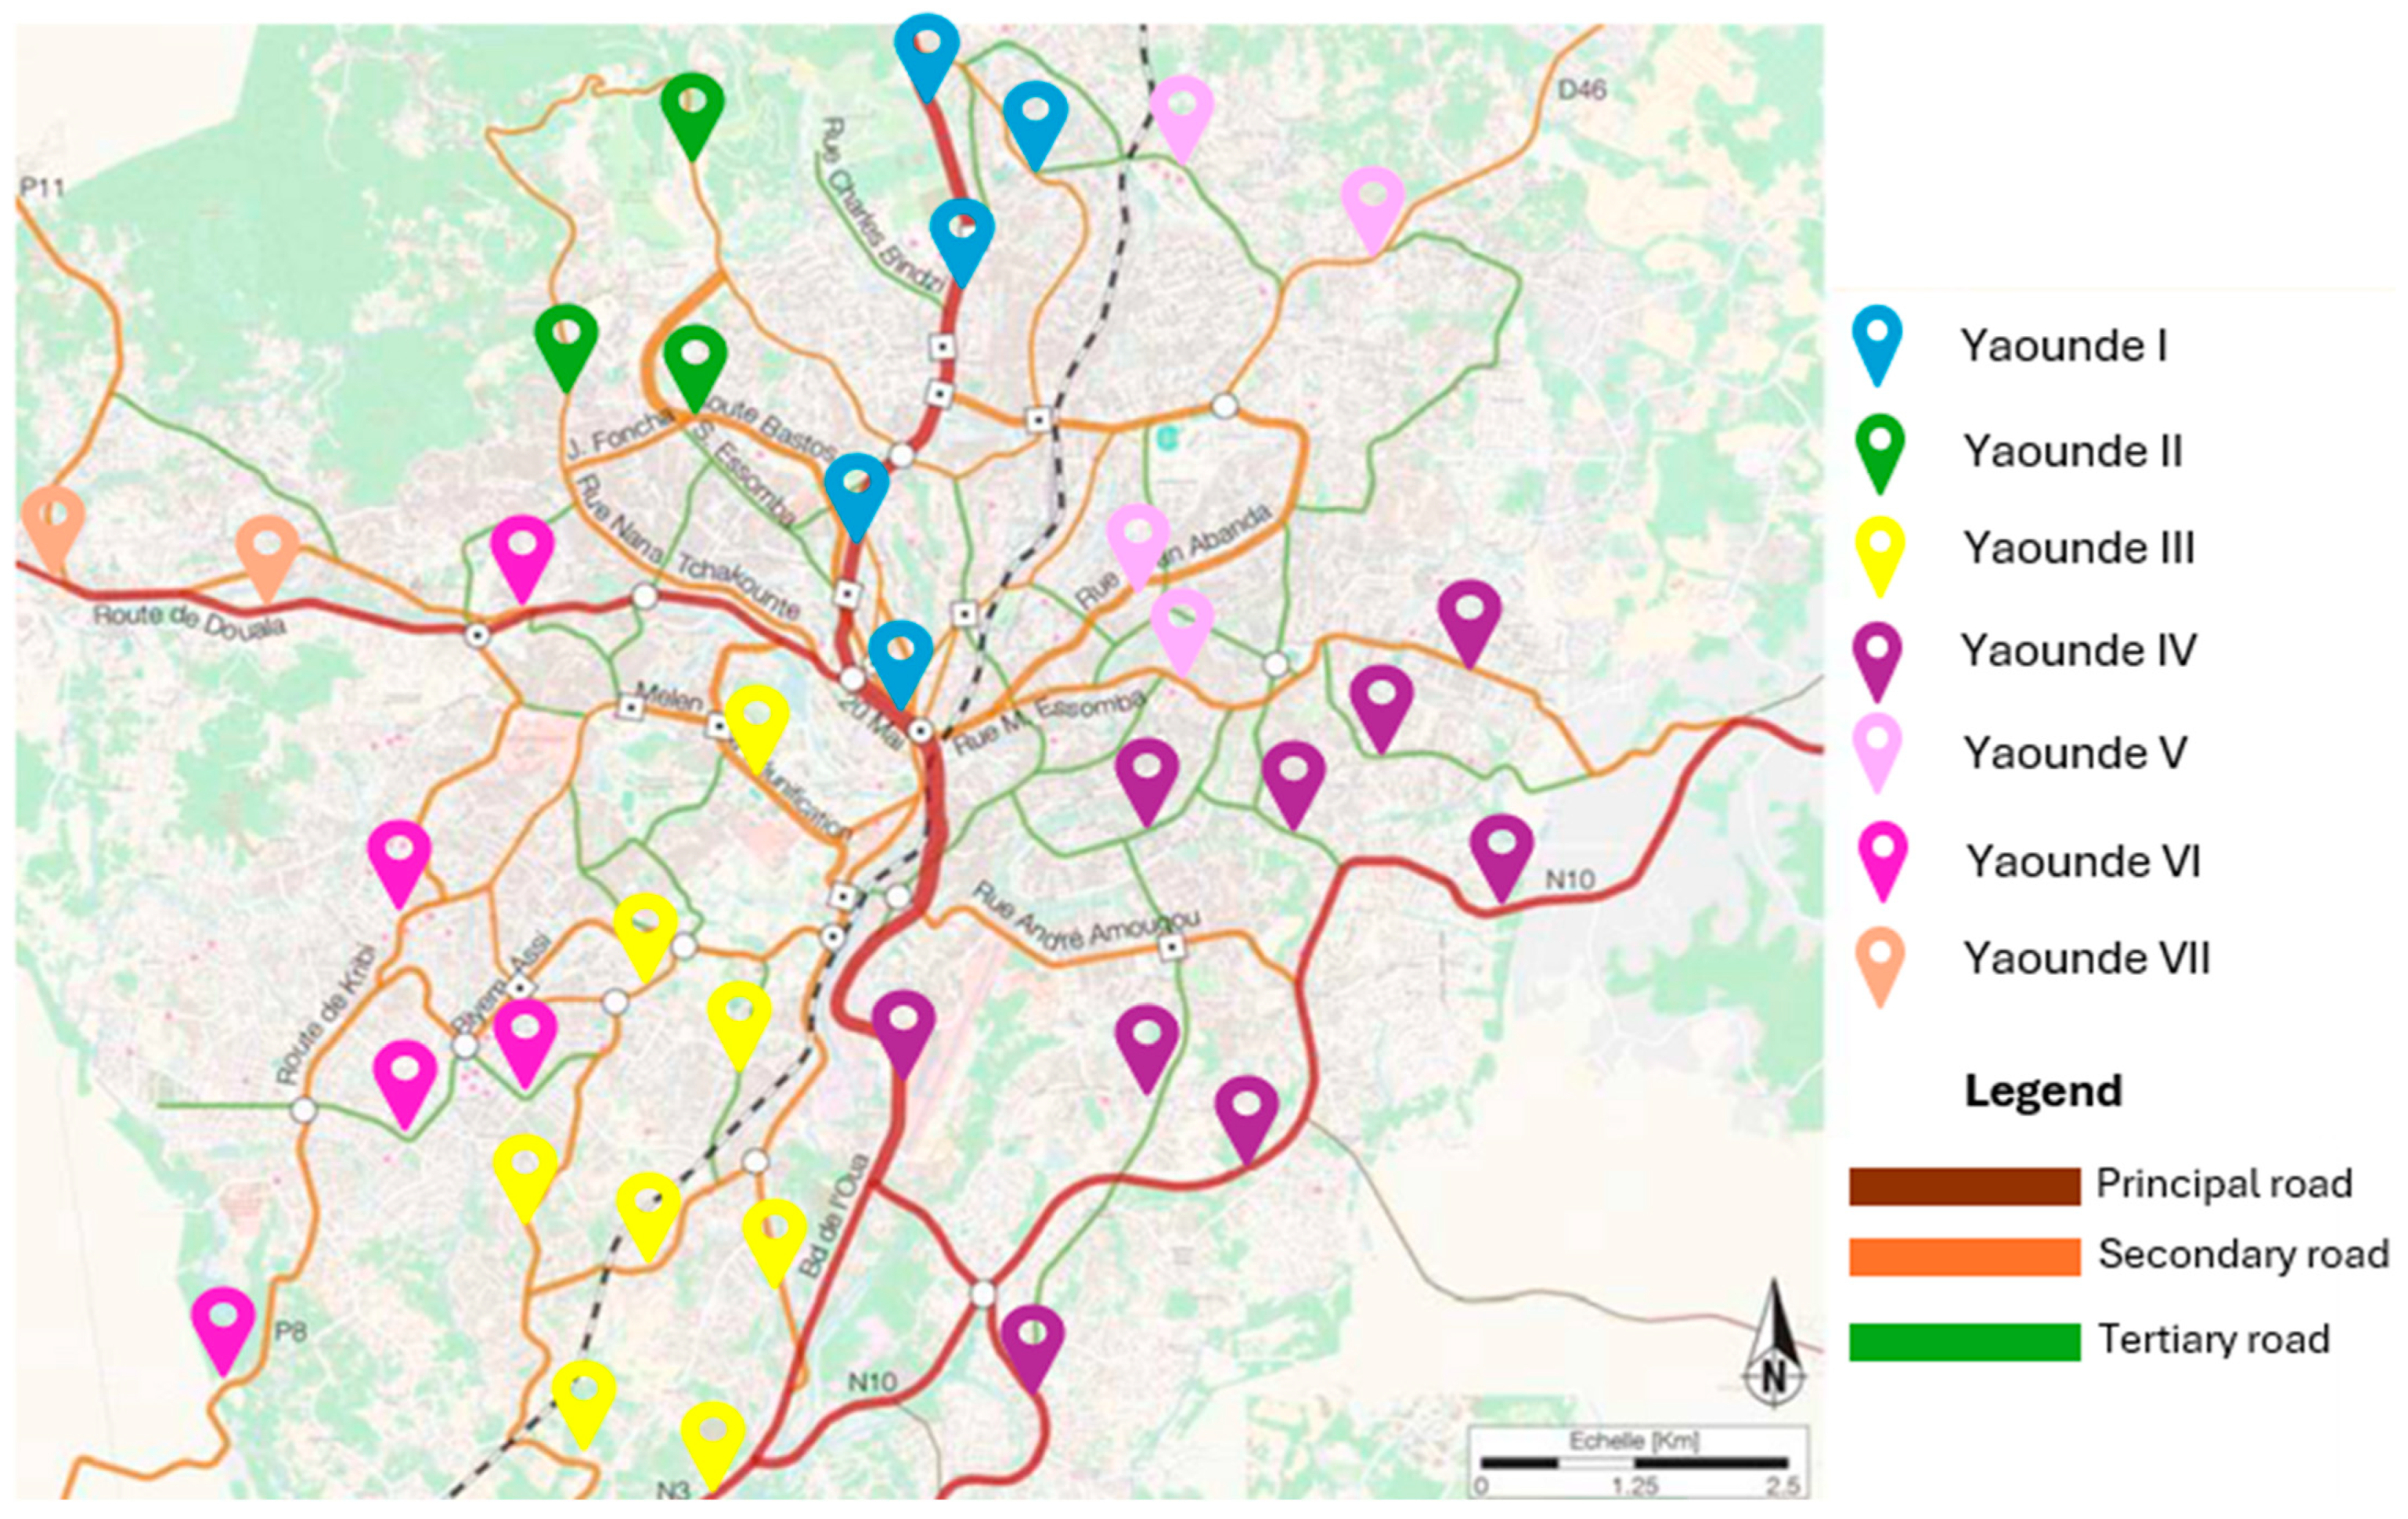
According to the baseline methodological guidelines [72], the minimum number of observations points at the national level should be 10 per road type (rural roads, urban roads, motorways). Considering that Yaoundé is an urban area with urban roads, one could assume the minimum number of observations points to be 10. However, to increase representativeness of the study at the city level, the minimum number of observation points was applied to the three main types of roads in Yaoundé (primary, secondary and tertiary) taking the minimum number of observation points from 10 to 30 (10 per road type). Ultimately, 36 observation points were considered and strategically spread over the seven councils and the three types of roads to ensure a comprehensive coverage of the city. Figure 1 shows a geographical visualization of the observation points spread across the city per road type and council.
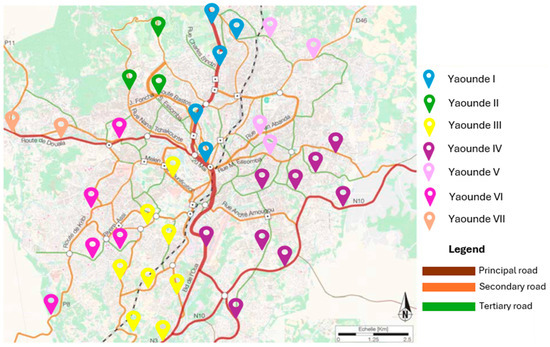
Figure 1.
Geographical distribution of the observation points.
Once the observations points were selected, site investigations were carried out at each location to ensure the safety and suitability of the observation point, defined by the following criteria:
- Safe and inconspicuous place along the roadside for the observer to watch all the drivers safely and clearly inside their car without being noticed by them.
- Location away from complex situations requiring drivers’ full attention (road works, traffic calming measures, pedestrian crossing, enforcement).
- Location preferably away from intersection but if nearby, only drivers who are driving would be observed, not drivers who are stationary.
- Location with undisturbed traffic and a traffic flow greater than 10 vehicles per hour.
Once the safety and suitability of each location were confirmed, a data collection plan was then developed such that time of the day (daytime peak and off-peak hour) and days of the week (weekdays only) were randomly selected. This distribution of location over time periods and weekdays was chosen to avoid systematic sampling bias (e.g., same time period and day for same type of road). Following the planning, the observation took place on November 2023, on nine (09) weekdays spread across two weeks (first week: 13 November–17 November; second week: 20 November–23 November) during two (02) daytime periods (peak hours: 07:00–09:00 and 16:00–18:00; off-peak hours: 10:00–15:00) at a rate of four (04) locations per day.
At each observation point, two trained individuals performed the observation. The observer team was the same at each location and included one of the authors. The two observers had been extensively introduced to the background of the study and to the methodological requirements. They had developed and tested the different data collection sheets and had extensively practiced the observation before the real study. We decided to use two observers at each location to ensure all relevant vehicles would be observed during the observation period. The observers were wearing regular clothes and were standing at a separate spot; otherwise, they would have been less unobtrusive and easier to be noticed by the drivers who might have altered their behavior [73].
2.3. Definition of Data of Interest
The method used to record distracted driving was a live roadside observation of drivers inside their car. Four clearly visible, mutually exclusive categories of distraction were recorded including using a handheld mobile device, interaction with passengers, eating, drinking or smocking and the remaining situation (no mobile device in the hand, no interaction, no eating, no drinking, no smoking). So, in addition to handheld mobile device (mainly smartphone) distraction, which was the only distraction considered in Baseline [72], the study also include two other types of distraction (interaction, eating/smoking/drinking) following the recommendation of the Forum of European Road Safety Research Institutes (FERSI) [73]. The categorization was based on what is visibly detectable during an on-road observation study and allowed for a clear and uniform observation procedure. As shown in previous research several factors (age, gender, road features, vehicle, etc.) could contribute or explain distracted driving [37,38,39]. So, apart from driver distraction by type, the vehicle type was also recorded including passenger cars, light goods vehicles (LGV), heavy goods vehicles (HGV) and buses. Moreover, the driver characteristics were also recorded including driver gender, estimated driver age and passenger presence. Finally, some road and environmental features were also recorded. Details on the different variables of interest are presented in Table 1.

Table 1.
List of variables of interest.
2.4. Measurement Procedure
The observations were conducted discretely and unobtrusively so as not to influence the drivers and to ensure that the data reflected typical driver behavior [14]. At each location the observers were standing in different safe places with a clear view of the driver inside their car. The observers were equipped with clipboards, pen, stopwatch, data collection sheet and the necessary authorization. Before starting the observation session, the observer ensured the suitability of the point again (no road works, traffic flowing, etc.) and once this had been carried out, the attributes of the locations were recorded including the ID, the road name, the coordinates, road features, etc. Once ready, the observation session could start and for each relevant (vehicle of interest) passing vehicle, the distraction (driver distracted or not distracted), the gender, the age group and the vehicle type were collected by the observers using a prepared sheet where they only had to check the correct information with a pen. Each observer focused only on two types of vehicles to ensure all the relevant vehicles were covered during the observation session. The attributes of the session characteristics were also recorded including the ID of the session, the date, time period, the start and end of the session, etc. Each observation session lasted on average of one hour and thirty-five minutes (twenty minutes of preparation on arrival, one hour of actual observation, and fifteen min preparation on departure).
2.5. Minimun Sample Size
To obtain reliable results about the prevalence of distracted driving in Yaoundé, a minimum number of drivers should be observed. According to the baseline methodological guidelines [72], the minimum sample size (minimum number of drivers or vehicles to observe) can be computed using Equation (1)
where:
- Mssr is the minimum sample size required.
- is the prevalence, i.e., the percentage of distracted drivers, generally assumed or taken from similar previous studies on a similar population.
- depends on the confidence level. For a 95% confidence level, the is 1.96 [74].
- is the precision.
The prevalence P must be assumed based on previous similar studies on the same population or on similar context. In Belgium for instance, the second largest nation-wide observation of driver distraction conducted in 2020 showed a prevalence of 3.2% [66]. At a more regional level, Binda conducted an observation study of coach drives distraction in South Africa and obtained a prevalence of 9% [75]. To the best of the authors’ knowledge, no previous studies have been conducted in Yaoundé that would allow us to have a sense of what the prevalence could be. Prior to the real survey, during the practical exercise to master the methods, a pilot test was conducted at three observation points for 4 h. The number of vehicles observed was 741, 3820 and 1334 and the percentage of distracted drivers was 15%, 20% and 9%, respectively. Based on all these considerations, the prevalence we assumed was 25%, which is a fair assumption considering that the sample size increases with the prevalence until 50%. As recommended in Baseline [72], the confidence level and errors considered were 95% and 1%, respectively. Applying Equation (1), the minimum sample size required is:
The 7203 vehicles considered are consistent with Baseline guidelines that recommend an absolute minimum sample size of 2000 vehicles [72].
2.6. Data Analysis
After all the observation sessions, the physical sheets were reproduced on a Microsoft Office Excel spreadsheet for easier manipulation. During this process, quality control and data cleaning were conducted to ensure the data were ready, accurate, consistent and in proper format for analysis.
The main computation concerns the distraction safety performance indicators (SPIs) or the prevalence of distracted driving. The SPIs or the prevalence of distracted driving are defined as the percentage of drivers distracted while driving.
2.6.1. Computation of the Distraction SPI
The computation was carried out for all types of distraction combined and for each type individually.
- Prevalence of distracted driving (P1).
This prevalence was computed using Equation (2).
- Prevalence of handheld mobile device distracted driving (P2).
This prevalence was computed using Equation (3).
- Prevalence of interaction distracted driving (P3).
This prevalence was computed using Equation (4).
- Prevalence of eating/smoking/drinking distracted driving (P4).
This prevalence was computed using Equation (5).
2.6.2. Weighted Distraction SPIs
As recommended in the Baseline guidelines [76], the computed prevalence of distracted driving was weighted to ensure values of the safety performance indicators were representative of the whole city. The weighting considers the traffic volumes at each location spread over the different road types in the city.
The weighted distraction safety performance indicators were computed using Equation (6)
where:
- SPIweighted is the weighted SPI.
- Pi is the SPI at each observation point.
- Wi is the 60 min traffic volume at each observation point.
- n is the number of observation points.
As previously indicated, the use of two observers at each location, each focusing only on two vehicle types, was to cover all the relevant vehicle during the 60 min observation period. In addition, since Yaoundé is a busy city, the driving speed of the vehicles was relatively low, so the observers could clearly see the driver inside the car and code the necessary information without rushing and making errors. This configuration allowed the observers to observe all of the relevant vehicles. However, for each of the 36 locations, during the 60 min of observation, between 5 and 15 relevant vehicles were missed. Considering that thousands of vehicles were observed at each location, these missed vehicles are very negligible (<1% per location). So, the number of observed vehicles was confidently taken as the traffic volume during the 60 min period at each location. Only the weighted values will be presented in the results.
2.6.3. Analysis Conducted
Following the method adopted in [66], descriptive statistics analyses were used to present the SPIs based on various factors (prevalence for different types of vehicles together and by type of vehicle, as well as disaggregated by councils, road type, period of the day, passenger presence, gender and age category for vehicle types together and separately) and, when deemed relevant and applicable, Pearson chi-square tests were performed to compare the frequency and types of driver distraction according to various factors (vehicle type, road type, age group, gender, etc.). A significant alpha level of 0.05 was used. The computation was carried out for all types of distraction, but the results for handheld mobile device distraction (mostly mobile phone) will be emphasized as mobile phone use while driving is the only distraction penalized by the legislation.
3. Results
3.1. Description of the Study Sample
A total of 41,004 drivers of cars, buses, heavy good vehicles (HGVs) and light goods vehicles (LGVs) were observed. A number far superior to the minimum sample size required (7203 vehicles) and which can guarantee the representativeness of the results [66]. Table 2 gives an overview of the sample of drivers by vehicle type and according to the main factors considered (councils, road type, time period, gender, age group, presence of passengers). The most frequently observed drivers were car drivers (38,248), followed by LGV drivers (1116) and HGV drivers (977). Relatively fewer bus or coach drivers (663) were observed, partly because the fleet of public transport buses is not very high and because the locations were not always aligned with the inter-urban roads where buses from travel companies are sometimes observed.

Table 2.
Distribution of the sample of driver observed per vehicle type.
For all four types of vehicles combined, women and men account for 9.36% and 96.64% of the sample, respectively, and regardless of the vehicle types, women are less represented than men and their respective proportion varies depending on the type of vehicle. A total of 9.76% of the car drivers were women, compared with just 3.58% for HGVs and 2.33% for LGVs. For men, the proportion per vehicle type is more stable with 90.24% for cars, 93.67% for buses, 96.42% for HGVs and 97.67% for LGVs. These results are in line with the general tendency as car ownership is higher for men [71] and women are less represented in transportation professions (taxi drivers, bus drivers, drivers for companies, etc.) [77]. Young (18–24 years) and older (>65 years) drivers are less represented accounting for 2.74% and 0.5% of the total sample. A total of 96.76% of drivers are in the broad 25–65 age bracket and this does not change when considering each vehicle type, which is understandable as this age group is the predominant one in the overall population of the city. The gender and age distribution of the sample is representative of the general population as the observers did not purposely observe more people of a particular gender or age group. A total of 84.93% of drivers were alone in their vehicle at the time of observation. This proportion does not greatly vary according to vehicle type: 84.91% of car drivers, 84.95% of HGVs and 83.33% of LGVs.
The observations were uneven between the seven councils of the city with less observations in Yaoundé II (3.90%), Yaoundé VII (4%) and Yaoundé V (7.30%) as they contain fewer asphalted roads in good condition with adequate traffic. Yaoundé I (29.40%), Yaoundé IV (25.7%) and Yaoundé III (21.8%) account for 76.9% of the sample not only because more sessions were conducted there but also because they contain the majority of primary and secondary roads which are characterized by higher amounts of traffic. Fewer observations were made on tertiary roads because, although they are the most present in the city, they are mostly unpaved, in poor condition and with very low amounts of traffic. As a result, primary roads (54.90%) and secondary roads (40%) had the largest share of the observations. Finally, the observations were fairly shared between the daytime periods but slightly fewer were carried out during the weekday off-peak hours (42.90%) compared to the weekday peak hours (57.10%).
3.2. General Results of the Safety Performance Indicators
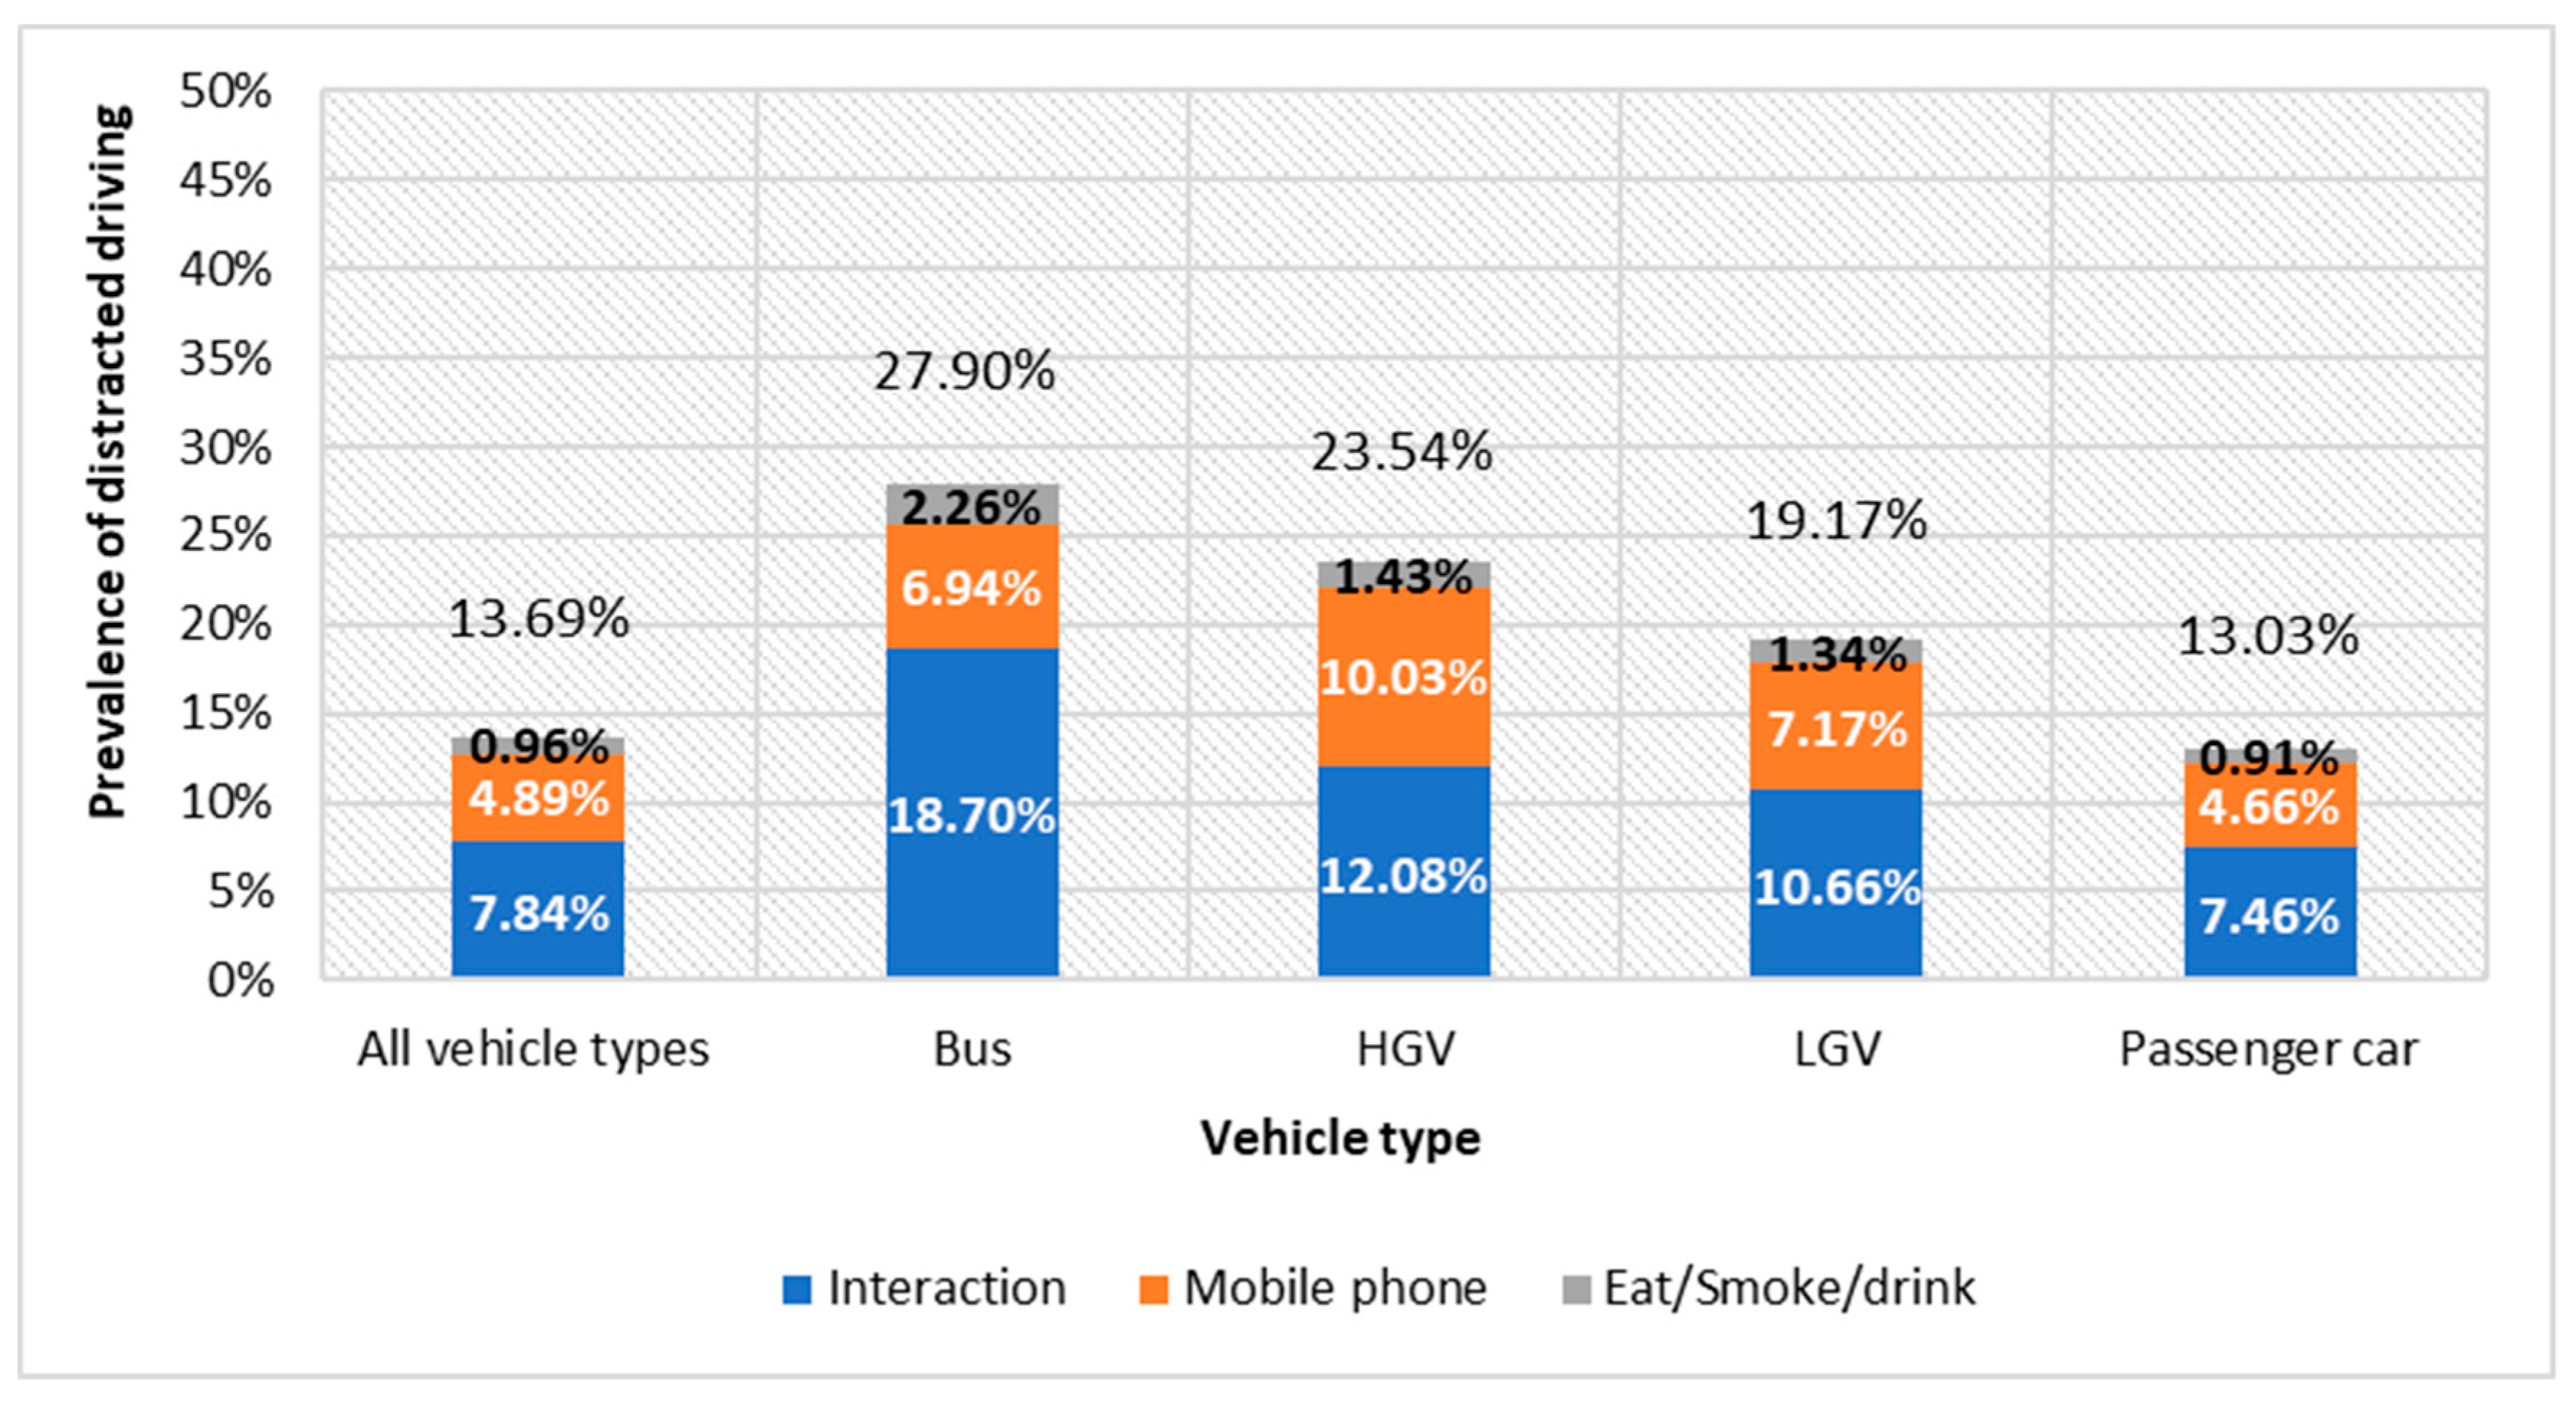
Figure 2 shows the weighted SPIs of the three main types of distracted driving, for all vehicle types and by vehicle type.
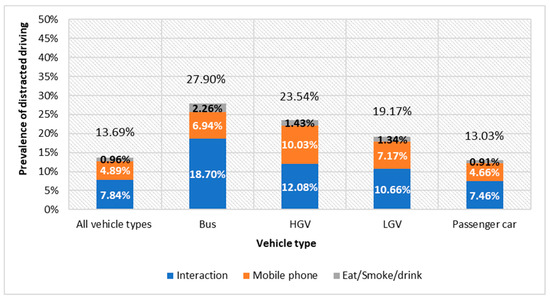
Figure 2.
Prevalence of distracted drivers in Yaoundé per type of distraction and vehicle type.
The weighted SPI values indicate that, for all types of vehicles, road types, time periods and councils, the prevalence of distracted driving in Yaoundé is 13.69%, 7.84% for interaction, 4.89% for handheld mobile device (mostly mobile phone) usage and 0.96% for eating/smoking/drinking. As these are weighted values, it means that in 13.69% of the vehicle-kilometers travelled on Yaoundé roads, drivers are distracted while driving, a concerning finding. For passenger cars the prevalence is 13.03%, for HGVs it is 23.54% (more than one in five) and for LGVs it is 19.17% (almost one in five).
It is interesting to note that interaction distractions are the most common in Yaoundé, regardless of the vehicle category observed. This can be explained by the fact that Yaoundé roads are quite bustling with high levels of traffic, sometimes leading to reduced driving speeds, which foster conversation while driving.
For bus drivers, the prevalence of distracted driving is much higher for each type of distraction (18.7% for interaction, 6.94% for mobile phone use, 2.26% for eating/smoking/drinking) compared to HGV (12.08% for interaction, 10.03% for mobile phone use, 1.43% for eating, smoking or drinking) and LGV drivers (10.66%, 7.17% and 1.34%, respectively). This suggests that bus drivers are more likely to be distracted while driving than drivers of other vehicle types, although these results might not be statistically significant due to the limited number of buses operating in the city.
Over the entire measurement period, four drivers (out of a total sample of 41,004 drivers) were observed to be engaged in more than one type of distracting action simultaneously, which represents an insignificant proportion that was not considered.
3.3. Handheld Mobile Device
3.3.1. Global Prevalence and per Vehicle Type
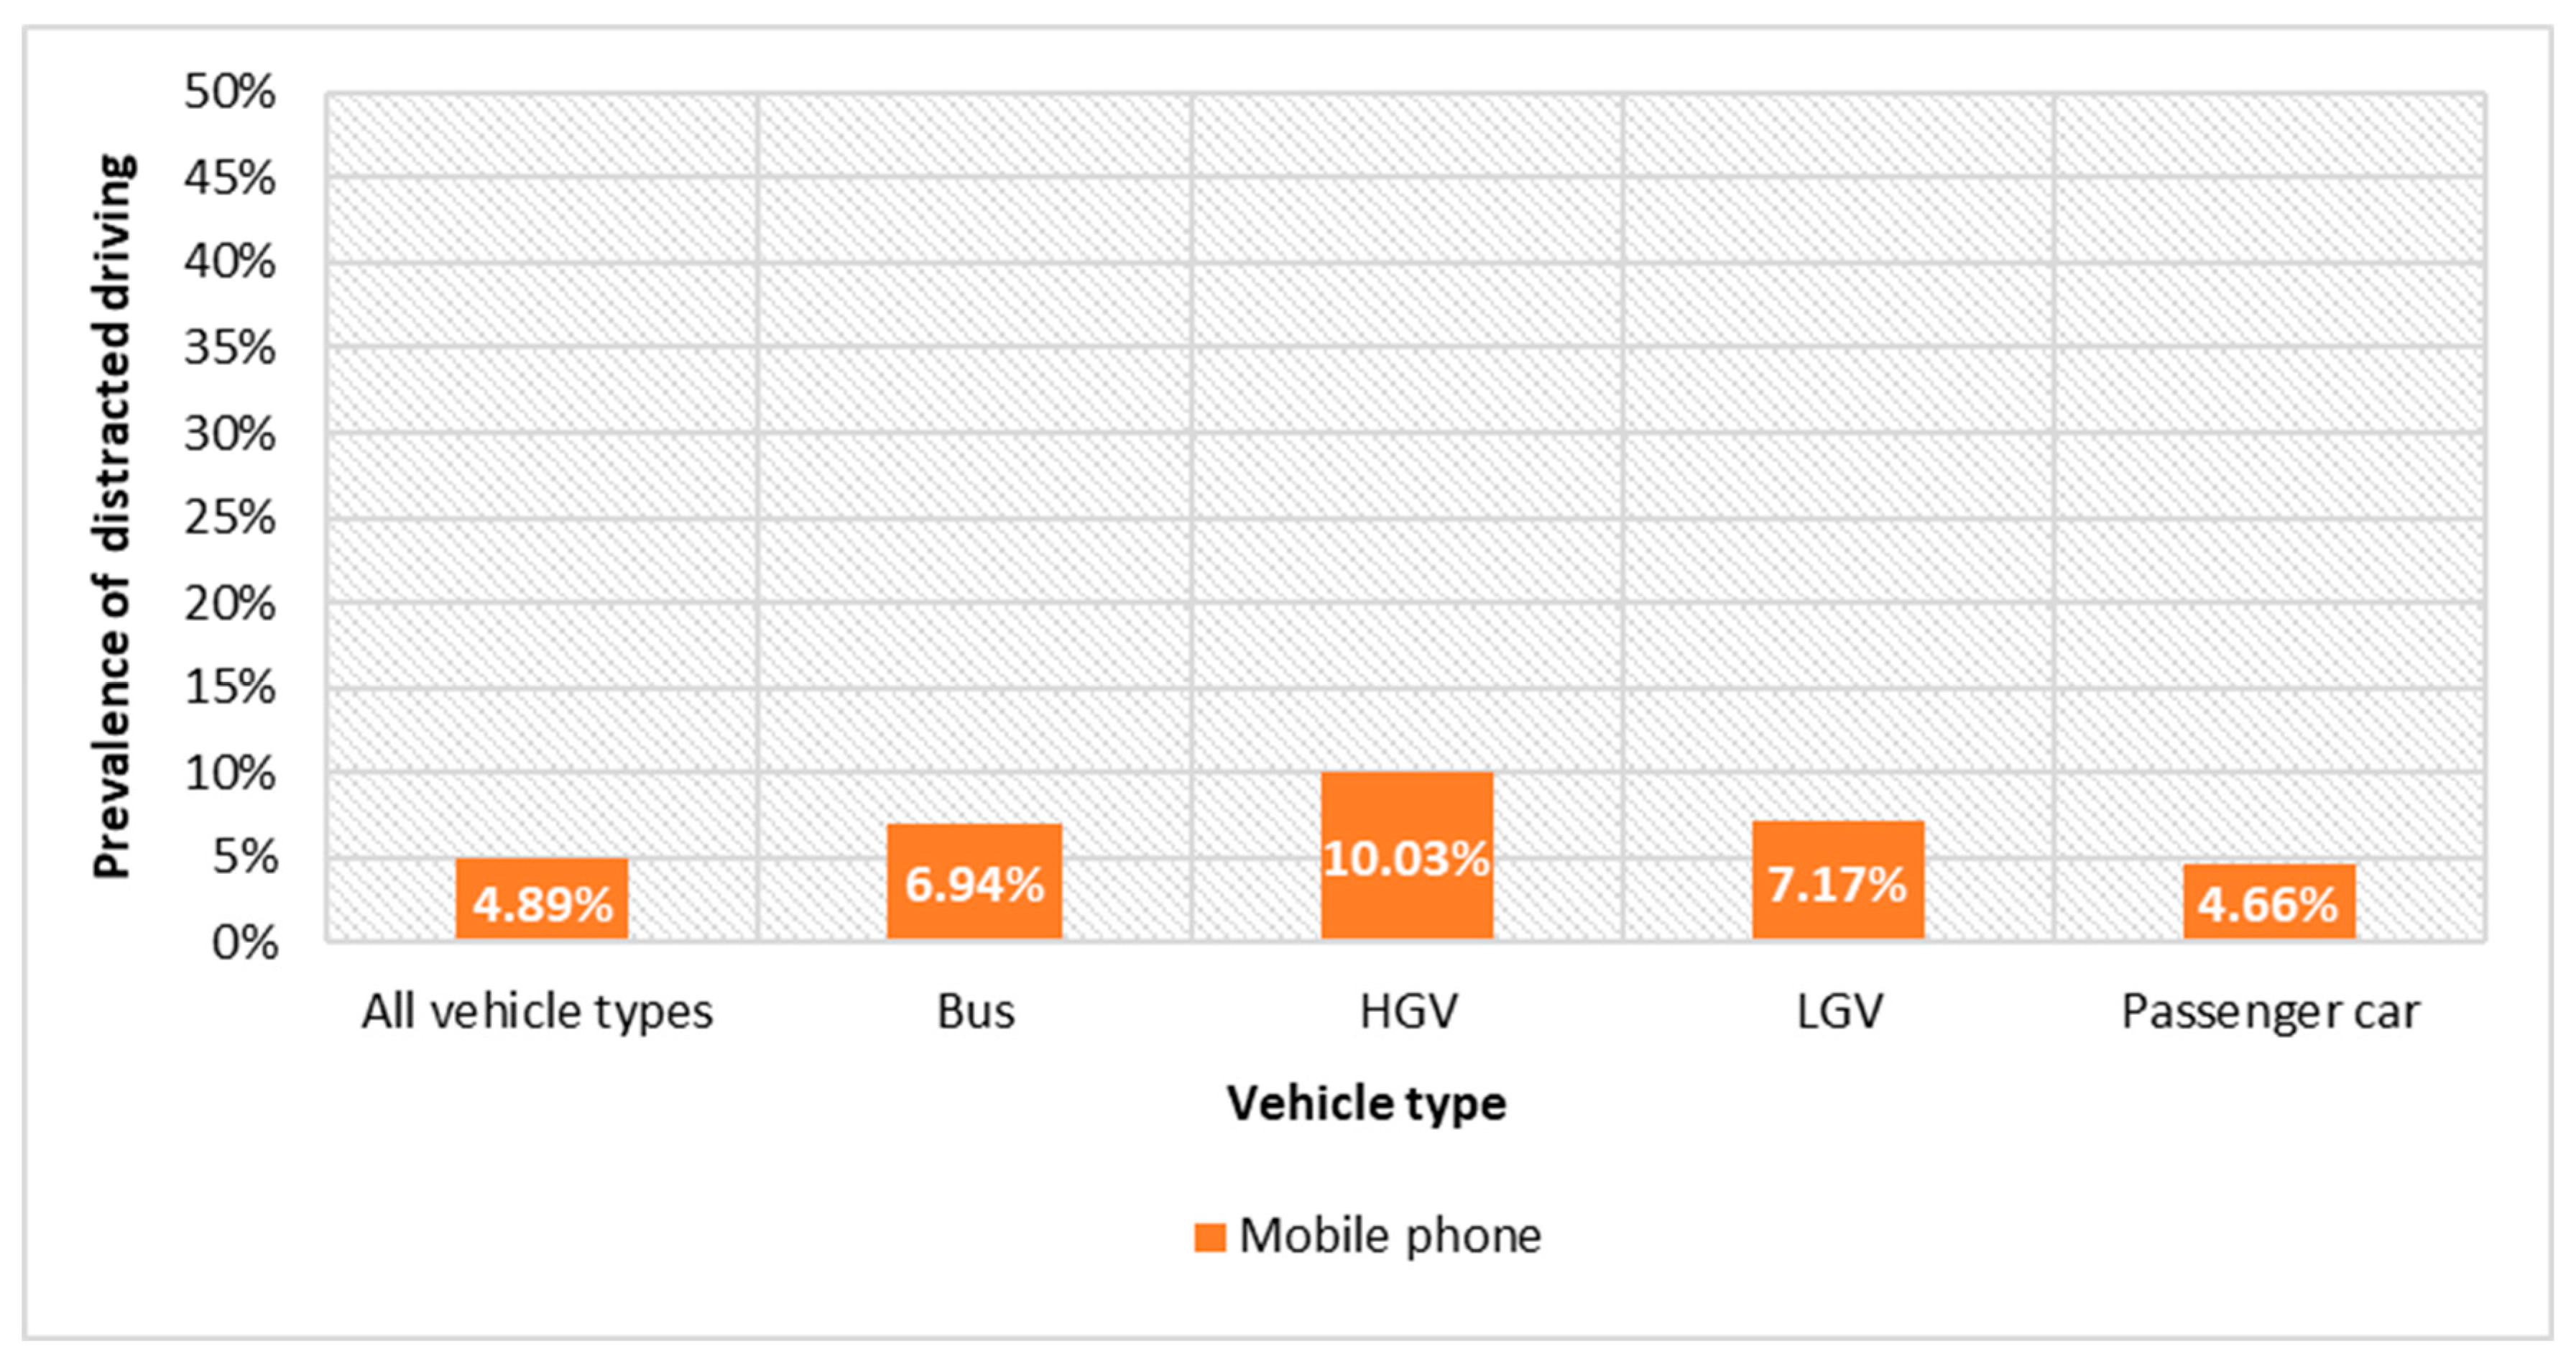
The prevalence of mobile phone distraction for all types of vehicles combined was 4.89%. This means that for all road types, all times of the day, all vehicle types and in all councils, 4.89% of the observed drivers used a mobile device in their hand while driving. From Figure 3, the prevalence of driver distraction is highest for HGVs and LGVs with percentages of 10.03% and 7.17%, respectively. In contrast, passenger cars show slightly lower percentages of driver distraction with values of 4.66%. The reason behind the higher prevalences rates for HGVs and LGVs may be attributed to the predominantly commercial nature of these vehicles, often owned by companies. Drivers of such vehicles may frequently need to engage in multiple phone calls for business purposes, potentially leading to higher instances of distraction while driving.
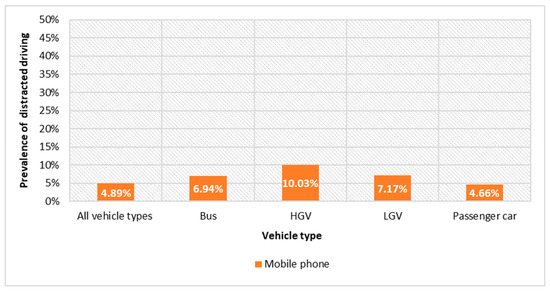
Figure 3.
Prevalence of drivers using a handheld mobile device while driving per vehicle type.
3.3.2. Prevalence per Council
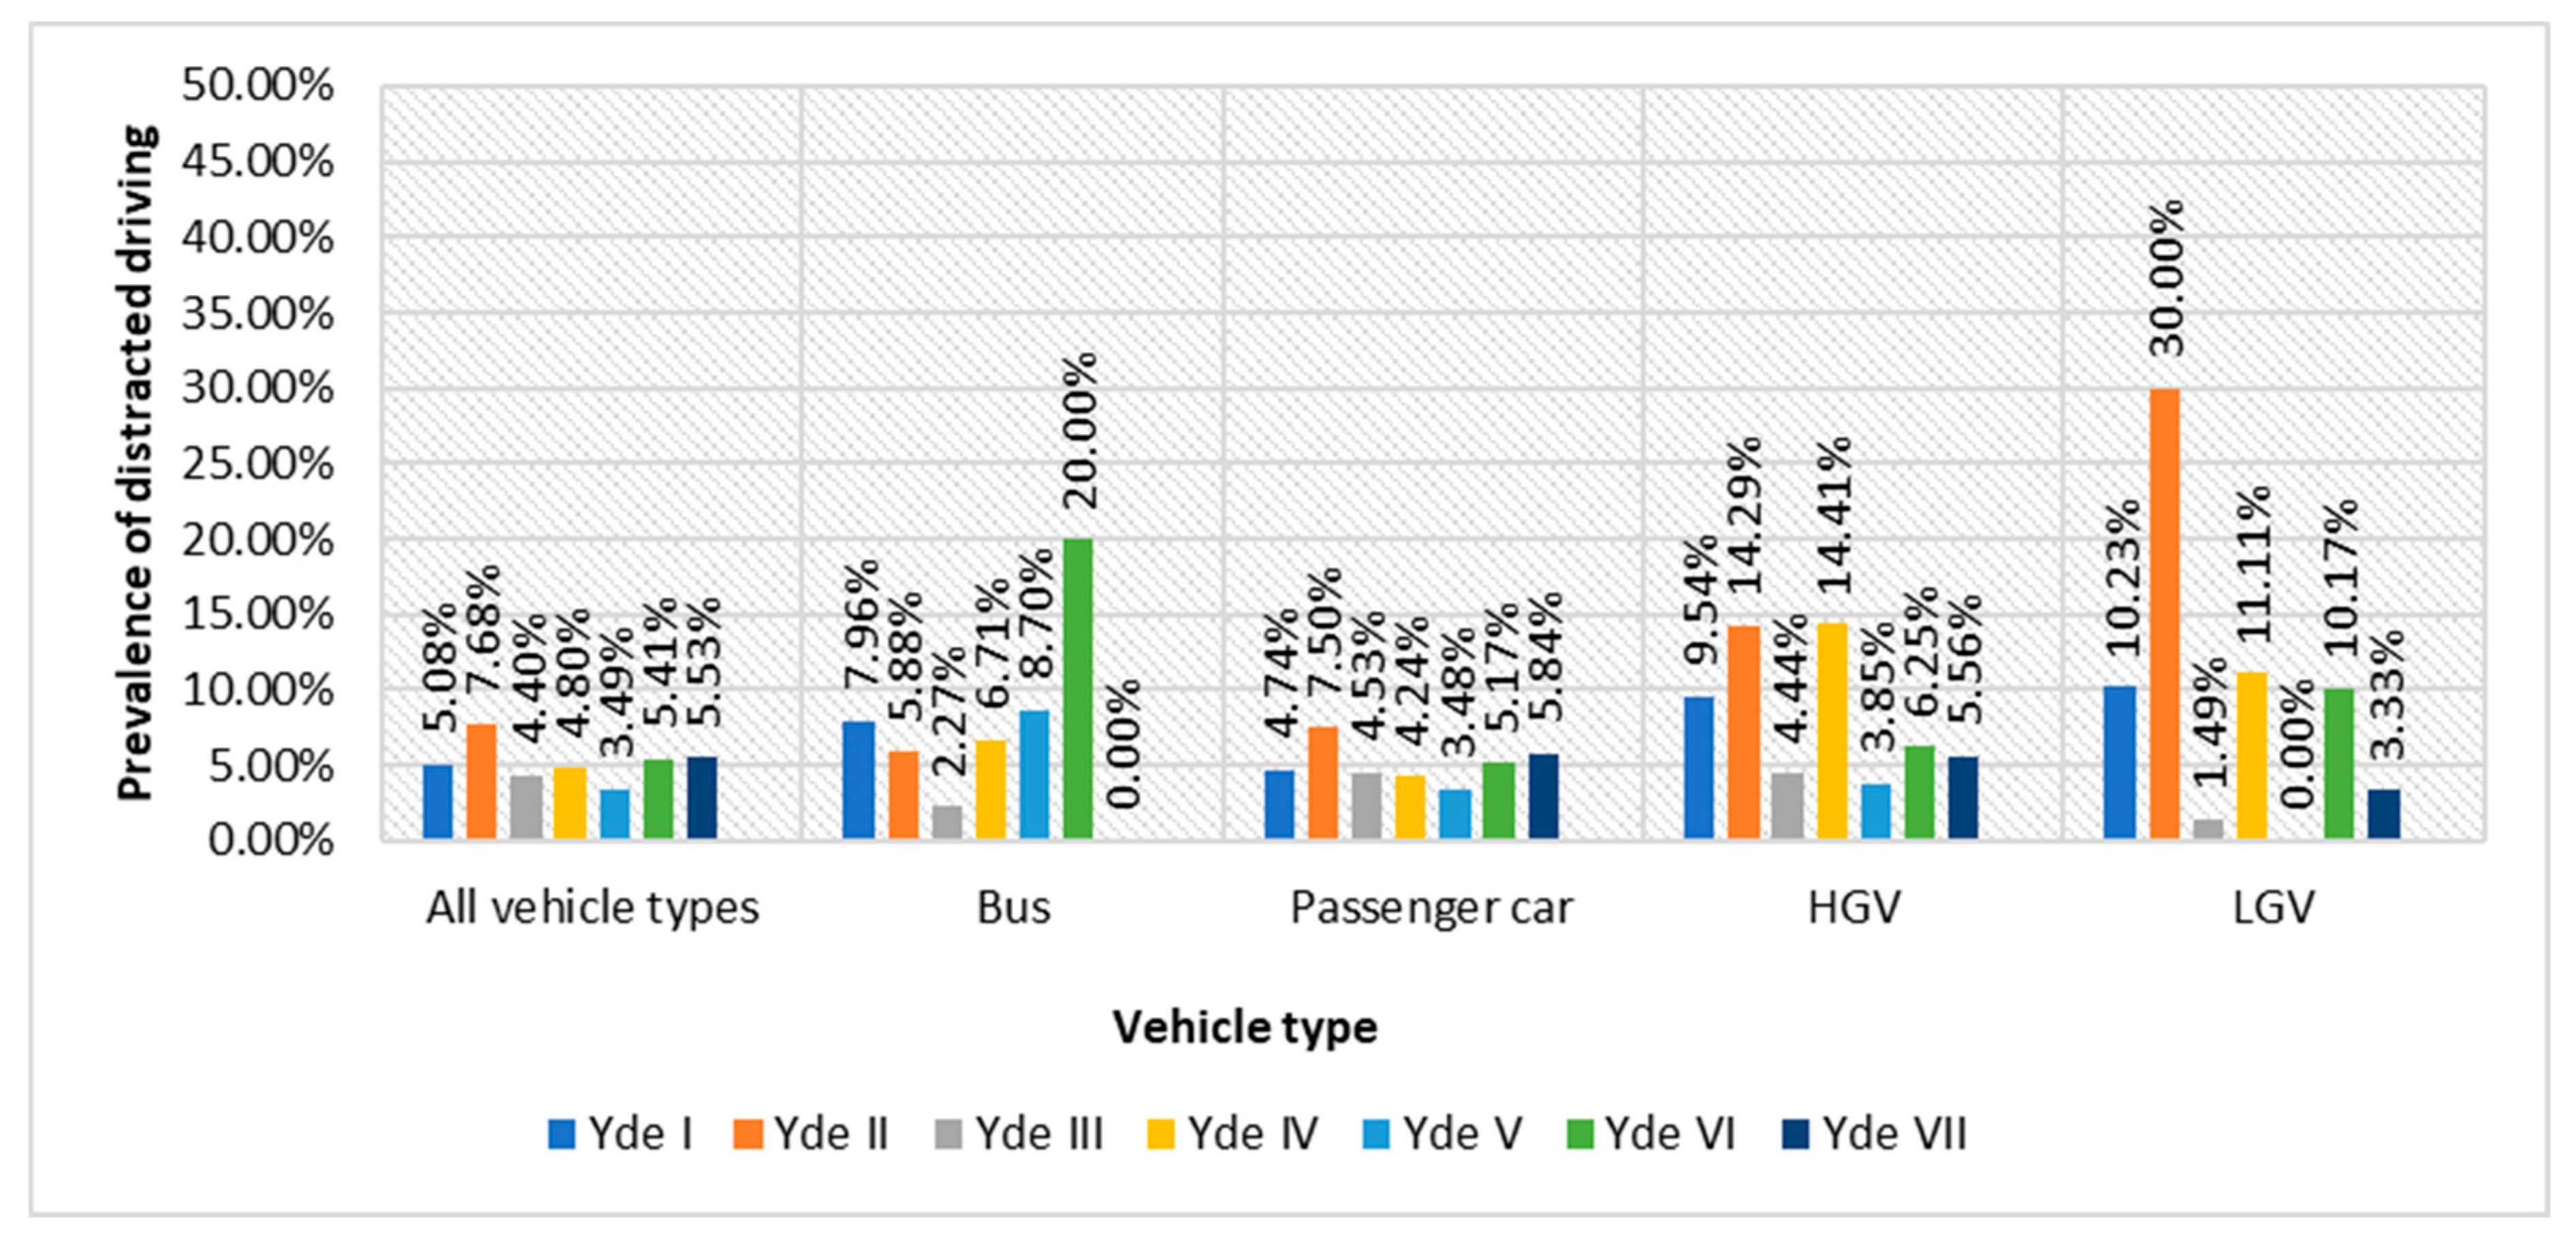
As displayed in Figure 4, the prevalence of mobile phone-distracted driving varies across the different councils in Yaoundé, from 3.49% in Yaoundé V to 7.68% in Yaoundé II for all types of vehicles. There are significant differences according to the type of vehicle in each council. The reasons behind the elevated prevalence of distracted driving for buses in Yaoundé VI can be attributed to the concentration of most transport companies in the area. For passenger cars, the prevalence of distracted driving varies between 3.48% in Yaoundé V to 7.5% in Yaoundé II. This variation in the prevalence of distracted driving can be explained by factors such as the dependence on private cars and the level of commercial activity. For example, the higher prevalence in Yaoundé II (7.5%) and Yaoundé VII (5.84%) may be due to the significant reliance on private cars in these areas, leading to more instances of distracted driving. Additionally, Yaoundé II’s status as a bustling commercial hub could contribute to the higher rates of distracted driving for LGVs and HGVs, as drivers may need to multitask to fulfill business-related responsibilities while driving.
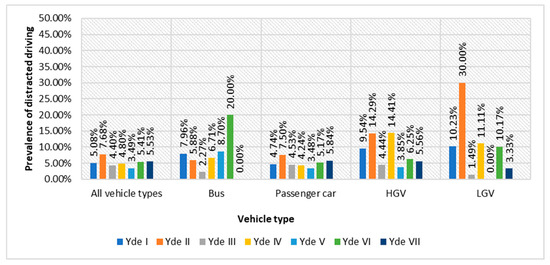
Figure 4.
Prevalence of drivers using a handheld mobile device while driving per councils.
3.3.3. Prevalence per Road Type
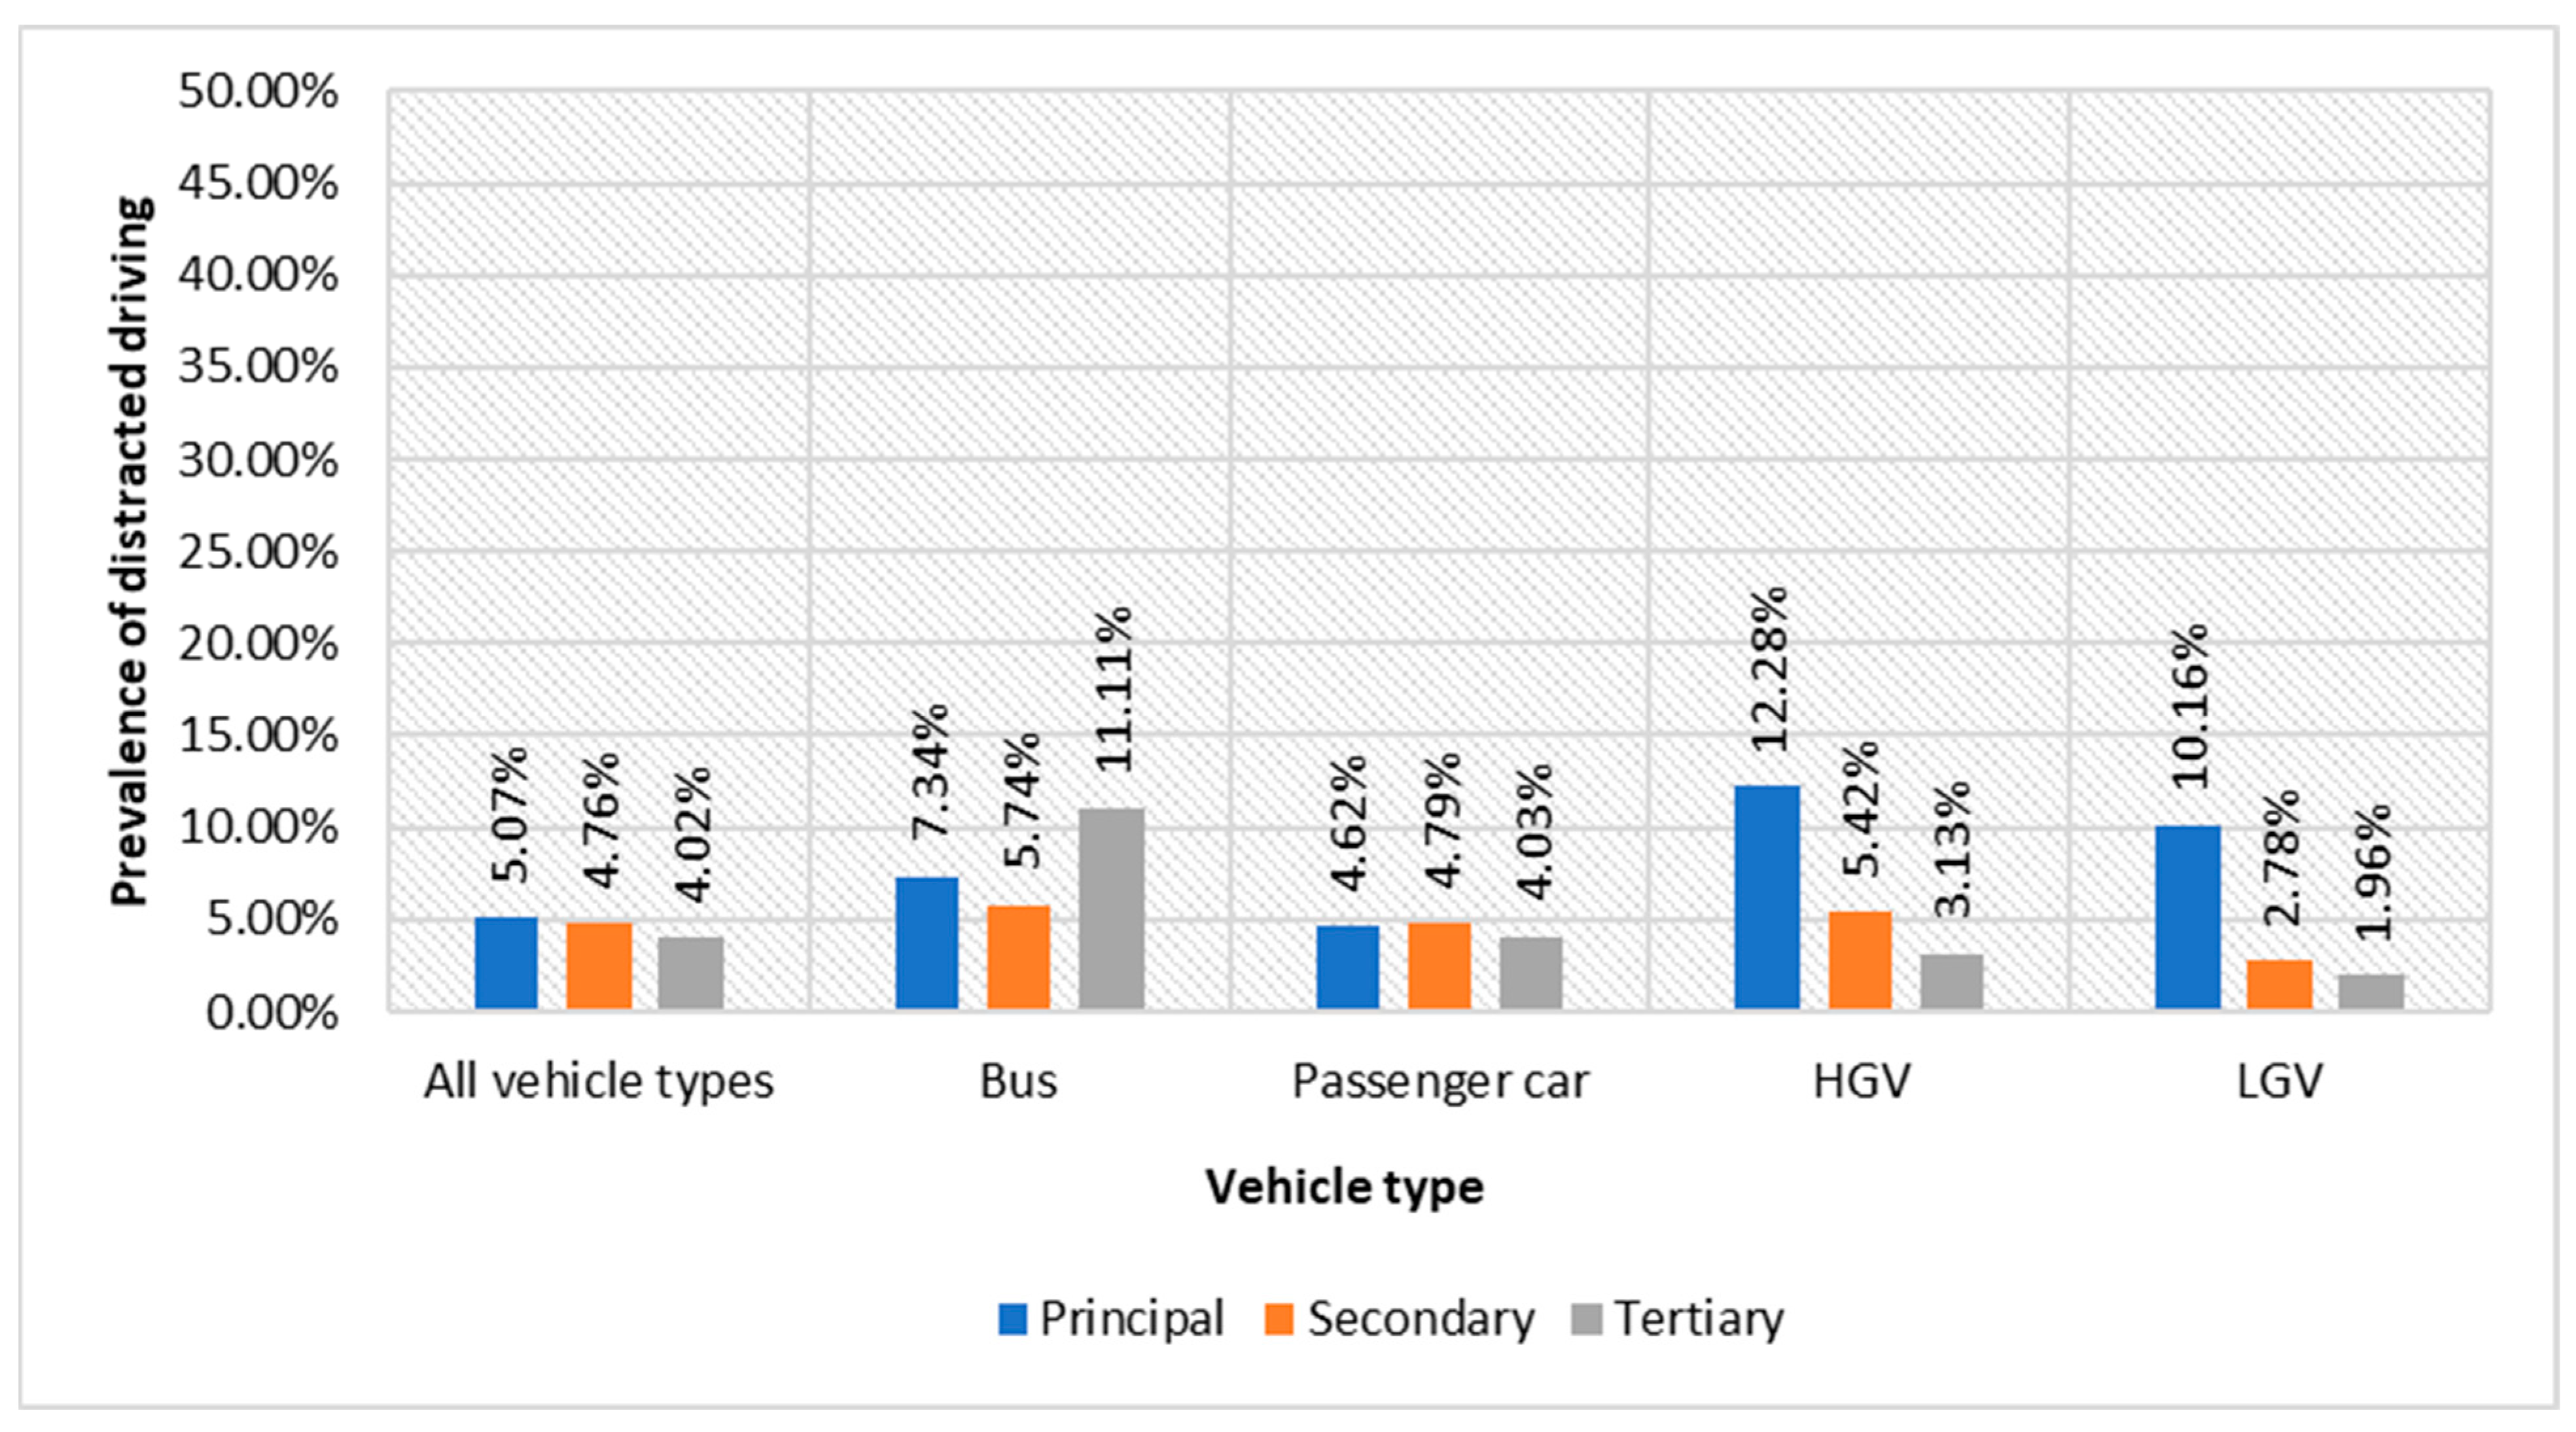
Figure 5 shows the prevalence of mobile phone distraction by road types (primary roads or principal roads, secondary roads and tertiary roads). The observed trend, where the prevalence of distracted driving is higher on primary roads (5.07%) and lower on tertiary roads (4.02%), with the prevalence on secondary roads being 4.76%, underscores the positive relationship between road category and the prevalence of distracted driving. This pattern can be understood by considering the driving conditions and demands associated with different types of roads.
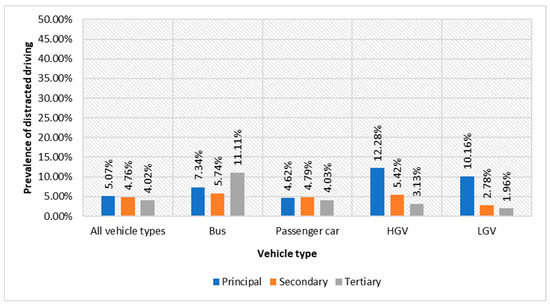
Figure 5.
Prevalence of drivers using a handheld mobile device while driving per road type.
On tertiary roads, which are often in poorer condition, drivers prioritize navigating the road’s challenges, such as avoiding potholes and dealing with less predictable traffic patterns. The immediate demands of such driving environments naturally discourage drivers from engaging in activities that could distract them from these critical tasks.
In contrast, primary and secondary roads, which typically feature better pavement conditions, may lead to a perception of greater safety and comfort among drivers. This perceived ease of driving can make drivers feel more at ease engaging in distracting activities. This applies to all vehicle categories with the exception of buses.
3.3.4. Prevalence per Time Period
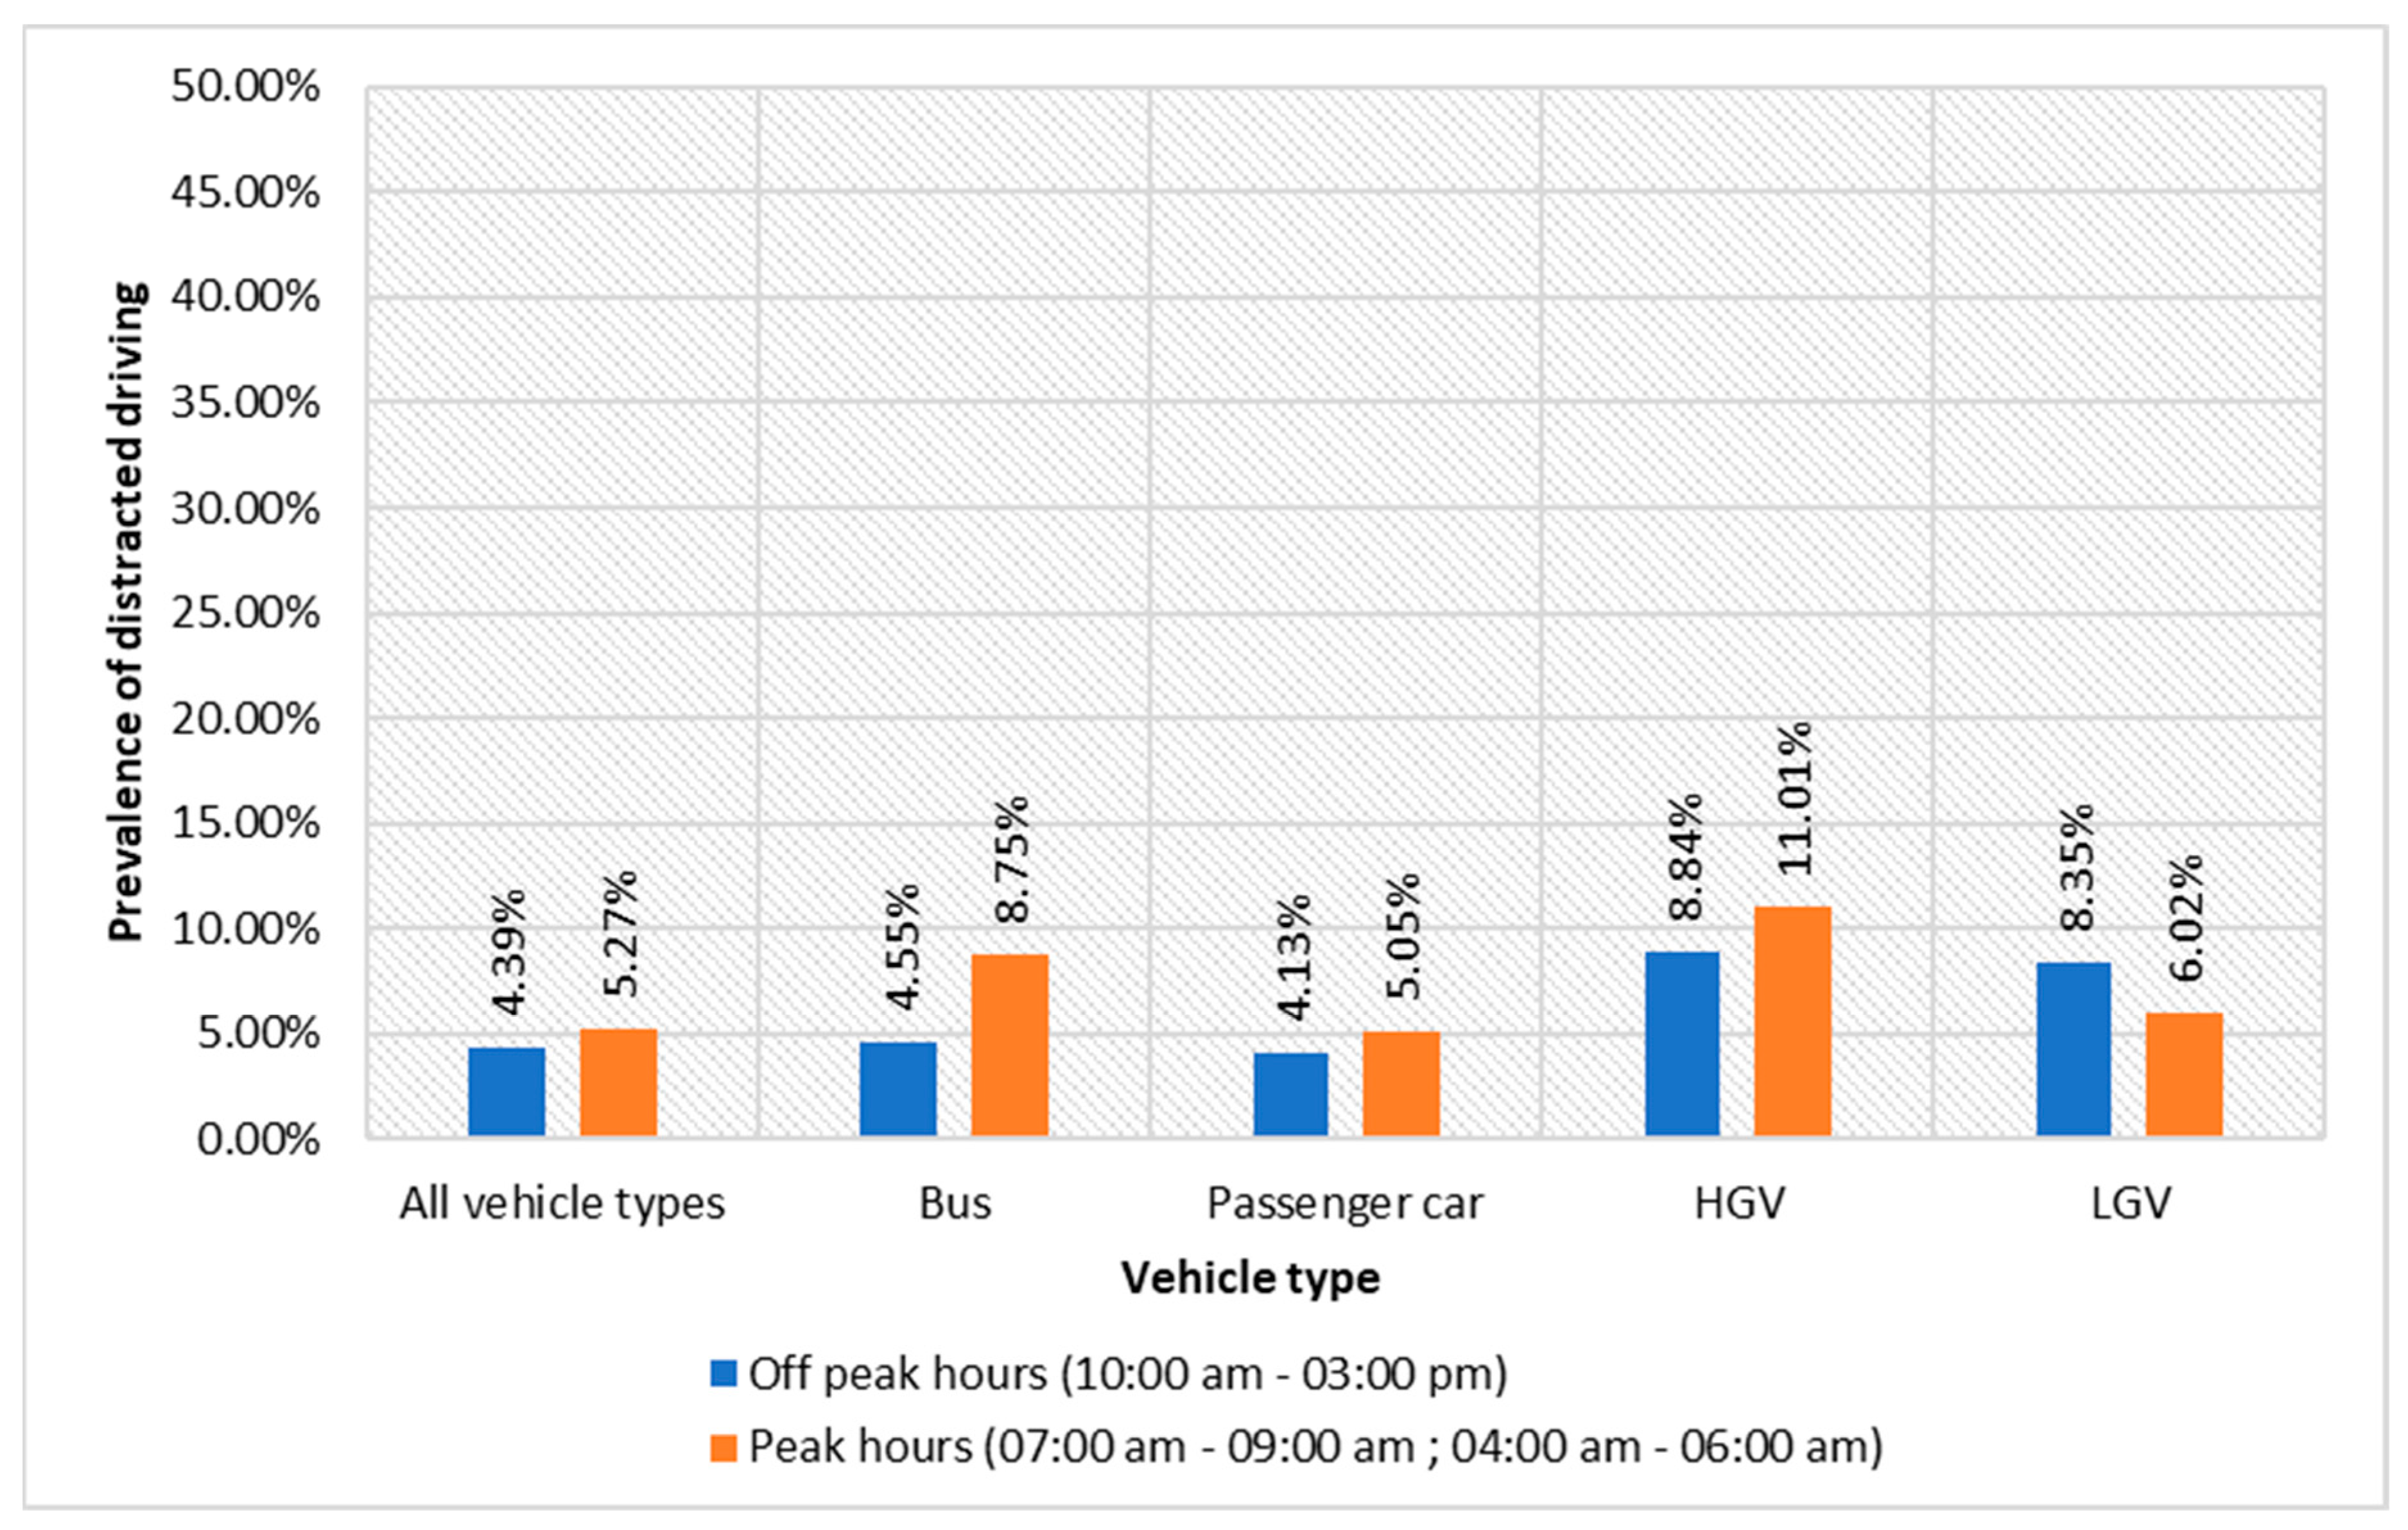
Figure 6 shows the prevalence of mobile phone distraction per time period (peak hours and off-peak hours). It was found that the prevalence of distracted driving during off-peak hours (4.39%) is significantly lower than the prevalence during peak hours (5.27%; χ2 = 16.85; p ≤ 0.001).
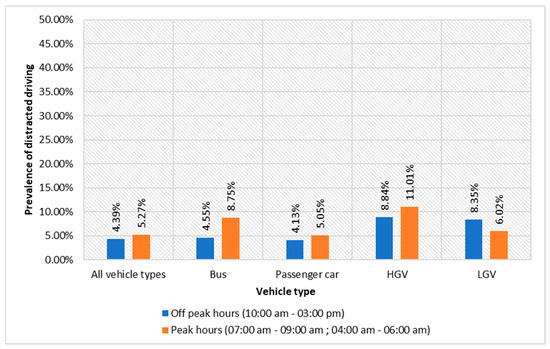
Figure 6.
Prevalence of drivers using a handheld mobile device while driving per time period.
This applies to all vehicle types except for LGVs (8.35% during off-peak hours vs. 6.02% during peak hours). This significant difference in the prevalence of distracted driving between peak and off-peak hours with a notable exception for LGVs highlights how traffic density and the time of day influence driver behavior. During peak hours, roads are busier, so drivers may engage in more distracting behaviors, possibly as a way to mitigate the boredom associated with slower moving traffic. For LGVs, the higher prevalence of distracted driving during off-peak hours compared to peak hours could be related to work patterns as they might be under less time pressure during off-peak hours, making them more inclined to engage in distracting activities.
Among all vehicle types, the smallest variation in the prevalence of distracted driving between peak and off-peak hours was observed among passenger cars (5.05% vs. 4.13%), suggesting that the driving behavior of this group is more consistent throughout the day. In contrast, buses and Heavy Goods Vehicles (HGVs) showed more significant variations (8.75% vs. 4.55% for buses and 11.01% vs. 8.84% for HGVs), which could be due to the professional nature of their driving.
3.3.5. Prevalence per Age Group
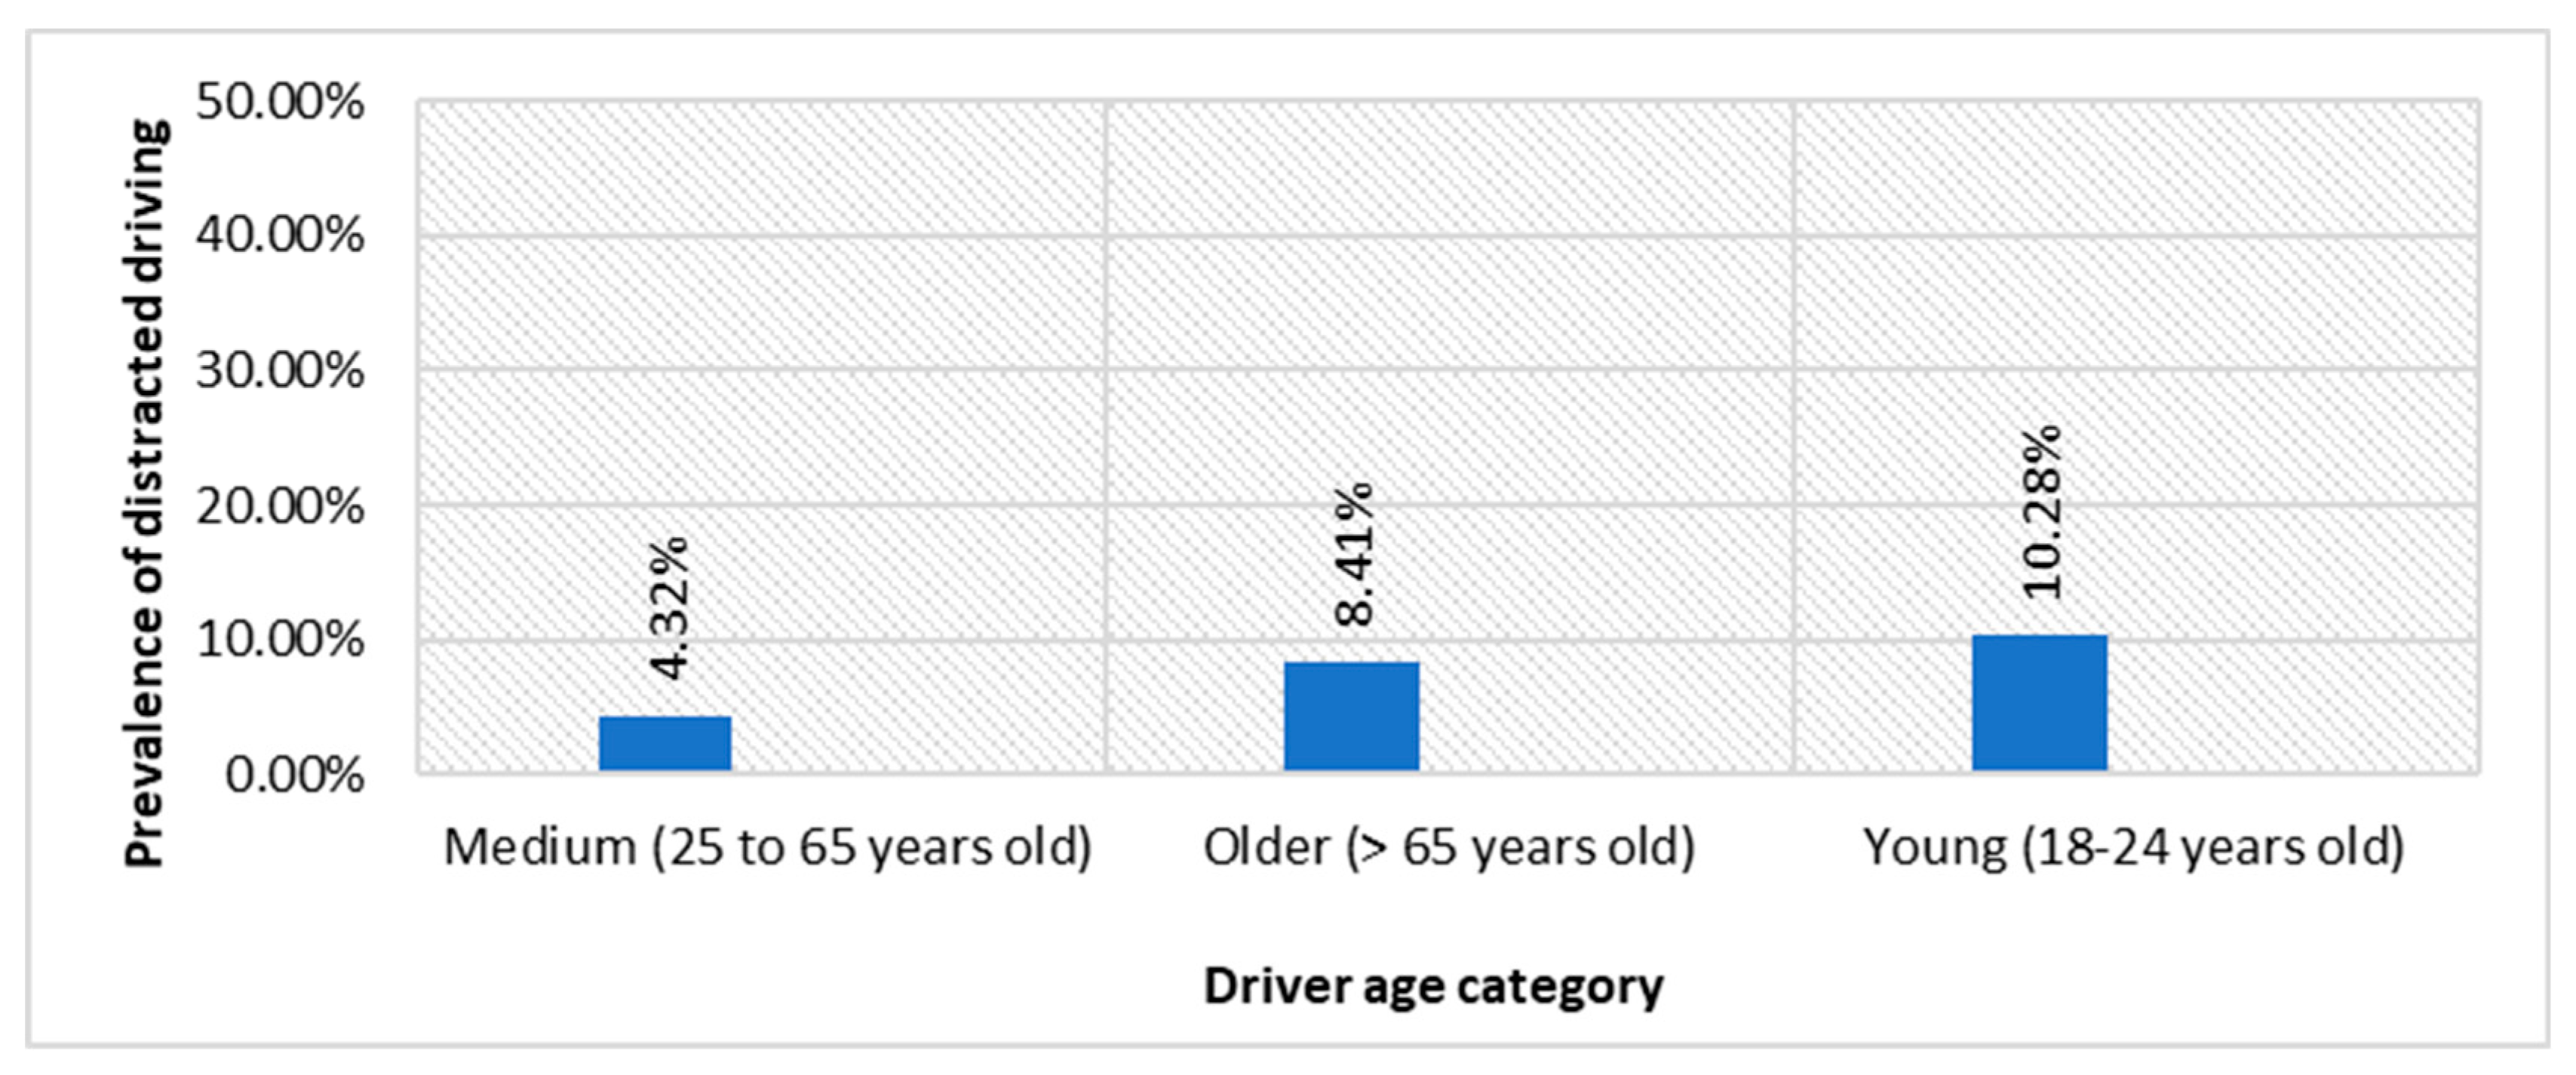
Due to the very low sample size of older drivers, particularly for the bus, HGVs and LGVs categories, the prevalence of distracted driving in this age group was only presented for passenger cars. Figure 7 shows a systematic decrease in the proportion of people using a handheld mobile device with increasing age, and the difference between some age groups is statistically significant. Drivers aged 65 and over are less likely to use a handheld mobile device while driving than young drivers aged 18–24 (10.28%; χ2 = 87.149; p ≤ 0.01). The same is not statistically significant for drivers aged 25–64. In addition, the proportion of distracted driving in the youngest age group was also statistically significantly higher than in the 25–64 age group (4.32%; χ2 = 74.999; p ≤ 0.05).
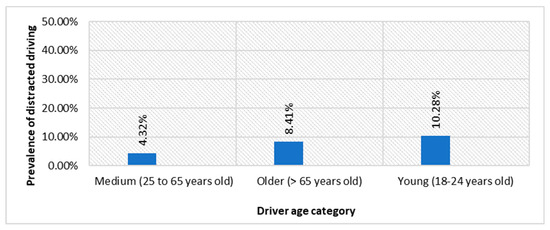
Figure 7.
Prevalence of drivers using a handheld mobile device while driving per age group.
The reasons behind the higher rates of distracted driving among younger drivers could be related to a lower risk perception, greater comfort with technology and less driving experience. They may underestimate the dangers of using mobile devices while driving and feel more inclined to engage in multitasking behaviors. On the contrary, older drivers are generally more experienced, have higher risk awareness and are less likely to engage in risky behaviors. Additionally, age-related changes in cognitive abilities may lead older drivers to prioritize safety and minimize distractions while behind the wheel.
3.3.6. Prevalence According to Gender
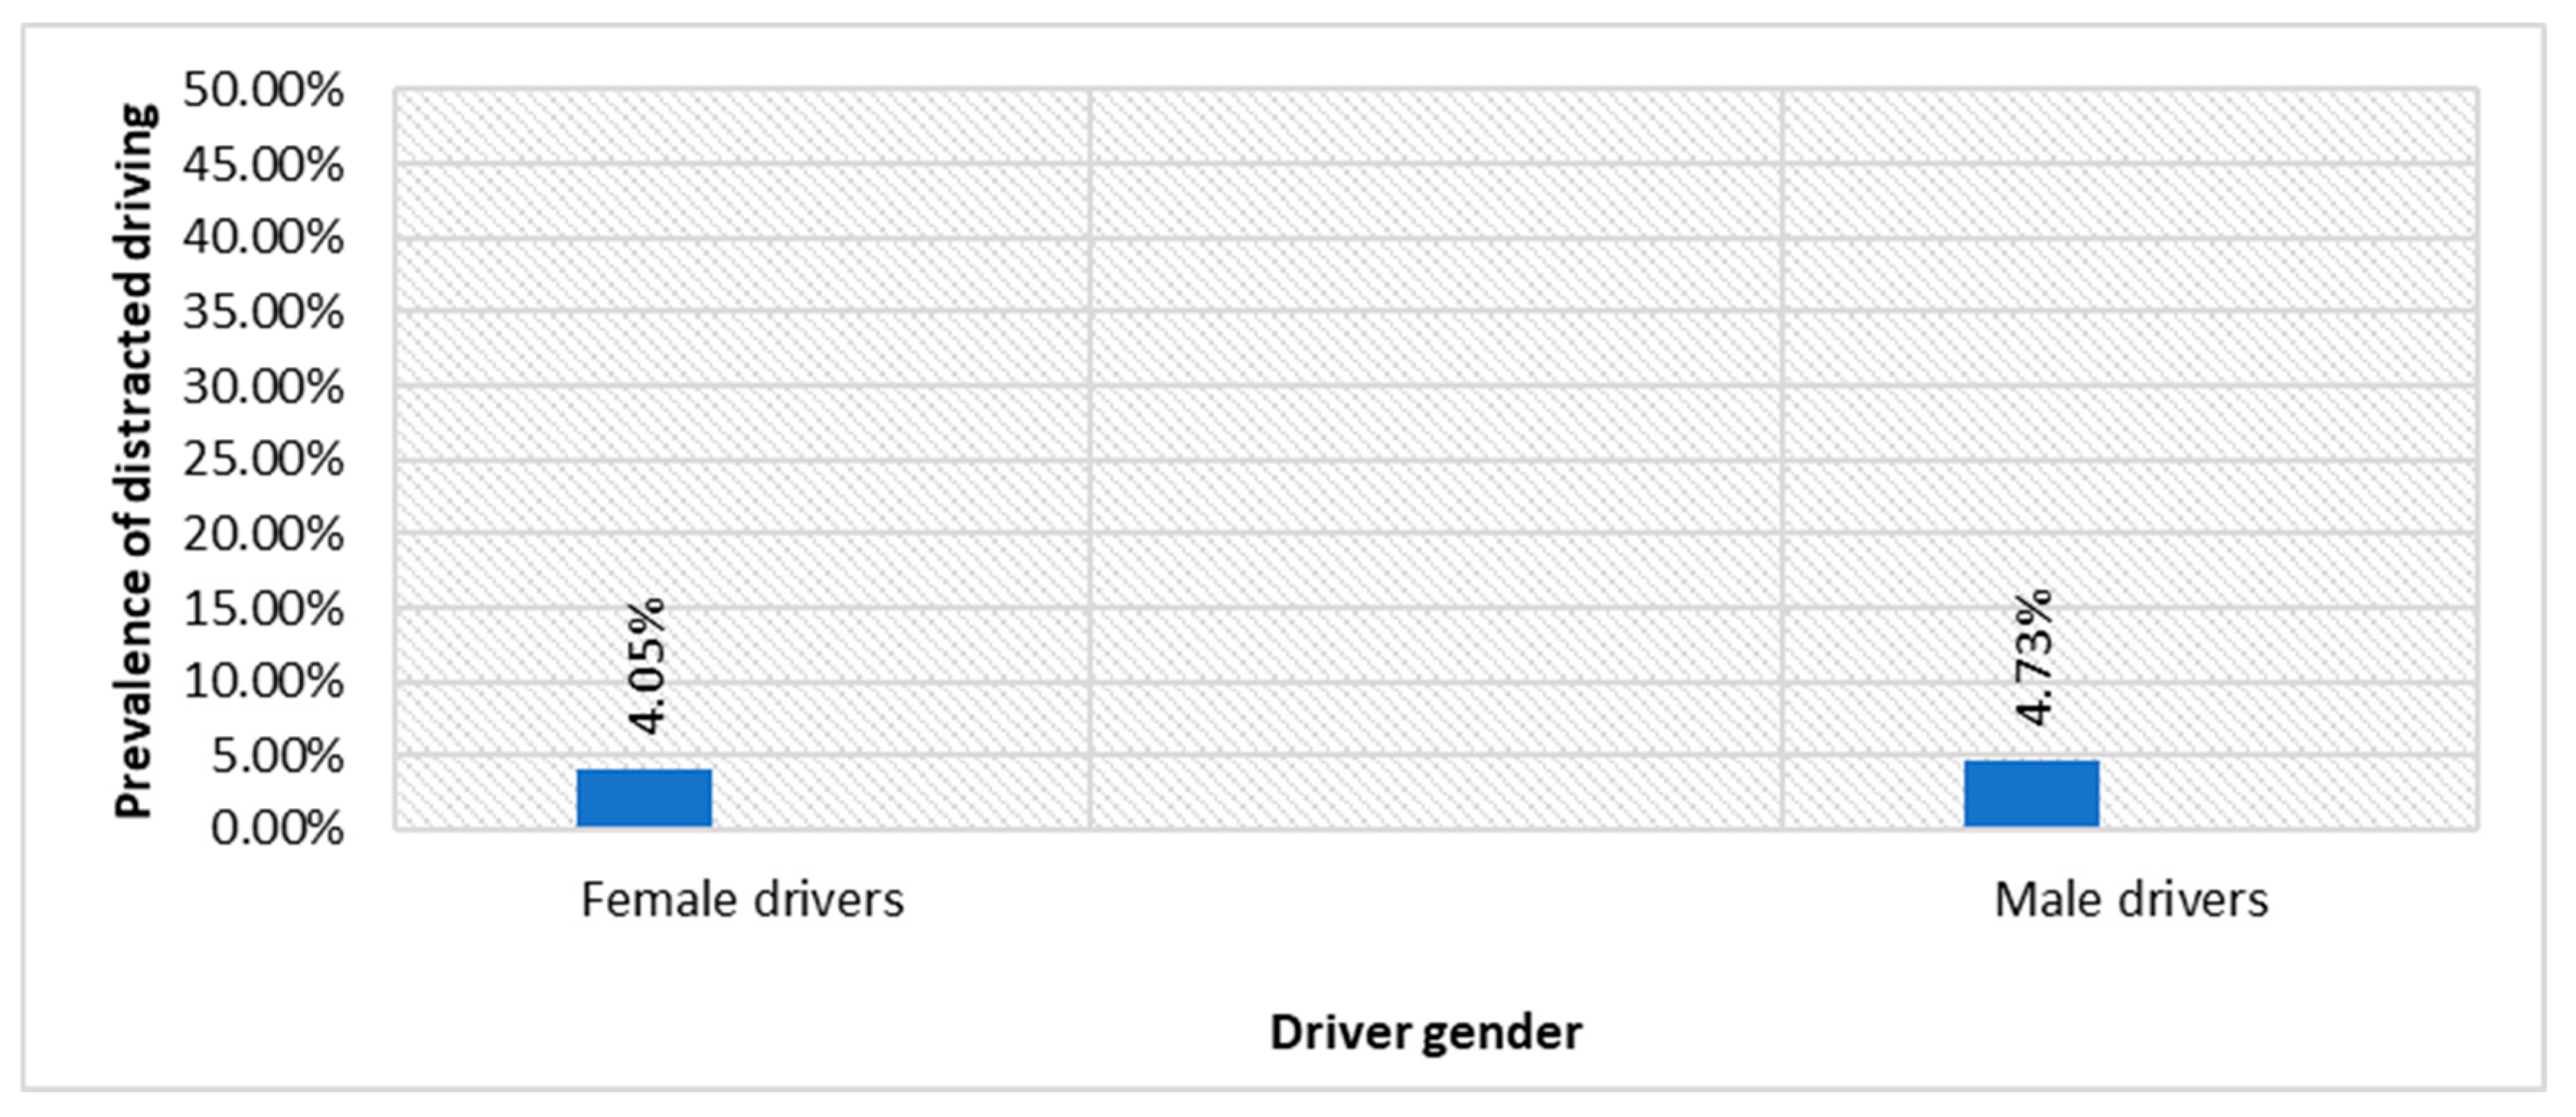
This analysis was only carried out for passenger cars as women are significantly under-represented in the other vehicle categories. The results (see Figure 8) show that female drivers (4.05%) were statistically significantly less likely to use a handheld mobile device while driving than male drivers (4.73%; χ2 = 14.057; p ≤ 0.001). While the difference in prevalence is not substantial, it is statistically significant. One potential explanation for the higher prevalence among male drivers could be their tendency towards risk-taking behaviors while driving. Men usually generally exhibit a higher propensity for risk taking compared to women, which could manifest in behaviors such as distracted driving.
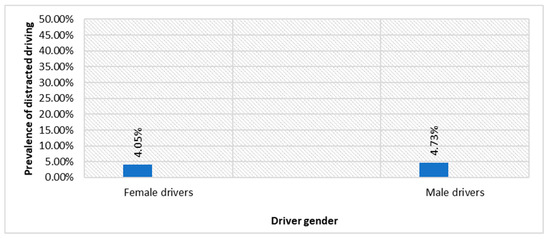
Figure 8.
Prevalence of drivers using a handheld mobile device while driving per gender.
3.3.7. Prevalence According to Passenger Presence
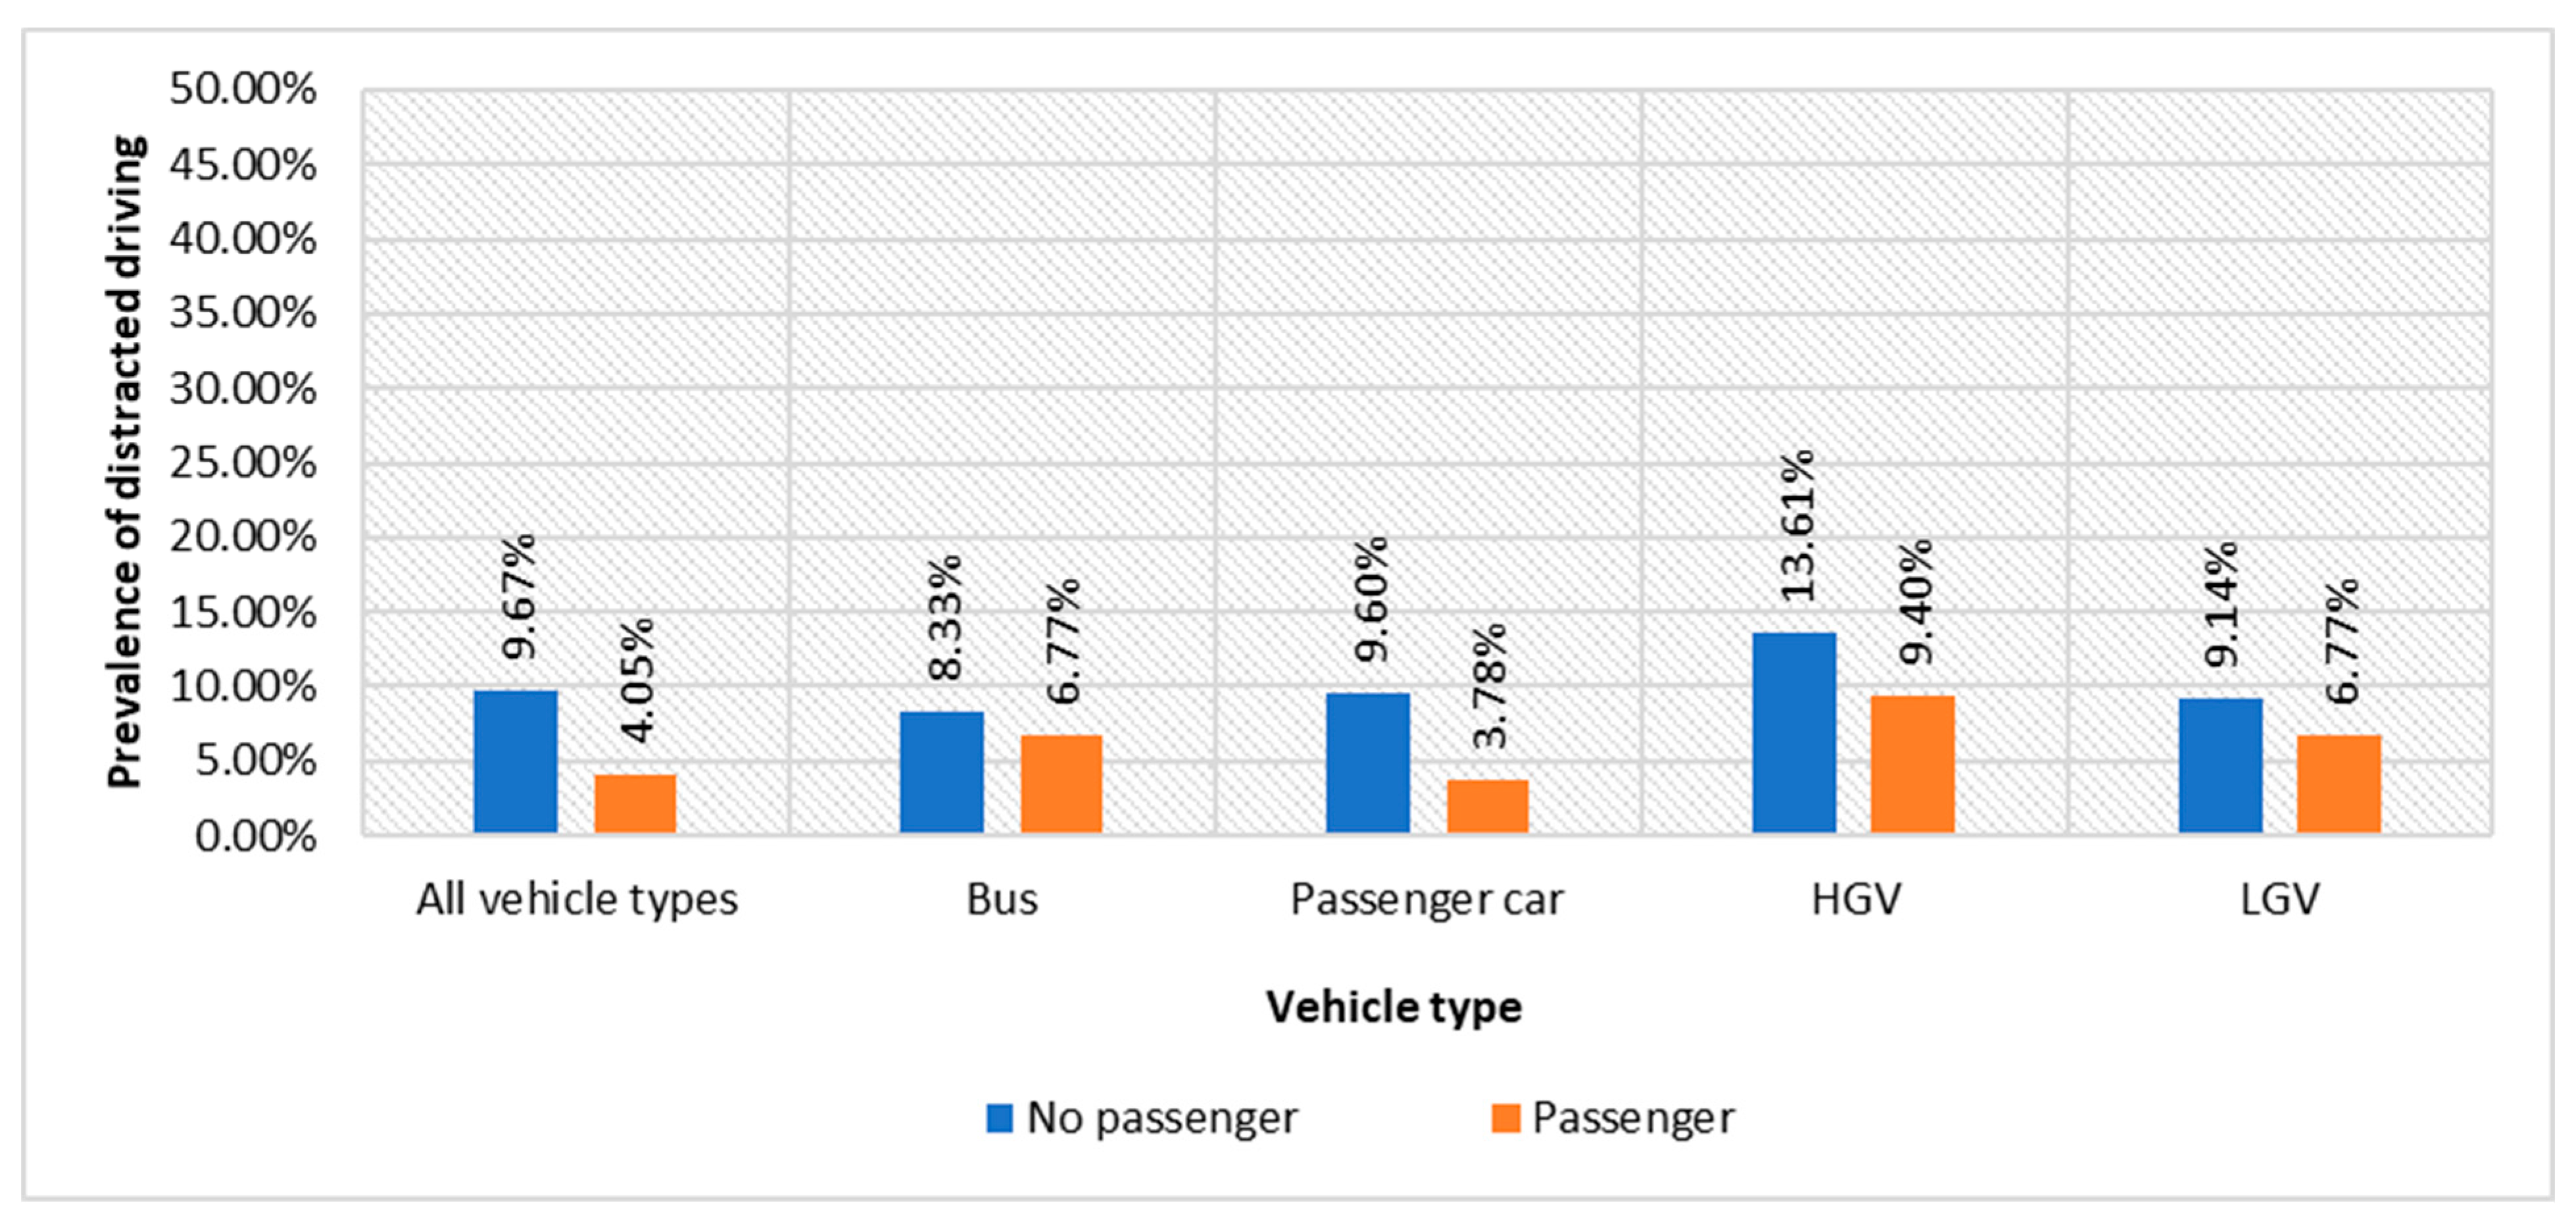
Figure 9 shows the prevalence of drivers being distracted by a handheld mobile device in the presence and absence of passengers. The results suggest that the prevalence decreases significantly when the driver is in the presence of a passenger. At any given time, 9.67% of solo drivers (across all four vehicle types) were using a handheld mobile device, compared to 4.05% of drivers with one or more passengers. Many reasons can explain this. Firstly, passengers may assist drivers with tasks that would otherwise require the driver’s attention, such as sending texts or making calls, thereby reducing the need for the driver to engage in distracted driving behaviors. Additionally, the presence of passengers might create a social deterrent for the driver to engage in risky behaviors like distracted driving, as they may feel a sense of responsibility or a desire to avoid negative judgment from their passengers.
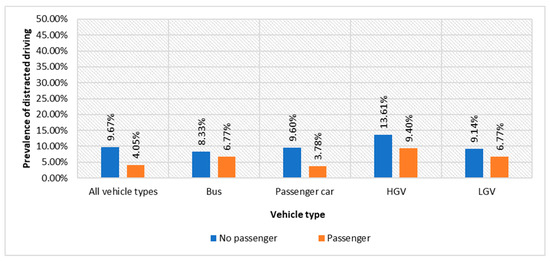
Figure 9.
Prevalence of distracted driver per passenger presence.
3.4. Interaction
Table 3 shows an overview of the prevalence of distracted driving by interaction for every vehicle type.

Table 3.
Prevalence of drivers interacting with passengers while driving.
The prevalence of interaction-distracted driving was found to be 7.84% for all vehicle types combined. Of the interacting drivers, buses and HGVs had the highest prevalence of interactions, with percentages of 18.70%, and 12.08%, respectively, although these differences are not statistically significant. For passenger cars and LGVs, the prevalence of distractions was 7.46% and 10.66% but the difference was still not statistically significant. There were no statistically significant differences between the road type, councils, gender and the estimated age of drivers.
Interaction-distracted driving was observed in 100% of the drivers when they had a passenger. This result is logical as interaction distraction inherently involves another person’s presence in the vehicle and was only observed in such situations.
The elevated rates of interaction distraction among buses and HGVs, as opposed to other vehicle types, can largely be attributed to the nature of their operations and the environment within these vehicles. Buses, for instance, naturally carry more passengers who might ask for directions, fares, stops or even engage in casual conversation. Although less common in HGVs, when there are passengers, they are often colleagues or co-drivers, which might lead to work-related discussions or social interactions.
3.5. Eating/Smoking/Drinking
Eating, smoking or drinking behaviors include both people holding a cigarette and people driving with a cigarette in their mouth, eating, chewing or drinking water or other liquids. The share of the observed drivers engaged in this type of distraction was very low compared to the other types of distraction, leading to small values, as shown in Table 4.

Table 4.
Prevalence of drivers eating/smoking/drinking while driving.
Overall (for the four types of vehicles, including bus drivers), 0.96% of drivers ate, smoked or drank while driving. The prevalence was higher for bus drivers (2.26%) compared to other types of vehicles (0.91% for passenger cars, 1.43% for HGVs and 1.34% for LGVs), but this difference was not statistically significant and there were no statistically significant differences between the road type, councils, gender and age group of the drivers.
The higher prevalence of eating, smoking or drinking behaviors while driving among bus drivers, Heavy Goods Vehicle (HGV) drivers, and Light Goods Vehicle (LGV) drivers compared to passenger car drivers could be attributed to the driving duration. Bus drivers, HGV drivers and LGV drivers often spend extended periods behind the wheel, especially for long-distance journeys or continuous routes. The longer duration of driving may increase the likelihood of engaging in activities such as eating, smoking or drinking to alleviate boredom or fatigue.
3.6. Summary of Findings
As presented in the previous section, significant insights into the prevalence of distracted driving were drawn out as a result of the analysis. The following is a summary of the main findings:
- Across all vehicle types, the prevalence of distracted driving in Yaoundé is 13.69% (all types of distraction combined), 7.84% for interaction, 4.89% for handheld mobile device (mostly mobile phone) usage and 0.96% for eating/smoking/drinking.
- Passenger cars show lower rates (4.66%) of mobile phone distracted driving compared to HGVs (10.03%) and LGVs (7.17%) which experienced higher rates which might be attributed to their commercial use necessitating frequent business-related calls.
- The prevalence of mobile phone-distracted driving across Yaoundé’s councils ranges from 3.49% (Yaoundé V) to 7.68% (Yaoundé II), with higher rates observed for buses (20%) in Yaoundé VI, possibly due to the concentration of transport companies, and for passenger cars (7.5%) in Yaoundé II, potentially linked to a reliance on private cars.
- Mobile phone distraction peaks on primary roads (5.07%), decreases on secondary roads (4.76%) and is lowest on tertiary roads (4.02%), suggesting that drivers may feel safer on well-maintained primary and secondary roads, leading to more distracted behaviour compared to the more demanding driving conditions of tertiary roads.
- Mobile phone-distracted driving is higher during peak hours (5.27%) than off-peak hours (4.39%), with drivers possibly using distractions to mitigate slow traffic boredom; LGVs show the opposite trend, with more distractions during off-peak hours (8.35% vs. 6.02%), possibly due to reduced work pressure.
- The prevalence of mobile distraction while driving is highest among younger drivers aged 18–24 (10.28%) compared to older drivers, reflecting younger drivers’ lower risk perception and greater comfort with technology, while older drivers prioritize safety and have more driving experience.
- Mobile phone distraction while driving a passenger car is higher for male drivers (4.73%) compared to female drivers (4.05%), which may stem from male drivers’ inclinations toward risk-taking behaviours while driving, reflecting broader gender differences in risk propensity.
- Drivers are less likely to use handheld mobile devices when passengers are present, with a significant drop from 9.67% when alone to 4.05% with passengers. This decrease could be due to passengers helping with tasks like texting or calling, or a social deterrent effect where drivers avoid risky behaviours to prevent negative judgment.
- Buses (18.70%) and HGVs (12.08%) show higher rates of interaction-distracted driving compared to passenger cars (7.46%) and LGVs (10.66%), potentially due to their operational dynamics as buses accommodate more passengers, leading to interactions, while HGVs may involve work-related interactions when passengers are present.
- Bus (2.26%), HGV (1.43%) and LGV drivers (1.34%) exhibited higher rates of eating/smoking/drinking-distracted driving compared to passenger cars’ drivers (0.91%). This could be attributed to longer driving durations associated with these roles, potentially leading to these activities to alleviate boredom or fatigue.
4. Comparison with Other Countries
The values of the distraction safety performance indicators (prevalence of distracted driving) from the field observation showed that at the level of the city of Yaoundé, 13.69% of drivers are potentially distracted while driving with 7.84% for interaction, 4.89% for handheld mobile device use and 0.96% for eating/smoking/drinking. Within the Baseline project, it was found that for all the 18 participating countries, the prevalence of drivers not using a handheld mobile device while driving was more than 90% (with less than 10% of drivers using a handheld mobile device while driving) overall with the actual percentage ranging from 90.6% (with 9.4% of drivers using a handheld mobile device) in Cyprus to 98.3% (1.7% of drivers using a handheld mobile device while driving) in Finland [78]. The results obtained in this study (4.89% of drivers using a handheld mobile device while driving) are within the range of the Baseline, even if a direct comparison cannot be made as the Baseline values are for national level and not the city level. At a more regional level, in South Africa in 2019, Binda and Muronga found a prevalence of distraction of 9% (mobile phone use, interaction, grooming, smoking, external distraction) among the 3958 coach drivers observed in the province of Gauteng [75]. The specific prevalence for handheld mobile phone use was 4.32%, which is quite close to the value obtained within this study (4.89%). However, caution must be taken as the study settings are very different (only 3958 drivers observed, only two locations, non-weighted value, etc.). The scarcity of field observation studies with the same setting in a similar traffic environment make it difficult to conduct more detailed comparison analysis; however, the general tendency shows that the results are somewhat aligned with the values found in other contexts.
5. Recommendations
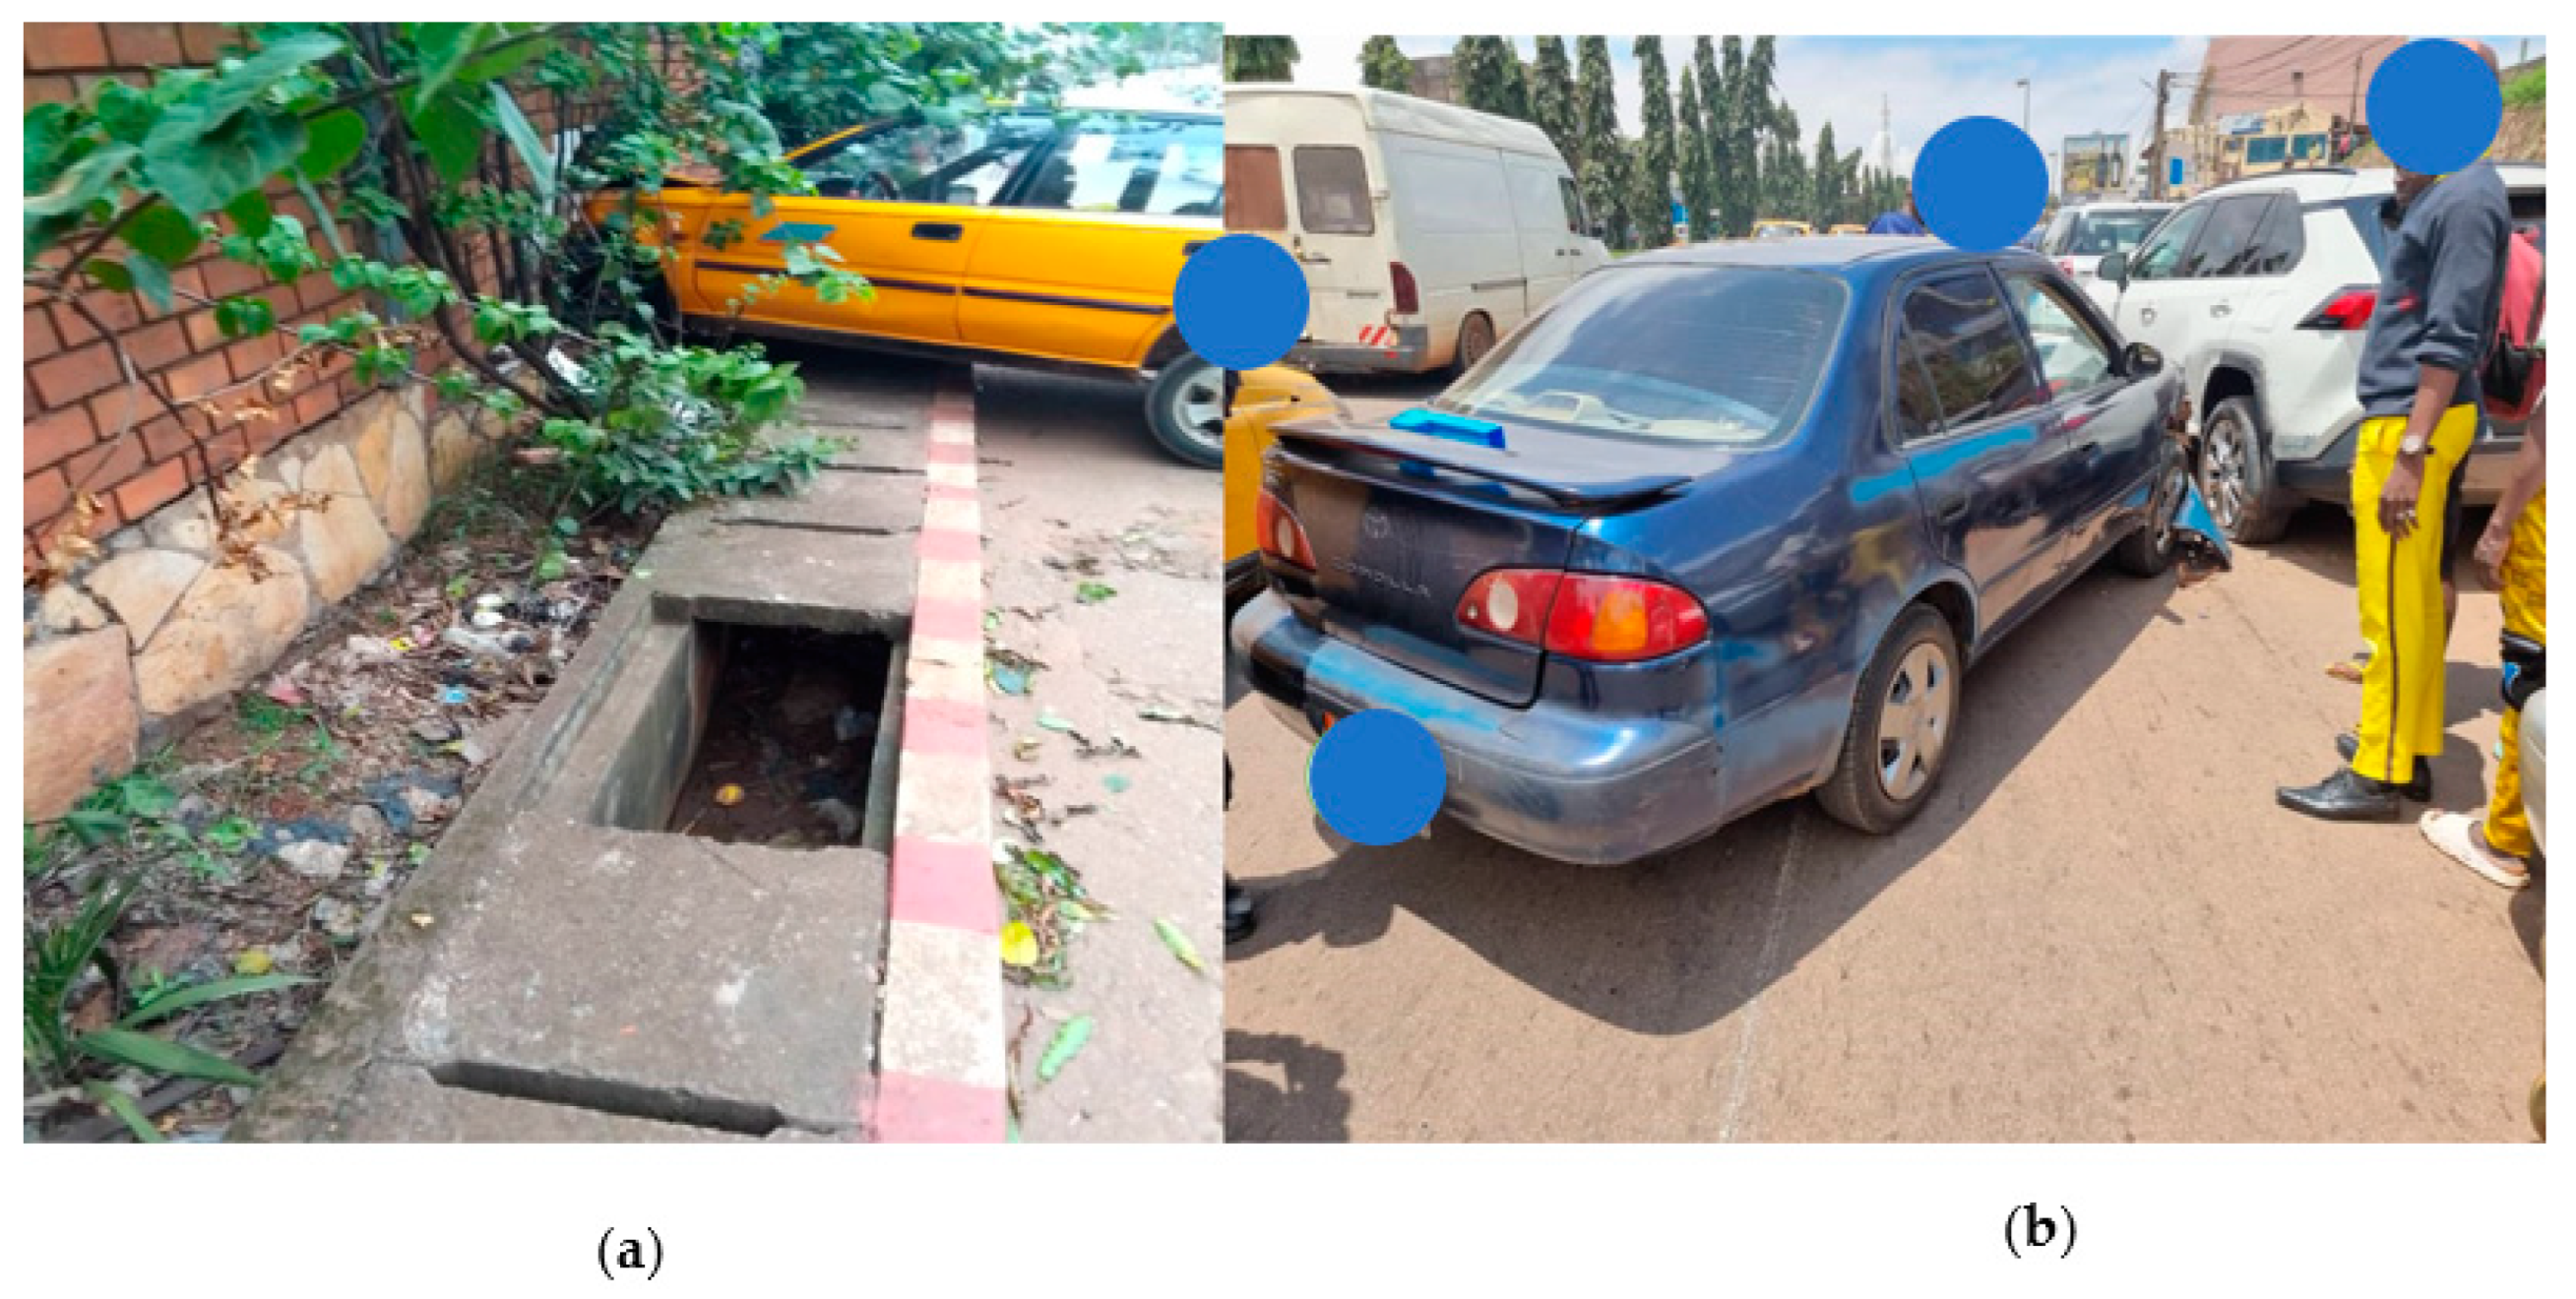
Cameroon has a national law against mobile phone-distracted driving, but there has never been a study assessing its effectiveness. However, simple movements around the city can allow one to observe that this measure is mostly not respected by drivers and law enforcement officers are not sufficiently dispatched around the city for intensive enforcement. The results of this study are clear. The weighted value of the SPIs indicated that in almost 13.69% of the vehicle-kilometers travelled on Yaoundé roads, the drivers are distracted while driving, which presents a significant threat on the roads for drivers, their passengers and other road users. Unfortunately, our observers had the opportunity to witness the direct consequence of this risky behavior. In fact, during the field observations, on two different days at two different locations, two of the drivers recorded by the observes as being distracted (mobile phone use) while driving ended up in a crash just a few seconds after crossing the observation location (by about 20 m). Fortunately, these crashes did not result in any injuries or deaths but only damage to the vehicles. Figure 10 illustrates these two unfortunate events. Apart from these two cases, there have been dozens of instances of near crashes among distracted drivers during the observation period, which further highlight the seriousness of the issues. It is important to take serious action to address these risky driving behaviors and this will require the combined efforts of various stakeholders with city officials at the center. In this view, a comprehensive distracted fighting strategy for the city of Yaoundé is proposed. The strategy spans over seven years (2024–2030) with the goal to reduce the prevalence of distracted driving by at least 50% (from 13.69 to 6.8%) by 2030. The strategy includes a comprehensive action plan composed of interventions which have been proven to be effective when properly implemented, including legislation and intensive enforcement [47], a training program to combat distracted driving [51], awareness campaigns [49,50], technological developments [53] and infrastructure changes [52]. For each intervention dimension, practical actions are proposed along with the potential stakeholders involved, but most importantly, the indicators and target values for performance monitoring over time. The complete strategy could not be included here to keep the length of this article reasonable, but Table 5 shows a glimpse of some of the proposed actions for the enforcement category. In addition to the proposed actions, which are more focused on legislation, infrastructure change, awareness campaigns and less of technological development, alternative solutions will also be explored based on similar initiatives carried out by other countries in Africa. In South Africa, initiatives like the Discovery Insure app have been promising in incentivizing safe driving behaviors, including avoiding phone use while driving. The app uses telematics to track driving habits and rewards users with points that are redeemable for discounts or vouchers. It features alerts and feedback to discourage distracted driving and promotes safer habits among drivers, leveraging smartphone technology to prioritize road safety. This approach could yield similar benefits in Yaoundé, where the use of mobile phones and access to the internet are on the rise. This could specifically be an appealing solution to youngers drivers, who may be more prone to distracted driving but are also more responsive to technology-based solutions.
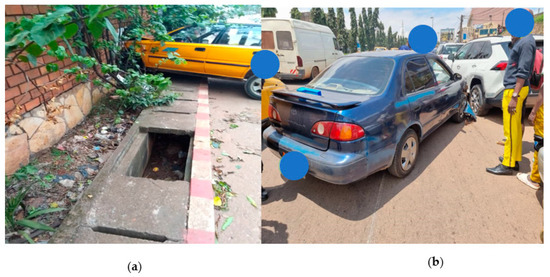
Figure 10.
Distraction (mobile phone) related crashes during field observation in two observation point: (a) Road section called Reunification, in front of the military hospital”; (b) road section called Nlongkack, in front of the ministry of decentralization and local development.

Table 5.
Some proposed actions for the enforcement category as part of the action plan of the distraction-fighting strategy for the city of Yaoundé.
It is important to highlight that the feasibility of the proposed strategy could be hindered by political barriers. As a strategy to be deployed at city level, decision makers and stakeholders’ engagement will be essential to ensure that the strategy receives the desired attention and prioritization. Road safety is part of Cameroon’s 2035 emergence plan: “Road safety, a lever for development”. Cameroon has included road safety as a key element in its strategic orientation documents for development and the fight against poverty such as Cameroon Vision 2035, Cameroon’s Strategy for Growth and Employment and Cameroon’s National Development Strategy 2020–2030 for structural transformation and inclusive development. The proposed distracted driving strategy is aligned with the overall road safety plan (2021–2025) goal of reducing road deaths and serious injuries by 50% by 2025. The country is committed to improving road safety and the next road safety plan is already under preparation, to which the proposed strategy would equally be aligned.
In addition, the city officials, who are also politicians, are intended be the leaders of the strategy, so once they commit to the strategy, it could potentially be easier to overcome unforeseen political barriers, as engaging with other city officials, decision makers or stakeholders would be easier.
However, it would also be crucial to build alliances, not only with other decision makers but also advocacy groups, and the public, to generate widespread support. It will also be important to engage directly with researchers for evidence-based support and continuous monitoring of the impact of the intervention. It will equally be important to negotiate with industries that may resist certain measures, emphasizing the societal benefits of reducing distracted driving. This comprehensive approach could potentially help to overcome or attenuate political hurdles.
Resource constraints, especially financial constraints, could equally impede the implementation of the strategy as road safety has not always been the first priority in the country. Fortunately, during recent years, and as part of the engagement of the country with global road safety agendas throughout the decade of action for road safety, considerable efforts have been put in place to allocate funds to road safety interventions. Cameroon has set up a system for backing the financing of a large proportion of road safety activities from the Road Fund budget, which is the first step towards mobilizing resources. The Road Fund has been increased its budget from 1.5% of the total to 4% to finance road safety and prevention projects. This has led to an estimated extra 2.5 billion XAF (Central African CFA Franc) between 2013 and 2019 [44]. In addition, as part of the acceleration of decentralization, there has been a drive to increase the amount of investment resources transferred to the Decentralized Territorial Authorities (DTAs), increasing their independence and their ability to plan and implement their annual programs. City officials could explore all the possibilities to fund or partially fund the distracted driving strategy after an initial resources assessment to identify specific shortages. Additional funds that are available from international aid could also be worth exploring.
Furthermore, fostering partnerships with NGOs, the private sector and other stakeholders could also share the burden of resources by creating synergies. Given the number of actions to be implemented as part of the strategy, it is likely that sufficient funds will not be readily available (or mobilized) immediately, so it would be important for city officials to engage with researchers to prioritize interventions based on cost effectiveness and impact potential.
6. Conclusions
Distracted driving is still a major concern in Yaoundé as The General Delegation for National Security (DGSN) reveals that distracted driving is the leading cause of road traffic crashes in the city. Yaoundé is the political capital of Cameroon and is known to be very bustling and busy with high levels of traffic and intense roadside activities creating an environment for drivers to be potentially distracted. In addition, there is still not a comprehensive distraction-fighting strategy that addresses the various dimensions of distraction and the existing action, in terms of enforcement operations, is very scarce, not regular and is spread over the city which encourages driver to be more confident in engaging in distracted driving. Finally, the absence of estimates for the prevalence of distracted driving in Yaoundé further hinders the possibility to grasp the extent of the issues, and to plan and implement effective road safety strategies. This study aimed to address these evidence gaps by evaluating the distraction safety performance indicator (SPI) in Yaoundé and providing recommendations to combat distracted driving.
The study was designed in accordance with international guidelines from the Baseline project, which are easily applicable in Cameroon or any other countries with a similar context. Three types of distraction were considered including interactions with passengers, eating/smoking/drinking and handheld mobile device usage. All the distraction-related data were collected during field roadside observations at 36 locations distributed over the different council and road types to ensure an even coverage of the city. The distraction SPIs or the prevalence of driver distractions were weighted with traffic volume data to ensure that they were representative of the whole city. Descriptive and association statistics were used to analyze the SPIs using various factors including the vehicle types, the road type, the age group and the gender of the driver.
A total of 41,004 drivers were observed (38,248 in car; 1116 in LGV (van); 977 in HGV (truck); and 663 in bus/coach). The weighted value of the SPIs indicated that the prevalence of distracted driving in Yaoundé is 13.69% for the three distraction types combined. The prevalence is 7.84% for interaction, 4.89% for handled mobile device usage and 0.96% for eating/smoking/drinking.Further analysis revealed that the prevalence of distracted driving was lower on tertiary roads as worse road conditions forced the drivers to be more focused on driving. The prevalence was higher during peak hours compared to off-peak hours. Finally, men were more distracted than women and the prevalence was also linked to the age group as older drivers were less distracted.
To combat distracted driving based on this evidence, a comprehensive distraction-fighting strategy for the city of Yaoundé is proposed, spanning over seven years (2024–2030) with the goal to reduce the prevalence of distracted driving by at least 50% (from 13.69 to 6.8%) by 2030 and is composed of interventions including legislation and intensive enforcement, awareness campaigns, technological developments and infrastructure changes which have been proven to be effective when properly implemented.
This study, which is the first ever in Yaoundé to the best of the authors’ knowledge, provides clear evidence of the issues caused by distracted driving using an easy-to-apply methodology.
The evidence from this study and the distraction-fighting strategy proposed could help city officials and stakeholders to take concrete action to end distracted driving in Yaoundé and save lives. This study will serve as a basis to track the effectiveness of the actions implemented in the midterm, but also as the blueprint for the application of similar investigations in other cities in Cameroon or at the national level. The findings of this study will also help to develop the new national road safety strategy since the current one does not include distracted driving, with the end objective of putting Cameroon on the track towards safer and more sustainable transport for all. Several specific recommendations for policy makers, practitioners and researchers to address the identified issues and challenges of distracted driving can also be drawn out from the findings of this study.
For policy makers, further enforcing legislation, specifically targeting distracted driving, with a focus on handheld mobile device use (not only mobile phone), allocating resources for intensive enforcement efforts, including increasing the presence of law enforcement officers on the roads for longer period of time and on multiple days of the week and considering adopting a demerit points system to deter distracted driving, similar to successful models implemented in other countries, may be viable options.
Practitioners should develop and implement training programs for law enforcement officers to effectively identify and address distracted driving behaviors, collaborate with local schools and community organizations to integrate distracted driving education into driver training programs and public outreach initiatives, and explore partnerships with technology companies to develop and deploy innovative solutions, such as mobile apps or in-vehicle technologies, to detect and discourage distracted driving, leveraging, for instance, the Discovery Insure app that is currently used in South Africa.
Researchers should conduct longitudinal studies to evaluate the long-term effectiveness of the measures implemented in reducing distracted driving and distracted driving related crashes, explore the socio-economic factors and cultural influences that contribute to distracted driving behaviors in Yaoundé and other urban areas in Cameroon and further refine the methodology considering its application in conjunction with other methods to see if coherent results are found.
If fact, one of the limitations of the study is the distracted driving data collection method. The method was roadside observations by trained observers at specific locations chosen in accordance with the international guidelines of the Baseline project which has been approved by the European Commission.
However, roadside observations at specific locations can underestimate instances of distracted driving since drivers are only observed at fixed locations. This is because it could also be possible that some drivers were not distracted when crossing the observation section, but were some meters (10 or more) before or after. This limitation provides directions for future studies. Future research could also investigate combining roadside observations with live observations from inside a moving vehicle within the traffic, to track driver distraction behavior for a longer period. Additionally, in-vehicle observations and driver surveys could also be used in conjunction with roadside observations to obtain a more comprehensive understanding of driver distraction behaviors.
Despite these limitations and future areas of potential improvement, the current study is a huge and significant contribution to enhancing the road safety situation in Yaoundé and in Cameroon.
Author Contributions
Conceptualization, Methodology, Writing—original draft preparation, S.L.T.F.; Investigation, Data curation, Formal analysis, B.J.F.T.; Writing—review and editing, S.K.F.; Methodology, Writing—review and editing, D.S.U.; Supervision, L.P. All authors have read and agreed to the published version of the manuscript.
Funding
This research received no external funding.
Institutional Review Board Statement
Not applicable.
Informed Consent Statement
Not applicable.
Data Availability Statement
The data presented in this study are available upon request.
Acknowledgments
We acknowledge the administrative support of the National Advance School of Public Works and the Center of Research for Transport and Logistics of La Sapienza University of Rome.
Conflicts of Interest
The authors declare no conflicts of interest.
References
- World Health Organization. Global Status Report on Road Safety 2023. 2023. Available online: https://www.who.int/teams/social-determinants-of-health/safety-and-mobility/global-status-report-on-road-safety-2023 (accessed on 18 February 2024).
- World Bank Group. Saving Lives through Private Investment in Road Safety. 2022. Available online: http://documents.worldbank.org/curated/en/099525002222214332/P1750030e6c58506b08d5b05ccba3311628 (accessed on 8 February 2024).
- Stutts, J.C.; Reinfurt, D.W.; Rodgman, E.A. The Role of Driver Distraction in Traffic Crashes. 2001. Available online: https://www.researchgate.net/publication/247981075_The_Role_of_Driver_Distraction_in_Traffic_Crashes (accessed on 15 February 2024).
- Wang, J.-S.; Knipling, R.R.; Goodman, M.J. The role of driver inattention in crashes: New statistics from the 1995 crashworthiness data system. In Proceedings of the 40th Annual Proceedings of the Association for the Advancement of Automotive Medicine, Vancouver, BC, Canada, 7–9 October 1996. [Google Scholar] [CrossRef]
- Mcevoy, S.P.; Stevenson, M.R.; Woodward, M. The contribution of passengers versus mobile phone use to motor vehicle crashes resulting in hospital attendance by the driver. Accid. Anal. Prev. 2007, 39, 1170–1176. [Google Scholar] [CrossRef] [PubMed]
- Hasan, A.S.; Patel, D.; Alfaris, R.; Jalayer, M. Identifying distracted-driving events from on-road observations using a moving vehicle: A case study in New Jersey. Accid. Anal. Prev. 2022, 177, 106827. [Google Scholar] [CrossRef] [PubMed]
- Stewart, T. Overview of Motor Vehicle Crashes in 2020. 2022. Available online: https://crashstats.nhtsa.dot.gov/Api/Public/Publication/813266 (accessed on 18 January 2024).
- Gjorgjievski, M.; Khanna, V.; Petrisor, B.; Li, C.S.; Ristevski, B. Roadside evaluation of distracted driving—Driver limitations in recognizing traffic light transitions (REDD—LIGHT). J. Transp. Health 2021, 21, 101059. [Google Scholar] [CrossRef]
- Boets, S. European Road Safety Observatory Road Safety Thematic Report—Driver Distraction. 2022. Available online: https://road-safety.transport.ec.europa.eu/document/download/662f244a-b3ad-442a-aa60-50f8437c86f2_en?filename=Road_Safety_Thematic_Report_Driver_Distraction_2022.pdf (accessed on 14 January 2024).
- Deng, W.; Wu, R. Real-Time Driver-Drowsiness Detection System Using Facial Features. IEEE Access 2019, 7, 118727–118738. [Google Scholar] [CrossRef]
- Ngxande, M.; Burke, M.; Tapamo, J. Driver drowsiness detection using Behavioral measures and machine learning techniques: A review of state-of-art techniques. In Proceedings of the 2017 Pattern Recognition Association of South Africa and Robotics and Mechatronics (PRASA-RobMech), Bloemfontein, South Africa, 30 November–1 December 2017. [Google Scholar] [CrossRef]
- Prat, F.; Planes, M.; Gras, M.E.; Sullman, M.J.M. An observational study of driving distractions on urban roads in Spain. Accid. Anal. Prev. 2014, 74, 8–16. [Google Scholar] [CrossRef] [PubMed]
- Chen, G.; Hong, L.; Dong, J.; Liu, P. EDDD: Event-Based Drowsiness Driving Detection Through Facial Motion Analysis with Neuromorphic Vision Sensor. IEEE Sens. J. 2020, 20, 6170–6181. [Google Scholar] [CrossRef]
- Sullman, M.J.M. An observational study of driver distraction in England. Transp. Res. Part F Psychol. Behav. 2012, 15, 272–278. [Google Scholar] [CrossRef]
- Ranney, T.A. Driver Distraction: A Review of the Current. 2008. Available online: https://www.nhtsa.gov/sites/nhtsa.gov/files/810787_0.pdf (accessed on 22 February 2024).
- Regan, M.A.; Strayer, D.L. Towards an Understanding of Driver Inattention: Taxonomy and Theory. Ann. Adv. Automot. Med. 2014, 58, 5–14. [Google Scholar] [PubMed]
- Pettitt, M.; Burnett, G.; Stevens, A. Defining Driver Distraction. In Proceedings of the 12th World Congress on Intelligent Transport Systems, San Francisco, CA, USA, 6–10 November 2005. [Google Scholar] [CrossRef]
- Beanland, V.; Fitzharris, M.; Young, K.L.; Lenné, M.G. Driver inattention and driver distraction in serious casualty crashes: Data from the Australian National Crash In-depth Study. Accid. Anal. Prev. 2013, 54, 99–107. [Google Scholar] [CrossRef]
- Young, K.L.; Salmon, P.M. Examining the relationship between driver distraction and driving errors: A discussion of theory, studies and methods. Saf. Sci. 2012, 50, 165–174. [Google Scholar] [CrossRef]
- Drews, F.A.; Pasupathi, M.; Strayer, D.L. Passenger and Cell Phone Conversations in Simulated Driving. J. Exp. Psychol. Appl. 2008, 14, 392–400. [Google Scholar] [CrossRef] [PubMed]
- Ishigami, Y.; Klein, R.M. Is a hands-free phone safer than a handheld phone? J. Saf. Res. 2009, 40, 157–164. [Google Scholar] [CrossRef]
- Consiglio, W.; Driscoll, P.; Witte, M.; Berg, W.P. Effect of cellular telephone conversations and other potential interference on reaction time in a braking response. Accid. Anal. Prev. 2003, 35, 495–500. [Google Scholar] [CrossRef]
- Caird, J.K.; Willness, C.R.; Steel, P.; Scialfa, C. A meta-analysis of the effects of cell phones on driver performance. Accid. Anal. Prev. 2008, 40, 1282–1293. [Google Scholar] [CrossRef] [PubMed]
- Beede, K.E.; Kass, S.J. Engrossed in conversation: The impact of cell phones on simulated driving performance. Accid. Anal. Prev. 2006, 38, 415–421. [Google Scholar] [CrossRef]
- Rakauskas, M.E.; Gugerty, L.J.; Ward, N.J. Effects of naturalistic cell phone conversations on driving performance. J. Saf. Res. 2004, 35, 453–464. [Google Scholar] [CrossRef] [PubMed]
- Lesch, M.F.; Hancock, P.A. Driving performance during concurrent cell-phone use: Are drivers aware of their performance decrements? Accid. Anal. Prev. 2004, 36, 471–480. [Google Scholar] [CrossRef]
- Strayer, D.L.; Drews, F.A. Profiles in driver distraction: Effects of cell phone conversations on younger and older drivers. Hum. Factors 2004, 46, 640–649. [Google Scholar] [CrossRef] [PubMed]
- Donmez, B.; Boyle, L.N.; Lee, J.D.; City, I. The Impact of Distraction Mitigation Strategies on Driving Performance. Hum. Factors 2006, 48, 785–804. [Google Scholar] [CrossRef]
- Bunn, T.L.; Slavova, S.; Struttmann, T.W.; Browning, S.R. Sleepiness/fatigue and distraction/inattention as factors for fatal versus nonfatal commercial motor vehicle driver injuries. Accid. Anal. Prev. 2005, 37, 862–869. [Google Scholar] [CrossRef]
- Hancock, P.A.; Lesch, M.; Simmons, L. The distraction effects of phone use during a crucial driving maneuver. Accid. Anal. Prev. 2003, 35, 501–514. [Google Scholar] [CrossRef] [PubMed]
- Neyens, D.M.; Boyle, L.N. The influence of driver distraction on the severity of injuries sustained by teenage drivers and their passengers. Accid. Anal. Prev. 2008, 40, 254–259. [Google Scholar] [CrossRef]
- McEvoy, S.P.; Stevenson, M.R.; Woodward, M. The prevalence of, and factors associated with, serious crashes involving a distracting activity. Accid. Anal. Prev. 2007, 39, 475–482. [Google Scholar] [CrossRef]
- Hunton, J.; Rose, J.M. Cellular telephones and driving performance: The effects of attentional demands on motor vehicle crash risk. Risk Anal. 2005, 25, 855–866. [Google Scholar] [CrossRef]
- Mcgarva, A.R.; Ramsey, M.; Shear, S.A. Effects of driver cell-phone use on driver aggression. J. Soc. Psychol. 2006, 146, 133–146. [Google Scholar] [CrossRef]
- Braitman, K.A.; Braitman, A.L. Patterns of distracted driving behaviors among young adult drivers: Exploring relationships with personality variables. Transp. Res. Part F Traffic Psychol. Behav. 2017, 46, 169–176. [Google Scholar] [CrossRef]
- Dingus, T.A.; Guo, F.; Lee, S.; Antin, J.F.; Perez, M.; Buchanan-King, M.; Hankey, J. Driver crash risk factors and prevalence evaluation using naturalistic driving data. Proc. Natl. Acad. Sci. USA 2016, 113, 2636–2641. [Google Scholar] [CrossRef]
- Kircher, K. Driver Distraction—A Review of the Literature (VTI Rapport 594A). 2007, p. 64. Available online: http://www.erskine-mcmahon.com/files/cell.phone.driving.distraction.article.10.pdf (accessed on 25 November 2023).
- Salamé, R. Les sources de distraction au volant et leur dangerosité: Enquête auprès des membres de la communauté universitaire de l’Université Saint-Joseph de Beyrouth. Rech. Transp. Secur. 2015, 2015, 199–210. [Google Scholar] [CrossRef]
- Harms, I.M.; Dicke, M.; Rypkema, J.A.; Brookhuis, K.A. Position Paper. Verkeersveilig Gebruik van Smart Devices én Smart Mobility Toegang tot Smart Mobility-Diensten met Aandacht voor het Verkeer. 2017. Available online: https://verkeersveiligheidscoalitie.nl/wp-content/uploads/2018/09/CommunitySP-HB_2017_Position-paper-Verkeersveilig-gebruik-van-Smart-Mob....pdf (accessed on 5 September 2023).
- Katharina, A.; Schumacher, M.; Mennecke, M.; Vollrath, M. Systematic review of observational studies on secondary task engagement while driving. Accid. Anal. Prev. 2018, 119, 225–236. [Google Scholar] [CrossRef]
- Overton, T.L.; Rives, T.E.; Hecht, C.; Shafi, S.; Rajesh, R. Distracted driving: Prevalence, problems, and prevention. Int. J. Inj. Contr. Saf. Promot. 2015, 22, 187–192. [Google Scholar] [CrossRef]
- Pires, C.; Areal, A.; Trigoso, J. Distraction (Mobile Phone Use). ESRA2 Thematic Report Nr. 3. ESRA Project (E-Survey of Road Users’ Attitudes). 2019. Available online: https://www.esranet.eu/storage/minisites/esra2018thematicreportno3distraction.pdf (accessed on 12 February 2024).
- United Nations Economic Commission for Africa. Etude de cas sur la Securite Routiere au Cameroun. 2010. Available online: https://repository.uneca.org/bitstream/handle/10855/41496/Bib47884.pdf?sequence=1&isAllowed=y (accessed on 18 February 2024).
- United Nations Economic Commission for Africa. Évaluation de la Performance en matièRe de séCurité Routière (EPSR). 2018. Available online: https://unece.org/fr/transport/publications/evaluation-de-la-performance-en-matiere-de-securite-routiere-epsr-cameroun (accessed on 18 January 2024).
- Dingus, T.A. Estimates of Prevalence and Risk Associated with Inattention and Distraction Based Upon In Situ Naturalistic Data. Ann. Adv. Automot. Med. 2014, 58, 60–68. [Google Scholar] [PubMed]
- Mccartt, A.T.; Hellinga, L.A.; Bratiman, K.A. Cell Phones and Driving: Review of Research. Traffic Inj. Prev. 2007, 7, 89–106. [Google Scholar] [CrossRef] [PubMed]
- Olsson, B.; Pütz, H.; Reitzug, F.; Humphreys, D.K. Evaluating the impact of penalising the use of mobile phones while driving on road traffic fatalities, serious injuries and mobile phone use: A systematic review. Inj. Prev. 2020, 26, 378–385. [Google Scholar] [CrossRef] [PubMed]
- Kończak, S. Handhaving van het Verbod op Handheld Telefoongebruik Ongevallen Voorkomen Letsel Beperken Levens Redden. 2020. Available online: https://swov.nl/nl/publicatie/handhaving-van-het-verbod-op-handheld-telefoongebruik (accessed on 18 February 2024).
- Vlakveld, W.P. Maatregelen tegen Afleiding bij Automobilisten Ongevallen Voorkomen Letsel Beperken Levens Redden. 2018. Available online: https://swov.nl/nl/publicatie/maatregelen-tegen-afleiding-bij-automobilisten (accessed on 18 February 2024).
- Kaiser, S.; Breuss, A. Effectiveness of Road Safety Campaigns, European Road Safety Decision Support System, Developed by the H2020 Project SafetyCube. 2017. Available online: https://www.roadsafety-dss.eu/assets/data/pdf/synopses/Effectiveness_of_Road_Safety_Campaigns_26072017.pdf (accessed on 8 January 2024).
- Huang, Y.; Zohar, D.; Robertson, M.M.; Garabet, A.; Lee, J.; Murphy, L.A. Development and validation of safety climate scales for lone workers using truck drivers as exemplar. Transp. Res. Part F Psychol. Behav. 2013, 17, 5–19. [Google Scholar] [CrossRef]
- Weekley, J.; Helman, S. Minimising Distraction from Roadside Advertising Recommendations for Road Authorities CEDR Call 2016: Safety. 2019. Available online: https://www.cedr-adverts.eu/storage/minisites/d2-1-adverts-recommendations-final.pdf (accessed on 18 February 2024).
- Vlakveld, W.P. Veiligheidseffecten van Rijtaakondersteunende Systemen. 2019. Available online: https://swov.nl/nl/publicatie/veiligheidseffecten-van-rijtaakondersteunende-systemen (accessed on 18 February 2024).
- Claveria, J.B.; Hernandez, S.; Anderson, J.C.; Jessup, E.L. Understanding truck driver behavior with respect to cell phone use and vehicle operation. Transp. Res. Part F Psychol. Behav. 2019, 65, 389–401. [Google Scholar] [CrossRef]
- Hasan, A.S.; Jalayer, M.; Heitmann, E.; Weiss, J. Distracted Driving Crashes: A Review on Data Collection, Analysis, and Crash Prevention Methods. Transp. Res. Rec. 2022, 2676, 423–434. [Google Scholar] [CrossRef]
- Asbridge, M.; Brubacher, J.R.; Chan, H. Cell phone use and traffic crash risk: A culpability analysis. Int. J. Epidemiol. 2013, 42, 259–267. [Google Scholar] [CrossRef] [PubMed]
- Reagan, I.J.; Cicchino, J.B. Do Not Disturb While Driving—Use of cellphone blockers among adult drivers. Saf. Sci. 2020, 128, 104753. [Google Scholar] [CrossRef]
- Shevlin, B.R.K.; Goodwin, K.A. Past behavior and the decision to text while driving among young adults. Transp. Res. Part F Traffic Psychol. Behav. 2019, 60, 58–67. [Google Scholar] [CrossRef]
- Engelberg, J.K.; Hill, L.L.; Rybar, J.; Styer, T. Distracted driving behaviors related to cell phone use among middle-aged adults. J. Transp. Health 2015, 2, 434–440. [Google Scholar] [CrossRef]
- Stutts, J.; Feaganes, J.; Reinfurt, D.; Rodgman, E.; Hamlett, C.; Gish, K.; Staplin, L. Driver’s exposure to distractions in their natural driving environment. Accid. Anal. Prev. 2005, 37, 1093–1101. [Google Scholar] [CrossRef]
- Huisingh, C.; Griffin, R.; Science, T. The prevalence of distraction among passenger vehicle drivers: A roadside observational approach. Traffic Inj. Prev. 2016, 16, 140–146. [Google Scholar] [CrossRef]
- Vollrath, M.; Huemer, A.K.; Teller, C.; Likhacheva, A.; Fricke, J. Do German drivers use their smartphones safely?—Not really! Accid. Anal. Prev. 2016, 96, 29–38. [Google Scholar] [CrossRef]
- Johnson, M.B.; Voas, R.B.; Lacey, J.H.; McKnight, A.S.; Lange, J.E. Living Dangerously: Driver Distraction at High Speed. Traffic Inj. Prev. 2004, 5, 1–7. [Google Scholar] [CrossRef]
- Sagberg, F.; Johansson, O.J.; Sundfør, H.B. Combining roadside interviews and on-road observation for assessing prevalence of driver inattention. Transp. Res. Part F Traffic Psychol. Behav. 2019, 62, 305–315. [Google Scholar] [CrossRef]
- European Commission. Baseline Policy Report. Conclusions and Recommendations. 2023. Available online: https://www.baseline.vias.be/storage/minisites/baseline-policy-report-digital-1.pdf (accessed on 14 February 2024).
- Boets, S.; Wardenier, N.; Moreau, N.; De Roeck, M. Deuxième Mesure Nationale de Comportement «Distraction au Volant». 2023. Available online: https://www.vias.be/publications/2de%20nationale%20gedragsmeting%20afleiding%20tijdens%20het%20rijden/2eme_mesure_de_comportement_distraction_au_volant.pdf (accessed on 5 September 2023).
- Tuekam-Bopda, E.E.; Tamba, J.G.; Fopah-Lele, A. Impacts of mobile phone use while driving on the performance of petroleum product drivers in Cameroon. Transp. Saf. Environ. 2023, 5, 1–10. [Google Scholar] [CrossRef]
- Arrey, O.M.; Ndifontiayong, A.N. Prevalence and Risk Factors Associated with Road Traffic Crash among Bus Drivers in the Southern Region of Cameroon: A Cross Sectional Study. Austin J. Public Health Epidemiol. 2023, 10, 1148. [Google Scholar] [CrossRef]
- Padison, N.; Tiafack, O. Atmosphere of Accidents along the Douala-Yaounde National Road in Cameroon: Hoofmarks, Drivers, Challenges and Proactive Options. J. Transp. Technol. 2022, 12, 323–345. [Google Scholar] [CrossRef]
- General Delegation for National Security. Usage du Téléphone au Volant Comme Deuxième Principale Cause d’Accidents de la Circulation; General Delegation for National Security: Yaounde, Cameroon, 2020. [Google Scholar]
- Bachmann, C.; Cabera, J.; Crochet, C.; Maingret, S.; Fallous, C.; Zegha, A.; Ferro, P.S. Plan de Mobilité Urbaine Soutenable pour la Communauté Urbaine Rapport de de Yaoundé synthèse. 2019. Available online: https://www.mobiliseyourcity.net/sites/default/files/2020-01/PMUS%20Yaound%C3%A9%20-%20Septembre%202019.pdf (accessed on 5 February 2024).
- Boets, S.; Schumacher, M.; Agnieszka, S. Methodological Guidelines—KPI Distraction. 2021. Available online: https://baseline.vias.be/storage/minisites/methodological-guidelines-kpi-distraction.pdf (accessed on 4 February 2024).
- Vollrath, M.; Schumacher, M.; Boets, S.; Meesmann, U. Guidelines for Assessing the Prevalence of Mobile Phone Use in Traffic. 2019. Available online: https://fersi.org/wp-content/uploads/2019/11/Guidelines-prevalence-mobile-phone-use.pdf (accessed on 11 September 2023).
- Hazra, A. Using the confidence interval confidently. J. Thorac. Dis. 2017, 9, 4125–4130. [Google Scholar] [CrossRef]
- Binda, P.; Muronga, K. Distracted driver behaviour in south african townships: A roadside observation study. In Proceedings of the 38th Annual Southern African Transport Conference 2019, Pretoria, South Africa, 8–11 July 2019; Available online: https://repository.up.ac.za/handle/2263/74254 (accessed on 18 February 2024).
- Silverans, P.; Boets, S. Considerations for Sampling Weights in Baseline. 2021. Available online: https://baseline.vias.be/storage/minisites/baseline-considerations-for-sampling-weights.pdf (accessed on 18 September 2023).
- Kuete, Y.M. Framing the Change: Analysing Employment Change, (In)adequacy, and (De)feminization in Cameroon’s Tertiary Firms; The United Nations University World Institute for Development Economics Research (UNU-WIDER): Helsinki, Finland, 2023. [Google Scholar] [CrossRef]
- Boets, S. Baseline Report on the KPI Distraction. 2023. Available online: https://baseline.vias.be/storage/minisites/baseline-kpi-distraction.pdf (accessed on 18 September 2023).
Disclaimer/Publisher’s Note: The statements, opinions and data contained in all publications are solely those of the individual author(s) and contributor(s) and not of MDPI and/or the editor(s). MDPI and/or the editor(s) disclaim responsibility for any injury to people or property resulting from any ideas, methods, instructions or products referred to in the content. |
© 2024 by the authors. Licensee MDPI, Basel, Switzerland. This article is an open access article distributed under the terms and conditions of the Creative Commons Attribution (CC BY) license (https://creativecommons.org/licenses/by/4.0/).

