
Article

Comparative Analysis of Feature Extraction Methods for ECG Arrhythmia Classification Using Ensemble Learning

by
Victor Adeleye
1,* and
Mahmoud Elbattah
2,3,*
1
Department of Engineering & Computing, School of Architecture, Computing and Engineering, University of East London, London E16 2RD, UK
2
College of Arts, Technology and Environment, University of the West of England, Bristol BS16 1QY, UK
3
Laboratoire Modélisation Information Systèmes (MIS), University of Picardie Jules Verne, 80000 Amiens, France
*
Authors to whom correspondence should be addressed.
BioMedInformatics 2026, 6(3), 33; https://doi.org/10.3390/biomedinformatics6030033
Submission received: 9 April 2026 / Revised: 12 May 2026 / Accepted: 18 May 2026 / Published: 27 May 2026

Abstract

Electrocardiogram (ECG) arrhythmia classification remains critical for automated cardiac diagnosis, yet feature extraction methods are frequently adopted without systematic comparative evaluation. This study presents a controlled comparative analysis of four signal processing techniques—Mel-Frequency Cepstral Coefficients (MFCC), Discrete Wavelet Transform (DWT), Hilbert–Huang Transform (HHT), and Synchrosqueezing Wavelet Transform (SSWT)—for ECG feature extraction. Using the MIT-BIH Arrhythmia Database with ANSI/AAMI EC57:1998 standard mapping, we trained Cascade Forest classifiers on each feature set under identical preprocessing and SMOTE-based class balancing conditions to ensure a fair comparison. DWT features achieved superior performance (accuracy: 98.79%, macro-F1: 92.93%, precision: 94.39%) compared to MFCC (88.30% macro-F1), SSWT (84.54% macro-F1), and HHT (83.59% macro-F1), particularly for clinically challenging minority arrhythmia classes. However, DWT’s performance advantage incurred substantial computational cost (10,050 s), while MFCC provided competitive results with a 62% lower computational burden. These findings provide evidence-based guidance for feature extraction method selection in interpretable ECG classification systems, demonstrating critical performance-efficiency trade-offs relevant to clinical deployment contexts.

1. Introduction

Cardiovascular diseases remain the leading cause of global mortality, accounting for approximately 18 million deaths annually [1]. Among these, cardiac arrhythmias constitute a major clinical concern requiring accurate and timely diagnosis to prevent adverse outcomes. Electrocardiography (ECG) is the primary non-invasive diagnostic tool for arrhythmia detection; however, manual interpretation is labour-intensive, dependent on specialist expertise, and impractical for large-scale or continuous monitoring, particularly in resource-constrained healthcare settings [2]. Consequently, automated ECG arrhythmia classification has emerged as a critical research area, with machine learning techniques demonstrating strong potential for improving diagnostic consistency and efficiency [3].
Most automated ECG classification systems adopt a two-stage framework consisting of feature extraction from raw ECG signals, followed by machine learning-based classification. Although recent deep learning approaches achieve high accuracy through end-to-end learning [4,5], their limited interpretability and “black-box” nature present substantial barriers to clinical trust, regulatory approval, and deployment in safety-critical medical environments [6,7]. In contrast, feature-based approaches combined with interpretable classifiers retain transparency and clinical plausibility, making them attractive for real-world implementation. However, despite the extensive use of diverse signal processing techniques for ECG feature extraction, systematic and controlled comparisons of these methods remain largely absent.
ECG arrhythmia classification methodologies have evolved substantially over recent decades, progressing from rule-based expert systems to sophisticated machine learning approaches. Classical time-domain explicit feature engineering captures clinically meaningful characteristics such as P-wave morphology, QRS complex duration, RR interval and heart rate variability [8]. On the other hand are the frequency-domain techniques (as in the Fourier transform) that expand the feature space beyond temporal characteristics, enabling spectral decomposition of ECG signals and exposing frequency content potentially indicative of specific arrhythmia types, though their assumption of signal stationarity limits effectiveness for non-stationary ECG dynamics [9].
Recognition of the single-domain technique motivated the development of time-frequency analysis methods providing joint temporal and spectral resolution. Wavelet transforms emerged as particularly influential, offering multi-resolution analysis capabilities well-suited to ECG characteristics [9]. The Discrete Wavelet Transform (DWT) decomposes signals into approximation and detail coefficients at multiple scales, enabling capture of both rapid QRS complex features and slower P-wave and T-wave components. Ref. [10] recently demonstrated that DWT features combined with cascade forest classification achieved 98.55% accuracy on MIT-BIH data, approaching deep learning performance while maintaining interpretability. Advanced wavelet variants, such as the Synchrosqueezing Wavelet Transform (SSWT), refine standard wavelet analysis by reallocating energy along instantaneous frequency ridges, producing sharper time-frequency representations. Refs. [11,12] applied synchrosqueezing to ECG beat classification, demonstrating improved feature resolution compared to conventional wavelets. However, this enhanced resolution incurs substantial computational cost, with limited investigation of performance-efficiency trade-offs. The Hilbert–Huang Transform (HHT) represents an alternative adaptive approach, employing Empirical Mode Decomposition (EMD) to extract data-driven Intrinsic Mode Functions (IMFs) without predetermined basis functions. Refs. [13,14] successfully applied HHT for myocardial ischaemia detection in resting ECG, demonstrating its capacity for analysing non-linear, non-stationary cardiac signals. The adaptive nature theoretically suits HHT for capturing diverse arrhythmia patterns, though systematic comparative evaluation against wavelet methods remains limited.
In parallel, Mel-Frequency Cepstral Coefficients (MFCC), originally developed for speech recognition, have been adapted for biomedical signal processing, including ECG analysis [15]. MFCC applies perceptually motivated frequency warping via mel-scale filterbanks, concentrating signal energy into fewer coefficients. It has achieved high accuracy when incorporated in deep learning ECG classifiers [16]. MFCC’s suitability for ECG signals is fundamentally different from speech in their generative mechanisms and clinical interpretation requirements, which remain theoretically questionable despite empirical success in some studies.
Despite the availability of these diverse feature extraction approaches, existing studies typically vary multiple experimental factors simultaneously, including datasets, preprocessing pipelines, classification models, and evaluation metrics. This confounding of variables prevents meaningful attribution of performance differences to feature extraction methods themselves. While individual studies frequently report high classification accuracy using specific techniques, and several reviews summarise methodological trends [8,9], direct head-to-head evaluations under controlled conditions remain scarce. As shown in Table 1, existing ECG arrhythmia classification studies predominantly focus on single-feature extraction techniques or combine multiple feature methods with different classifiers and datasets. This lack of controlled experimental design obscures the true impact of feature representation on classification performance and motivates the need for systematic benchmarking. As a result, researchers lack evidence-based guidance for selecting feature extraction methods that balance classification performance, interpretability, and computational efficiency.
This study addresses this gap through a systematic comparative evaluation of four representative feature extraction techniques spanning frequency and time-frequency domains: MFCC, DWT, HHT, and SSWT. To isolate the impact of feature representation, all experiments are conducted under identical conditions using the MIT-BIH Arrhythmia Database, standardised preprocessing procedures, a unified Cascade Forest classification architecture, consistent class balancing via SMOTE, and macro-averaged performance metrics emphasising minority arrhythmia detection.
Our investigation addresses three specific research questions: RQ1: Which signal processing method provides optimal feature representations for ECG arrhythmia classification under controlled conditions? RQ2: What are the computational efficiency trade-offs (in terms of total execution time and feature dimensionality) across feature extraction methods, and how much macro-F1 score reduction must be accepted when prioritising computational efficiency over maximum performance? RQ3: Do performance differences vary systematically across arrhythmia classes with different clinical characteristics?
The contributions of this study include: (1) systematic determination of the feature extraction method that yields optimal ECG arrhythmia classification performance under controlled experimental conditions; (2) quantitative analysis of trade-offs between predictive accuracy and computational efficiency across methods; and (3) class-specific performance evaluation for clinically challenging arrhythmia types. Finally, by employing Cascade Forest classifiers rather than deep neural networks, we maintain interpretability advantages essential for clinical adoption. This research provides the first controlled benchmarking of these widely used feature extraction techniques, integrated analysis of performance and execution cost, and practical guidance for interpretable ECG classification system design.

2. Materials and Methods

2.1. Dataset and Experimental Design

This study employed the MIT-BIH Arrhythmia Database, a widely recognised benchmark comprising 48 half-hour ambulatory ECG recordings from 47 subjects [18]. Signals were digitised at 360 Hz with 11-bit resolution over a 10 mV range. The modified limb lead II (MLII) channel was selected for its optimal P-QRS-T waveform visualisation, consistent with standard clinical practice and previous benchmarking studies [10].
Beat annotations followed the ANSI/AAMI EC57:1998 standard for arrhythmia detector evaluation, mapping original beat labels into five clinically significant superclasses, as shown in Table 2 below [19,20]. This standardised mapping facilitates comparison with prior literature while addressing clinically relevant diagnostic categories.
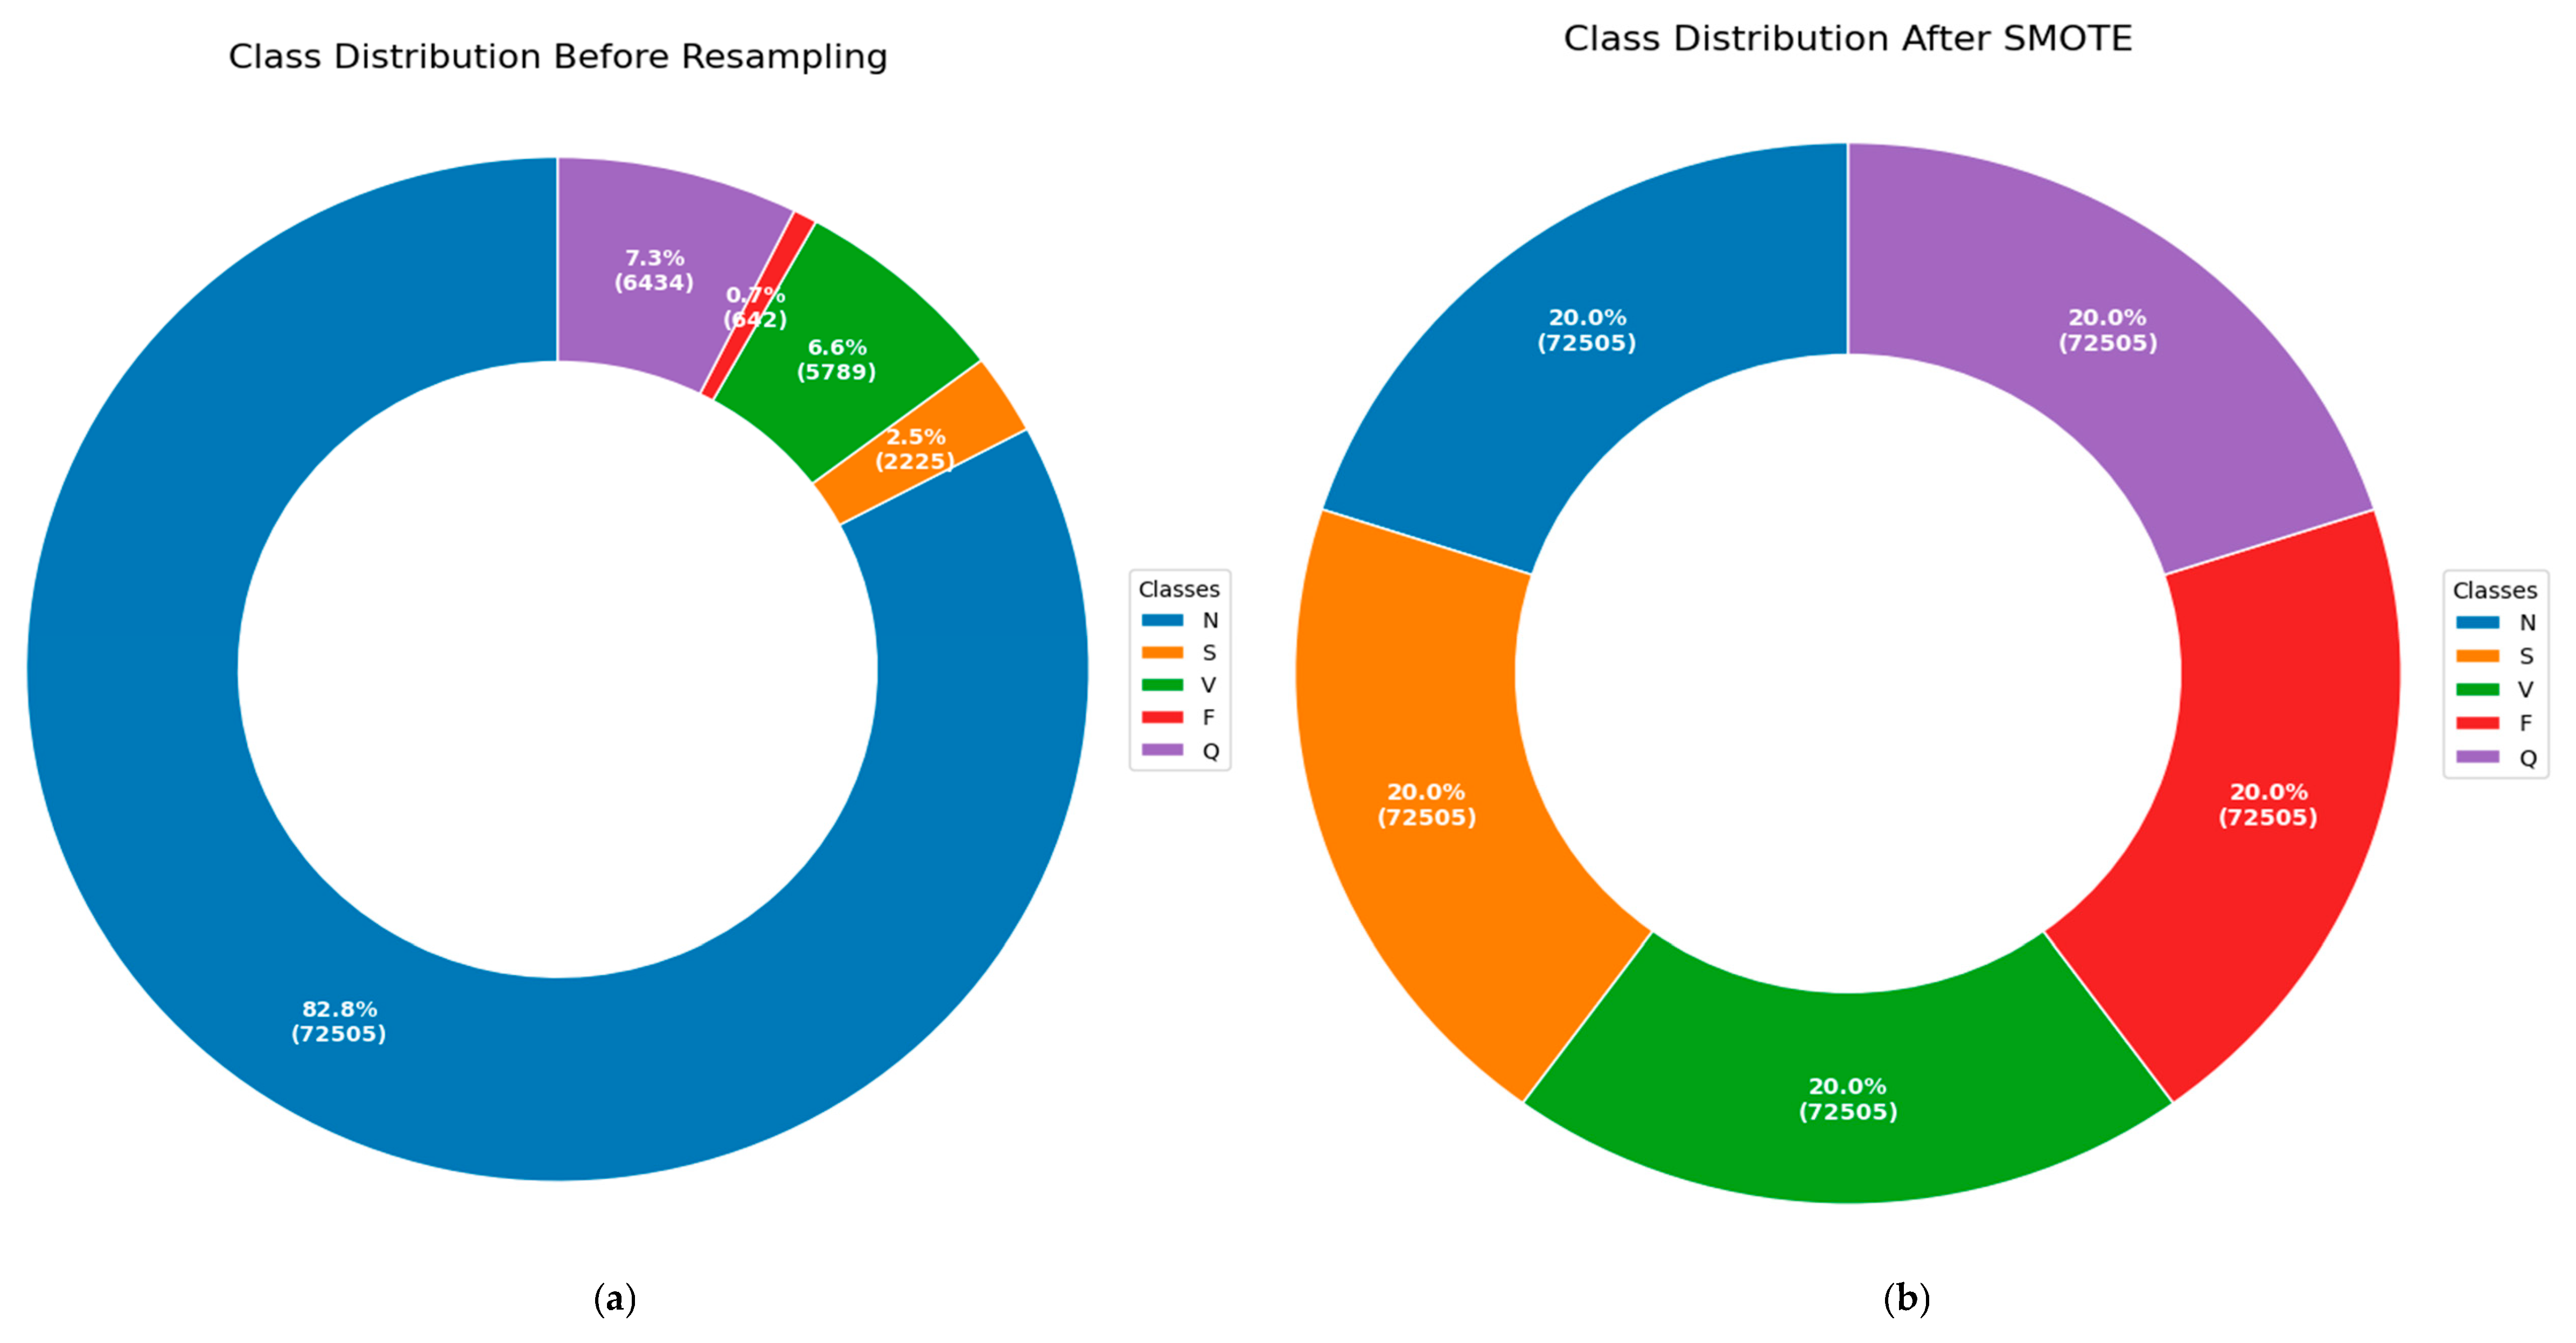
The complete dataset comprised 109,494 annotated beats, exhibiting substantial class imbalance: normal beats dominated with 82.8% representation, while minority classes showed limited samples (S: 2.5%, V: 6.6%, F: 0.4%, Q: 7.3%). This imbalance reflects realistic clinical data distributions where pathological events occur less frequently than normal cardiac activity, necessitating careful evaluation design emphasising minority class performance.
The experimental design involved data loading, signal preprocessing, feature extraction, classification, and evaluation, as shown in Figure 1. The code is publicly available at https://github.com/victormayowa/deepFECG/tree/main/deep_fecg_research.

2.2. Signal Preprocessing Pipeline

A multi-stage preprocessing pipeline ensured consistent signal quality across all experimental conditions while preserving clinically relevant morphological features. Wavelet-based denoising was applied using the Daubechies 6 (db6) wavelet, selected for its morphological similarity to QRS complexes. Decomposition proceeded to level 6, with thresholding applied to high-frequency detail coefficients (D5, D6) and approximation coefficients (A6) set to zero. Signal reconstruction via inverse DWT produced denoised signals with preserved fiducial points while removing baseline wander, powerline interference, and electromyographic artefacts.
Following denoising, we applied Z-score normalisation to each complete 30-min recording, computing the global mean (μ) and standard deviation (σ) across all samples. Each sample xi was transformed according to zi = (xi − μ)/(σ + ε), where ε = 10−8 provides numerical stability. This normalisation addresses inter-patient and intra-patient amplitude variations arising from factors including electrode placement, body habitus, and individual physiology, without distorting fundamental waveform morphology.
For each annotated beat, we extracted a 180-sample window (500 ms at 360 Hz) centred on the R-peak annotation. This window duration captures complete P-QRS-T complexes, including preceding and succeeding baseline segments, providing complete cardiac cycle information necessary for accurate arrhythmia classification.

2.3. Feature Extraction Methods

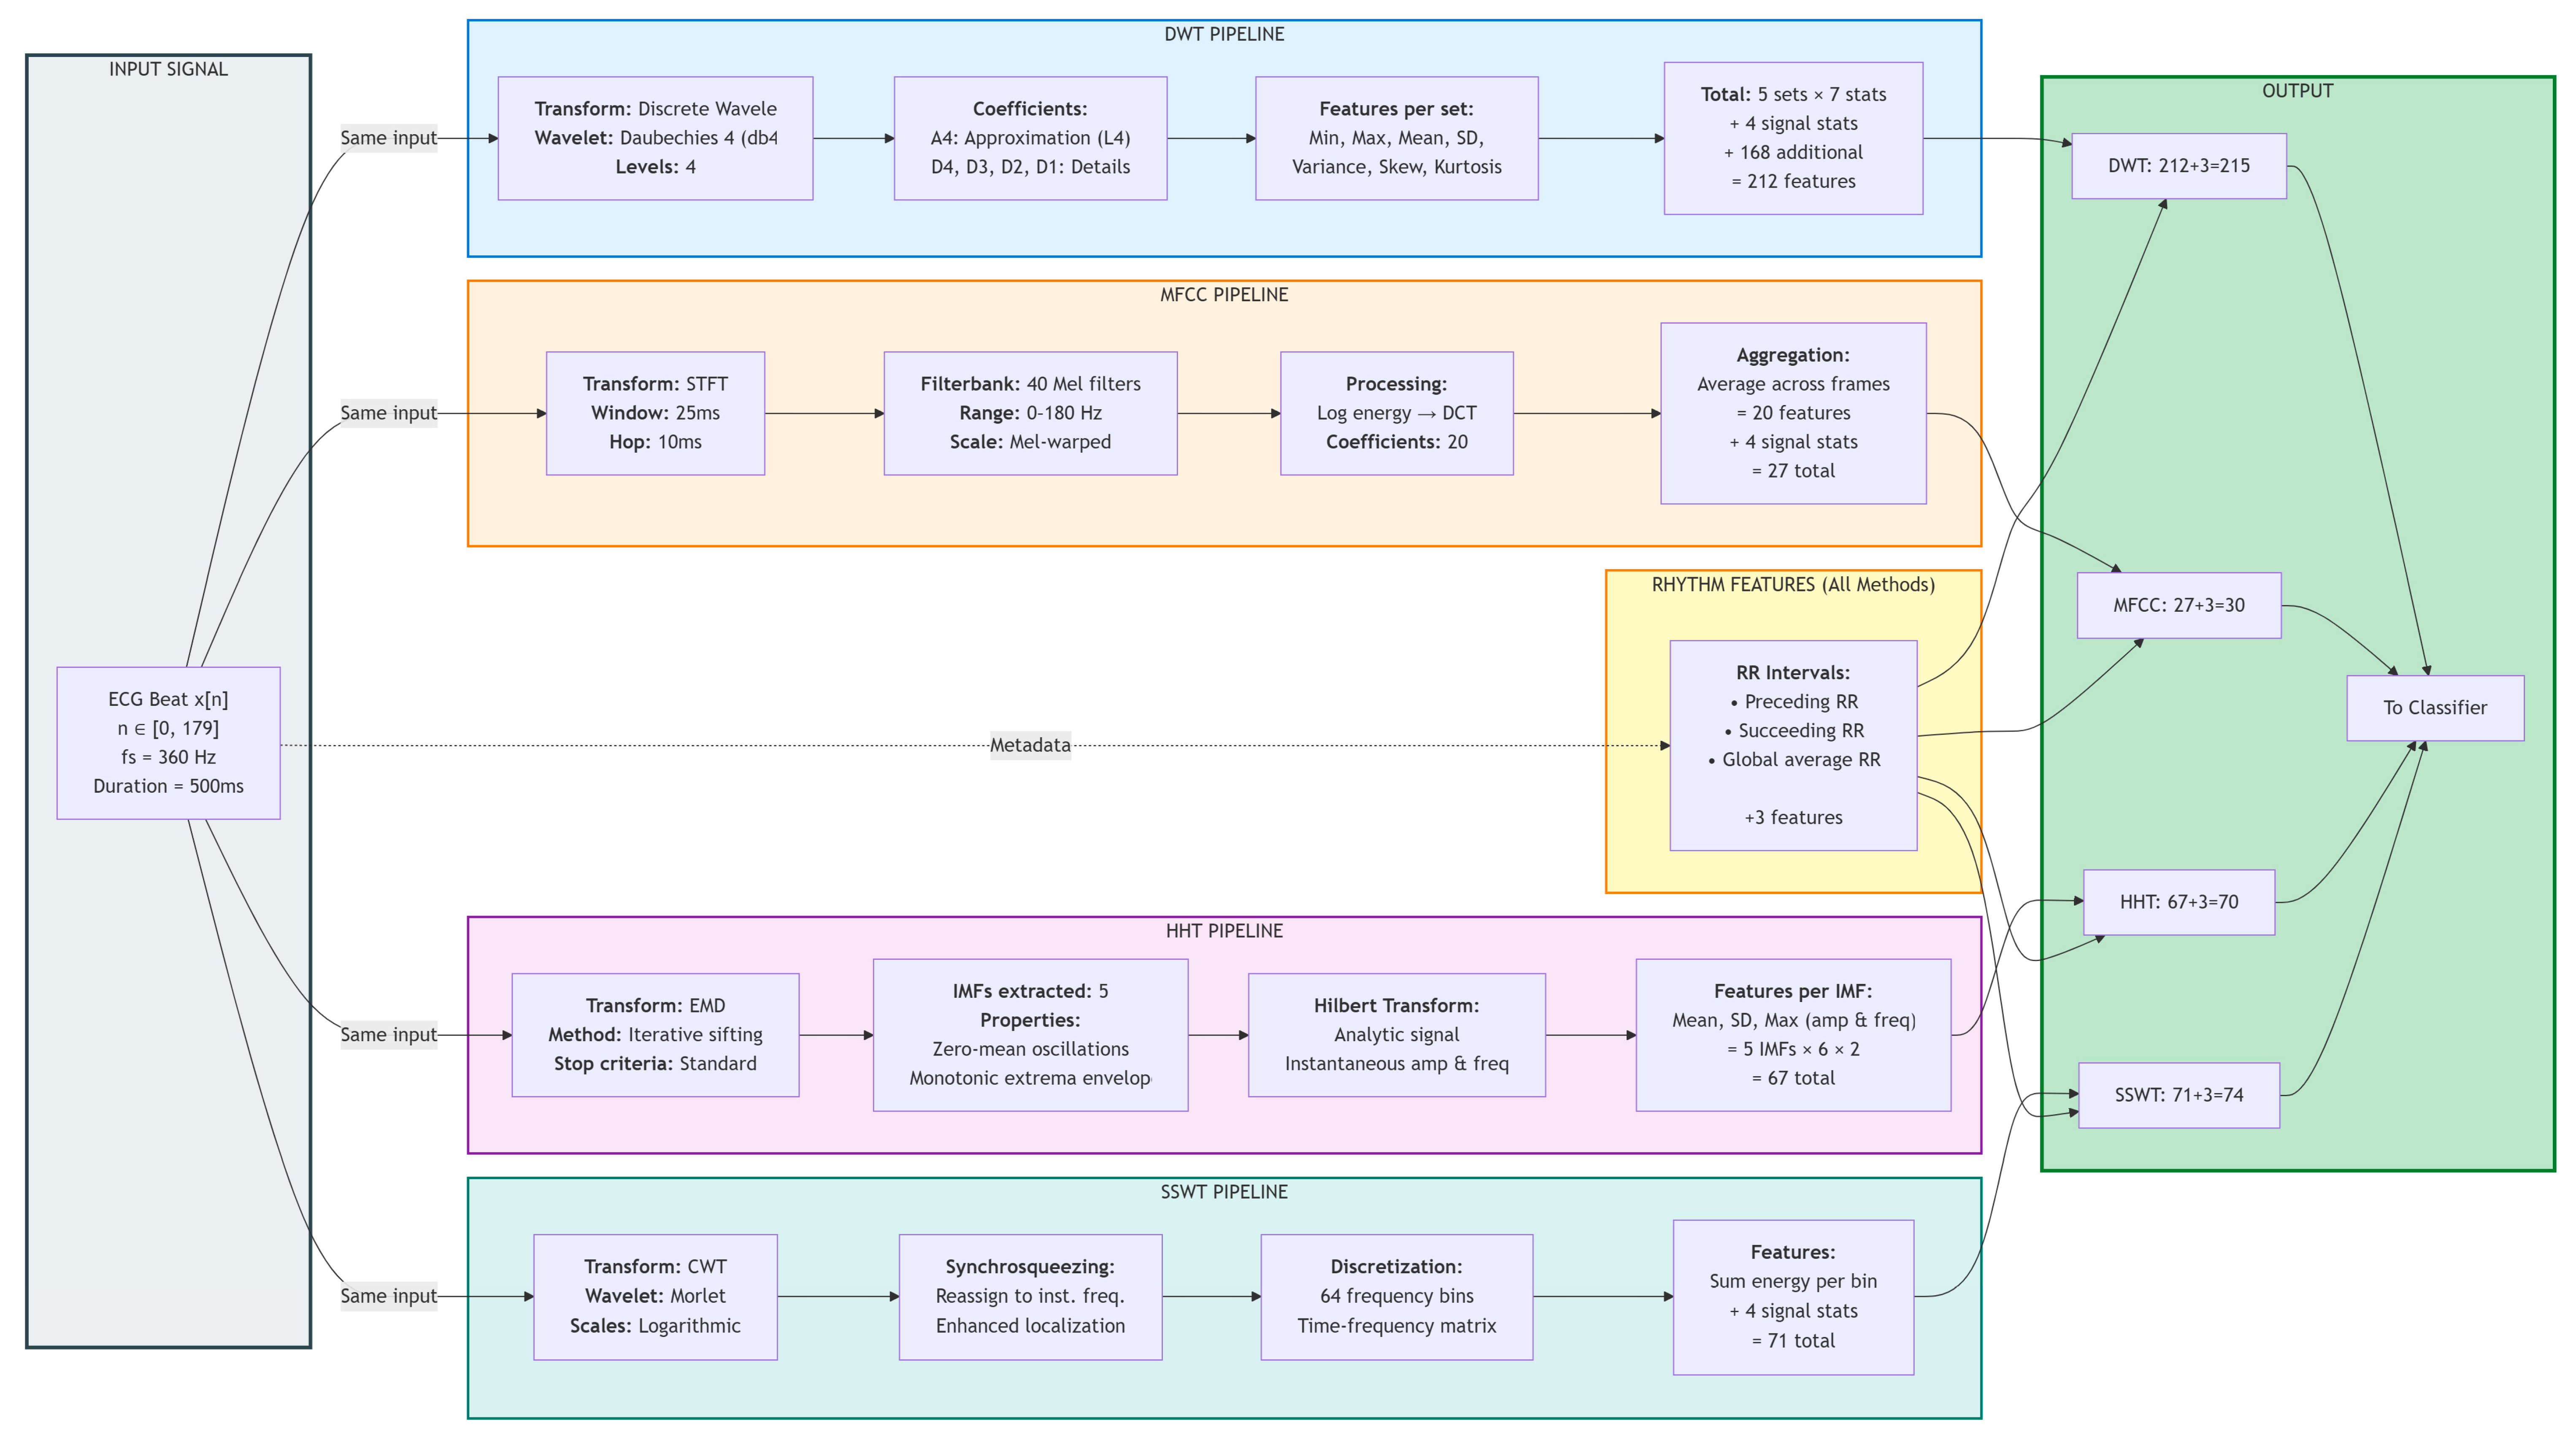
We implemented four distinct feature extraction methods representing diverse signal processing paradigms (Figure 2). All implementations produced feature vectors augmented by three temporal rhythm features—preceding RR interval, succeeding RR interval, and global average RR interval—which capture heart rate dynamics known to be clinically relevant for arrhythmia discrimination [21].

2.3.1. Discrete Wavelet Transform (DWT)

DWT decomposes signals via iterative filtering using high-pass filters h[n] for detail coefficients and low-pass filters g[n] for approximation coefficients:
Dj[k] = Σn x[n] · hj[2k − n]
  Aj[k] = Σn x[n] · gj[2k − n]
The Daubechies 4 (db4) wavelet with decomposition to level 4 was selected based on prior successful applications in ECG analysis [10]. Statistical descriptors (minimum, maximum, mean, standard deviation, variance, skewness, kurtosis) were computed across all approximation and detail coefficient arrays, yielding 205 wavelet-domain features. Combined with 3 RR interval features and 4 additional statistical descriptors of the raw signal, the total DWT feature vector comprised 212 elements.

2.3.2. Mel-Frequency Cepstral Coefficients (MFCC)

MFCC extraction followed standard speech processing protocols adapted for ECG signals. The Short-Time Fourier Transform (STFT) decomposed each beat window into spectral components. Mel-scaled triangular filterbanks applied perceptually motivated frequency warping, with logarithmic energies computed per filter:
Sm = log(Σk |X[k]|2 · Hm[k])
where X[k] represents STFT coefficients and Hm[k] denotes the m-th mel filterbank. The Discrete Cosine Transform (DCT) decorrelated log-energies:
ck = Σm = 1M (log Sm) cos[k(m − 1/2)π/M]
We extracted 20 MFCC coefficients, averaging across temporal frames to produce beat-level representations. Combined with 3 RR interval features and 4 statistical descriptors, the total MFCC feature vector comprised 27 elements.

2.3.3. Hilbert–Huang Transform (HHT)

HHT begins with Empirical Mode Decomposition (EMD), iteratively extracting Intrinsic Mode Functions (IMFs) representing signal oscillatory modes:
x(t) = Σi=1N ci(t) + rn(t)
where ci(t) denotes IMFs and rn(t) represents the final residual. We extracted the first 5 IMFs, applying the Hilbert Transform to derive analytic signals from which instantaneous amplitude and frequency were computed. Statistical descriptors (mean, standard deviation, and maximum) of instantaneous properties across each IMF yielded 60 HHT-domain features. Combined with 3 RR interval features and 4 statistical descriptors, the total HHT feature vector comprised 67 elements.

2.3.4. Synchrosqueezing Wavelet Transform (SSWT)

SSWT refines Continuous Wavelet Transform (CWT) analysis by reallocating energy from the time-scale plane to the time–frequency plane according to instantaneous frequency estimates. The CWT employs a mother wavelet ψ(t):
Wx(a, b) = (1/√a) ∫−∞^∞ x(t) ψ*((t − b)/a) dt
Synchrosqueezing produces sharper frequency localisation by reassigning CWT coefficients based on instantaneous frequency:
Tx(ω, b) = Σa Wx(a, b) · (reassignment weight)
We computed SSWT representations with 64 frequency bins, summing energy across time for each bin to produce frequency-domain feature vectors. Combined with 3 RR interval features and 4 statistical descriptors, the total SSWT feature vector comprised 71 elements.

2.4. Classification Architecture

To isolate feature extraction effects, we employed identical Cascade Forest classifiers across all experimental conditions. The Cascade Forest architecture, inspired by gcForest [22], implements multi-layer ensemble learning with feature augmentation. Our implementation comprised 3 layers, each containing 2 Random Forest models with 100 trees per forest.
At each layer L > 0, input features X^(L) consist of the previous layer’s input X^(L − 1) concatenated with class probability vectors from all models in layer L − 1:
X^(L) = [X^(L − 1) || P1^(L − 1)(X^(L − 1)) || … || Pm^(L − 1)(X^(L − 1))]
This hierarchical architecture enables representation learning, where successive layers capture increasingly abstract patterns while maintaining interpretability through tree-based decision structures.

2.5. Class Balancing and Data Partitioning

We partitioned the complete dataset into training and test subsets using stratified 80/20 splitting, preserving the original class proportions across both partitions. The resulting training set comprised 87,595 beats, of which 82.8% belonged to the Normal (N) class, while the minority Fusion (F) class accounted for only 0.4% (approximately 349 samples). This severe imbalance reflects the realistic clinical prevalence of arrhythmia types; however, if left unaddressed, it biases classifiers toward the dominant class and suppresses sensitivity to clinically critical minority arrhythmias.
To mitigate this imbalance, we applied the Synthetic Minority Over-sampling Technique (SMOTE) exclusively to the training partition prior to classifier training. SMOTE synthesises new minority-class samples rather than simply duplicating existing ones, thereby reducing the risk of overfitting associated with naive replication. For each minority-class sample xi, the algorithm identifies its k nearest neighbours within the same class in feature space (k = 5 in this study, consistent with the standard default). A synthetic sample x_new is then generated by linear interpolation along the vector connecting x_i to a randomly selected neighbour x_j:
x_new = x_i + λ · (x_jx_i)
where λ is sampled uniformly from [0, 1], placing the synthetic point at a random position along the line segment between the two real samples. This process was applied independently and iteratively to each of the four minority classes (S, V, F, Q) until all five classes reached equal representation.
The balanced training set comprised 362,525 total samples distributed uniformly across classes (approximately 72,505 samples per class, 20% per class). Critically, SMOTE was applied after feature extraction and was strictly confined to the training partition. The held-out test set retained the original imbalanced class distribution throughout all experiments, ensuring that evaluation metrics reflect classifier performance under clinically realistic conditions rather than an artificially balanced scenario. Since SMOTE operates in the extracted feature space rather than on the raw ECG signal, the characteristics of the synthetic samples differ across experimental conditions according to each method’s feature dimensionality: 27 dimensions for MFCC, 67 for HHT, 71 for SSWT, and 212 for DWT. Despite these differences in representation, the oversampling ratios and target class proportions were held constant across all four conditions, preserving the integrity of the controlled comparison. Figure 3 illustrates the class distribution transformation from the original imbalanced training partition to the SMOTE-balanced training set.

2.6. Evaluation Framework

The evaluation emphasised metrics appropriate for imbalanced, multi-class classification with clinical relevance. The primary metric was the macro-averaged F1 score, which treats all classes equally regardless of sample size, addressing the clinical reality that rare arrhythmias often carry disproportionate significance. For each class c, precision P_c, recall R_c, and F1_c were computed, with the macro-averaged F1 score calculated as F1_macro = (1/C) Σ_c F1_c.
Secondary metrics included overall accuracy, macro-averaged precision, and macro-averaged recall for comprehensive performance characterisation. Class-specific precision, recall, and F1 scores enabled a detailed analysis of method strengths and limitations across arrhythmia types. Friedman chi-square tests assessed whether performance differences across feature extraction methods exceeded random variation, with p < 0.05 indicating statistical significance. Total execution time encompassing feature extraction, model training, and prediction quantified computational requirements relevant to deployment contexts.

2.7. Implementation

All experiments utilised Python 3.12 in the Google Colab environment. Key libraries included scikit-learn (machine learning), PyWavelets (wavelet analysis), ssqueezepy (synchrosqueezing), EMD-signal (empirical mode decomposition), librosa (MFCC), wfdb (MIT-BIH database access), and imbalanced-learn (SMOTE). All code and experimental protocols are available upon request to ensure reproducibility. Identical random seeds (seed = 42) ensured reproducibility across experimental conditions.

3. Results

3.1. Overall Performance Comparison

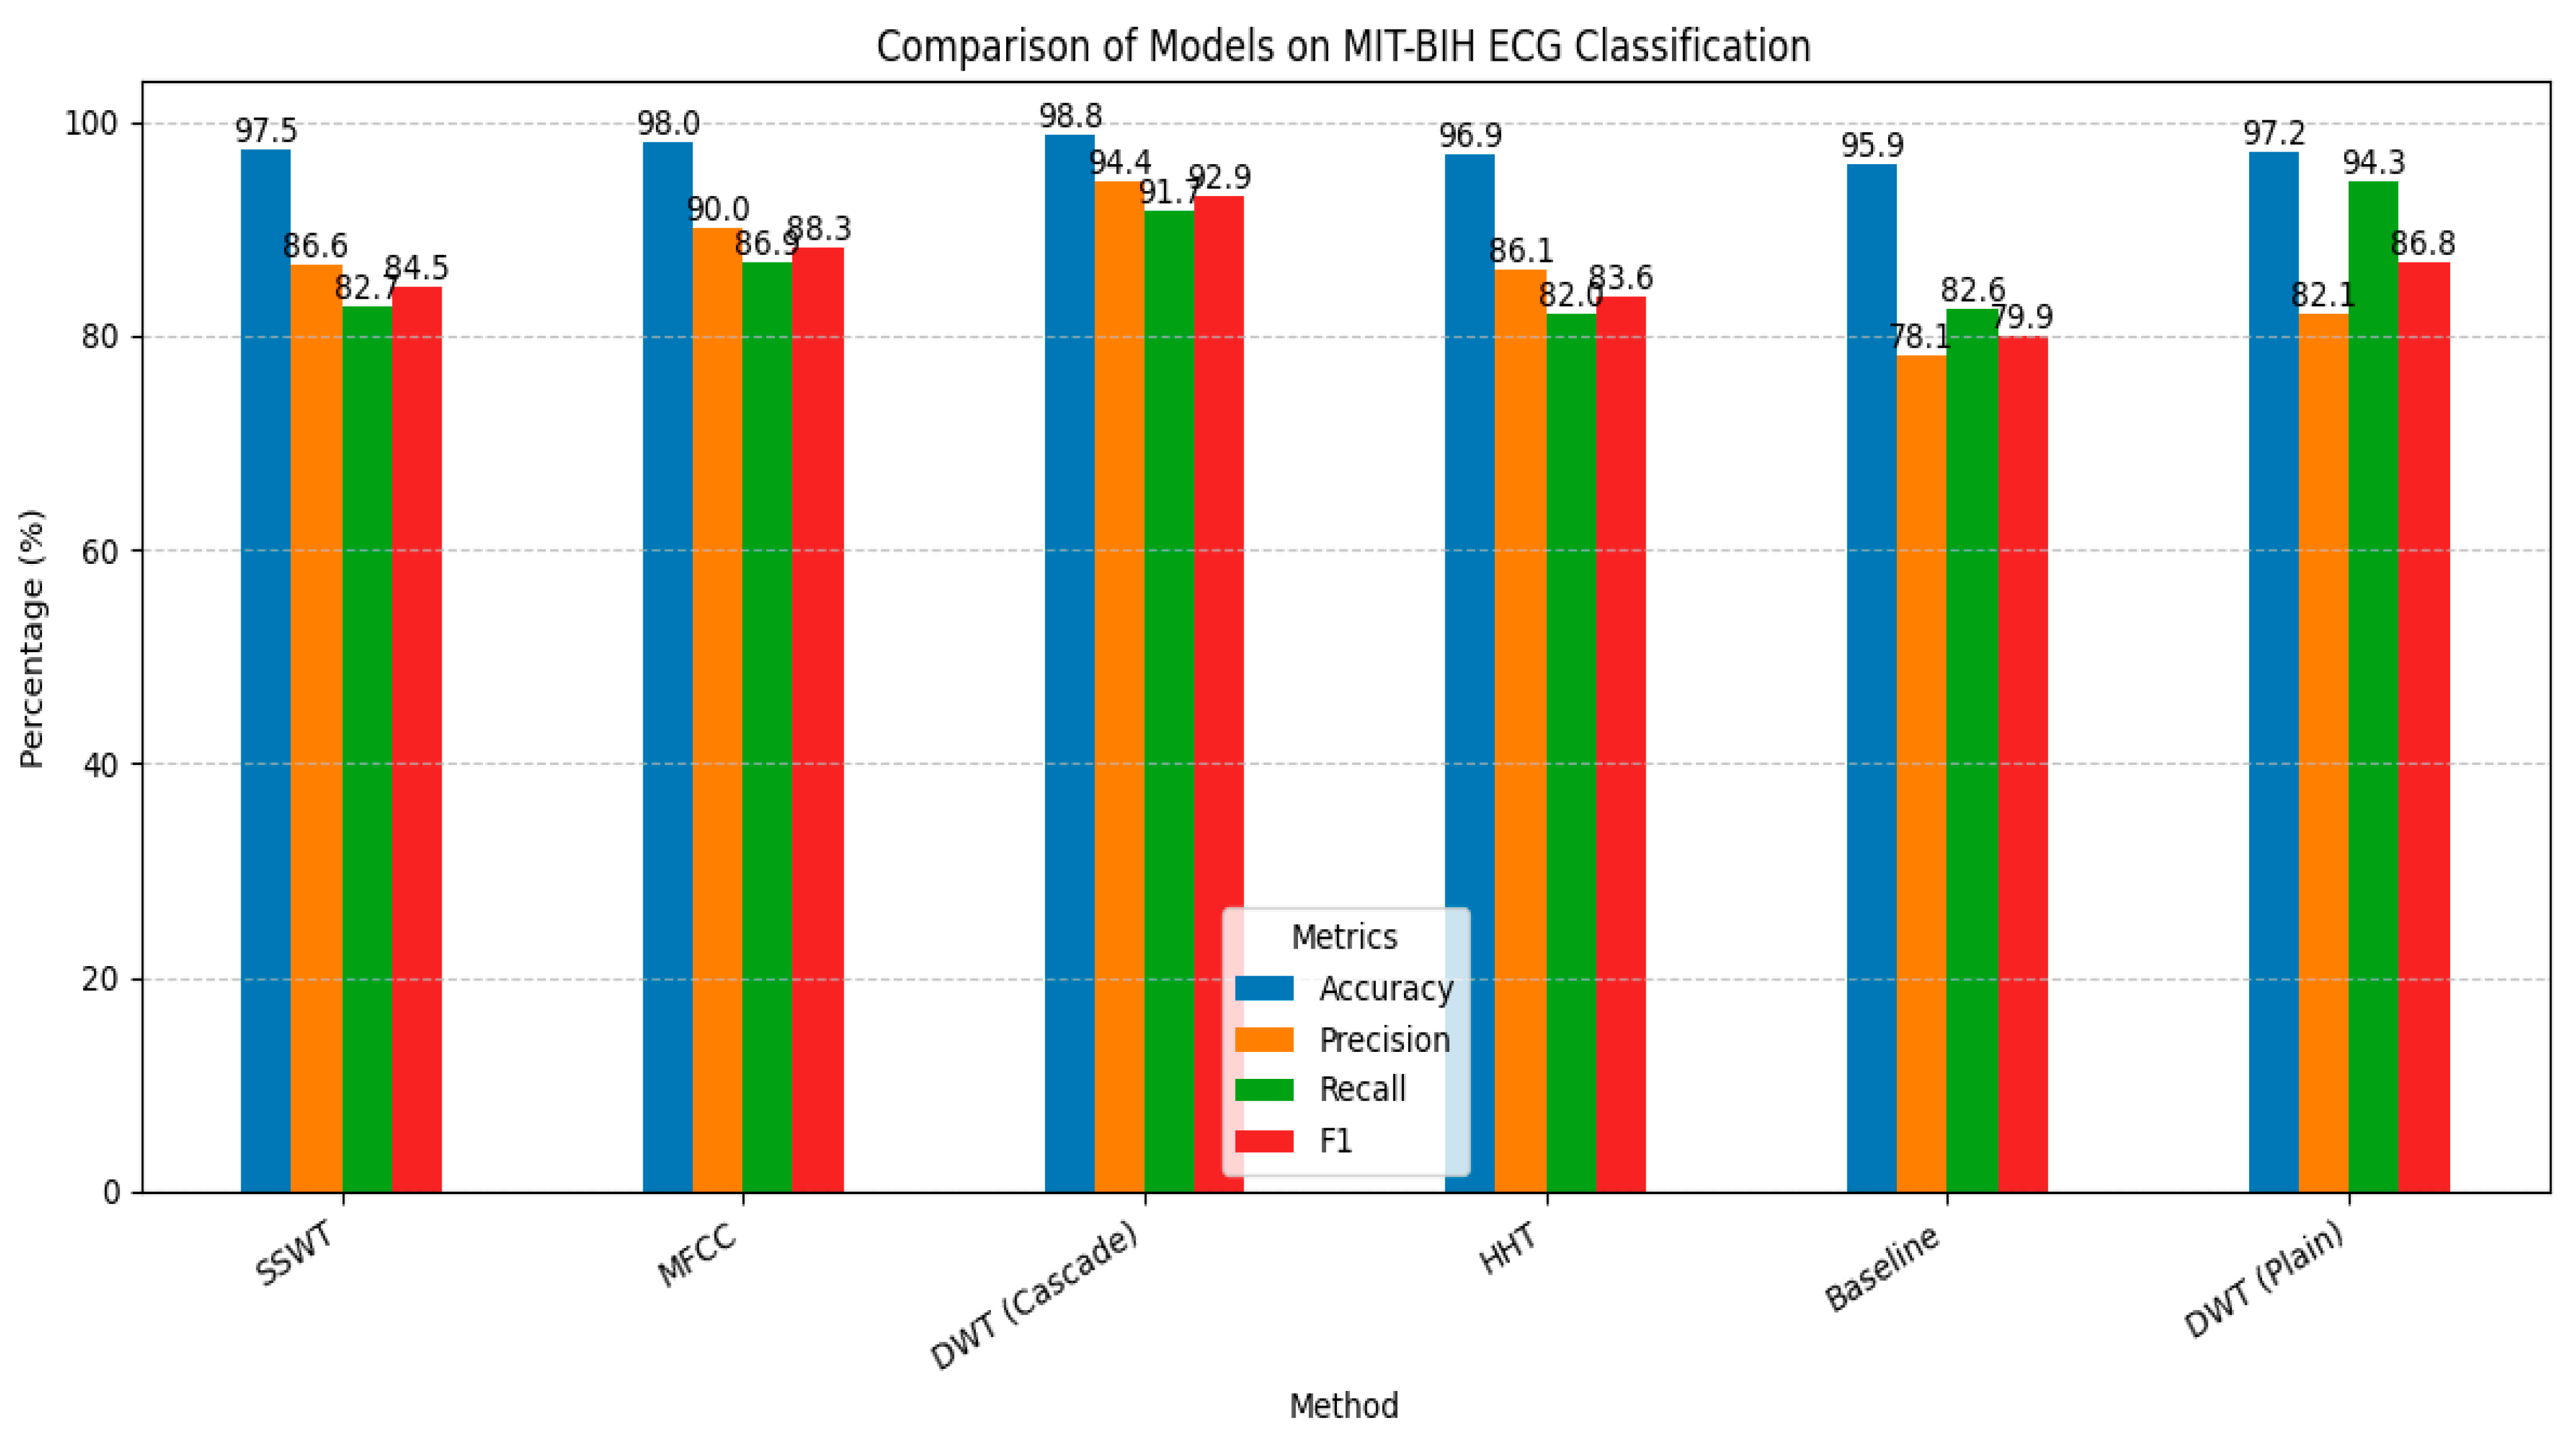
Table 3 presents comprehensive performance metrics for all feature extraction methods evaluated under identical classification conditions. Across all primary metrics—overall accuracy, macro-precision, macro-recall, and macro-F1—the methods produced a consistent and statistically significant ranking, confirmed by the Friedman chi-square test (χ2 = 10.12, p = 0.017), which established that observed differences exceeded random variation. The complete ranking from highest to lowest macro-F1 was DWT > MFCC > SSWT > HHT > Baseline.
DWT-based features demonstrated superior performance across all primary metrics, achieving 98.79% accuracy, 94.39% precision, 91.67% recall, and a 92.93% macro-F1 score. This performance substantially exceeded alternative methods, with the nearest competitor (MFCC) achieving 88.30% macro-F1, a 4.63 percentage point difference. The baseline configuration utilising only RR interval features without signal transform-based extraction achieved 79.91% macro-F1.
MFCC features achieved the nearest competitive performance (98.00% accuracy, 88.30% macro-F1) while requiring substantially fewer features (27 vs. 212 for DWT), suggesting efficient information encoding. However, MFCC’s macro-F1 performance remained 4.63 percentage points below DWT, indicating information loss despite compact representation.
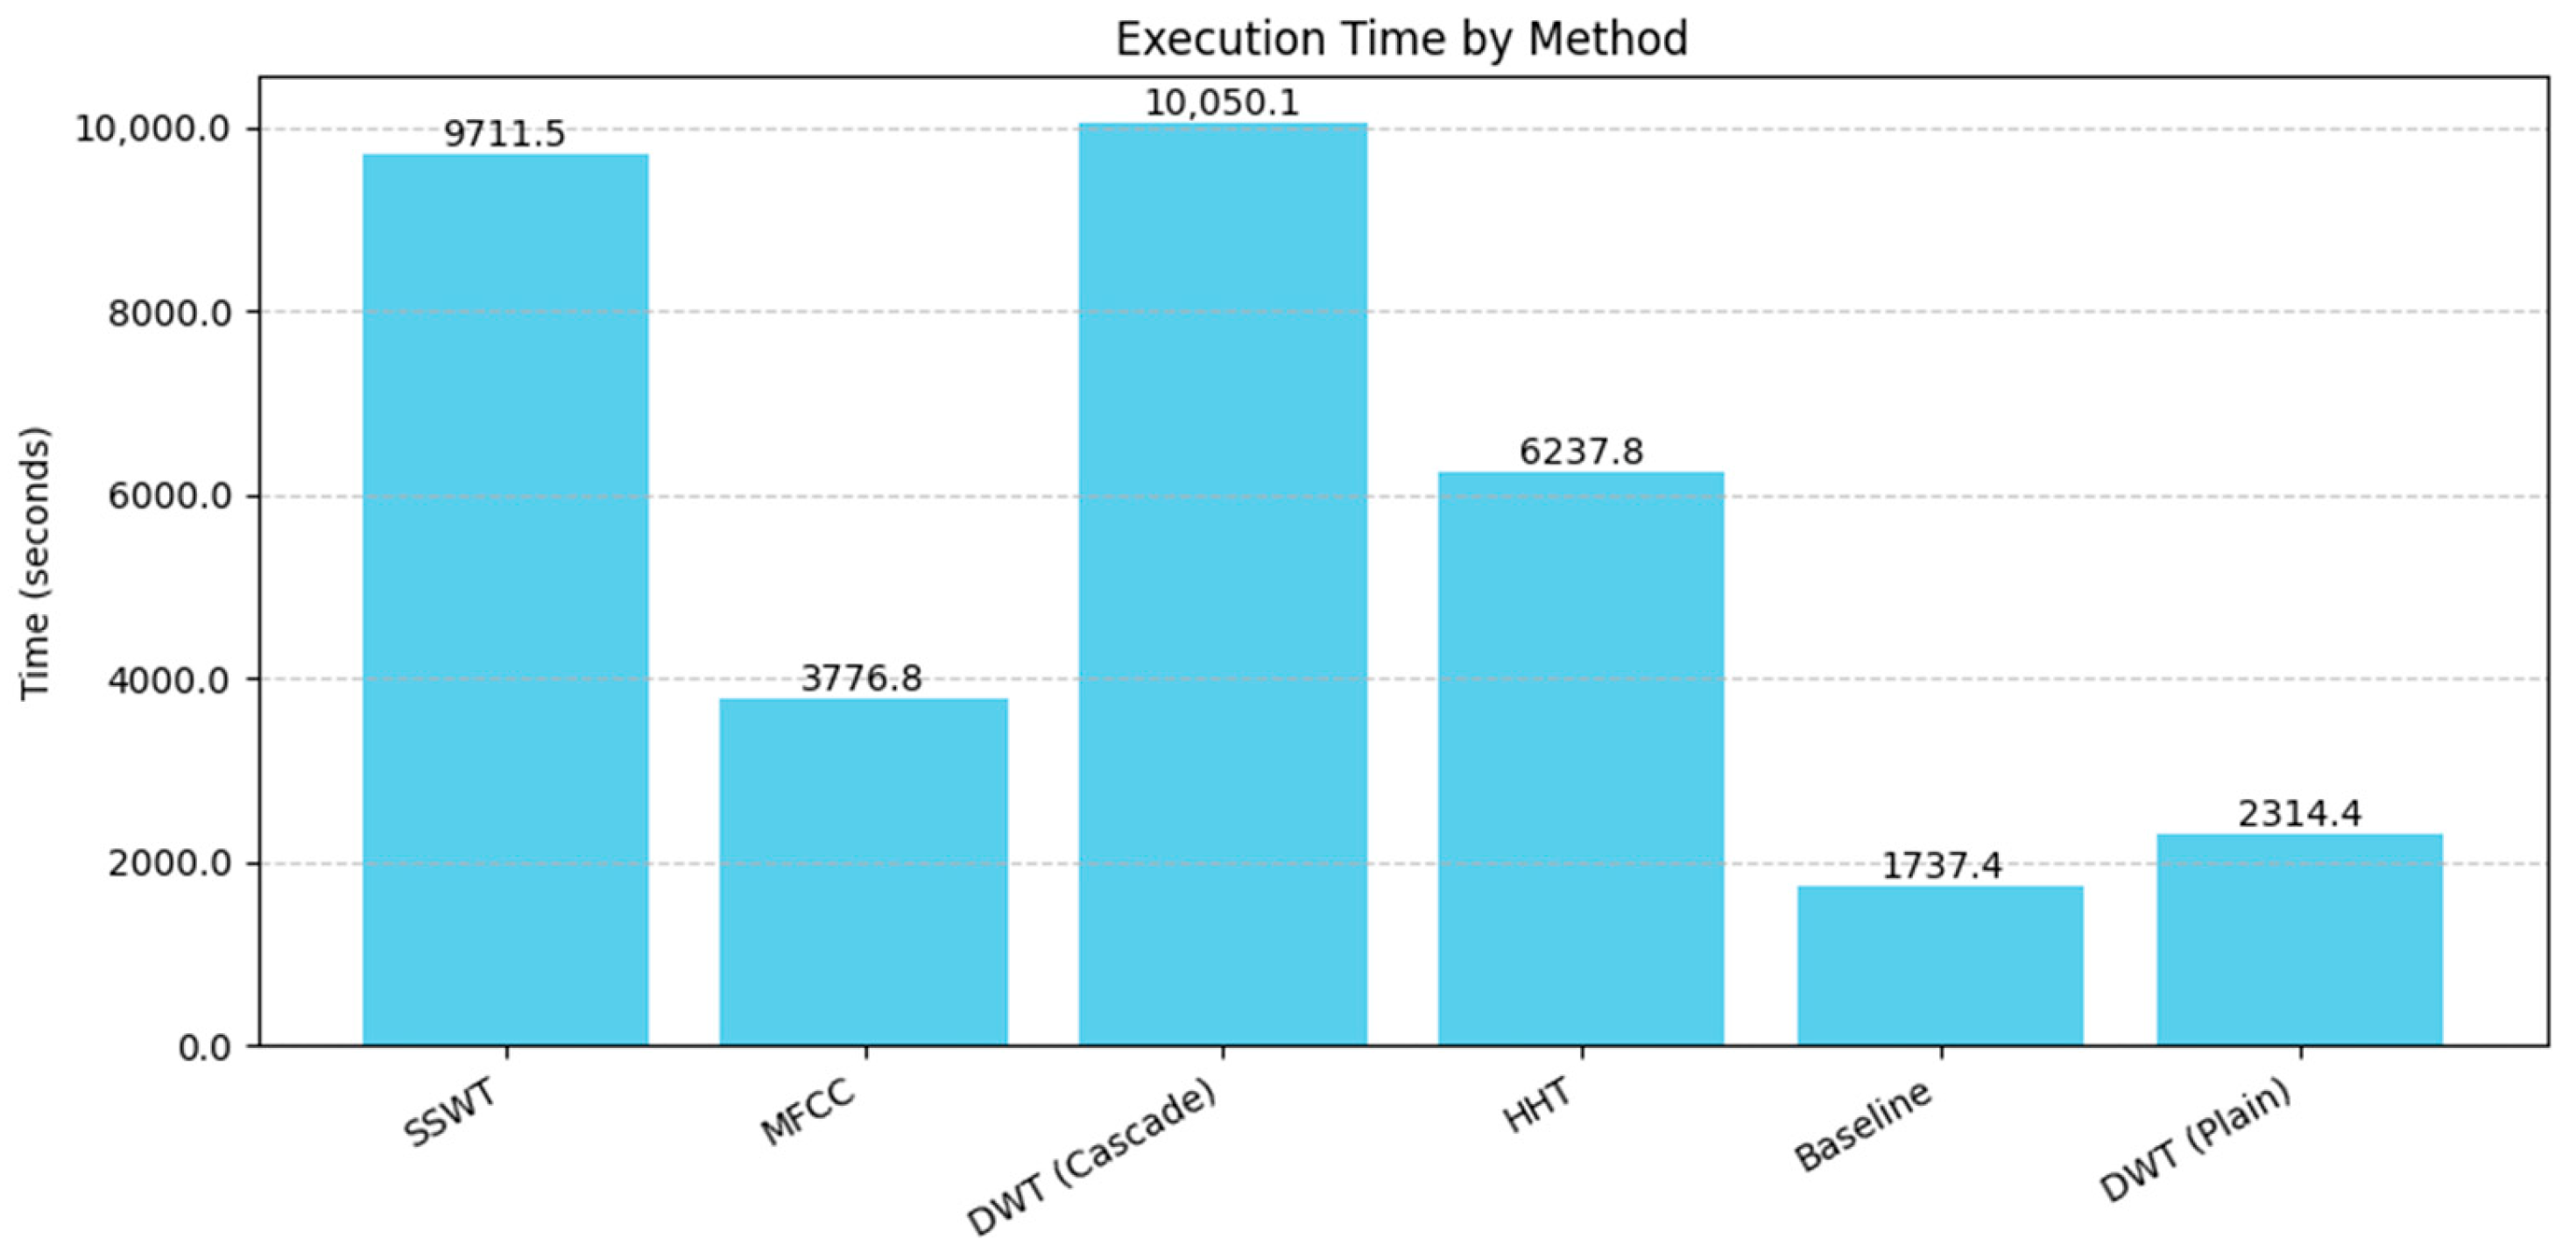
Surprisingly, SSWT and HHT methods underperformed relative to theoretical advantages for non-stationary signal analysis. SSWT achieved 84.54% macro-F1 (97.49% accuracy), while HHT obtained 83.59% macro-F1, both substantially below DWT and MFCC. The marginal difference between the two (0.95 percentage points) suggests comparable practical utility despite their distinct mathematical foundations. Critically, both methods incurred the highest execution times in the study (9711 s and 6238 s respectively), yielding an unfavourable efficiency-to-accuracy trade-off relative to DWT and MFCC.
The baseline configuration, employing only the seven RR-interval features without any signal-domain transformation, achieved 79.91% macro-F1 (95.92% accuracy). The 13.02 percentage point gap between the baseline and DWT directly quantifies the classification gain attributable to advanced feature extraction, confirming that feature representation is a primary determinant of performance within this framework.
As shown in Figure 4, the DWT model demonstrates clear advantages in accuracy, precision, and F1 score compared to all other methods. All models employed cascade forest classifiers with identical configurations, ensuring fair comparison across feature extraction approaches.

3.2. Class-Specific Performance Analysis

Table 4 presents detailed per-class performance metrics, revealing systematic patterns in method strengths and limitations across arrhythmia types. All methods achieved excellent performance on the majority Normal (N) class (F1 ≥ 0.98) and the well-represented Unknown/Quiet (Q) class (F1 ≥ 0.96), indicating that adequate training data enables reliable classification regardless of the feature extraction approach.
Performance differences emerged most prominently for minority classes, particularly Fusion (F) beats, which represented only 0.4% of the training data. DWT features enabled substantially superior Fusion beat classification (F1 = 0.80, precision = 0.87, recall = 0.74) compared to alternatives: MFCC (F1 = 0.62), SSWT (F1 = 0.48), HHT (F1 = 0.50), and baseline (F1 = 0.34). This 18–30 percentage point F1 score advantage demonstrates DWT’s capacity for extracting discriminative features even from severely under-represented classes.
Ventricular ectopic beat (V) classification similarly revealed method-dependent performance variations. DWT achieved exceptional ventricular beat discrimination (F1 = 0.96, precision = 0.96, recall = 0.97), substantially exceeding MFCC (F1 = 0.92), SSWT (F1 = 0.89), HHT (F1 = 0.89), and baseline (F1 = 0.84). Given ventricular ectopic beats’ clinical significance as potential precursors to life-threatening arrhythmias, this 4–12 percentage point performance advantage carries substantial clinical implications.
Supraventricular ectopic beat (S) classification showed more modest performance differences, with DWT achieving F1 = 0.90, comparable to MFCC (F1 = 0.90) and SSWT (F1 = 0.88), while exceeding HHT (F1 = 0.84) and baseline (F1 = 0.86). These results suggest that feature extraction method selection impacts minority class performance more substantially than majority or moderately represented classes.

3.3. Computational Efficiency Analysis

Feature extraction and classification execution times revealed substantial variations in computational requirements across methods, with critical implications for deployment contexts. Figure 5 illustrates the total execution time, encompassing feature extraction, model training, and prediction for the complete dataset.

4. Discussion

4.1. DWT Superiority: Signal Processing Foundations

DWT features’ superior performance across overall and class-specific metrics stems from fundamental signal processing characteristics that are well-aligned with ECG signal properties and arrhythmia discrimination requirements. ECG signals exhibit inherently multi-scale temporal structures: rapid QRS complex depolarisations (50–100 ms duration) coexist with slower P-wave atrial depolarisations and T-wave ventricular repolarisations (100–300 ms duration). DWT’s multi-resolution decomposition naturally matches these temporal scales, with detail coefficients at fine scales capturing rapid QRS components while approximation coefficients encode slower waveform features [9].
The Daubechies 4 (db4) wavelet employed in this study possesses a morphological similarity to QRS complexes, providing optimal template matching for this dominant ECG feature. This morphological alignment enables efficient energy concentration into wavelet coefficients corresponding to cardiac events, producing discriminative features for classification. Furthermore, DWT’s shift-invariance properties ensure robust feature extraction despite inevitable temporal variations in R-peak annotation and beat alignment.
Arrhythmia discrimination fundamentally depends on detecting subtle morphological deviations from normal sinus rhythm patterns. Ventricular ectopic beats exhibit widened, abnormally shaped QRS complexes arising from ectopic ventricular pacemakers. Supraventricular ectopic beats demonstrate abnormal P-wave morphologies or absent P-waves preceding otherwise relatively normal QRS complexes. Fusion beats present intermediate morphologies, combining characteristics of normal and ectopic activation. DWT’s capacity for simultaneously capturing both fine-scale QRS abnormalities and coarser-scale repolarisation changes enables comprehensive characterisation of these morphological variations, explaining superior classification performance, particularly for challenging minority classes.
The statistical descriptors computed across wavelet coefficients, including variance, skewness, and kurtosis, provide additional discrimination capacity by characterising coefficient distribution shapes beyond simple amplitude measures. High-kurtosis coefficient distributions may indicate sharply peaked waveform components characteristic of certain arrhythmias, while skewness captures asymmetry that potentially discriminates between arrhythmia types. This multi-faceted feature representation combining multi-resolution temporal information with statistical characterisation likely contributes to DWT’s performance advantage.

4.2. MFCC Performance: Unexpected Competitiveness

MFCC features achieved surprisingly competitive performance (88.30% macro-F1) despite originating from speech processing rather than biomedical signal analysis domains. This competitiveness merits explanation, as mel-scale frequency warping, designed to mimic human auditory perception, lacks obvious physiological justification for ECG signals generated by cardiac electrophysiology rather than acoustic phenomena.
Several factors may explain MFCC’s relative success. First, mel-scale warping emphasises lower frequencies where much ECG energy concentrates, particularly the dominant QRS complex fundamental frequencies. This frequency emphasis may incidentally align with clinically relevant ECG spectral content. Second, MFCC’s cepstral analysis decorrelates spectral features via DCT, potentially reducing feature redundancy and improving machine learning efficiency—an advantage independent of perceptual motivation. Third, the compact 20-coefficient representation may provide implicit regularisation, reducing overfitting risk compared to higher-dimensional alternatives.
However, MFCC’s 4.63 percentage point macro-F1 deficit compared to DWT reveals limitations. MFCC lacks temporal resolution; averaging across time frames loses beat-to-beat variation, which is potentially diagnostic for certain arrhythmias. Furthermore, MFCC’s frequency-domain focus may miss subtle time-domain morphological features that clinicians utilise for arrhythmia diagnosis. The particularly large performance gap for Fusion beats (F1 = 0.62 vs. 0.80 for DWT) supports this interpretation: Fusion beat discrimination likely requires precise temporal morphology characterisation that frequency-domain averaging obscures.
From a practical deployment perspective, MFCC’s 62% computational efficiency advantage, combined with competitive (though inferior) performance, establishes it as a viable alternative for resource-constrained scenarios prioritising efficiency over maximum accuracy. Real-time monitoring systems processing continuous ECG streams may benefit from MFCC’s reduced computational burden, particularly if acceptable performance thresholds can tolerate the 4–5 percentage point macro-F1 reduction.

4.3. SSWT and HHT Limitations: Theory-Practice Gaps

The inferior performance of SSWT (84.54% macro-F1) and HHT (83.59% macro-F1) compared to classical DWT is surprising, given their theoretical advantages for non-stationary signal analysis. These results highlight critical gaps between signal processing theory and practical machine learning performance under realistic constraints.
SSWT’s synchrosqueezing operations produce sharper time-frequency representations than standard wavelets by reallocating energy along instantaneous frequency ridges [11]. This sharpening theoretically enhances feature resolution, potentially improving classification. However, several factors may explain SSWT’s practical underperformance. First, the enhanced resolution generates 71-dimensional feature vectors, containing potentially redundant information that machine learning models must navigate; dimensionality curse effects may overwhelm resolution advantages. Second, synchrosqueezing operations introduce nonlinear transformations, potentially distorting relationships between signal characteristics and arrhythmia classes, complicating learning. Third, the method’s sensitivity to parameter choices (particularly frequency bin selection) may require careful optimisation not performed in this standardised comparison.
HHT’s adaptive, data-driven decomposition theoretically suits non-linear, non-stationary ECG signals better than fixed-basis methods like DWT [14]. However, the poorest overall performance (83.59% macro-F1) indicates practical limitations. EMD’s iterative sifting process introduces computational complexity and potential instability; small signal variations may substantially alter extracted IMFs, creating feature inconsistency. The resulting features may capture signal-specific artefacts rather than generalisable arrhythmia patterns, reducing classification performance. Furthermore, the lack of orthogonality among IMFs (unlike wavelet basis functions) may introduce feature redundancy, challenging classifiers to navigate effectively.
Both methods’ computational demands (2.7–2.8 h execution) combined with inferior performance create unfavourable efficiency-accuracy trade-offs. These results suggest that theoretical signal processing advantages require careful practical validation; sophisticated mathematical properties do not automatically translate to superior machine learning outcomes under realistic data constraints and class imbalance.

4.4. Clinical Implications and Deployment Considerations

The systematic performance differences observed across feature extraction methods carry substantial clinical implications for automated ECG diagnostic system design and deployment. The primary clinical imperative remains maximising diagnostic accuracy, particularly for rare but clinically significant arrhythmias, where missed detections pose direct patient safety risks. From this perspective, DWT features’ superior minority class performance, especially the 18–30 percentage point F1 advantage for Fusion beats, establishes clear clinical value justifying computational costs for offline analysis applications.
However, clinical deployment contexts vary substantially in computational resource availability and latency requirements. Batch processing of stored ECG recordings for retrospective analysis can accommodate DWT’s 2.79-h execution time for the complete MIT-BIH dataset. In contrast, real-time continuous monitoring systems processing incoming ECG streams impose strict latency constraints: classification latency must remain well below heartbeat intervals (approximately 1 s for normal sinus rhythm) to enable timely intervention. MFCC’s 62% computational efficiency advantage while maintaining 88% macro-F1 performance may prove acceptable for such applications, particularly if systems can tolerate the 4–5 percentage point performance reduction.
Edge computing scenarios for wearable ECG monitors introduce additional constraints: limited processing power, memory capacity, and battery life preclude computationally intensive feature extraction. The baseline approach utilising only RR interval features achieved a 0.48-h execution time but suffered unacceptable performance degradation (79.91% macro-F1, 13 percentage points below DWT). This suggests that ultra-lightweight feature extraction requires careful optimisation rather than simple elimination; perhaps selective use of a subset of the most discriminative DWT coefficients could balance efficiency and accuracy.
The class-specific performance patterns reveal additional clinical considerations. All methods achieved excellent normal beat classification (F1 ≥ 0.98), indicating that routine monitoring applications focused primarily on normal rhythm confirmation face relatively unconstrained feature extraction method choices. Conversely, applications requiring reliable detection of rare arrhythmias, particularly fusion beats and, to a lesser extent, ventricular ectopic beats, strongly benefit from DWT features’ superior minority class performance. Clinical deployment decisions should therefore align feature extraction method selection with specific application requirements rather than pursuing one-size-fits-all solutions.

4.5. Interpretability Advantages and Limitations

The Cascade Forest classifier architecture employed throughout this study provides inherent interpretability advantages compared to deep neural network alternatives. Tree-based ensemble methods naturally support feature importance rankings via metrics including Gini impurity reduction and permutation importance [23]. Clinicians can examine which wavelet coefficients, frequency bands, or temporal features most strongly influence classification decisions, validating model logic against domain knowledge.
However, feature interpretability varies substantially across extraction methods. DWT coefficients correspond to specific time-scale localisations with direct signal processing interpretation: high-scale approximation coefficients represent overall waveform trends, while low-scale detail coefficients capture rapid transients. Clinicians can potentially relate specific coefficient importance to known arrhythmia characteristics, such as QRS widening in ventricular ectopy. MFCC features lack this direct interpretability; mel-frequency cepstral coefficients represent abstract spectral properties without clear physiological mapping. While machine learning models may effectively utilise MFCC features for classification, clinicians cannot easily validate learnt patterns against established cardiac electrophysiology.
This interpretability consideration introduces an additional dimension to feature extraction method selection beyond performance and efficiency. Applications requiring not just accurate classification but also clinical validation of model reasoning, such as regulatory approval processes or integration into clinical decision support systems where physicians must understand and trust automated recommendations, may prefer DWT despite computational costs due to superior physiological interpretability combined with optimal performance.

4.6. Study Limitations

Several limitations constrain the interpretation and generalisability of our findings. First, the evaluation utilised exclusively the MIT-BIH Arrhythmia Database, a widely used but historically dated (1975–1979) benchmark with limited patient diversity (47 subjects). Performance patterns may differ on contemporary datasets with broader demographic representation, different noise characteristics from modern acquisition equipment, or alternative arrhythmia distributions. Future validation on diverse databases, including PTB-XL, CODE-15%, and Chapman datasets, would strengthen generalisability conclusions.
Second, the ANSI/AAMI EC57 standard mapping consolidates original beat annotations into five superclasses, potentially obscuring performance differences among constituent subtypes. For example, the supraventricular class combines atrial premature beats, junctional premature beats, and supraventricular runs—distinct arrhythmias that may exhibit different classification characteristics. Finer-grained analysis of original beat types could reveal additional insights into feature extraction method strengths and limitations.
Third, computational efficiency measurements encompassed complete pipeline execution, including feature extraction, model training, and prediction. Clinical deployment scenarios exhibit different computational bottlenecks: offline batch processing amortises training costs across many predictions, while real-time monitoring emphasises per-beat inference latency. More granular timing analysis, isolating extraction, training, and prediction phases, would provide deployment-specific guidance.
Finally, the controlled experimental design, maintaining identical conditions across methods while enabling clear performance attribution, may not reflect real-world optimisation. Practitioners often tune preprocessing, feature selection, and classifier hyperparameters jointly rather than independently. Comprehensive end-to-end optimisation might reveal different optimal configurations, though our standardised approach provides foundational knowledge for such optimisation efforts.

5. Conclusions

This systematic comparative evaluation provides rigorous empirical evidence characterising feature extraction method performance for ECG arrhythmia classification under controlled conditions, establishing clear conclusions with practical implications for automated diagnostic system design.
DWT-based features demonstrate superior classification performance (98.79% accuracy, 92.93% macro-F1) compared to MFCC (88.30% macro-F1), SSWT (84.54% macro-F1), and HHT (83.59% macro-F1) under identical classification conditions with Cascade Forest classifiers. This advantage proves most pronounced for clinically critical minority classes, particularly fusion beats (F1 = 0.80 vs. 0.48–0.62 for alternatives) and ventricular ectopic beats (F1 = 0.96 vs. 0.84–0.92). Statistical analysis via the Friedman test confirmed significant performance differences (χ2 = 10.12, p = 0.017).
However, deployment context significantly influences optimal method selection. MFCC features achieve competitive performance (88.30% macro-F1) with a 62% lower computational burden (3777 vs. 10,050s), establishing favourable efficiency-accuracy trade-offs for resource-constrained real-time monitoring applications where a 4–5 percentage point macro-F1 reduction proves acceptable. Advanced methods SSWT and HHT, despite theoretical advantages for non-stationary signal analysis, underperformed compared to classical DWT while requiring comparable computational resources, demonstrating critical gaps between signal processing theory and practical machine learning outcomes.
Based on these findings, we propose evidence-based guidelines for feature extraction method selection: For offline batch processing with accuracy prioritisation, select DWT features with multi-resolution decomposition (level 4, db4 wavelet) and comprehensive statistical descriptors, accepting computational costs to maximise minority class detection performance. For real-time monitoring with balanced requirements, consider MFCC features providing competitive performance with substantial efficiency gains (62% computational savings). For ultra-resource-constrained edge deployment, investigate reduced DWT configurations, selecting the most discriminative coefficient subsets, as baseline RR-interval-only features prove insufficient (79.91% macro-F1). For interpretability-critical applications, prefer DWT features providing physiologically interpretable time-scale localisations over abstract MFCC spectral coefficients, facilitating clinical validation and regulatory approval processes.
Future research directions include multi-dataset validation across diverse ECG databases to assess performance ranking generalisability, feature fusion approaches evaluating whether combining complementary feature types captures synergistic information, classifier interaction analysis investigating whether feature extraction method rankings depend on classification algorithm choice, granular timing analysis decomposing computational costs into extraction, training, and inference phases, clinical validation studies conducting prospective evaluation comparing automated classification against expert cardiologist interpretation, and hybrid approaches exploring two-stage architectures employing efficient preliminary screening followed by detailed analysis for concerning beats.
This work contributes to developing trustworthy AI systems for healthcare applications by systematically characterising feature extraction method performance under controlled conditions, providing evidence-based guidance that reduces arbitrary methodological choices potentially suboptimising clinical utility. The demonstrated trade-offs between accuracy, computational efficiency, and interpretability inform nuanced deployment decisions, recognising that optimal choices depend on specific application contexts. As automated ECG analysis systems increasingly integrate into clinical practice, from hospital monitoring to consumer wearables, evidence-based feature extraction guidance becomes essential for ensuring reliability, efficiency, and clinical trust.

Author Contributions

Conceptualisation, methodology, validation, visualisation, writing—original draft preparation, were done by V.A.; writing—review and supervision, M.E. All authors have read and agreed to the published version of the manuscript.

Funding

This research received no external funding.

Data Availability Statement

The data used in this study are publicly available. The MIT-BIH Arrhythmia Database can be accessed at PhysioNet: https://physionet.org/content/mitdb/1.0.0/ (accessed on 26 February 2026).

Acknowledgments

The authors would like to acknowledge Olayinka Adeleye, Lead Researcher of Neurocogni, New Zealand, for reviewing the final draft. We also acknowledge the PhysioNet platform for providing open access to the MIT-BIH Arrhythmia Database used in this study.

Conflicts of Interest

The authors declare no conflicts of interest.

Abbreviations

The following abbreviations are used in this manuscript:
ECGElectrocardiogram
P-waveECG waveform component (atrial depolarization)
QRS complexECG waveform component (ventricular depolarization)
T-waveECG waveform component (ventricular repolarization)
RR intervalTime between consecutive R-peaks
MLIIModified Limb Lead II
NNormal beat
SSupraventricular Ectopic Beat (SVEB)
VVentricular Ectopic Beat (VEB)
FFusion Beat
QUnknown/Quiet Beat
MFCCMel-Frequency Cepstral Coefficients
DWTDiscrete Wavelet Transform
CWTContinuous Wavelet Transform
SSWTSynchrosqueezing Wavelet Transform
HHTHilbert–Huang Transform
STFTShort-Time Fourier Transform
FFT/FourierFast Fourier Transform
DCTDiscrete Cosine Transform
EMDEmpirical Mode Decomposition
IMFIntrinsic Mode Function
WaveletsMathematical functions for time–frequency signal analysis
db4Daubechies 4 wavelet
db6Daubechies 6 wavelet
CFCascade Forest
gcForestGrains Cascade Forest
SMOTESynthetic Minority Over-sampling Technique
SVMSupport Vector Machine
CNNConvolutional Neural Network
k-NNk-Nearest Neighbours
F1F1 score (harmonic mean of precision and recall)
AIArtificial Intelligence
ANSI/AAMIAmerican National Standards Institute/Association for the Advancement of Medical Instrumentation
MIT-BIHMassachusetts Institute of Technology—Beth Israel Hospital (Arrhythmia Database)
PTB-XLPhysikalisch-Technische Bundesanstalt ECG Database
CPSCChina Physiological Signal Challenge
RQResearch Question
HzHertz (unit of frequency)
msMilliseconds (unit of time)

References

  1. Martin, S.S.; Aday, A.W.; Almarzooq, Z.I.; Anderson, C.A.M.; Arora, P.; Avery, C.L.; Baker-Smith, C.M.; Barone Gibbs, B.; Beaton, A.Z.; Boehme, A.K.; et al. 2024 Heart Disease and Stroke Statistics: A Report of US and Global Data From the American Heart Association. Circulation 2024, 149, E347–E913. [Google Scholar] [CrossRef]
  2. Kazemi Lichaee, F.; Salari, A.; Jalili, J.; Beikmohammad Dalivand, S.; Roshanfekr Rad, M.; Mojarad, M. Advancements in Artificial Intelligence for ECG Signal Analysis and Arrhythmia Detection: A Review. Int. J. Cardiovasc. Pract. 2024, 8, e143437. [Google Scholar] [CrossRef]
  3. Liu, J.; Li, Z.; Jin, Y.; Liu, Y.; Liu, C.; Zhao, L.; Chen, X. A Review of Arrhythmia Detection Based on Electrocardiogram with Artificial Intelligence. Expert Rev. Med. Devices 2022, 19, 549–560. [Google Scholar] [CrossRef]
  4. He, X.; Hu, C.; Ma, K.; Huang, J.; He, H. ECG-Based Arrhythmia Classification Using Discrete Wavelet Transform and Attention-Enhanced CNN-BiGRU Model. Phys. Eng. Sci. Med. 2025, 48, 1995–2009. [Google Scholar] [CrossRef]
  5. Ye, Y.; Chipusu, K.; Ashraf, M.A.; Ding, B.; Huang, Y.; Huang, J. Hybrid CNN-BLSTM Architecture for Classification and Detection of Arrhythmia in ECG Signals. Sci. Rep. 2025, 15, 34510. [Google Scholar] [CrossRef]
  6. Petch, J.; Di, S.; Nelson, W. Opening the Black Box: The Promise and Limitations of Explainable Machine Learning in Cardiology. Can. J. Cardiol. 2022, 38, 204–213. [Google Scholar] [CrossRef]
  7. Kovalchuk, O.; Barmak, O.; Radiuk, P.; Klymenko, L.; Krak, I. Towards Transparent AI in Medicine: ECG-Based Arrhythmia Detection with Explainable Deep Learning. Technologies 2025, 13, 34. [Google Scholar] [CrossRef]
  8. Singh, A.K.; Krishnan, S. ECG Signal Feature Extraction Trends in Methods and Applications. Biomed. Eng. OnLine 2023, 22, 22. [Google Scholar] [CrossRef]
  9. Pradhan, B.K.; Neelappu, B.C.; Sivaraman, J.; Kim, D.; Pal, K. A Review on the Applications of Time-Frequency Methods in ECG Analysis. J. Healthc. Eng. 2023, 2023, 3145483. [Google Scholar] [CrossRef]
  10. Lin, M.; Hong, Y.; Hong, S.; Zhang, S. Discrete Wavelet Transform Based ECG Classification Using gcForest: A Deep Ensemble Method. Technol. Health Care 2024, 32, 95–105. [Google Scholar] [CrossRef]
  11. Marchi, E.; Cervetto, M.; Galarza, C. Adaptive Synchrosqueezing Wavelet Transform for Real-Time Applications. Digit. Signal Process. 2023, 140, 104133. [Google Scholar] [CrossRef]
  12. Herry, C.L.; Frasch, M.; Seely, A.J.; Wu, H. Heart Beat Classification from Single-Lead ECG Using the Synchrosqueezing Transform. Physiol. Meas. 2017, 38, 171–187. [Google Scholar] [CrossRef]
  13. Huang, N.E.; Shen, Z.; Long, S.R.; Wu, M.C.; Shih, H.H.; Zheng, Q.; Yen, N.-C.; Tung, C.C.; Liu, H.H. The Empirical Mode Decomposition and the Hilbert Spectrum for Nonlinear and Non-Stationary Time Series Analysis. Proc. R. Soc. Lond. Ser. Math. Phys. Eng. Sci. 1998, 454, 903–995. [Google Scholar] [CrossRef]
  14. Wang, C.-L.; Wei, C.-C.; Tsai, C.-T.; Lee, Y.-H.; Liu, L.Y.-M.; Chen, K.-Y.; Lin, Y.-J.; Lin, P.-L. Early Detection of Myocardial Ischemia in Resting ECG: Analysis by HHT. Biomed. Eng. OnLine 2023, 22, 23. [Google Scholar] [CrossRef]
  15. Alodia Yusuf, S.A.; Hidayat, R. MFCC Feature Extraction and KNN Classification in ECG Signals. In Proceedings of the 2019 6th International Conference on Information Technology, Computer and Electrical Engineering (ICITACEE), Semarang, Indonesia, 26–27 September 2019; IEEE: New York, NY, USA, 2019; pp. 1–5. [Google Scholar]
  16. Zhang, D.; Yuan, X.; Zhang, P. Interpretable Deep Learning for Automatic Diagnosis of 12-Lead Electrocardiogram. iScience 2020, 24, 102373. [Google Scholar] [CrossRef]
  17. Song, M.-S.; Lee, S.-B. Comparative Study of Time-Frequency Transformation Methods for ECG Signal Classification. Front. Signal Process. 2024, 4, 1322334. [Google Scholar] [CrossRef]
  18. Moody, G.B.; Mark, R.G. The Impact of the MIT-BIH Arrhythmia Database. IEEE Eng. Med. Biol. Mag. 2001, 20, 45–50. [Google Scholar] [CrossRef]
  19. Luz, E.J.D.S.; Schwartz, W.R.; Cámara-Chávez, G.; Menotti, D. ECG-Based Heartbeat Classification for Arrhythmia Detection: A Survey. Comput. Methods Programs Biomed. 2016, 127, 144–164. [Google Scholar] [CrossRef]
  20. Association for the Advancement of Medical Instrumentation. ANSI/AAMI EC57:1998; Testing and Reporting Performance Results of Cardiac Rhythm and ST Segment Measurement Algorithms; Association for the Advancement of Medical Instrumentation: Arlington, VA, USA, 1998. [Google Scholar]
  21. Shah, A.; Singh, D.; Mohamed, H.G.; Bharany, S.; Rehman, A.U.; Hussen, S. Electrocardiogram Analysis for Cardiac Arrhythmia Classification and Prediction through Self Attention Based Auto Encoder. Sci. Rep. 2025, 15, 9230. [Google Scholar] [CrossRef]
  22. Zhou, Z.H.; Feng, J. Deep Forest: Towards An Alternative to Deep Neural Networks. arXiv 2017, arXiv:1702.08835. [Google Scholar] [CrossRef]
  23. Lundberg, S.M.; Erion, G.; Chen, H.; DeGrave, A.; Prutkin, J.M.; Nair, B.; Katz, R.; Himmelfarb, J.; Bansal, N.; Lee, S.-I. From Local Explanations to Global Understanding with Explainable AI for Trees. Nat. Mach. Intell. 2020, 2, 56–67. [Google Scholar] [CrossRef]
Figure 1. Conceptual diagram showing an overview of the ECG classification pipeline.
Biomedinformatics 06 00033 g001
Figure 2. Visual comparison of feature extraction pipelines showing signal flow from raw ECG through each method to the final feature vector.
Biomedinformatics 06 00033 g002
Figure 3. Class distribution of the training partition before and after SMOTE application. (a) Original imbalanced distribution (87,595 beats): Normal (N) beats comprise 82.8% of the training set; minority classes range from 0.4% (Fusion, F) to 7.3% (Unknown, Q). (b) SMOTE-balanced training distribution (362,525 beats): synthetic samples generated via k-nearest neighbour interpolation (k = 5) equalise all five classes to approximately 20% each (~72,505 samples per class).
Biomedinformatics 06 00033 g003
Figure 4. Overall performance comparison across all tested models. The DWT (Cascade) model demonstrates a clear advantage in accuracy, macro-precision, and F1 score. All models are Cascade Forest classifiers, except DWT(Plain), which is a Random Forest-based model. All feature extractors were combined with 7 extracted RR-features before modelling, except the Baseline, which used only RR-features.
Biomedinformatics 06 00033 g004
Figure 5. Bar chart showing execution time comparison across all methods, highlighting DWT and SSWT’s computational burden.
Biomedinformatics 06 00033 g005
Table 1. Summary of representative ECG feature extraction studies showing method, classifier, dataset, and key performance metrics, highlighting the lack of controlled comparisons.
a. Representative single-method ECG arrhythmia classification studies (without direct feature comparison)
StudyFeature MethodClassifierDatasetReported PerformanceKey Limitation
[10]DWTgcForestMIT-BIHAcc: 98.55%, F1: 98.46%No alternative feature methods evaluated
[15]MFCCk-NNMIT-BIHAcc: 93.50%No comparison with time–frequency methods
[14]HHT (EMD + Hilbert)SVMMIT-BIHSensitivity: 94.2% (ischemia)Focused on ischemia; no arrhythmia comparison
[12]SSWTNeural NetworkMIT-BIHAcc: 98.10%No systematic comparison with standard wavelets
b. Multi-method studies with confounding factors
StudyFeature MethodsClassifiersDatasetPerformance SummaryKey Limitation
[17]STFT, CWT, SSWTCNN (varying architectures)MIT-BIH, PTB-XLPerformance varied across feature–classifier pairsFeature and classifier varied simultaneously
[8]Time, Frequency, Time–FrequencyMultipleReview only; no experiments
[9]DWT, EMD, WVD, STFTMultipleTheoretical comparison only
[16]MFCC + Raw SignalDeep CNNChapman, CPSCAcc: 95.3%, F1: 93.7%MFCC used as auxiliary input, not primary comparison
Table 2. ANSI/AAMI EC57:1998 class mapping showing superclass definitions, constituent beat annotations, and clinical significance [19].
ClassAAMI CategoryBeat AnnotationsDescription
NNormal‘N’, ‘L’, ‘R’, ‘e’, ‘j’Normal and bundle branch block beats
SSupraventricular Ectopic Beat (SVEB)‘A’, ‘a’, ‘J’, ‘S’Atrial or nodal premature beats
VVentricular Ectopic Beat (VEB)‘V’, ‘E’Premature ventricular contractions
FFusion Beat‘F’Fusion of ventricular and normal beats
QUnknown Beat‘/’, ‘f’, ‘Q’Paced, unclassifiable, or artefact beats
Table 3. Overall performance comparison of feature extraction methods for ECG arrhythmia classification.
MethodModelNo FeaturesExec. Time (s)Accuracy (%)Macro-Precision (%)Macro-Recall (%)Macro-F1 (%)
BaselineCF71737.3995.9278.0882.5779.91
SSWTCF719711.5497.4986.6382.7284.54
MFCCCF273776.8498.0089.9986.9288.30
DWTCF21210,050.1198.7994.3991.6792.93
HHTCF676237.7896.9486.1081.9883.59
Note: CF = Cascade Forest; Time = total execution time, including feature extraction, training, and prediction. All methods use an identical Cascade Forest (CF) classifier trained on SMOTE-balanced data from the MIT-BIH Arrhythmia Database (80/20 stratified split). Accuracy is overall (sample-weighted); Precision, Recall, and F1 score are macro-averaged across all five ANSI/AAMI arrhythmia classes (N, S, V, F, Q), treating each class equally regardless of prevalence. Execution time includes feature extraction, model training, and prediction on the full dataset. Methods are ranked by macro-F1 score. Bolded model (DWT) has the best performing metrics.
Table 4. Per-class performance metrics (Precision/Recall/F1 score) matrix for all feature extraction methods across all five ANSI/AAMI arrhythmia classes.
ClassSSWT (P/R/F1)MFCC (P/R/F1)DWT (P/R/F1)HHT (P/R/F1)Baseline (P/R/F1)
N0.98/0.99/0.990.99/0.99/0.990.99/0.99/0.990.98/0.98/0.980.98/0.97/0.98
S0.93/0.84/0.880.91/0.88/0.900.91/0.90/0.900.85/0.83/0.840.85/0.87/0.86
V0.90/0.88/0.890.91/0.93/0.920.96/0.97/0.960.88/0.91/0.890.82/0.86/0.84
F0.53/0.44/0.480.69/0.56/0.620.87/0.74/0.800.63/0.42/0.500.28/0.45/0.34
Q0.99/0.99/0.990.99/0.98/0.980.99/0.98/0.990.96/0.96/0.960.97/0.97/0.97
Note: P = Precision, R = Recall, F1 = F1 score. Metrics are reported as class-specific (not macro-averaged) values derived from the held-out test set (20% of the MIT-BIH dataset, original imbalanced distribution preserved).
Disclaimer/Publisher’s Note: The statements, opinions and data contained in all publications are solely those of the individual author(s) and contributor(s) and not of MDPI and/or the editor(s). MDPI and/or the editor(s) disclaim responsibility for any injury to people or property resulting from any ideas, methods, instructions or products referred to in the content.