1. Introduction
Bacterial Vaginosis (BV) is a common disruption of the vaginal microbiome in women of reproductive age [
1,
2,
3]. During pregnancy, it is associated with various gynecological and obstetric complications, including miscarriage, preterm delivery, premature rupture of membranes, and postcesarean endometritis [
3,
4,
5]. Globally, BV affects an estimated 5–49% of pregnant women, with variations depending on the region and diagnostic criteria [
1,
4,
6]. Symptoms typically include grayish, watery, and foul-smelling vaginal discharge that often worsens after sexual intercourse [
1,
3,
4].
Several studies aimed at identifying bacteria associated with Bacterial Vaginosis (BV) have employed techniques such as feature selection, clustering, association rules, and Bayesian networks [
7,
8,
9,
10]. However, these approaches primarily identify associations or groupings of bacteria and do not explicitly assess their relative influence on BV diagnosis, nor do they analyze relationships across different diagnostic states. Path Analysis (PA), defined in [
11,
12,
13], was applied in [
14] to a dataset of pregnant women from the state of Tabasco, Mexico [
15], which includes the diagnosis of bacterial vaginosis without
Mycoplasma hominis (DxVBNoMh) across three diagnostic categories: normal microbiota (BV−), indeterminate (I), and BV-positive (BV+). That study considered only the BV− and BV+ categories. This analysis produced a Causal Graphical Model (CGM), derived from a structural modeling framework, in which
Mycoplasma hominis (Mh),
Atopobium vaginae (Av),
Gardnerella vaginalis (Gv),
Megasphaera Type 1 (MT1), and
Bacterial Vaginosis-Associated Bacterium Type 2 (BVAB2) were associated with BV, identifying the bacterial species with the greatest influence on diagnosis.
Building on [
14] and using the same dataset [
15], this study extends the previous framework by incorporating the intermediate (I) state. Here, “transitions” refer to analytical comparisons between diagnostic states rather than temporal changes. These transitions do not imply temporal relationships, but rather structured comparisons across diagnostic states within a cross-sectional framework. As this is an observational cross-sectional dataset, unmeasured confounding cannot be excluded. Accordingly, two Causal Graphical Models (CGMs), derived from the proposed structural equations, were developed: the first examines the relationship between bacterial profiles and the BV− and I states, and the second examines the relationship between the same bacterial variables and the I and BV+ states. This approach enables the characterization of association patterns between diagnostic states within a cross-sectional framework and allows the identification of the bacterial species with the greatest influence at each stage.
In the first model (BV− to I), Av (0.0260), Gv (0.0388), and MT1 (0.3184) were associated with the transition to the intermediate state, with MT1 making the most significant contribution. In contrast, Mh and BVAB2 exhibited negative effects (−0.4400 and −0.0188, respectively), indicating that they do not promote change at this stage. In the second model (I to BV+), Av (0.6260) and BVAB2 (0.3800) emerged as the most influential variables in the progression toward bacterial vaginosis-positive (BV+), with Av predominating. Mh (0.1256) also contributed to the transition, MT1 (0.1164) showed a minor effect, and Gv (−0.0138) exhibited a negligible effect at this stage. These phase-specific patterns show that the relevance of each bacterial agent is state-dependent, supporting the need to explicitly model microbiota transitions to better understand patterns associated with BV+.
The remainder of this article is organized as follows:
Section 2 describes the materials and methods used.
Section 3 presents the experimental design, highlighting the application of PA for constructing CGMs.
Section 4 details the results, emphasizing the bacterial species most influential in the diagnosis of BV.
Section 5 discusses the findings in relation to previous studies. Finally,
Section 6 summarizes the main conclusions of the study.
3. Experimental Study
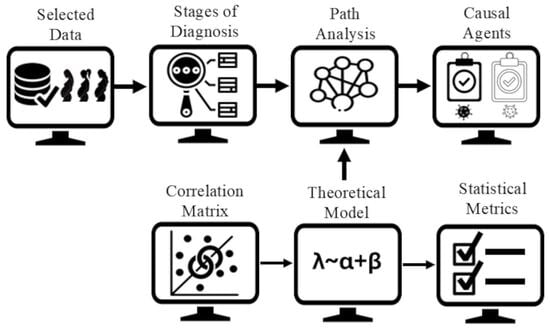
The study was conducted following the steps illustrated in
Figure 1: (a) Selected data, (b) stages of diagnosis, (c) correlation matrix, (d) theoretical models, (e) statistical metrics, (f) causal graphical models, and (g) microbiologist evaluation. All procedures were implemented in R (v. 4.3.2, Windows 11) using statistical functions and the packages lavaan (for path analysis) and semPlot (for structural visualization).
(a) Selected Data: The dataset consisted of the bacteria Mycoplasma hominis (Mh), Atopobium vaginae (Av), Gardnerella vaginalis (Gv), Megasphaera Type 1 (MT1), and Bacterial Vaginosis-Associated Bacterium Type 2 (BVAB2), together with the diagnosis of Bacterial Vaginosis without Mycoplasma hominis (DxVBNoMh), distributed across 132 instances. The clinical diagnosis was classified into three categories: normal microbiota (BV−), indeterminate (I), and BV-positive (BV+).
(b) Stages of Diagnosis: To explore transition patterns toward a positive diagnosis of bacterial vaginosis (BV+) and to identify which bacterial profiles have the greatest influence on progression to BV+, path analysis was performed by grouping the diagnosis into two sequential stages. The first stage included cases classified as BV− and I, whereas the second comprised I and BV+ cases. This segmentation enabled modeling of the transitional behavior of bacterial variables, considering the indeterminate state as an intermediate point between normal microbiota and confirmed BV.
(c) Correlation Matrix: As a preliminary step to path modeling, Spearman correlation matrices were calculated between the bacterial species and the diagnosis at each stage, as described above, to identify the microbial profiles most associated with each diagnostic transition.
Figure 2 shows the correlation between bacteria and the diagnosis BV– and I, where stronger associations correspond to higher absolute correlation values; Mh exhibits the highest positive correlation (0.48). In
Figure 3, corresponding to the diagnosis I and BV+, BVAB2 shows the strongest association with diagnosis (−0.49).
(d) Theoretical Models: Based on the correlation matrices shown in
Figure 2 and
Figure 3, the theoretical models defined by Equations (
2) and (
3) were established. In model (
2), the symbol ∼ denotes a directional relationship, where the variable on the left is explained by those on the right. The first line specifies that the diagnosis of bacterial vaginosis without the presence of
Mycoplasma hominis (DxVBNoMh) is estimated from five bacterial variables: Mh, Av, Gv, MT1, and BVAB2. In subsequent lines, Mh is modeled as a dependent variable influenced individually by each of the other bacteria. This specification was based on the correlation analysis, where Mh showed the strongest association with the diagnosis in this stage. Thus, Mh is treated as a central variable within the model structure to represent potential associations among bacterial variables and the diagnosis. Similarly, model (
3) was derived, in which BVAB2 appears as the dependent variable, given its stronger association with the diagnosis at this stage.
(e) Statistical Metrics: Model (
2) and model (
3) were evaluated using the statistical metrics shown in
Table 1. The results for both models are presented in
Table 3, where identical values were observed. These results indicate that the proposed theoretical models meet the established goodness-of-fit criteria, showing consistency across the evaluated metrics.
(f) Causal Graphical Models: The causal graphical models (
Figure 4 and
Figure 5) were derived from the previously described models, illustrating the relationships between bacterial variables and diagnosis. These models allowed the identification of the bacterial species with the greatest influence in each diagnostic transition. For simplicity in the R implementation, some variable names were abbreviated: DxVBNoMh as DVB and BVAB2 as BVA. The total effect was calculated as the algebraic sum of the direct and indirect effects, with the latter obtained by multiplying the coefficients associated with the connecting arrows. In the path diagram (
Figure 4), Av shows a direct effect on DVB of
and indirect effect mediated by Mh. The indirect effect was computed as
, resulting in a total effect of
. This reflects both a direct effect and a mediated relationship through Mh.
Similarly, in the path diagram (
Figure 5),
Mh shows a direct effect on DVB of
and an indirect effect mediated by BVA. The indirect effect was calculated as
, yielding a total effect of
. This reflects the combination of direct and mediated effects through BVA. The same procedure was applied to the other variables, allowing for an assessment of their individual and mediated contributions to DVB. In
Table 4, the total effects derived from
Figure 4 and
Figure 5 are presented.
Table 5 and
Table 6 present the classification of total effects and their biological interpretation. The classification was performed following the ranges proposed by Hair et al. [
33], considering the absolute magnitude of the coefficients. The direction of each effect (positive or negative) was analyzed in terms of its potential clinical relevance to the diagnosis of BV. This allows the integration of statistical interpretation with the biological relevance observed at each stage of the model.
(g) Microbiologist Evaluation: CGMs
Figure 4 and
Figure 5 were presented to a clinical microbiologist for interpretation and validation of the relationships identified in the transitions between normal microbiota (BV−), indeterminate state (I), and BV-positive (BV+), including the identification of the most influential bacteria at each stage. The expert assessed the relationships by considering their biological plausibility, clinical coherence, and alignment with the literature. Analysis of both stages suggests a progressive microbiological pattern toward the characteristic dysbiosis of BV. In the early phase (BV− to I), MT1 is a bacterium that is associated with the transition, whereas Mh shows no relevant participation. In the advanced stage (I to BV+), BVAB2 and Av emerge as predominant markers of the transition toward a clinical BV+ state, reflecting a dysbiotic profile. At this point, Mh shows a change by co-occurring with other species in the development of established dysbiosis. Gv exhibits a variable role that depends on the state of the microbiological profile.
4. Results
Data from pregnant women who participated in a healthy pregnancy campaign in Tabasco (2018–2020), tested for BV, were analyzed. The dataset used in the study comprises 132 instances and includes five bacterial species: Mycoplasma hominis (Mh), Atopobium vaginae (Av), Gardnerella vaginalis (Gv), Megasphaera Type 1 (MT1), and Bacterial Vaginosis-Associated Bacterium Type 2 (BVAB2), all associated with the DxVBNoMh diagnosis, which is classified into three categories: normal microbiota (BV–), indeterminate (I), and bacterial vaginosis-positive (BV+). To analyze bacterial behavior in relation to diagnostic progression toward BV+, two stages were considered: BV− to I, and I to BV+. Path analysis was used to construct theoretical models, evaluated using standard fit indices (RMSEA = 0.00, SRMR = 0.00, GFI = 1.00, NFI = 1.00, CFI = 1.00). Although these values meet conventional criteria, they result from the models being just-identified (zero degrees of freedom) and should not be interpreted as evidence of superior fit. Given the sample size (n = 132), model complexity was kept low to ensure stable parameter estimation. Based on these models, CGMs were generated to visualize relationships among bacteria and BV diagnosis, and their interpretation was supported by evaluation from a clinical microbiologist.
The total effects of each bacterial species on diagnoses were estimated from the CGMs, showing variations across transition stages. During the shift from BV− to I, MT1 (moderate, 0.3184), Av (weak, 0.0260), and Gv (very weak, 0.0388) exhibited positive effects, suggesting their association with early stages of vaginal imbalance. In contrast, Mh showed a notable negative effect (−0.4400) and BVAB2 a weak negative effect (−0.0188), indicating no contribution to changes at this stage.
In the transition from I to BV+, Mh showed a positive effect (0.1256), suggesting its association with the dysbiosis pattern, while MT1 remained positively associated (0.1164). Av showed a strong positive effect (0.6260), followed by BVAB2 (0.3800), both associated with progression toward more advanced dysbiosis. Gv displayed a slight negative effect (−0.0138), suggesting less consistent involvement. These results highlight bacterial profiles with potential relevance for BV diagnosis. Clinical evaluation supported that the CGMs provide a useful representation of bacterial relationships during the transition to BV+, supporting the use of model-based causal approaches in microbiological research. PA across diagnostic stages allowed the visualization of model-based causal relationships and the magnitude of bacterial effects associated with BV progression. Av and BVAB2 emerged as the main variables associated with the transition toward BV+, with Av showing the strongest effect within the model. These findings support the potential relevance of bacterial profiles and highlight the utility of CGMs for representing microbiological relationships.
5. Discussion
The present study provides new insights into the microbial patterns associated with BV in pregnant women, a population of particular clinical relevance due to their susceptibility to obstetric complications. By applying path analysis (PA) to generate CGMs, it was possible to visualize model-based associations and quantify the relationships of specific bacterial species across diagnostic transitions. This analysis, conducted using PA and comparisons across diagnostic categories, allows the identification of stage-dependent patterns of association between bacterial species and BV diagnosis, offering insight into how microbial relationships vary across transitions, thereby contributing to the understanding of their involvement in BV+. Although the models allow the visualization of structured relationships, the findings should be interpreted as associative rather than causal, reflecting relationships between bacterial species and BV diagnosis across stages without establishing directionality.
During the transition from BV− to I, MT1, Av, and Gv showed positive associations, suggesting a possible link with early stages of vaginal imbalance. In contrast, Mh and BVAB2 showed negative associations, suggesting limited involvement at this stage. These findings indicate that dysbiosis may not occur uniformly across species but rather through selective microbial patterns. In the subsequent transition from I to BV+, the pattern changed. Mh shifted from a negative to a positive effect, suggesting a potential link with BV+, whereas MT1 maintained a moderate positive association. Av and BVAB2 showed strong positive association, supporting their relevance as markers associated with BV+. In contrast, Gv showed a weak negative association, suggesting less consistent involvement. Overall, these findings highlight the relevance of Av and BVAB2 in relation to BV+, with Av showing the strongest association within the model.
These results are consistent with previous studies identifying Av and BVAB2 as key markers associated with vaginal microbiota imbalance and clinical BV states, supporting their potential relevance in diagnostic contexts [
3,
14,
34]. Moreover, CGMs proved useful for representing both direct and indirect relationships among bacterial species, supporting their value as visual and analytical tools for exploring microbial patterns.
A limitation of this study is its cross-sectional design, which limits the ability to establish temporal relationships among the microbial interactions represented in the models. Additionally, the variable selection was based on the strength of association with the diagnosis, prioritizing those variables showing the highest correlation. Although this approach allowed the identification of the most relevant bacterial profiles, other clinical, behavioral, or sociodemographic factors available in the dataset were not included in the models. Therefore, potential confounding effects cannot be completely ruled out, and the results should be interpreted within the scope of the selected variables. Future studies could incorporate these variables to further refine the understanding of the observed relationships.
Although the sample size (n = 132) is modest for structural equation modeling, it represents real clinical data from a specific population, providing valuable insight into microbial patterns associated with BV. A parsimonious model specification was adopted to support stable parameter estimation. Therefore, the findings should be interpreted with caution, and future studies with larger samples are needed to validate these results. Overall, this study contributes to the understanding of associations between specific bacterial species and BV, highlighting bacterial profiles with potential relevance for diagnosis and providing a methodological framework for future investigations into microbial dysbiosis.
Author Contributions
Conceptualization, M.G.-A. and J.C.-R.; methodology, M.G.-A.; software, M.G.-A.; validation, J.C.-R., L.M.X.R.-H. and E.N.D.l.C.-H.; formal analysis, M.G.-A., J.C.-R. and L.M.X.R.-H.; investigation, M.G.-A.; resources, M.G.-A.; data curation, M.G.-A. and J.C.-R.; writing—original draft preparation, M.G.-A.; writing—review and editing, J.C.-R. and L.M.X.R.-H.; visualization, J.C.-R. and L.M.X.R.-H.; supervision, L.M.X.R.-H.; project administration, J.C.-R.; funding acquisition, none received. All authors have read and agreed to the published version of the manuscript.
Funding
This research was partially funded by the Secretariat of Science, Humanities, Technology, and Innovation (SECIHTI) through scholarship number 842958.
Institutional Review Board Statement
Ethical review and approval were waived for this study due to the use of secondary data provided by DAMC-UJAT, with no direct involvement of human participants by the authors.
Informed Consent Statement
Informed consent for participation was not required as per institutional policy, since the authors did not collect data directly from human subjects.
Data Availability Statement
The data presented in this study are available on request from the corresponding author due to the data privacy.
Conflicts of Interest
The authors declare no conflicts of interest.
Abbreviations
The following abbreviations are used in this manuscript:
| BV | Bacterial Vaginosis |
| BV− | Normal Microbiota |
| BV+ | Positive Bacterial Vaginosis |
| Mh | Mycoplasma hominis |
| Av | Atopobium vaginae |
| MT1 | Megasphaera Type 1 |
| Gv | Gardnerella vaginalis |
| BVAB2 | Bacteria Associated with Bacterial Vaginosis Type 2 |
| DxVB | Diagnosis of Bacterial Vaginosis |
| DxVBNoMh | Diagnosis of Bacterial Vaginosis without the presence of Mycoplasma hominis |
| RMSEA | Root Mean Square Error of Approximation |
| SRMR | Standardized Root Mean Square Residual |
| GFI | Goodness of Fit Index |
| NFI | Normalized Fit Index |
| CFI | Comparative Fit Index |
| PA | Path Analysis |
| SEM | Structural Equation Models |
| DAG | Directed Acyclic Graph |
| CGMs | Causal Graphical Models |
| UJAT | Universidad Juárez Autónoma de Tabasco |
References
- Sethi, N.; Narayanan, V.; Saaid, R.; Ahmad Adlan, A.S.; Ngoi, S.T.; Teh, C.S.J.; Hamidi, M.; on behalf of WHOW Research Group. Prevalence, risk factors, and adverse outcomes of bacterial vaginosis among pregnant women: A systematic review. BMC Pregnancy Childbirth 2025, 25, 40. [Google Scholar] [CrossRef]
- Das, S.; Basanti, N.; Singh, Y.A.; Kulnu, N. Pregnancy outcome in women with bacterial vaginosis. Int. J. Reprod. Contracept. Obstet. Gynecol. 2024, 13, 922–925. [Google Scholar] [CrossRef]
- Mendling, W.; Palmeira-de-Oliveira, A.; Biber, S.; Prasauskas, V. An update on the role of Atopobium vaginae in bacterial vaginosis: What to consider when choosing a treatment? A mini review. Arch. Gynecol. Obstet. 2019, 300, 1–6. [Google Scholar] [CrossRef]
- Morelli, I.; Gamboa, S. Vaginosis bacteriana en el embarazo: últimos avances hasta la fecha. Rev. Méd. Sinerg. 2022, 7, e838. [Google Scholar] [CrossRef]
- Mina-Ortiz, J.B.; Franco-Macias, M.O.; Santana-Mariscal, L.A.; Garcia-Ortega, M.G. Impact on maternal and fetal health of adolescent pregnant women with bacterial vaginosis. J. Sci. MQR Investig. 2024, 8, 5241–5264. [Google Scholar] [CrossRef]
- Park, F.J.; Rosca, A.S.; Cools, P.; Chico, R.M. Prevalence of bacterial vaginosis among pregnant women attending antenatal care in low- and middle-income countries between 2000 and 2020: A systematic review and meta-analysis. Reprod. Female Child Health 2024, 3, e99. [Google Scholar] [CrossRef]
- Pérez-Gómez, J.F.; Canul-Reich, J.; De-La-Cruz-Hernández, E. Combination of rankings as a method for biomarker identification of bacterial vaginosis. Res. Comput. Sci. 2020, 149, 915–927. Available online: https://dblp.org/rec/journals/rcs/Perez-GomezCD20 (accessed on 15 July 2025).
- Hernández, H.; Canul, J.; Cruz, E. An agglomerative hierarchical clustering approach to identify coexisting bacteria in groups of bacterial vaginosis patients. Intell. Data Anal. 2023, 27, 583–611. [Google Scholar] [CrossRef]
- Cruz, F.; Canul, J.; Rivera, R.; Cruz, E. Impact of data balancing a multiclass dataset before the creation of association rules to study bacterial vaginosis. Intell. Med. 2024, 4, 188–199. [Google Scholar] [CrossRef]
- Bautista Hernández, C.M.; Canul Reich, J.; López Ramírez, C.; De la Cruz Hernández, E. Un modelo de Red Bayesiana para datos cualitativos de Vaginosis Bacteriana en mujeres embarazadas. Ideas Cienc. Ing. 2024, 2, 62–77. [Google Scholar] [CrossRef]
- Sucar, L.E. Probabilistic Graphical Models: Principles and Applications, 2nd ed.; Springer: Cham, Switzerland, 2020. [Google Scholar]
- Sagaró, N.; Zamora, L. Métodos gráficos en la investigación biomédica de causalidad. Rev. Electrón. Dr. Zoilo Mar. Vidaurreta 2019, 44. Available online: https://revzoilomarinello.sld.cu/index.php/zmv/article/view/1846 (accessed on 3 August 2025).
- Brand, Y. Modelos de Ecuaciones Estructurales: Conceptos y Aplicaciones. Ph.D. Thesis, Universidad Nacional de Colombia, Bogotá, Colombia, 2021. Available online: https://repositorio.unal.edu.co/bitstream/handle/unal/80064/1059705148.2021.pdf (accessed on 16 August 2025).
- García-Avalos, M.; Canul-Reich, J.; Rodríguez-Henríquez, L.M.X.; De la Cruz-Hernández, E.N. Causal Graphical Model of Bacterial Vaginosis in Pregnant Women. Diseases 2025, 13, 375. [Google Scholar] [CrossRef]
- Abundis, E.M.; Hernandez-Landero, F.; Escobar-Calderon, G.; Gomez-Crisostomo, N.; Contreras-Paredes, A.; de la Cruz-Hernandez, E. Gene expression of cardiovascular risk markers in mononuclear cells of pregnant women in relation to plasma leptin and homocysteine levels: A cross-sectional study. Int. J. Gynaecol. Obstet. 2024, 165, 350–360. [Google Scholar] [CrossRef]
- Apaza, E.; Cazorla, S.; Condori, C.; Arpasi, F.; Tumi, I.; Yana, W.; Quispe, J. Correlación de Pearson o Spearman en caracteres físicos y textiles de la fibra de alpacas. Rev. Inv. Vet. Perú 2022, 33, e22908. [Google Scholar] [CrossRef]
- Mendivelso, F.; Rodríguez, M. Prueba no paramétrica de correlación de Spearman. Rev. Méd. Sanitas 2021, 24, 42–45. [Google Scholar] [CrossRef]
- Sanchez, E.; Contreras, A.; Martinez, E.; Garcia, D.; Lizano, M.; Cruz, E. Molecular epidemiology of bacterial vaginosis and its association with genital micro-organisms in asymptomatic women. J. Med. Microbiol. 2019, 68, 1373–1382. [Google Scholar] [CrossRef] [PubMed]
- Bouza, C. Análisis Exploratorios de Datos Univariados Para la Ciencia de los Datos; ResearchGate: Berlin, Germany, 2023. [Google Scholar] [CrossRef]
- Alwateer, M.; Atlam, E.; Abd, M.; Ghoneim, O.; Gad, I. Missing data imputation: A comprehensive review. J. Comput. Commun. 2024, 12, 53–75. [Google Scholar] [CrossRef]
- Rashid, W.; Gupta, M.K. A perspective of missing value imputation approaches. In Advances in Computational Intelligence and Communication Technology: Proceedings of CICT 2019; Springer: Singapore, 2021; Volume 1086, pp. 307–315. [Google Scholar] [CrossRef]
- Luzuriaga Jaramillo, H.A.; Espinosa Pinos, C.A.; Haro Sarango, A.F.; Ortiz Román, H.D. Histograma y distribución normal: Shapiro–Wilk y Kolmogorov–Smirnov aplicado en SPSS. LATAM Rev. Lat. Cienc. Soc. Humanid. 2023, 4, 596–607. [Google Scholar] [CrossRef]
- Platas, V. Contrastes de Normalidad. Ph.D. Thesis, Universidad de Santiago de Compostela, Santiago de Compostela, Spain, 2021. Available online: https://minerva.usc.gal/rest/api/core/bitstreams/c8efafac-12ac-446a-9443-bb3ca39fa5f0/content (accessed on 2 September 2025).
- Tortora, G.J.; Funke, B.R.; Case, C.L. Microbiology: An Introduction, 14th ed.; Pearson: San Francisco, CA, USA, 2021; Available online: https://www.pearson.com/en-us/subject-catalog/p/microbiology-an-introduction/P200000005614 (accessed on 11 September 2025).
- Lepera, A. Introducción a los modelos de ecuaciones estructurales y su implementación en R mediante un ejemplo. Rev. Investig. Model. Matemáticos Apl. Gestión Econ. 2021, 1, 15–37. [Google Scholar]
- Civelek, M.E. Essentials of Structural Equation Modeling; Zea E-Books; University of Nebraska–Lincoln: Lincoln, NE, USA, 2018; Available online: https://digitalcommons.unl.edu/zeabook/64 (accessed on 28 September 2025).
- Cortés, F. Observación, causalidad y explicación causal. Perfiles Latinoam. 2018, 26, 1–20. [Google Scholar] [CrossRef]
- Barbeau, K.; Sarr, F.; Boileau, K.; Smith, K. Path analysis in Mplus: A tutorial using a conceptual model of psychological and behavioral antecedents of bulimic symptoms in young adults. Quant. Methods Psychol. 2019, 15, 38–53. [Google Scholar] [CrossRef]
- Manzano, A. Introducción a los modelos de ecuaciones estructurales. Investig. Educ. Méd. 2017, 7, 67–72. [Google Scholar] [CrossRef]
- Flora, D.; Crone, G.; Bell, S. Effect size interpretation in structural equation models. Struct. Equ. Model. 2025, 32, 1069–1076. [Google Scholar] [CrossRef]
- Jordan Muiños, F.M. Valor de corte de los índices de ajuste en el análisis factorial confirmatorio. Rev. Investig. Psicol. Soc. 2021, 7, 66–71. [Google Scholar]
- Castillo, A.; Ruiz, A. Entre lo observable y lo latente: Modelos de ecuaciones estructurales e investigación social. Rev. Reflex. 2025, 104, 1–27. Available online: https://www.scielo.sa.cr/pdf/reflexiones/v104n2/1659-2859-reflexiones-104-02-186.pdf (accessed on 3 October 2025).
- Hair, J.F.; Hult, G.T.M.; Ringle, C.M.; Sarstedt, M. Manual de Partial Least Squares Structural Equation Modeling (PLS-SEM), 2nd ed.; OmniaScience: Barcelona, Spain, 2019. [Google Scholar] [CrossRef]
- Castro-Castrillo, C.; Duarte-Artavia, C. Bacterial vaginosis: The role of Atopobium vaginae and other anaerobic bacteria. Cienc. Lat. Rev. Científica Multidiscip. 2025, 9, 1831–1841. [Google Scholar] [CrossRef]
| Disclaimer/Publisher’s Note: The statements, opinions and data contained in all publications are solely those of the individual author(s) and contributor(s) and not of MDPI and/or the editor(s). MDPI and/or the editor(s) disclaim responsibility for any injury to people or property resulting from any ideas, methods, instructions or products referred to in the content. |


 ,
, 


