Article

Decision Trees for the Analysis of Gene Expression Levels of COVID-19: An Association with Alzheimer’s Disease

by
Jesús Alberto Torres-Sosa
1,
Gonzalo Emiliano Aranda-Abreu
2,
Nicandro Cruz-Ramírez
3 and
Sonia Lilia Mestizo-Gutiérrez
4,*
1
Doctorado en Investigaciones Cerebrales, Universidad Veracruzana, Xalapa 91190, Veracruz, Mexico
2
Instituto de Investigaciones Cerebrales, Universidad Veracruzana, Xalapa 91190, Veracruz, Mexico
3
Instituto de Investigaciones en Inteligencia Artificial, Universidad Veracruzana, Xalapa 91097, Veracruz, Mexico
4
Facultad de Ciencias Químicas, Universidad Veracruzana, Xalapa 91000, Veracruz, Mexico
*
Author to whom correspondence should be addressed.
BioMedInformatics 2025, 5(2), 26; https://doi.org/10.3390/biomedinformatics5020026
Submission received: 27 February 2025 / Revised: 19 April 2025 / Accepted: 6 May 2025 / Published: 9 May 2025

Abstract

:
COVID-19 has caused millions of deaths around the world. The respiratory system is the main target of this disease, but it has also been reported to attack the central nervous system, creating a neuroinflammatory environment with the release of proinflammatory cytokines. There are several studies suggesting a possible relationship between Alzheimer’s disease and COVID-19. Therefore, in this study, machine learning microarray analysis was performed to identify key genes in COVID-19 that may be associated with Alzheimer’s disease. The dataset is identified as GSE177477, containing 47 samples. A bioconductor oligo package in the RStudio (version 4.3.3) environment was used to process and normalize the data. Subsequently, one-way ANOVA was used to obtain differentially expressed genes. We used decision tree generation to classify 47 samples. The study identified 1856 differentially expressed genes. Three decision trees were generated where three genes (DNAJC16, TREM1, and UCP2) were identified that differentiated patients. The best decision tree obtained an accuracy of 72.34%, with a sensitivity of 72.34% and a specificity of 86.17%. The genes identified with the decision trees may be involved in processes like those of Alzheimer’s disease, such as in the inflammation process, amyloid pathologies, and related to type 2 diabetes mellitus.

1. Introduction

In late December 2019 in Wuhan, China, a new strain of coronavirus emerged, and the International Virus Taxonomy Committee named it SARS-CoV-2 (Severe Acute Respiratory Syndrome Coronavirus 2), which causes COVID-19 [1,2]. This virus triggered a global pandemic, which began on 11 March 2020 [3]. According to World Health Organization figures, approximately 775,481,326 confirmed cases and 7,049,376 deaths have been reported worldwide as of 12 May 2024 [4]. According to the classification of coronaviruses, SARS-CoV-2 belongs to the genus of β-coronaviruses [5].
Symptoms can be variable among patients, from mild symptoms such as nasal congestion, anosmia, fever or cough to severe symptoms such as pneumonia, leading to death in some cases [6]. An important feature of COVID-19 is cytokine storm syndrome, which causes an inflammatory reaction due to excess cytokines in the immune system, becoming harmful to the body [7]. Activated macrophages can produce proinflammatory cytokines, such as Tumor Necrosis Factor-Alpha (TNF-α), Interleukin (IL) type IL-1β, IL-6, IL-8, and Interferons (IFNs) type I and II, which can trigger an inflammatory cascade in the body, resulting in acute respiratory distress syndrome (ARDS) [7,8,9]. SARS-CoV-2 infection mainly attacks the respiratory system, injuring the lungs, and resulting in death from respiratory failure or severe sequelae in patients who manage to recover [9].
Additionally, it has been shown that the virus can also invade the central nervous system (CNS), causing some neurological manifestations including loss of smell (anosmia), loss of taste (hypogeusia), brain swelling, disorientation, and stroke, among others [8,10,11,12]. The potential pathway for SARS-CoV-2 to reach the brain is through the olfactory pathway, since it expresses a large number of Angiotensin-Converting Enzyme 2 (ACE2), and once having entered, the virus travels throughout the olfactory nerve. This is because ACE2 is recognized as the receptor for the virus to bind to the cell through its Spike (S) protein, thus provoking the activation of the immune response in the initial phase through its co-receptor called Transmembrane Serine Protease 2 (TMPRSS2) [8,13]. But there may also be other pathways through which the virus can reach the brain, such as the taste buds that run along the facial and glossopharyngeal nerve and through the vagus nerve, since it is connected to the respiratory system [9]. Recently, it has been suggested that SARS-CoV-2 may contribute to increased neuroinflammation in the brain of Alzheimer’s disease patients [14].
Alzheimer’s disease (AD) is a neurodegenerative disease characterized mainly by progressive deterioration of cognitive functions, memory loss, and personality changes [15]. It is the leading cause of dementia worldwide. According to the Alzheimer’s Association, it accounts for 60% to 80% of dementia cases [16], with approximately 50 million people affected [17,18]. It is estimated that by 2050, this number will increase to 139 million people as society ages, which would imply that the costs associated with this disease will also double [18]. AD is a progressive disease, i.e., it worsens over time and the rate at which it progresses varies in each individual [19]. Its most important features are accumulation of beta-amyloid protein outside neurons, abnormal accumulation of tau protein inside neurons, and neuroinflammation, all leading to the damage and destruction of neurons [17,19,20,21]. Risk factors have been identified that may increase the possibility of developing AD, with age being the main risk factor, since most people with this type of dementia are 65 or older. Another risk factor is genetics, where the gene identified with the greatest impact on sporadic AD is APOE-4 [16]; this APOE-4 genotype can increase the risk of developing AD up to 15 times [22].
In addition, given that AD is a public health problem recognized by the World Health Organization (WHO) [23] and due to the recent COVID-19 pandemic that has caused millions of cases of infection around the world, studies have mentioned that COVID-19 has had a greater impact on the elderly population, especially people with dementia, in which patients with AD are seven times more likely to be infected with COVID-19 [24] and where it has been reported that both diseases share characteristics. One feature shared by both diseases is neuroinflammation, due to the fact that microglia can cause increased expression of cytokines, especially IFN, which produces an inflammatory environment [17,25]. Another characteristic that could be associated with both diseases is the APOE4 gene [26,27]. According to studies, people with APOE4 show high plasma levels of proinflammatory cytokines, an important feature of SARS-CoV-2 [28]. Proinflammatory cytokines are still being studied; one study proposes that IFN-1 is dysregulated along the olfactory pathway extending to the amygdala, which could be a mechanism for cognitive impairment; furthermore, the following genes are involved in this pathway: HLA-C, HLA-B, HLA-A, PSMB8, IFITM3, HLA-E, IFITM1, OAS2, and MX1, which are associated with an increased risk of AD [29]. The IFN-1 response has been identified as a molecular axis in the progression of AD, through the relationship in microglia responses to IFN-1 and its potential to drive amyloidogenic cascades [30], but SARS-CoV-2 virus evokes a cytokine response, including IFN-1 and IFN-III, with one study observing that patients with severe COVID-19 expressed increased IFN [31]. Studies attribute the inflammatory process associated with amyloid deposition formation in AD to microglia [32]. During COVID-19, many of the mechanisms involved in neuroinflammation are the result of systemic inflammation and activation of cells such as astrocytes and microglia [33].
Therefore, the aim of the study is to explore the genes of healthy patients and those with symptomatic and asymptomatic COVID-19 in order to generate machine learning models and identify genes that could be associated with AD, using a microarray dataset. Currently, microarrays are used in the biological area, as they allow the measurement of gene expression from different tissues that provide us with information on thousands of genes [34]. In study [8], they employ microarrays from 80 samples, with 37 samples from healthy patients and 43 from SARS-CoV-2 infected people, to identify genes that play an important role in the generation of cytokines involved in COVID-19. The study used a Student’s t-test to identify genes with a high expression level and identified ELANE and LTF as genes that are involved in the generation of cytokine storm. Microarrays have also been used to investigate molecular factors that may influence the development of SARS-CoV-2 and Alzheimer’s disease with gene expression data in which, through the construction of a protein–protein interaction network, 26 core genes were identified that may indicate similar mechanisms in both diseases [35]. In another study performed in search of shared genes between COVID-19 and AD, researchers analyzed microarray data using differential expression analysis techniques, weighted gene co-expression network analysis, and machine learning methods (Random Forest), and managed to identify eight core genes: ME3, SLC9A6, PCYOX1L, PRR11, GAS2L1, EIF3H, BCL6, and TTC19 [36]. A recent study, using microarrays from a COVID-19 patient, non-COVID-19 sepsis patient, and healthy control subjects, applied a Random Forest classifier, where they identified nine core proteins: PF4V1, NUCB1, CrkL, SerpinD1, Fen1, GATA-4, ProSAAS, PARK7, and NET1 [37].

2. Materials and Methods

2.1. Microarray Collection

The dataset was obtained from the Gene Expression Omnibus (GEO) of the National Center for Biotechnology Information (NCBI) [38]. We used GSE177477, an RNA microarray published by [39]. It contains 47 peripheral blood samples from Homo sapiens, divided into 11 symptomatic, 18 asymptomatic, and 18 control samples developed with Affymetrix Clariom S Assay, Human technology. The database was chosen based on several criteria: (1) availability at that time of data for both control individuals and patients with COVID-19 (asymptomatic and symptomatic); (2) that the samples corresponded to Homo sapiens; (3) that the RAW files were available in CEL format; and (4) that the samples were obtained from peripheral blood.

2.2. Data Processing

The obtained dataset was preprocessed and normalized using the “oligo” package in the R Studio (version 4.3.3) environment [40,41]. To process the raw data from the expression arrays, the Robust Multi-array Average (RMA) algorithm was used, as it performs background correction followed by quantile normalization and finally data summarization by median polish; the result of RMA is an object of the ExpressionSet class [42]. Oligonucleotide microarrays have a particular feature that is, to complete a gene, several probes must be grouped together, which is called a group set, and each probe has a length of 25 oligonucleotides [43]. To obtain the complete gene, the probes were joined from the average performed in RStudio.

2.3. Statistical Analysis

The statistical analysis of differentially expressed genes was performed by one-way ANOVA (Analysis Of Variance) using the genomic data exploration tool Multi-Experiment (MeV v.4.9.0) [44].

2.4. Decision Tree

Decision trees are predictive models whose objective is inductive learning from observations and logical constructs. A decision tree generates rules for data classification and has high interpretation power. A tree is represented by a set of nodes, leaves, and branches. The root node is the most significant attribute and the one that initiates the classification process. The internal nodes represent each of the questions about the attribute of the problem. The branches coming out of each of these nodes are labeled with the possible values of the attribute. The terminal nodes or leaf nodes correspond to a decision, which matches one of the class variables of the problem to be solved [45,46]. Some of the most widely used classification algorithms are ID3 and C4.5, which is a successor of ID3. These algorithms work with a heuristic called information gain and gain ratio, respectively [47]. Entropy is used to measure the amount of impurity in a dataset; then, the entropy H of a set of probabilities pi is [48]:
Entropy p = - i = 1 p i log 2 p i
Information gain is the complement of entropy [48], as shown in the following equation:
Gain S , F = Entropy S = - f values F S f S Entropy S f
where S is the set of examples, F is a possible feature from the set of all possible features, and |Sf| is a count of number of members of S that have the value f for feature F.
For the classifier, we evaluate the performance using the following measures [49]:
  • Accuracy: the total number of correct classifications divided by the size of the corresponding test set.
  • Sensitivity: ability to correctly identify patients with asymptomatic and symptomatic COVID-19.
  • Specificity: ability to correctly identify patients who do not have COVID-19.
Decision trees are classification models that stand out for their simplicity and ease of interpreting the data. Individual trees are easy to understand, and interpretability is further enhanced by the ability to select or rank the attributes according to their relevance for predicting output. The main drawback of ensemble methods (e.g., Random Forest) is that they can compromise interpretability and efficiency compared to the standard single decision tree method, although they often improve accuracy very significantly [50].

3. Results

ANOVA analysis showed statistically significant difference with a p-value < 0.01 in 1856 genes analyzed of the 19,458. Table 1 shows the first 10 genes.
Three decision trees were generated with different sets of genes, using the C4.5 algorithm, also known as the J48 algorithm in the WEKA [51], with Leave-One-Out cross-validation (LOOVC), a validation used to evaluate the performance of a classification algorithm when the number of instances in a dataset are small, as in this case [52]. The first decision tree was generated with the genes obtained from the select attributes technique performed in WEKA, with the objective of reducing the dimensionality of the database obtained from ANOVA; the algorithm used was Correlation Feature Selection (CfsSubsetEval) (numThreads = 1 and poolSize = 1), the search method was BestFirst (lookupCacheSize = 1 and searchTermination = 5), and the attribute selection mode was the full training set, which resulted in 89 significant genes. The CfsSubsetEval is used to eliminate the redundant attributes where the feature subset is evaluated by using the individual predictive ability of all the features with a degree of redundancy among them [53,54]. BestFirst is a heuristic search method that explores the most promising path by moving through the search space and making changes to the current subset of features [55].
The decision tree obtained an accuracy of 72.34% (±45.22), a sensitivity of 72.34%, and a specificity of 86.17%. Two genes are involved in this tree, where the most significant gene is DNAJC16, since it is found in the root node, which takes values between two ranges; if its value is equal to or less than 6.495685, it is classified as symptomatic, and if its value is greater than 6. 495685, the second gene TREM1 is evaluated; if its value is equal to or lower than 9.609627, it is classified as asymptomatic, and if the value is higher than 9.609627, it is classified as a healthy control, as shown in Figure 1.
Table 2 shows the confusion matrix for the above decision tree, where the performance of the algorithm for each class can be observed. The algorithm classified the following correctly: 10/11, symptomatic, 9/18, asymptomatic, and 15/18, healthy controls. The results show that the classifier performs with an accuracy of 72.34%, precision of 75.10%, recall of 72.34%, and F-Measure of 72%. To visualize the metrics as TP Rate, FP Rate, Precision, Recall, F-Measure, MCC, ROC Area, and PRC Area for each class, consult the Supplementary Materials: Additional file S1: Table S1 and Figure S1.
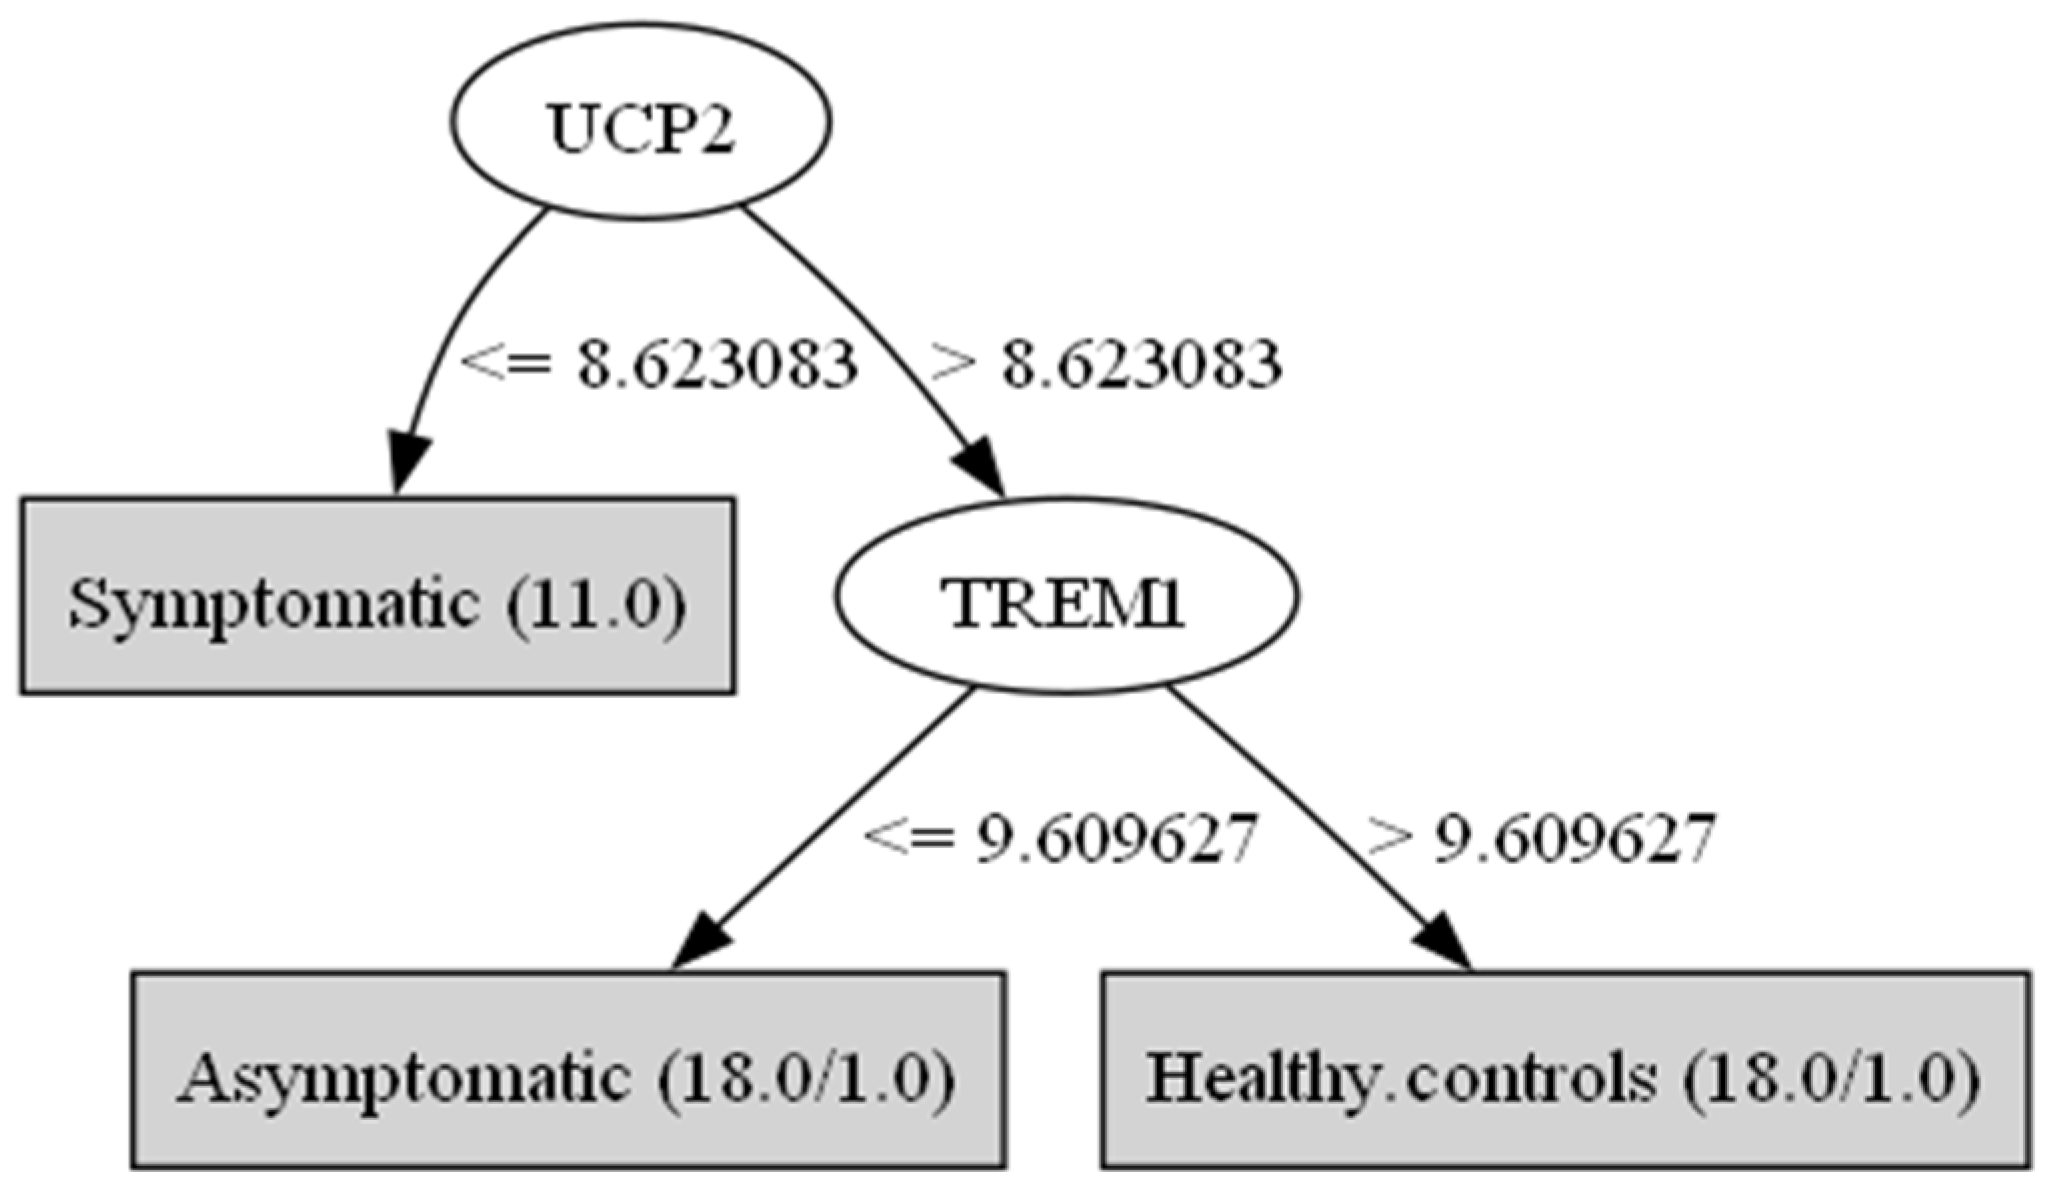
For the second tree, the whole gene expression matrix was tested; in other words, before applying the ANOVA as a set of genes, this analysis resulted in an accuracy of 57.45% (± 49.98), a sensitivity of 57.44%, and a specificity of 78.72%. Two genes are involved in this tree, the most significant gene being UCP2, since it is located in the root node, which takes values equal to or less than 8.623083, classifying it as symptomatic; if the value is greater than 8.623083, the second gene TREM1 is evaluated, if the value is equal to or less than 9.609627, it is classified as asymptomatic, and if the value is greater than 9.609627, it is classified as healthy controls, as shown in Figure 2.
Table 3 shows the confusion matrix for decision tree of Figure 2, where it can be seen that the algorithm correctly classified: 9/11, symptomatic, 8/18, asymptomatic, and 10/18, healthy controls. The results show that the classifier performs with an accuracy of 57.45%, precision of 60%, recall of 57.44%, and F-Measure of 58%. To visualize the following metrics: TP Rate, FP Rate, Precision, Recall, F-Measure, MCC, ROC Area, and PRC Area, for each class, consult the Supplementary Materials: Additional file S1: Table S2 and Figure S2.
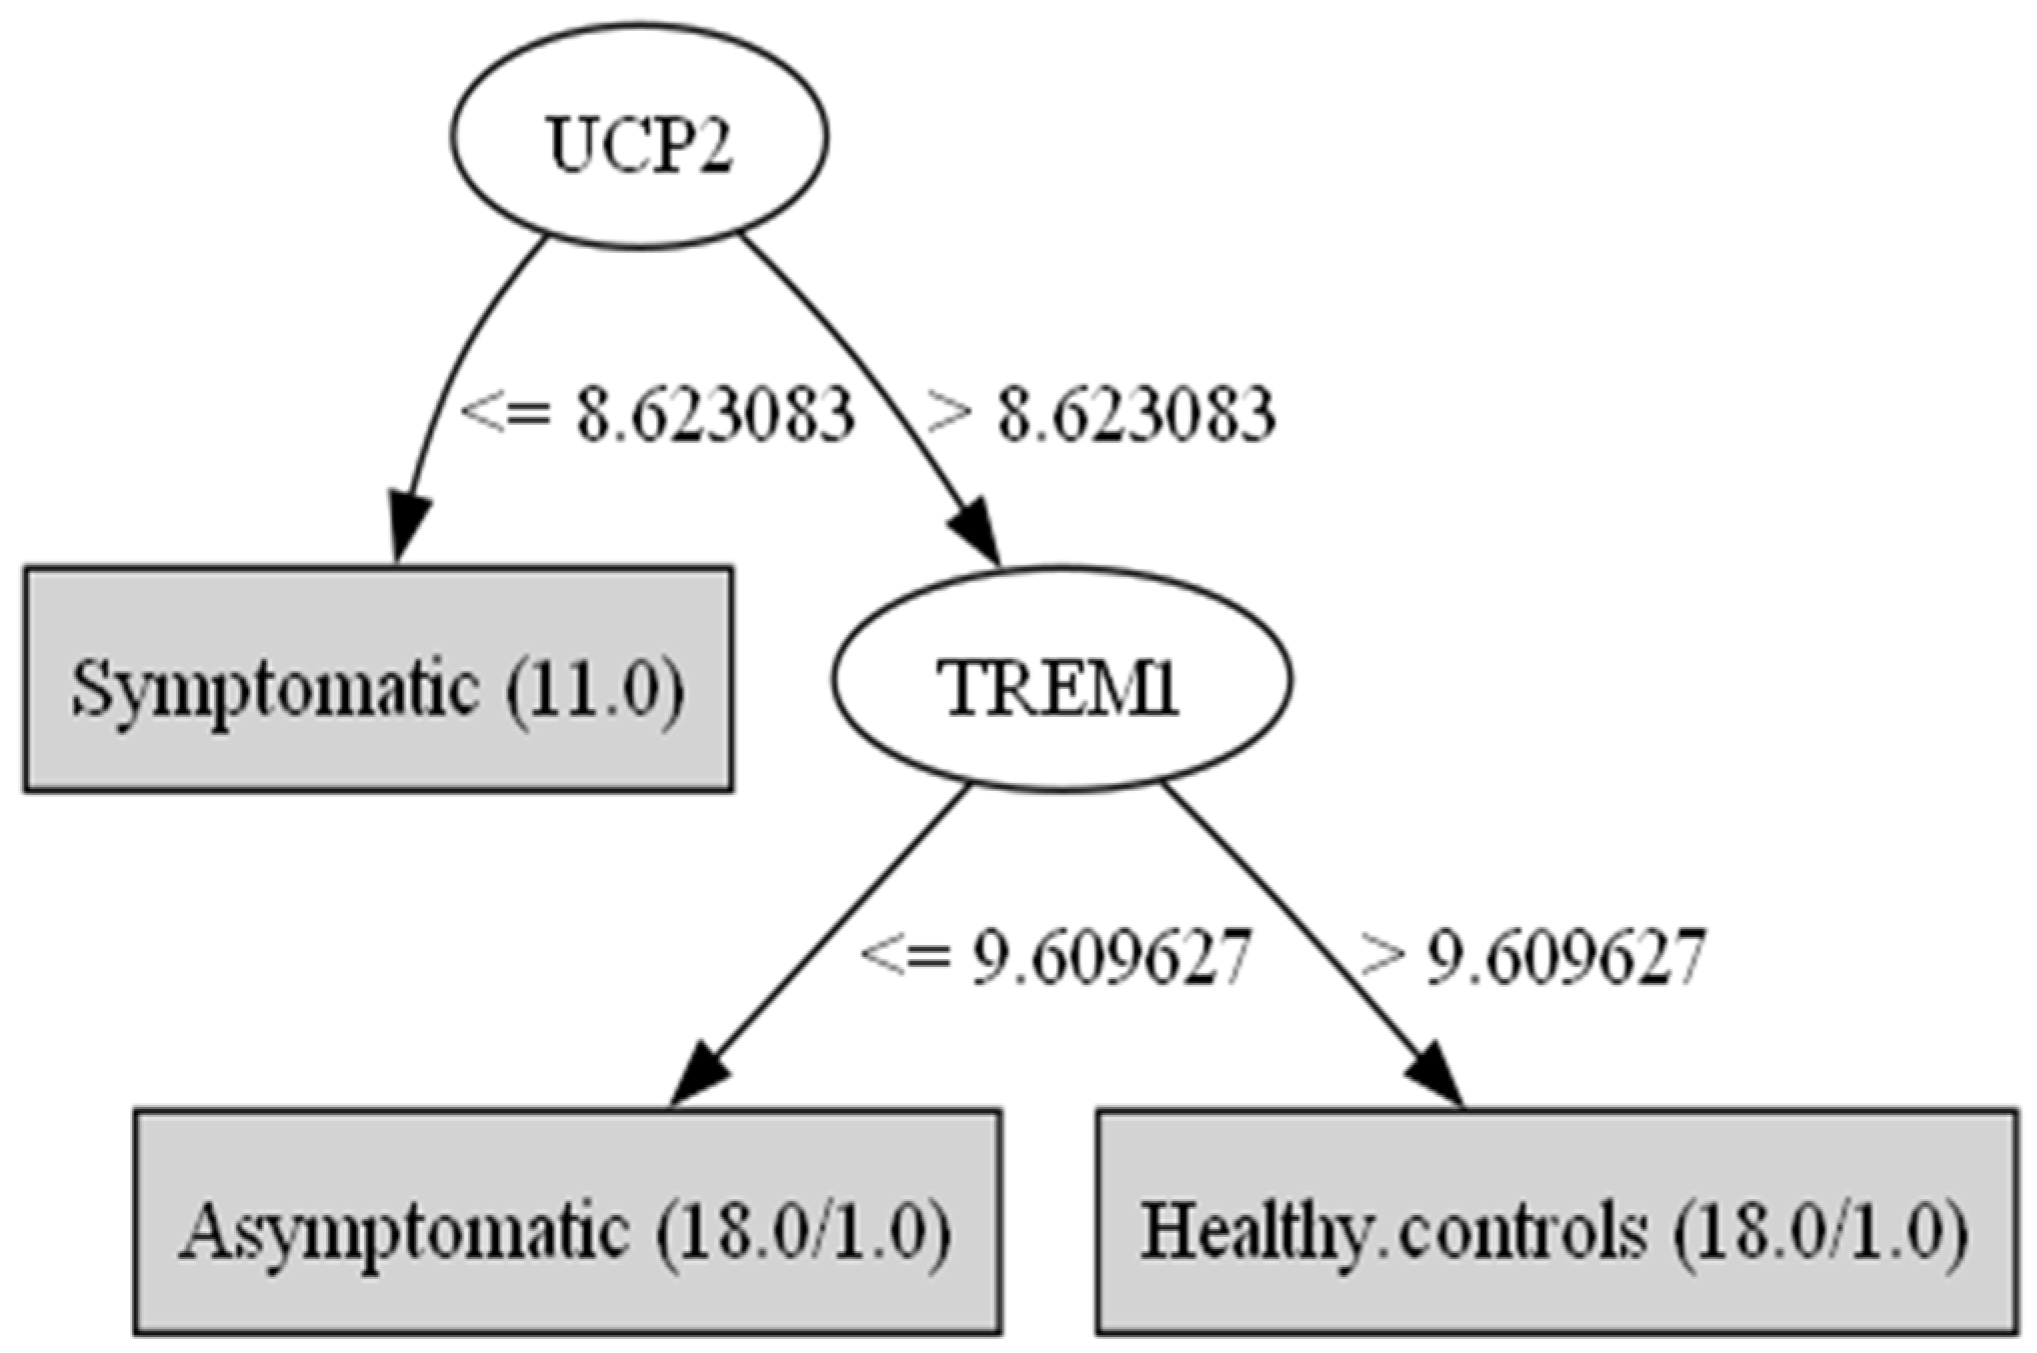
For the last decision tree, the set of genes obtained from the ANOVA statistical test was used. This analysis resulted in an accuracy of 68.09% (±47.12), a sensitivity of 68.10%, and a specificity of 84.04%. Two genes are involved in this tree, the most significant gene is UCP2 since it is the root node, which takes values between two ranges; if the value is equal to or lower than 8.623083, it is classified as symptomatic, if the value is higher than 8.623083, the second gene TREM1 is evaluated, if the value is equal to or lower than 9.609627, it is classified as asymptomatic, and if the value is higher than 9.609627, it is classified as a healthy control, as shown in Figure 3.
Table 4 shows the confusion matrix for the decision tree in Figure 3, where it can be seen that the algorithm correctly classified 10/11, symptomatic, 6/18, asymptomatic, and 17/18, healthy controls. The results show that classifier performs with an accuracy of 68.09%, precision of 71.40%, recall of 68.10%, and F-Measure of 68.20%. To visualize the metrics as TP Rate, FP Rate, Precision, Recall, F-Measure, MCC, ROC Area, and PRC Area for each class, consult the Supplementary Materials: Additional file S1: Table S3 and Figure S3.
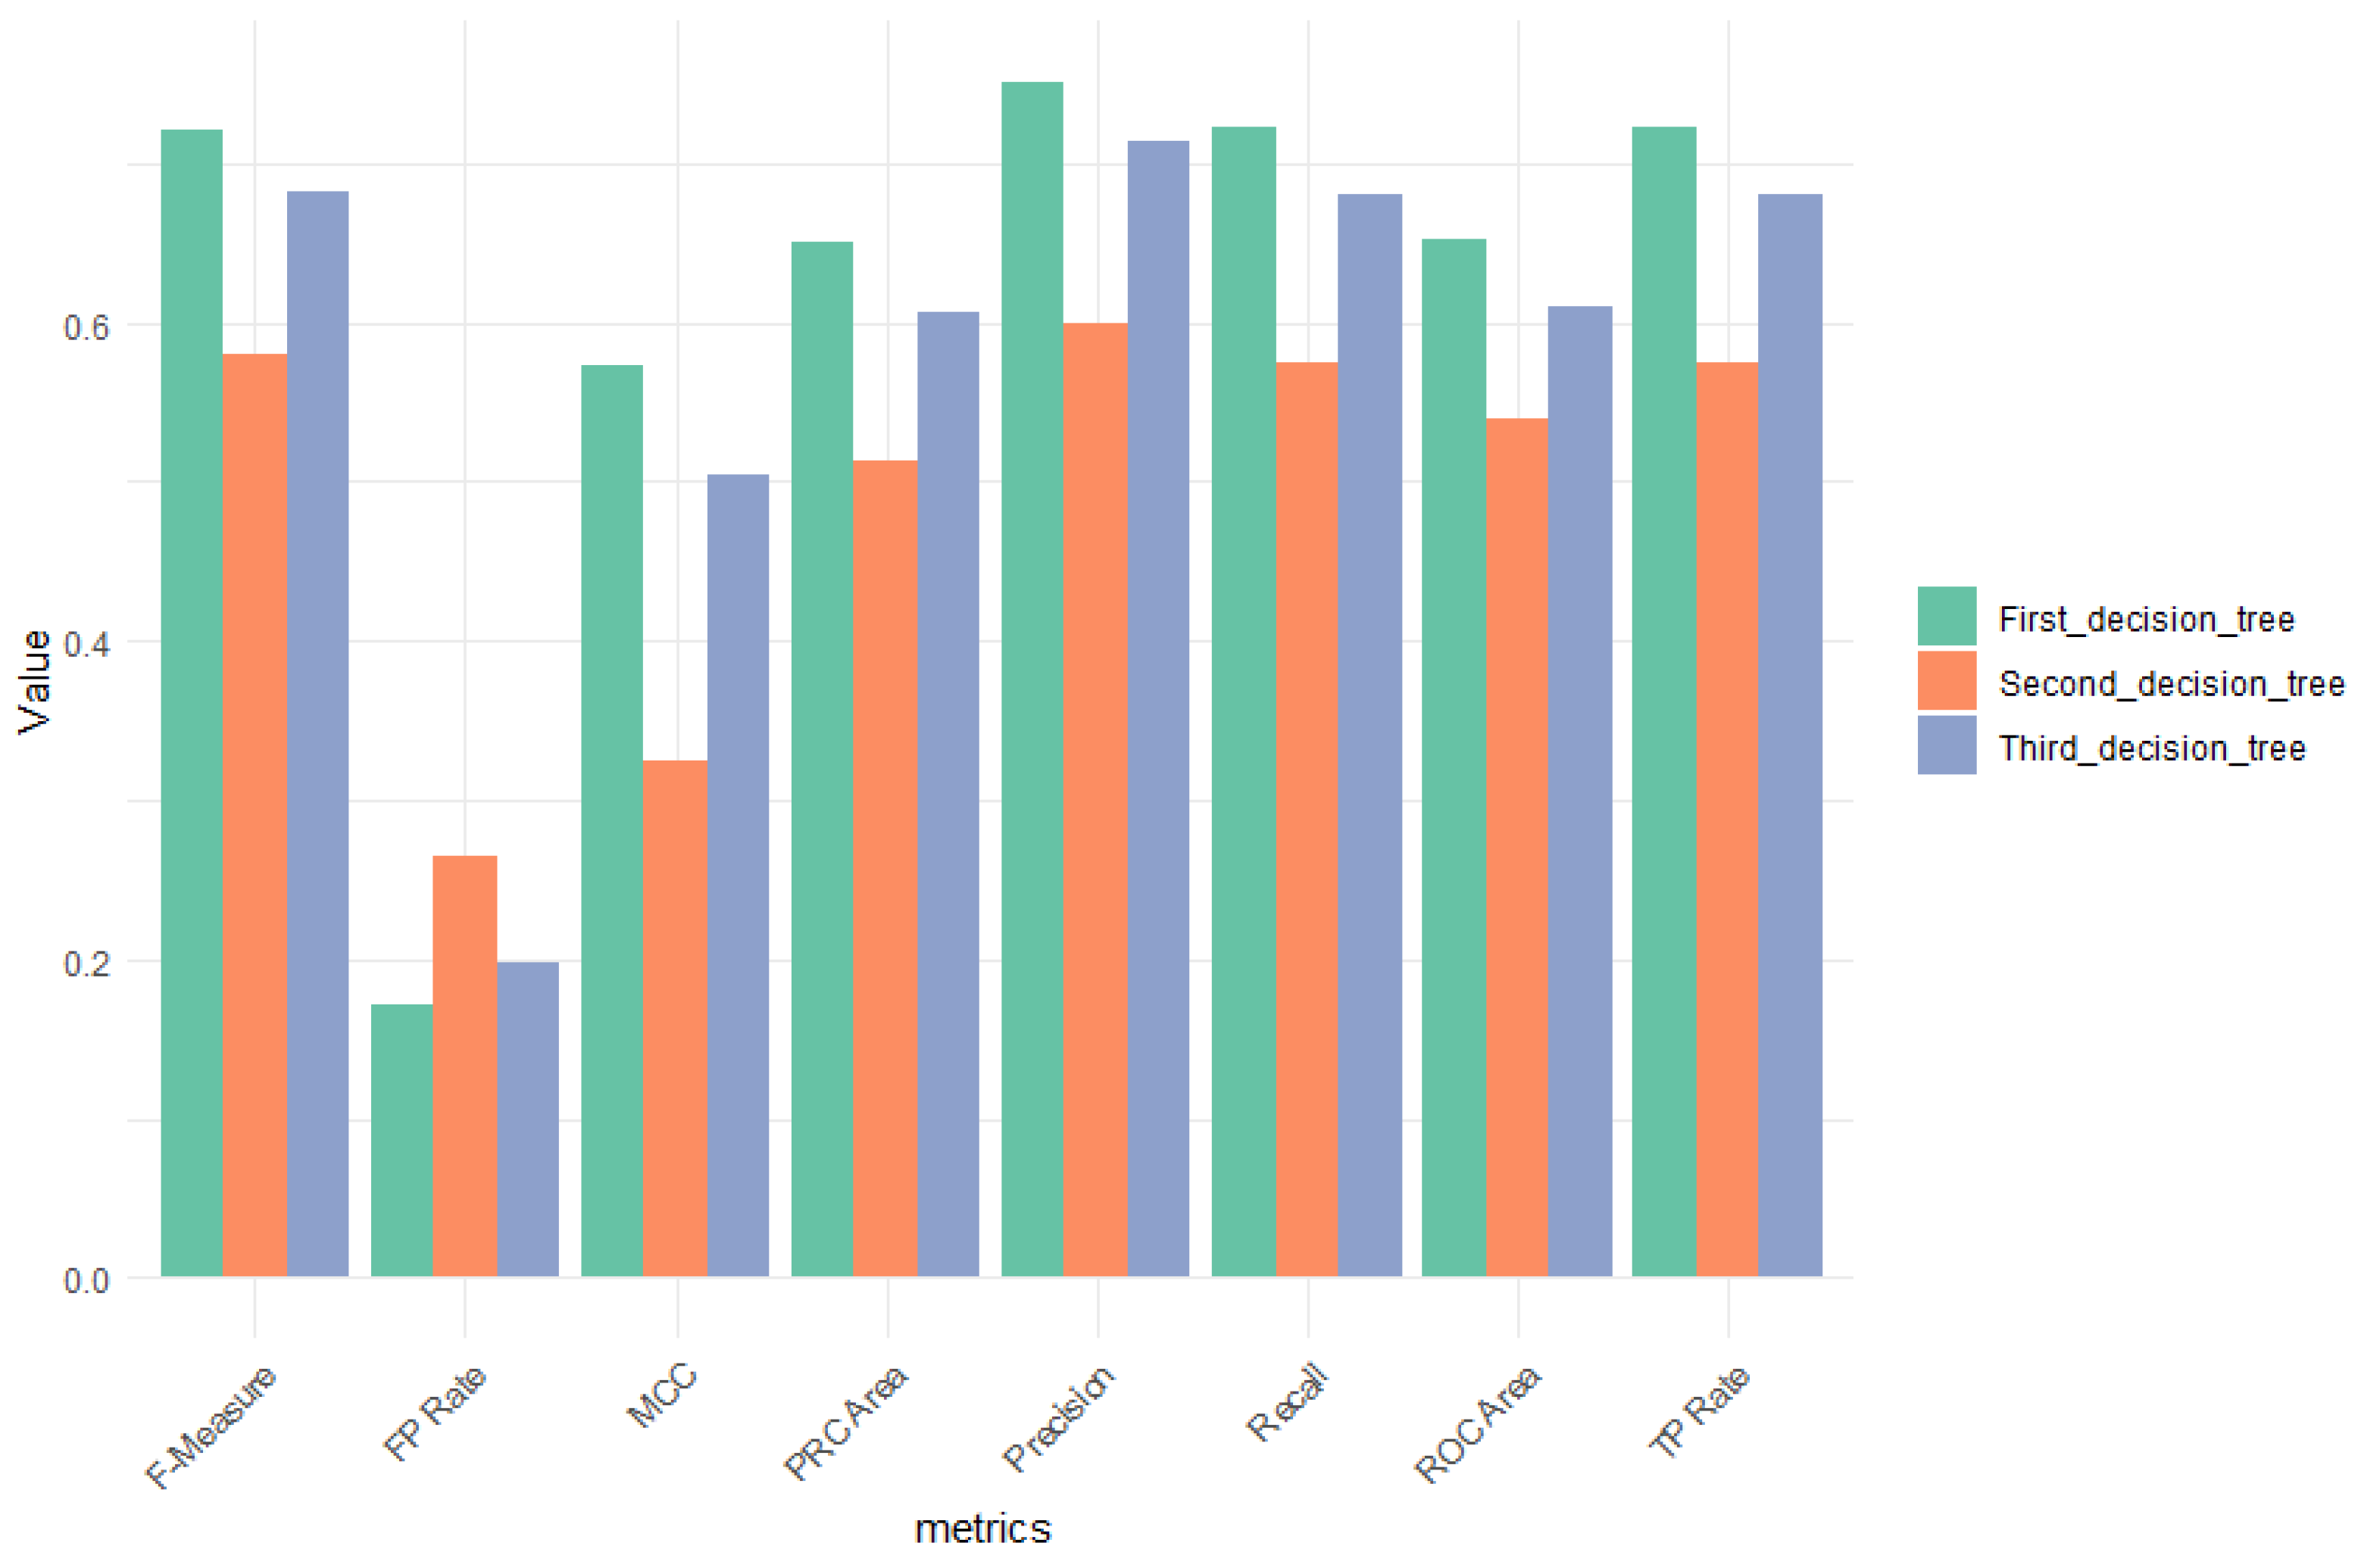
In summary, decision tree one proved to be the model with the most robust and consistent performance, followed by tree three, which showed competitive, but slightly lower, metrics. In contrast, tree two performed less well on most of the metrics evaluated, suggesting that it may not be suitable for classification tasks requiring high accuracy without further optimization, as shown in Figure 4.
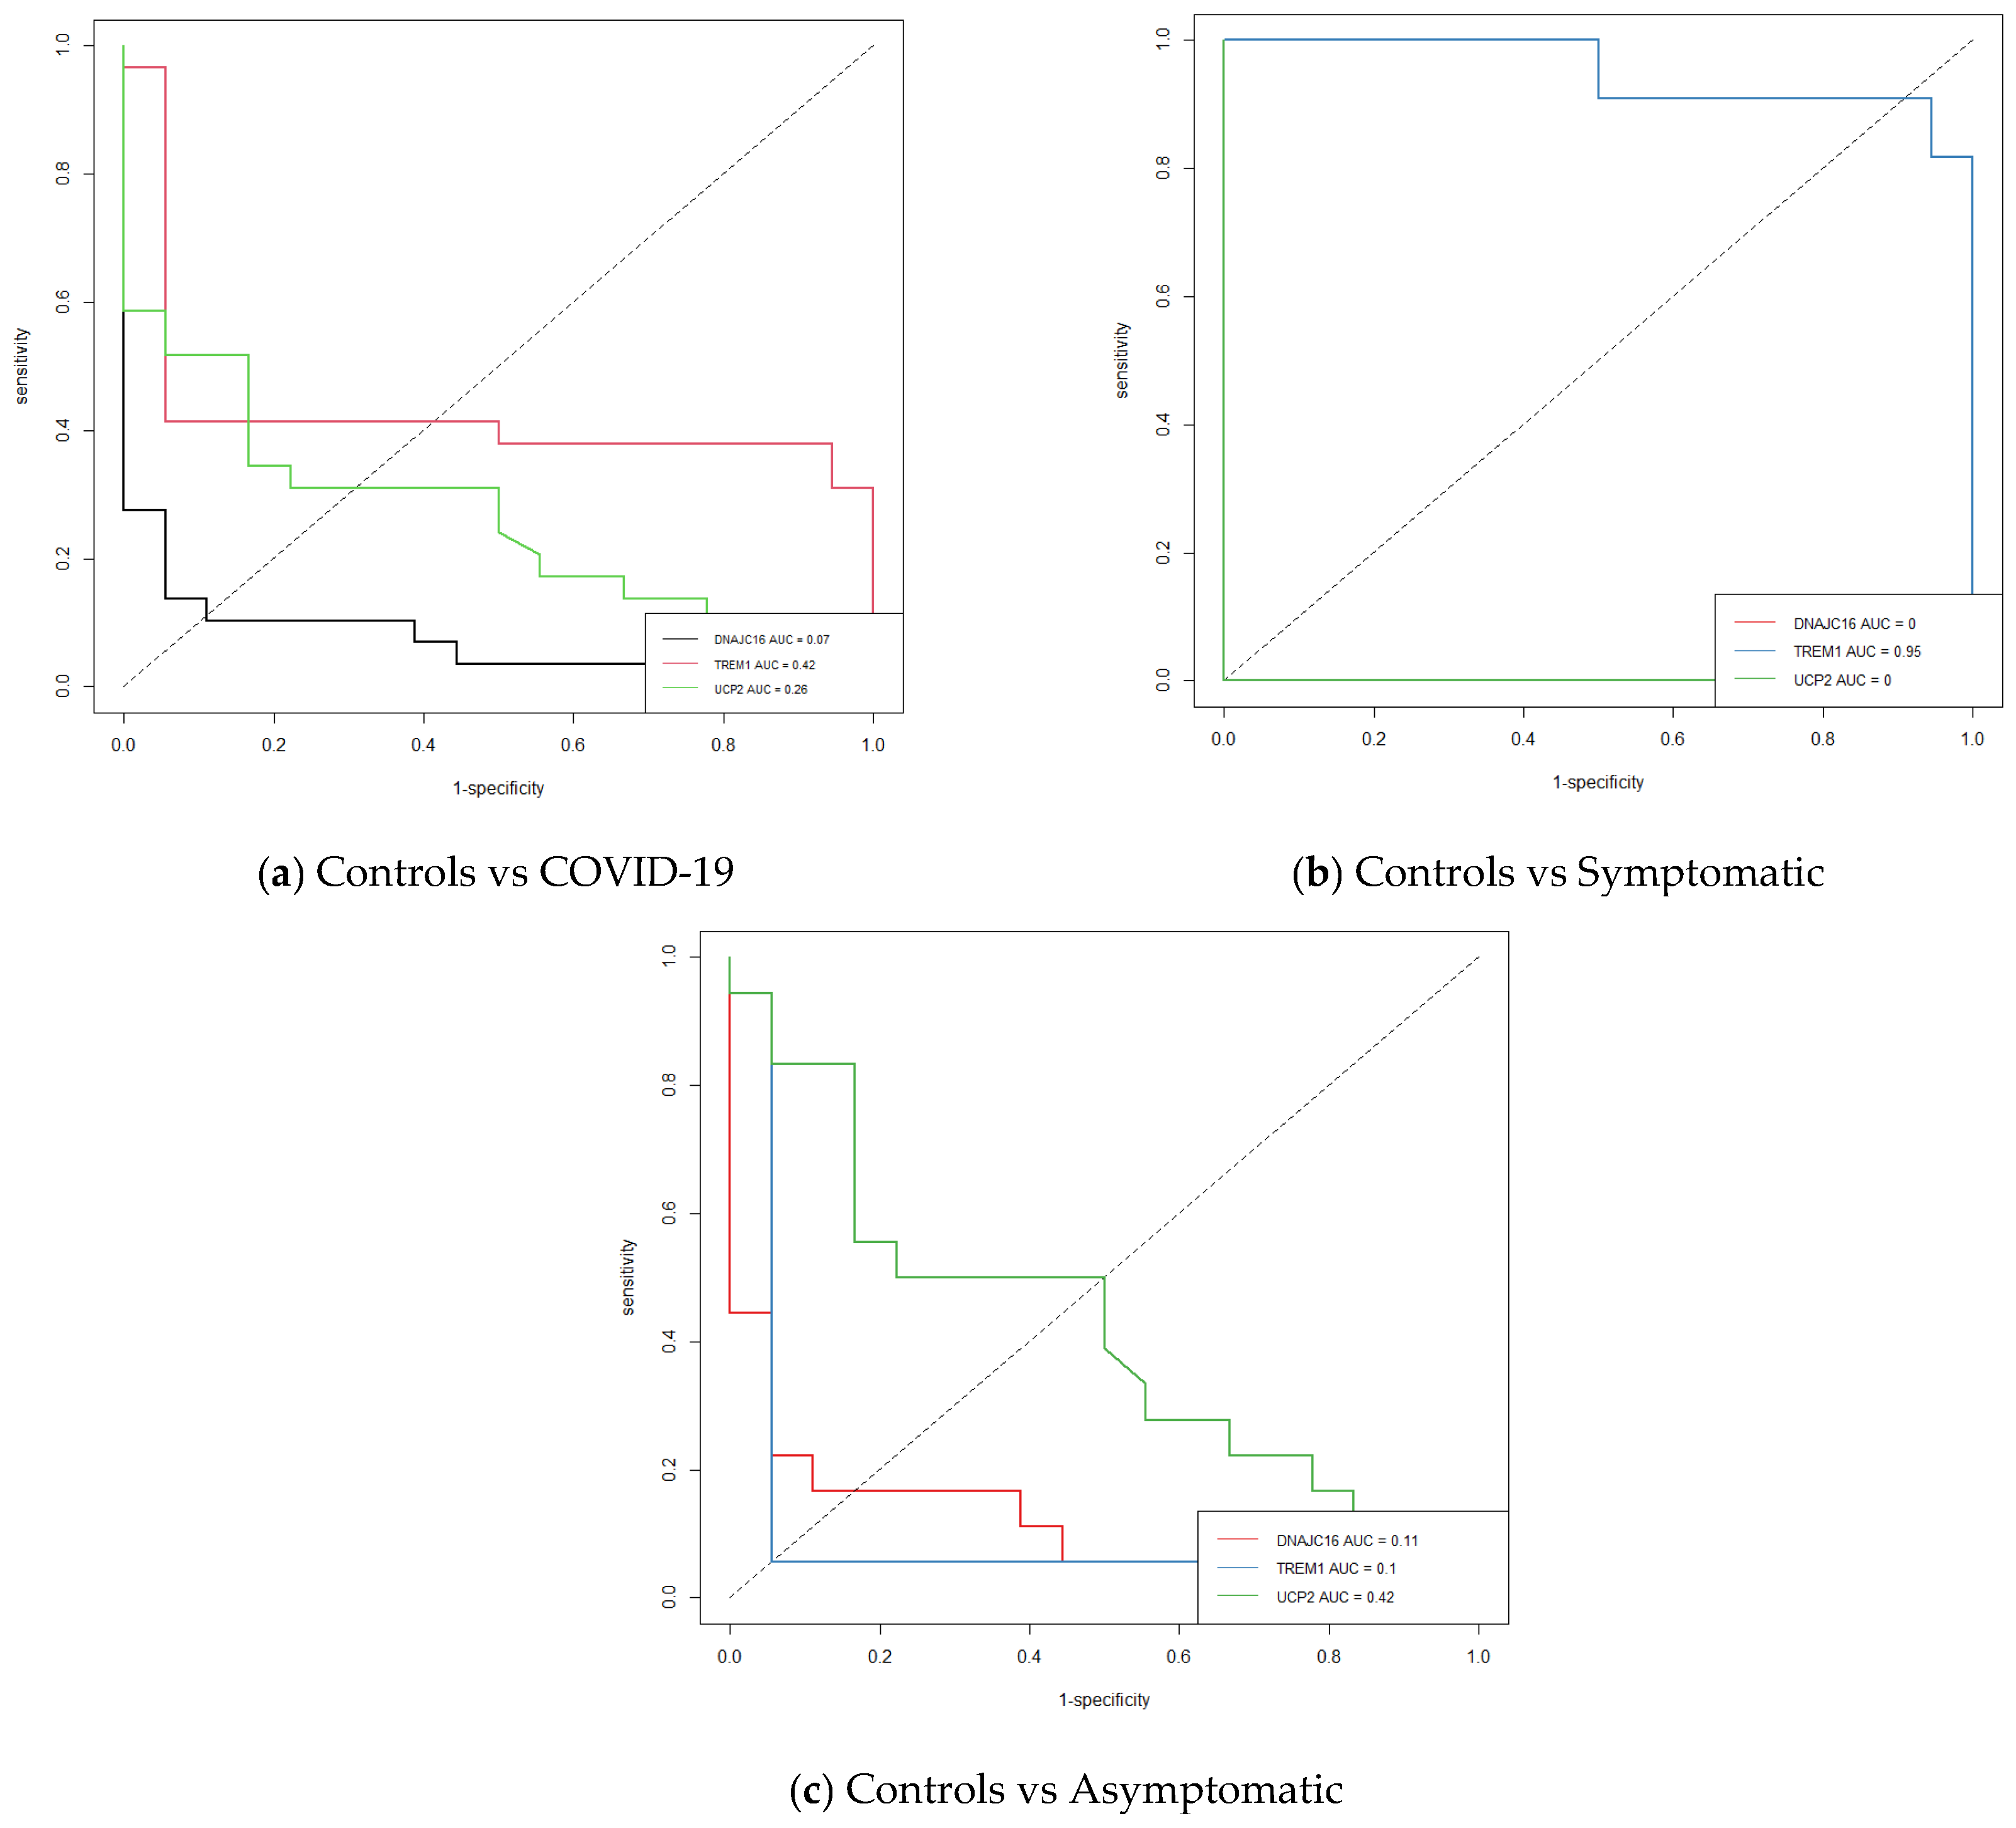
To validate the performance of each gene obtained from the trees as a discriminator between two classes, receiver operating characteristic (ROC) curve analyses were performed using R software (version 4.3.3) with the pROC package (version 1.18.5).
An ROC plot represents the performance of a binary classification method with ordinal outcomes, whether continuous or discrete, by showing how the proportion of correctly classified positives (sensitivity) and the proportion of correctly classified negatives (1-specificity) vary as the decision threshold is adjusted for possible values. In this context, the area under the curve (AUC) is commonly used as a quantitative measure of classifier performance, where a higher AUC value indicates a better ability to distinguish between classes. [56]. Figure 5 shows the ROC curves: the first, control versus COVID-19; the second, control versus symptomatic patients; and the third, control versus asymptomatic patients. Figure 5a shows that the TREM1 gene has an AUC = 0.42, the UCP2 gene has an AUC = 0.26, and finally the DNAJC16 gene has an AUC = 0.07. This indicates that the individual genes have limited or almost no capacity to discriminate effectively between these two classes. In Figure 5b, the gene that stands out is TREM1 with an AUC = 0.95, which means that this gene has a high capacity to separate the control cases from the symptomatic ones. In Figure 5c, an AUC below 0.5 is shown, which means that none of the three genes individually are a good classifier to distinguish between control and asymptomatic.
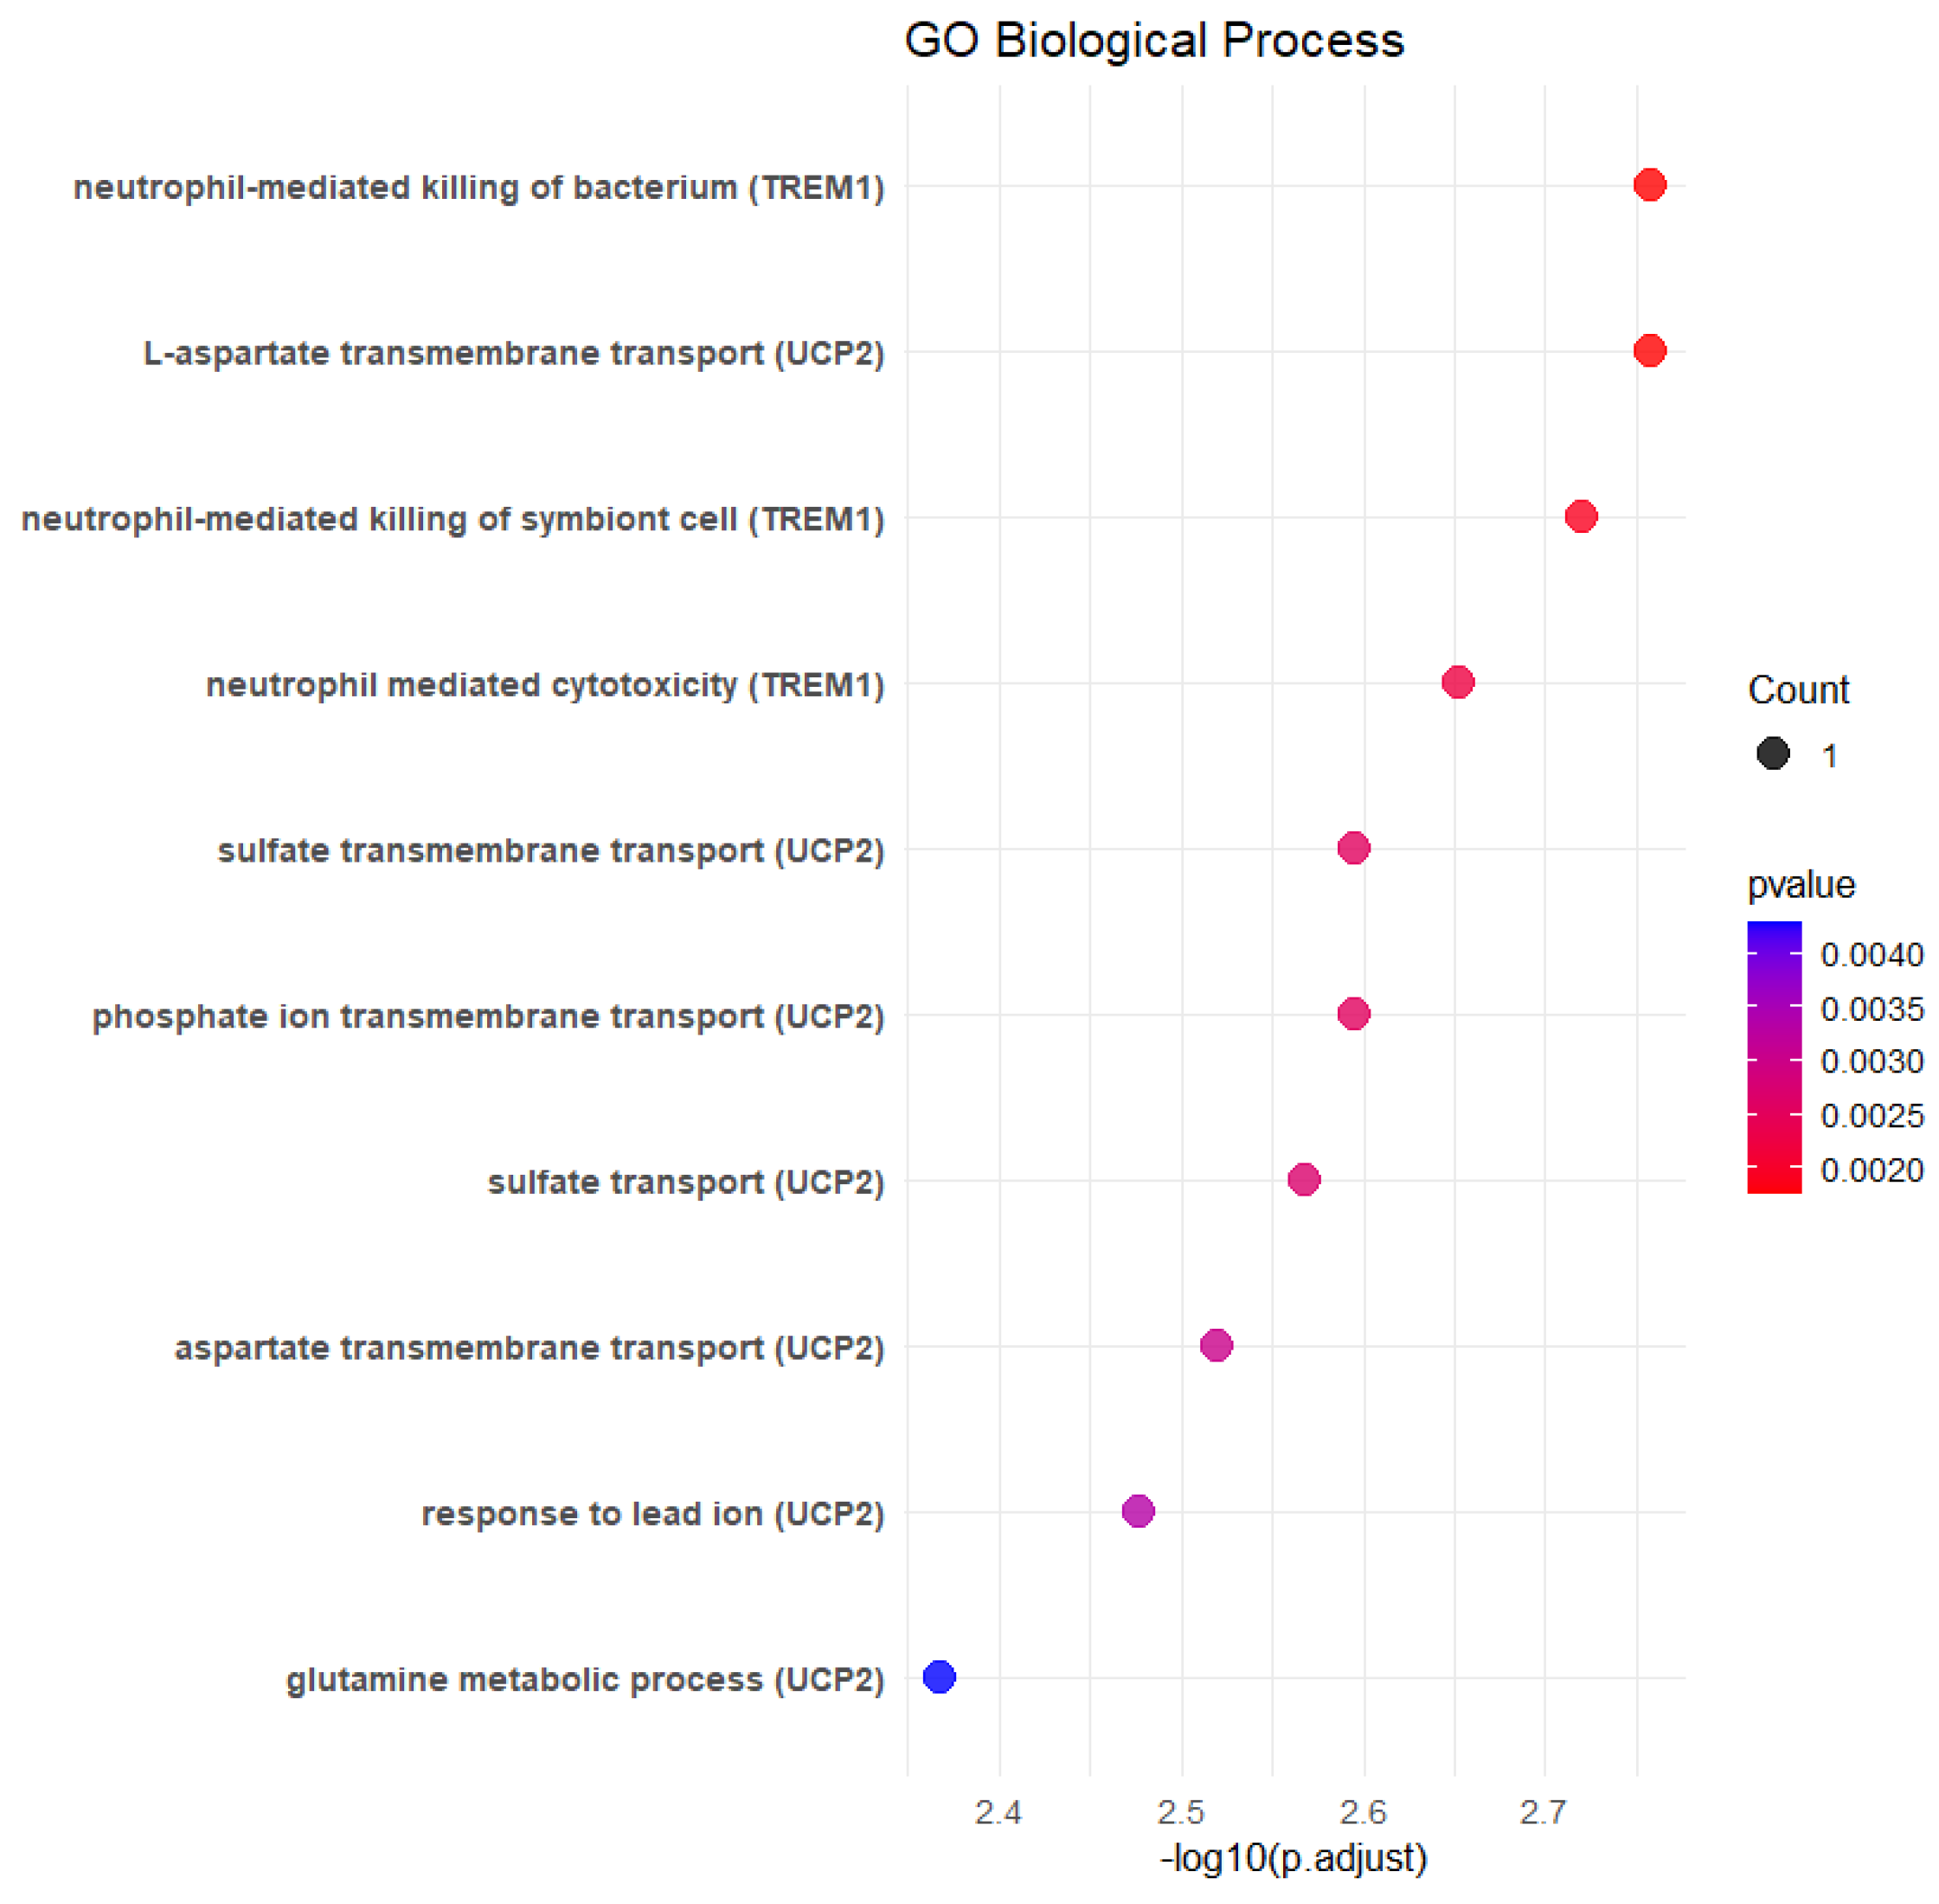
Finally, a Gene Ontology (GO) enrichment analysis of the most informative genes (UCP2, TREM1, and DNAJC16) reported in decision trees was performed in order to explore the signaling pathways. Enrichment was considered statistically significant when the p-value < 0.05. The results showed that these expressed genes were mainly enriched in the neutrophil-mediated killing of bacterium (TREM1), L-aspartate transmembrane (UCP2), neutrophil-mediated killing of symbiont cell (TREM1), and other signaling pathways.
Figure 6 shows a dotplot with the 10 most significantly enriched GO terms, evaluated by over-representation analysis using the Gene Ontology database and org.Hs.eg.db annotations.
Table 5 presents the GO terms of the main UCP2 and TREM1 genes, providing more information on their involvement in biological processes, and shows the p-value, p-adjust, gene name, and log p-value. See the complete Table in Additional file S2: Table S4.

4. Discussion

Three decision trees were generated, resulting in three significant genes: DNAJC16, UCP2, and TREM1. Where the DNAJC16 gene was only obtained in the first decision tree as the most significant gene, the UCP2 gene was the most significant gene for the second and third decision trees and TREM1 was the second most significant gene for the three decision trees generated.
DNAJC16 is a member of the heat shock protein family (Hsp40), related to cell apoptosis in type 2 diabetes mellitus [57]; it is also involved in differential expression in pancreatic islets of patients with type 2 diabetes mellitus [58]. Similarly, DNAJC16 has been reported to be involved in the autophagy process carrying engulfed substrates to lysosomes for degradation [58]. Likewise, overexpression of DNAJC16 has been shown to be involved in larger autophagosome sizes [59,60]. It is interesting that DNAJC16 has a relationship with type 2 diabetes mellitus, because type 2 diabetes mellitus is a risk factor for developing AD; patients with this disease are 1.4 and 2 times more likely to have AD in the future [61]. In recent years, the term “type 3 diabetes” has emerged for people with AD, because of the similar mechanisms it has with the other types of diabetes such as insulin resistance that could be associated with memory deficits and cognitive impairment, inflammation, oxidative stress, amyloid accumulation, and mitochondrial dysfunction [61,62]. Different mechanisms have been reported between AD and diabetes mellitus such as proinflammatory agents (IL-6, IL-8), C-reactive protein (CRP), excitotoxicity, increased oxidative stress, altered insulin resistance, and insulin receptors, which play an important role in these two diseases [63]. Type 2 diabetes mellitus has been reported to be a frequent comorbidity among SARS-CoV-2 infected patients and increases the likelihood of developing severe symptoms such as the need for ventilation [64].
Uncoupling proteins (UCPs) are internal mitochondrial proteins that protect neurons by decreasing the production of free radicals acting as an antioxidant [65]. It has been observed that inflammatory cytokines, such as TNF-α, can decrease the expression of UCPs through the nitric oxide synthase pathway, but also, the combination of UCPs and the accumulation of oxidative stress triggers neural loss [66]. UCP2 regulates the production of reactive oxygen species (ROS) in the inflammatory system and is highly expressed in macrophages, innate immune cells, and microglia [67]. UCP2 plays a role in modulating inflammation and it is believed that UCP2 may act through microglia or macrophages to modulate neuroinflammation [68]. UCP2 may play an important role in AD through oxidative stress, since one of the characteristics of AD is stress that promotes excessive aggregation of beta-amyloid plaques; UCP2 could possibly participate in decreasing oxidative stress, while UCP2 upregulation may come to protect neuronal cells against damage caused by hypoxia [69]. Another study suggests that UCP2 may be involved in AD through mitochondrial calcium dysfunction, because UCP2 modulates the mitochondrial calcium concentration of nerve cells and can be regulated by O2 [70]. Evidence has been found that UCP is downregulated in AD brains, with an increase in inducible nitric oxide synthase activities [67].
The triggering receptor expressed on myeloid cell 1 (TREM1) belongs to the TREM1 family of immunoglobulins that are expressed on myeloid cells to modulate cell activation and differentiation. This protein couples with tyrosine kinase-binding TYRO (TYROBP), and both contribute to immune dome activation and neuronal death in a pathological setting [71]. This protein is suggested to be not only associated with amyloid pathologies but may also be associated with Tau protein-related pathologies [72]. TREM1 has a soluble form (sTREM1) that is obtained from cerebrospinal fluid to determine the early diagnosis of some diseases, and it is believed that the increase in TREM1 in plasma could be associated with AD, since an increase in this molecule has been observed in plasma during the progression of AD [70]. Another study conducted mentions that TREM1 in its soluble form was significantly increased in AD patients and that it correlates positively with plasma total tau levels [73].
Apart from the respiratory system and the central nervous system, the immune system must also be considered, as it is responsible for creating a defense against pathogens and repairing damage caused by foreign agents [74]. In the case of SARS-CoV-2, the immune system starts with pulmonary epithelial cells, alveolar macrophages, and neutrophils, followed by T- and B-type lymphocytes [75]. A recent study compared the immune system of 133 patients with mild first-wave COVID-19, ten weeks after and ten months after infection with 98 control cases, where at ten weeks after, infection patients who had COVID-19 showed a significantly lower number of neutrophils, while T cells were strongly activated compared to controls and at ten months after infection, a significant reduction in adaptive immune cells including T and B cells was found [76]. In the CNS, the cells that fulfill this function are astrocytes and microglia, which play the role of homeostasis and immune defense, but once activated, these cells release even more proinflammatory cytokines [77,78]. The accumulation of beta-amyloid and tau could be caused by persistent and excessive activation of immune cells [77], highlighting that these accumulations are very important features in the development of AD.
In this study, three significant genes were identified in COVID-19 that could be related to AD; by using decision trees were generated that classified patients with COVID-19, both asymptomatic and symptomatic, and also patients in the healthy control. But the study had a limitation, which was the number of microarrays for each group and the large number of genes, so dimensionality reduction methods were used to reduce the genes. In future work, we propose the creation of artificial instances by means of data augmentation techniques, such as SMOTE (Synthetic Minority Over-Sampling Technique), to obtain a larger number of samples and improve the performance of the decision trees. Furthermore, these results need to be validated by performing studies with tissue from AD patients, using techniques such as immunohistochemistry to observe the expression levels of these genes. Future studies should also consider performing microarray analysis for both diseases, one for COVID-19, and the other for AD in its different stages, and generate models with other classification methods, such as Support Vector Machines (SVM), Naïve Bayes, Bayes Net, and Random Forest.

5. Conclusions

In this study, we focused on analyzing microarrays of gene expression levels of COVID-19 to obtain significant genes in asymptomatic, symptomatic, and healthy individuals that could be involved in AD using machine learning. Decision trees are a very valuable tool for the analysis of microarray data because they combine interpretability, automatic selection of relevant variables, and the ability to model non-linear relationships between genes. Three decision trees were generated, where the first decision tree—the best tree—with the dataset obtained from the select attributes application provided an accuracy of 72.34%, compared to the second and third ones, which provided an accuracy of 57.45% and 68.09%, respectively. DNAJC16 and TREM1 genes were the most significant for the decision tree in Figure 1; for decision trees in Figure 2 and Figure 3, the most significant genes were UCP2 and TREM1. It can be observed that the TREM1 gene is present in all three decision trees, which is already being studied for a possible relationship with AD. In conclusion, an important feature of COVID-19 is the generation of a cytokine storm mediated by proinflammatory cytokines, which could have a severe effect on CNS maintaining an inflammatory environment, which could result in the risk of the development of AD and of AD patients increasing neuroinflammation.
Finally, the genes characterized in the present investigation are involved as risk factors for AD. UCP2 is associated with the inflammation process characteristic of AD, TREM1 is related to amyloid pathologies, and DNAJC16 with type 2 diabetes mellitus, which increases the probability of cognitive impairment.
Although TREM1 has shown a possible link between COVID-19 and Alzheimer’s disease (AD), experimental validation using appropriate molecular and cellular methodologies is required. Future work will consider the construction of animal models, immunohistochemistry techniques, the use of gene knockdown, and other experimental methods to improve the study.
In the meantime, we will continue to explore relevant public databases on COVID-19 and Alzheimer’s disease with a view to conducting further relevant studies. This topic deserves further investigation.

Supplementary Materials

The following supporting information can be downloaded at: https://www.mdpi.com/article/10.3390/biomedinformatics5020026/s1, Additional file S1: Table S1: Detailed metrics of the first decision tree; Table S2: Detailed metrics by class of the second decision tree; Table S3: Detailed metrics by class of the third decision tree; Figure S1: Radar chart the result of the selected attributes (first decision tree); Figure S2: Radar chart the result of the second decision tree; and Figure S3: Radar chart the result of the third decision tree. Additional file S2: Table S4: GO terms significantly enriched.

Author Contributions

J.A.T.-S.: He studied the decision trees and the preprocessing methods. N.C.-R.: He contributed to the analysis of results and approval of the article. G.E.A.-A.: He contributed to the analysis of results, editing the article, and approval of the article. S.L.M.-G.: She contributed to the conception and design or the study, the analysis and discussion of results and approval of the article. All authors have read and agreed to the published version of the manuscript.

Funding

This research received no external funding.

Institutional Review Board Statement

Not applicable.

Informed Consent Statement

Not applicable.

Data Availability Statement

The original data presented in the study are openly available in the Gene Expression Omnibus (GEO) of the National Center for Biotechnology Information (NCBI) at https://www.ncbi.nlm.nih.gov/geo/query/acc.cgi?acc=GSE177477 (accessed on 5 March 2024).

Conflicts of Interest

The authors declare no conflicts of interest.

References

  1. Brown, E.E.; Kumar, S.; Rajji, T.K.; Pollock, B.G.; Mulsant, B.H. Anticipating and Mitigating the Impact of the COVID-19 Pandemic on Alzheimer’s Disease and Related Dementias. Am. J. Geriatr. Psychiatry 2020, 28, 712–721. [Google Scholar] [CrossRef] [PubMed]
  2. Habas, K.; Nganwuchu, C.; Shahzad, F.; Gopalan, R.; Haque, M.; Rahman, S.; Majumder, A.A.; Nasim, T. Resolution of Coronavirus Disease 2019 (COVID-19). Expert Rev. Anti Infect. Ther. 2020, 18, 1201–1211. [Google Scholar] [CrossRef]
  3. Simonetti, A.; Bernardi, E.; Sani, G. Novel Advancements in COVID-19 and Neuroscience. J. Pers. Med. 2024, 14, 143. [Google Scholar] [CrossRef]
  4. World Health Organization. WHO COVID-19 Dashboard. Available online: https://data.who.int/dashboards/covid19/cases (accessed on 12 May 2024).
  5. Gorbalenya, A.E.; Baric, R.S.; De Groot, R.J.; Drosten, C.; Gulyaeva, A.A.; Haagmans, B.L.; Lauber, C.; Leontovich, A.M.; Neuman, B.W.; Penzar, D.; et al. The Species Severe Acute Respiratory Syndrome-Related Coronavirus: Classifying 2019-nCoV and Naming It SARS-CoV-2. Nat. Microbiol. 2020, 5, 536–544. [Google Scholar] [CrossRef]
  6. Gheblawi, M.; Wang, K.; Viveiros, A.; Nguyen, Q.; Zhong, J.-C.; Turner, A.J.; Raizada, M.K.; Grant, M.B.; Oudit, G.Y. Angiotensin-Converting Enzyme 2: SARS-CoV-2 Receptor and Regulator of the Renin-Angiotensin System: Celebrating the 20th Anniversary of the Discovery of ACE2. Circ. Res. 2020, 126, 1456–1474. [Google Scholar] [CrossRef] [PubMed]
  7. Zanza, C.; Romenskaya, T.; Manetti, A.; Franceschi, F.; La Russa, R.; Bertozzi, G.; Maiese, A.; Savioli, G.; Volonnino, G.; Longhitano, Y. Cytokine Storm in COVID-19: Immunopathogenesis and Therapy. Medicina 2022, 58, 144. [Google Scholar] [CrossRef]
  8. Ramesh, P.; Veerappapillai, S.; Karuppasamy, R. Gene Expression Profiling of Corona Virus Microarray Datasets to Identify Crucial Targets in COVID-19 Patients. Gene Rep. 2021, 22, 100980. [Google Scholar] [CrossRef] [PubMed]
  9. Pacheco-Herrero, M.; Soto-Rojas, L.O.; Harrington, C.R.; Flores-Martinez, Y.M.; Villegas-Rojas, M.M.; León-Aguilar, A.M.; Martínez-Gómez, P.A.; Campa-Córdoba, B.B.; Apátiga-Pérez, R.; Corniel-Taveras, C.N.; et al. Elucidating the Neuropathologic Mechanisms of SARS-CoV-2 Infection. Front. Neurol. 2021, 12, 660087. [Google Scholar] [CrossRef]
  10. Baig, A.M. Neurological Manifestations in COVID-19 Caused by SARS-CoV-2. CNS Neurosci. Ther. 2020, 26, 499–501. [Google Scholar] [CrossRef]
  11. Jackson, C.B.; Farzan, M.; Chen, B.; Choe, H. Mechanisms of SARS-CoV-2 Entry into Cells. Nat. Rev. Mol. Cell Biol. 2022, 23, 3–20. [Google Scholar] [CrossRef]
  12. Wang, F.; Kream, R.M.; Stefano, G.B. Long-Term Respiratory and Neurological Sequelae of COVID-19. Med. Sci. Monit. 2020, 26, e928996. [Google Scholar] [CrossRef]
  13. Parks, J.M.; Smith, J.C. How to Discover Antiviral Drugs Quickly. N. Engl. J. Med. 2020, 382, 2261–2264. [Google Scholar] [CrossRef] [PubMed]
  14. Rudnicka-Drożak, E.; Drożak, P.; Mizerski, G.; Zaborowski, T.; Ślusarska, B.; Nowicki, G.; Drożak, M. Links between COVID-19 and Alzheimer’s Disease—What Do We Already Know? Int. J. Environ. Res. Public Health 2023, 20, 2146. [Google Scholar] [CrossRef] [PubMed]
  15. Carvajal Carvajal, C. Biología Molecular de La Enfermedad de Alzheimer. Med. Leg. Costa Rica 2016, 33, 2. Available online: https://www.scielo.sa.cr/scielo.php?script=sci_arttext&pid=S1409-00152016000200104 (accessed on 15 January 2025).
  16. Alzheimer’s Association. What Is Dementia? Available online: https://www.alz.org/alzheimers-dementia/what-is-dementia (accessed on 15 January 2025).
  17. Hernández-Contreras, K.A.; Martínez-Díaz, J.A.; Hernández-Aguilar, M.E.; Herrera-Covarrubias, D.; Rojas-Durán, F.; Chi-Castañeda, L.D.; García- Hernández, L.I.; Aranda-Abreu, G.E. Alterations of mRNAs and Non-Coding RNAs Associated with Neuroinflammation in Alzheimer’s Disease. Mol. Neurobiol. 2024, 61, 5826–5840. [Google Scholar] [CrossRef]
  18. Serrano-Castro, P.J.; Estivill-Torrús, G.; Cabezudo-García, P.; Reyes-Bueno, J.A.; Ciano Petersen, N.; Aguilar-Castillo, M.J.; Suárez-Pérez, J.; Jiménez-Hernández, M.D.; Moya-Molina, M.Á.; Oliver-Martos, B.; et al. Influencia de la infección SARS-CoV-2 sobre enfermedades neurodegenerativas y neuropsiquiátricas: ¿una pandemia demorada? Neurología 2020, 35, 245–251. [Google Scholar] [CrossRef]
  19. Alzheimer’s Association. 2023 Alzheimer’s Disease Facts and Figures. Alzheimers Dement. 2023, 19, 1598–1695. [Google Scholar] [CrossRef]
  20. Abasi, L.S.; Elathram, N.; Movva, M.; Deep, A.; Corbett, K.D.; Debelouchina, G.T. Phosphorylation Regulates Tau’s Phase Separation Behavior and Interactions with Chromatin. Commun. Biol. 2024, 7, 251. [Google Scholar] [CrossRef]
  21. Monteiro, A.R.; Barbosa, D.J.; Remião, F.; Silva, R. Alzheimer’s Disease: Insights and New Prospects in Disease Pathophysiology, Biomarkers and Disease-Modifying Drugs. Biochem. Pharmacol. 2023, 211, 115522. [Google Scholar] [CrossRef]
  22. Golzari-Sorkheh, M.; Weaver, D.F.; Reed, M.A. COVID-19 as a Risk Factor for Alzheimer’s Disease. J. Alzheimers Dis. 2023, 91, 1–23. [Google Scholar] [CrossRef]
  23. World Health Organization. Global Action Plan on the Public Health Response to Dementia 2017–2025. Available online: https://www.who.int/publications/i/item/global-action-plan-on-the-public-health-response-to-dementia-2017---2025 (accessed on 12 May 2024).
  24. Wei, H.-F.; Anchipolovsky, S.; Vera, R.; Liang, G.; Chuang, D.-M. Potential Mechanisms Underlying Lithium Treatment for Alzheimer’s Disease and COVID-19. Eur. Rev. Med. Pharmacol. Sci. 2022, 26, 2201–2214. [Google Scholar] [CrossRef] [PubMed]
  25. Ferini-Strambi, L.; Salsone, M. COVID-19 and Neurological Disorders: Are Neurodegenerative or Neuroimmunological Diseases More Vulnerable? J. Neurol. 2021, 268, 409–419. [Google Scholar] [CrossRef] [PubMed]
  26. Ciaccio, M.; Lo Sasso, B.; Scazzone, C.; Gambino, C.M.; Ciaccio, A.M.; Bivona, G.; Piccoli, T.; Giglio, R.V.; Agnello, L. COVID-19 and Alzheimer’s Disease. Brain Sci. 2021, 11, 305. [Google Scholar] [CrossRef] [PubMed]
  27. Matveeva, N.; Kiselev, I.; Baulina, N.; Semina, E.; Kakotkin, V.; Agapov, M.; Kulakova, O.; Favorova, O. Shared Genetic Architecture of COVID-19 and Alzheimer’s Disease. Front. Aging Neurosci. 2023, 15, 1287322. [Google Scholar] [CrossRef]
  28. Bombón-Albán, P.E.; González-Aparicio, I.I. Apoliproteina E Vinculado a Una Mayor Susceptibilidad al SARS-CoV-2. Acta Neurológica Colomb. 2021, 37, 158–160. [Google Scholar] [CrossRef]
  29. Vavougios, G.D.; Mavridis, T.; Doskas, T.; Papaggeli, O.; Foka, P.; Hadjigeorgiou, G. SARS-CoV-2-Induced Type I Interferon Signaling Dysregulation in Olfactory Networks Implications for Alzheimer’s Disease. Curr. Issues Mol. Biol. 2024, 46, 4565–4579. [Google Scholar] [CrossRef]
  30. Vavougios, G.D.; Tseriotis, V.-S.; Liampas, A.; Mavridis, T.; De Erausquin, G.A.; Hadjigeorgiou, G. Type I Interferon Signaling, Cognition and Neurodegeneration Following COVID-19: Update on a Mechanistic Pathogenetic Model with Implications for Alzheimer’s Disease. Front. Hum. Neurosci. 2024, 18, 1352118. [Google Scholar] [CrossRef]
  31. Lee, J.H.; Kanwar, B.; Khattak, A.; Balentine, J.; Nguyen, N.H.; Kast, R.E.; Lee, C.J.; Bourbeau, J.; Altschuler, E.L.; Sergi, C.M.; et al. COVID-19 Molecular Pathophysiology: Acetylation of Repurposing Drugs. Int. J. Mol. Sci. 2022, 23, 13260. [Google Scholar] [CrossRef]
  32. Twarowski, B.; Herbet, M. Inflammatory Processes in Alzheimer’s Disease—Pathomechanism, Diagnosis and Treatment: A Review. Int. J. Mol. Sci. 2023, 24, 6518. [Google Scholar] [CrossRef]
  33. Chagas, L.D.S.; Serfaty, C.A. The Influence of Microglia on Neuroplasticity and Long-Term Cognitive Sequelae in Long COVID: Impacts on Brain Development and Beyond. Int. J. Mol. Sci. 2024, 25, 3819. [Google Scholar] [CrossRef]
  34. Heller, M.J. DNA Microarray Technology: Devices, Systems, and Applications. Annu. Rev. Biomed. Eng. 2002, 4, 129–153. [Google Scholar] [CrossRef] [PubMed]
  35. Premkumar, T.; Sajitha Lulu, S. Molecular Crosstalk between COVID-19 and Alzheimer’s Disease Using Microarray and RNA-Seq Datasets: A System Biology Approach. Front. Med. 2023, 10, 1151046. [Google Scholar] [CrossRef] [PubMed]
  36. Li, J.; Tao, L.; Zhou, Y.; Zhu, Y.; Li, C.; Pan, Y.; Yao, P.; Qian, X.; Liu, J. Identification of biomarkers in Alzheimer’s disease and COVID-19 by bioinformatics combining single-cell data analysis and machine learning algorithms. PLoS ONE 2025, 20, e0317915. [Google Scholar] [CrossRef] [PubMed]
  37. Patel, M.A.; Daley, M.; Van Nynatten, L.R.; Slessarev, M.; Cepinskas, G.; Fraser, D.D. A Reduced Proteomic Signature in Critically Ill Covid-19 Patients Determined with Plasma Antibody Micro-Array and Machine Learning. Clin. Proteom. 2024, 21, 33. [Google Scholar] [CrossRef]
  38. Edgar, R. Gene Expression Omnibus: NCBI Gene Expression and Hybridization Array Data Repository. Nucleic Acids Res. 2002, 30, 207–210. [Google Scholar] [CrossRef]
  39. Masood, K.I.; Yameen, M.; Ashraf, J.; Shahid, S.; Mahmood, S.F.; Nasir, A.; Nasir, N.; Jamil, B.; Ghanchi, N.K.; Khanum, I.; et al. Upregulated Type I Interferon Responses in Asymptomatic COVID-19 Infection Are Associated with Improved Clinical Outcome. Sci. Rep. 2021, 11, 22958. [Google Scholar] [CrossRef]
  40. Bioconductor Open Source Software for Bioinformatics. Available online: https://www.bioconductor.org/ (accessed on 7 May 2024).
  41. Sepulveda, J.L. Using R and Bioconductor in Clinical Genomics and Transcriptomics. J. Mol. Diagn. 2020, 22, 3–20. [Google Scholar] [CrossRef]
  42. Carvalho, B.S.; Irizarry, R.A. A Framework for Oligonucleotide Microarray Preprocessing. Bioinformatics 2010, 26, 2363–2367. [Google Scholar] [CrossRef]
  43. Aguado, M. Microarrays de ADN en Microbiología DNA Microarrays in Microbiology. RCCV 2007, 1, 125–134. [Google Scholar]
  44. Saeed, A.I.; Bhagabati, N.K.; Braisted, J.C.; Liang, W.; Sharov, V.; Howe, E.A.; Li, J.; Thiagarajan, M.; White, J.A.; Quackenbush, J. TM4 Microarray Software Suite. In Methods in Enzymology; 2006; Volume 411, pp. 134–193. ISBN 978-0-12-182816-5. [Google Scholar]
  45. De Ville, B. Decision Trees. WIREs Comput. Stat. 2013, 5, 448–455. [Google Scholar] [CrossRef]
  46. Quinlan, J.R. Induction of Decision Trees. Mach. Learn. 1986, 1, 81–106. [Google Scholar] [CrossRef]
  47. Charbuty, B.; Abdulazeez, A. Classification Based on Decision Tree Algorithm for Machine Learning. J. Appl. Sci. Technol. Trends 2021, 2, 20–28. [Google Scholar] [CrossRef]
  48. Marsland, S. Machine Learning: An Algorithmic Perspective, 2nd ed.; Chapman & Hall/CRC: Boca Raton, FL, USA, 2015; ISBN 978-1-4665-8333-7. [Google Scholar]
  49. Tharwat, A. Classification Assessment Methods. Appl. Comput. Inform. 2021, 17, 168–192. [Google Scholar] [CrossRef]
  50. Geurts, P.; Irrthum, A.; Wehenkel, L. Supervised learning with decision tree-based methods in computational and systems biology. Mol. Biosyst. 2009, 5, 1593–1605. [Google Scholar] [CrossRef]
  51. Waikato Environment for Knowledge Analysis the Weka Workbench. Available online: https://ml.cms.waikato.ac.nz/weka/index.html (accessed on 12 May 2024).
  52. Wong, T.-T. Performance Evaluation of Classification Algorithms by K-Fold and Leave-One-out Cross Validation. Pattern Recognit. 2015, 48, 2839–2846. [Google Scholar] [CrossRef]
  53. Jalota, C.; Agrawal, R. Feature Selection Algorithms and Student Academic Performance: A Study. In International Conference on Innovative Computing and Communications; Gupta, D., Khanna, A., Bhattacharyya, S., Hassanien, A.E., Anand, S., Jaiswal, A., Eds.; Advances in Intelligent Systems and Computing; Springer Singapore: Singapore, 2021; Volume 1165, pp. 317–328. ISBN 978-981-15-5112-3. [Google Scholar]
  54. Bansal, D.; Khanna, K.; Chhikara, R.; Dua, R.K.; Malhotra, R. Analysis of Classification & Feature Selection Techniques for Detecting Dementia. SSRN Electron. J. 2019. [Google Scholar] [CrossRef]
  55. Kamarudin, M.H.; Maple, C.; Watson, T. Hybrid Feature Selection Technique for Intrusion Detection System. Int. J. High Perform. Comput. Netw. 2019, 13, 232. [Google Scholar] [CrossRef]
  56. Robin, X.; Turck, N.; Hainard, A.; Tiberti, N.; Lisacek, F.; Sanchez, J.C.; Müller, M. pROC: An open-source package for R and S+ to analyze and compare ROC curves. BMC Bioinform. 2011, 12, 77. [Google Scholar] [CrossRef]
  57. Ren, J.; He, T.; Li, Y.; Liu, S.; Du, Y.; Jiang, Y.; Wu, C. Network-Based Regularization for High Dimensional SNP Data in the Case–Control Study of Type 2 Diabetes. BMC Genet. 2017, 18, 44. [Google Scholar] [CrossRef]
  58. McCaughan, J.A.; McKnight, A.J.; Maxwell, A.P. Genetics of New-Onset Diabetes after Transplantation. J. Am. Soc. Nephrol. 2014, 25, 1037–1049. [Google Scholar] [CrossRef]
  59. Chang, Y.-S.; Lin, C.-Y.; Liu, T.-Y.; Huang, C.-M.; Chung, C.-C.; Chen, Y.-C.; Tsai, F.-J.; Chang, J.-G.; Chang, S.-J. Polygenic Risk Score Trend and New Variants on Chromosome 1 Are Associated with Male Gout in Genome-Wide Association Study. Arthritis Res. Ther. 2022, 24, 229. [Google Scholar] [CrossRef]
  60. Yamamoto, Y.; Noda, T. Autophagosome Formation in Relation to the Endoplasmic Reticulum. J. Biomed. Sci. 2020, 27, 97. [Google Scholar] [CrossRef] [PubMed]
  61. Marrano, N.; Biondi, G.; Borrelli, A.; Rella, M.; Zambetta, T.; Di Gioia, L.; Caporusso, M.; Logroscino, G.; Perrini, S.; Giorgino, F.; et al. Type 2 Diabetes and Alzheimer’s Disease: The Emerging Role of Cellular Lipotoxicity. Biomolecules 2023, 13, 183. [Google Scholar] [CrossRef] [PubMed]
  62. Janoutová, J.; Machaczka, O.; Zatloukalová, A.; Janout, V. Is Alzheimer’s Disease a Type 3 Diabetes? A Review. Cent. Eur. J. Public Health 2022, 30, 139–143. [Google Scholar] [CrossRef]
  63. Hernández-Contreras, K.A.; Martínez-Díaz, J.A.; Hernández-Aguilar, M.E.; Herrera-Covarrubias, D.; Rojas-Durán, F.; Aranda Abreu, G.E. Mecanismos de Asociación Entre Enfermedad de Alzheimer y Diabetes Mellitus: La Paradoja de La Insulina. Arch. Neurocienc. 2021, 25, 45–54. [Google Scholar] [CrossRef]
  64. Olawore, O.; Turner, L.; Evans, M.; Johnson, S.; Huling, J.; Bramante, C.; Buse, J.; Stürmer, T. Risk of Post-Acute Sequelae of SARS-CoV-2 Infection (PASC) Among Patients with Type 2 Diabetes Mellitus on Anti-Hyperglycemic Medications. Clin. Epidemiol. 2024, 16, 379–393. [Google Scholar] [CrossRef]
  65. Hass, D.T.; Barnstable, C.J. Uncoupling Proteins in the Mitochondrial Defense against Oxidative Stress. Prog. Retin. Eye Res. 2021, 83, 100941. [Google Scholar] [CrossRef]
  66. Thangavel, R.; Kempuraj, D.; Zaheer, S.; Raikwar, S.; Ahmed, M.E.; Selvakumar, G.P.; Iyer, S.S.; Zaheer, A. Glia Maturation Factor and Mitochondrial Uncoupling Proteins 2 and 4 Expression in the Temporal Cortex of Alzheimer’s Disease Brain. Front. Aging Neurosci. 2017, 9, 150. [Google Scholar] [CrossRef]
  67. Sreedhar, A.; Zhao, Y. Uncoupling Protein 2 and Metabolic Diseases. Mitochondrion 2017, 34, 135–140. [Google Scholar] [CrossRef]
  68. Yan, X.; Xu, F.; Ji, J.; Song, P.; Pei, Y.; He, M.; Wang, Z.; You, S.; Hua, Z.; Cheng, J.; et al. Activation of UCP2 by Anethole Trithione Suppresses Neuroinflammation after Intracerebral Hemorrhage. Acta Pharmacol. Sin. 2022, 43, 811–828. [Google Scholar] [CrossRef]
  69. Guo, Q.; He, J.; Zhang, H.; Yao, L.; Li, H. Oleanolic Acid Alleviates Oxidative Stress in Alzheimer’s Disease by Regulating Stanniocalcin-1 and Uncoupling Protein-2 Signalling. Clin. Exp. Pharmacol. Physiol. 2020, 47, 1263–1271. [Google Scholar] [CrossRef] [PubMed]
  70. Wu, Z.; Zhao, Y.; Zhao, B. Superoxide Anion, Uncoupling Proteins and Alzheimer’s Disease. J. Clin. Biochem. Nutr. 2010, 46, 187–194. [Google Scholar] [CrossRef] [PubMed]
  71. Shi, X.; Wei, T.; Hu, Y.; Wang, M.; Tang, Y. The Associations between Plasma Soluble Trem1 and Neurological Diseases: A Mendelian Randomization Study. J. Neuroinflamm. 2022, 19, 218. [Google Scholar] [CrossRef]
  72. Replogle, J.M.; Chan, G.; White, C.C.; Raj, T.; Winn, P.A.; Evans, D.A.; Sperling, R.A.; Chibnik, L.B.; Bradshaw, E.M.; Schneider, J.A.; et al. A TREM 1 Variant Alters the Accumulation of Alzheimer-related Amyloid Pathology. Ann. Neurol. 2015, 77, 469–477. [Google Scholar] [CrossRef]
  73. Jiang, T.; Gong, P.-Y.; Tan, M.-S.; Xue, X.; Huang, S.; Zhou, J.-S.; Tan, L.; Zhang, Y.-D. Soluble TREM1 Concentrations Are Increased and Positively Correlated with Total Tau Levels in the Plasma of Patients with Alzheimer’s Disease. Aging Clin. Exp. Res. 2019, 31, 1801–1805. [Google Scholar] [CrossRef] [PubMed]
  74. Gombart, A.F.; Pierre, A.; Maggini, S. A Review of Micronutrients and the Immune System–Working in Harmony to Reduce the Risk of Infection. Nutrients 2020, 12, 236. [Google Scholar] [CrossRef]
  75. Yazdanpanah, F.; Hamblin, M.R.; Rezaei, N. The Immune System and COVID-19: Friend or Foe? Life Sci. 2020, 256, 117900. [Google Scholar] [CrossRef]
  76. Kratzer, B.; Gattinger, P.; Trapin, D.; Ettel, P.; Körmöczi, U.; Rottal, A.; Stieger, R.B.; Sehgal, A.N.A.; Feichter, M.; Borochova, K.; et al. Differential Decline of SARS-CoV-2-specific Antibody Levels, Innate and Adaptive Immune Cells, and Shift of Th1/Inflammatory to Th2 Serum Cytokine Levels Long after First COVID-19. Allergy 2024, 79, 2482–2501. [Google Scholar] [CrossRef]
  77. Wu, K.-M.; Zhang, Y.-R.; Huang, Y.-Y.; Dong, Q.; Tan, L.; Yu, J.-T. The Role of the Immune System in Alzheimer’s Disease. Ageing Res. Rev. 2021, 70, 101409. [Google Scholar] [CrossRef]
  78. Hernández-Contreras-Contreras, K.A.; Hernández-Aguilar-Aguilar, M.E.; Herrera-Covarrubias, D.; Rojas-Durán, F.; Aranda-Abreu, G.E. ¿La Neuroinflamación Por La COVID 19 Es Una Estrategia Fallida Del Organismo Para Combatir al Virus? 2022, 2, 1–7. Available online: https://igbmgenetica.medium.com/sobre-los-autores-c1fc743c1610 (accessed on 15 January 2025).
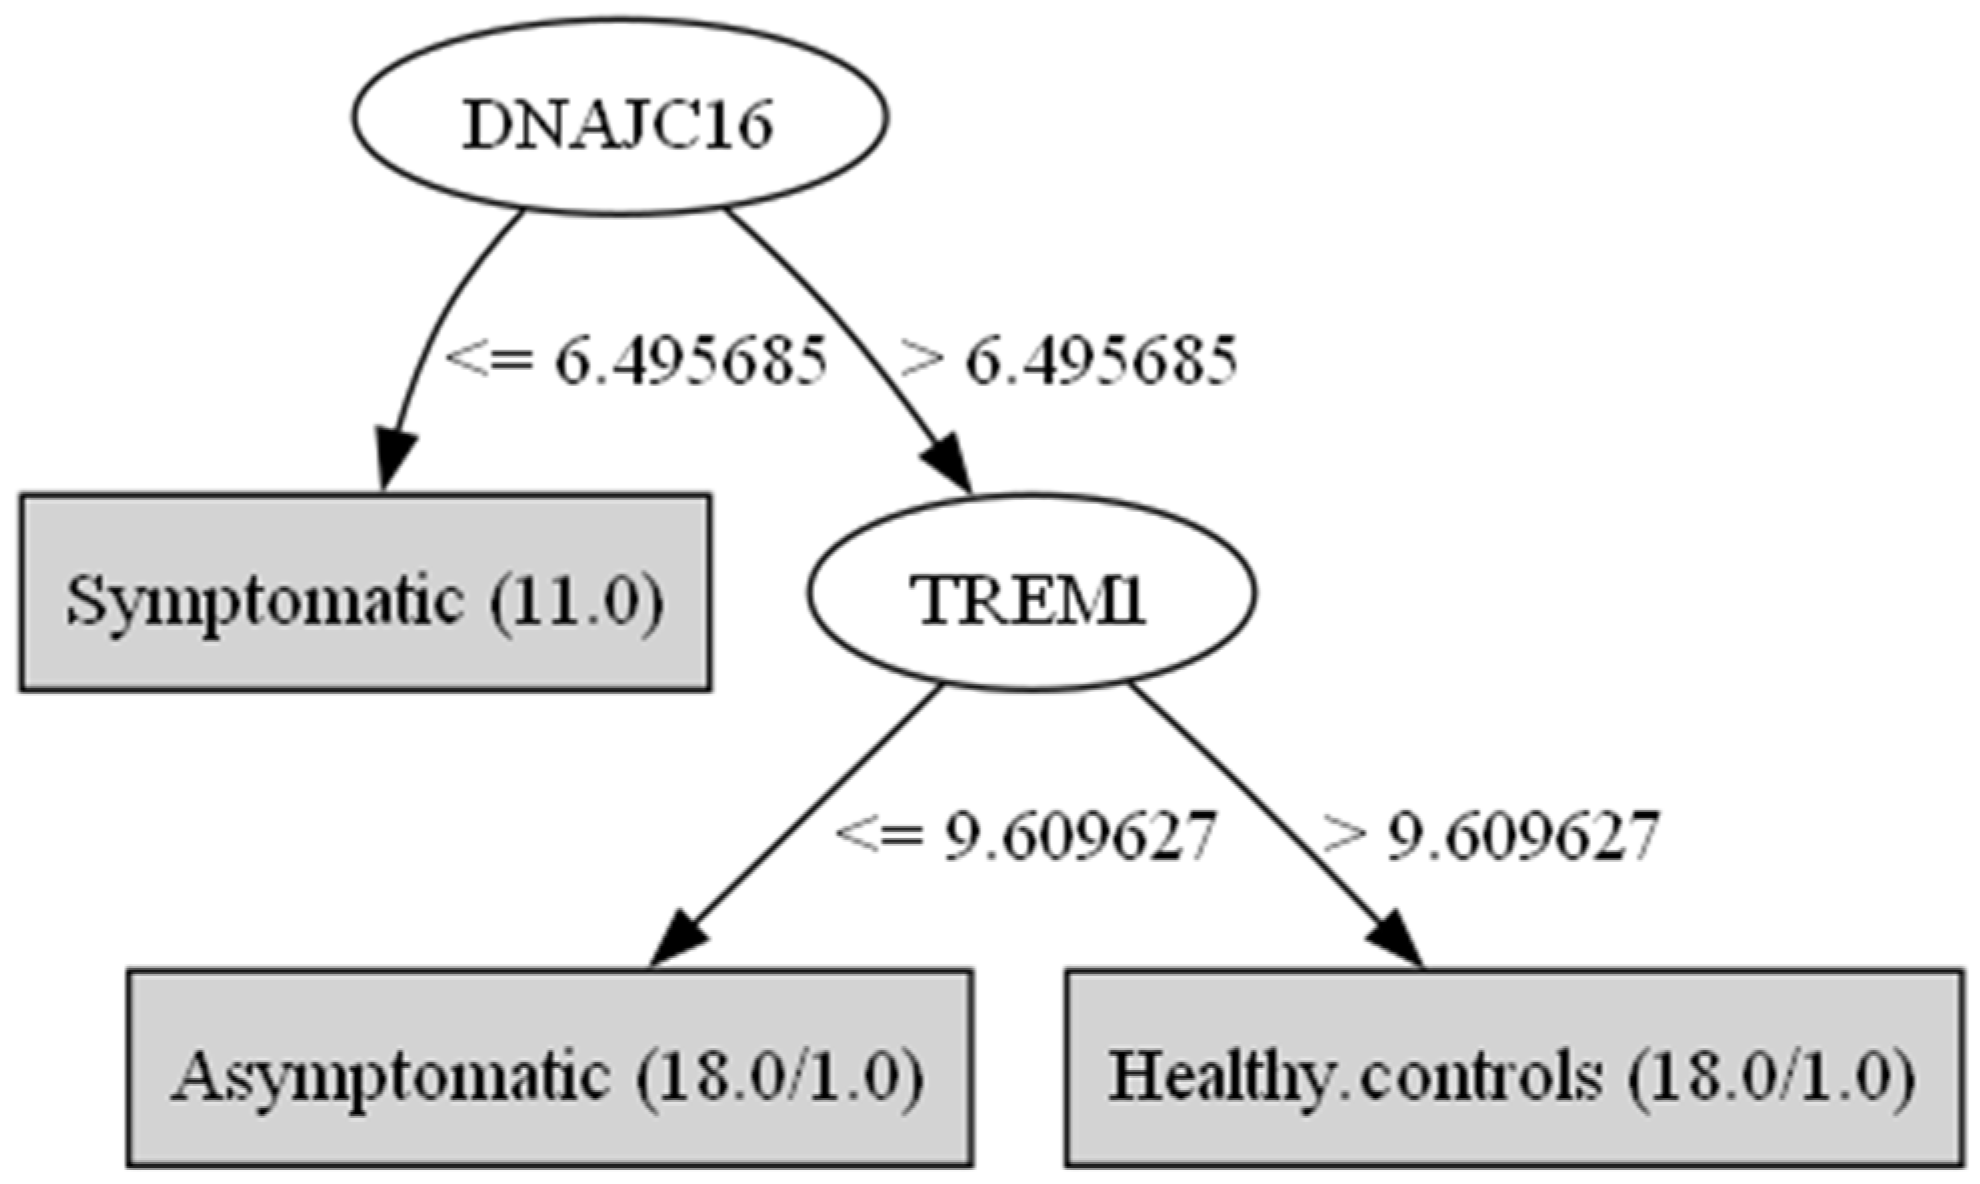
Figure 1. Decision tree with the result of the selected attributes.
Biomedinformatics 05 00026 g001
Figure 2. Decision tree of whole gene expression matrix.
Biomedinformatics 05 00026 g002
Figure 3. Decision tree with the ANOVA result.
Biomedinformatics 05 00026 g003
Figure 4. Comparison of metrics of three decision trees.
Biomedinformatics 05 00026 g004
Figure 5. Receiver operating characteristics (ROC) curves for gene expression.
Biomedinformatics 05 00026 g005
Figure 6. The GO enrichment analysis.
Biomedinformatics 05 00026 g006
Table 1. Significant ANOVA results.
Genes/GroupsSymptomatic MeanSymptomatic std.devAsymptomatic MeanAsymptomatic std.devHealthy Controls MeanHealthy Controls std.devF Ratio
TMEM106A5.8163940.37754897.42413140.233049627.4631780.2478398144.75156
TNFAIP311.6183070.40199258.2874490.503823648.0841490.38873255257.89365
IER310.1676340.53207557.58641620.36643787.7003420.31561947173.8846
ZNF3947.9643140.25566966.65093040.275495386.4638610.2902587110.72787
ABCA138.679610.59937824.1913251.1521254.0479960.5659465122.08616
FBXL146.3976470.22342898.1462270.268707758.2192950.25515413208.84077
CD639.5597830.46963727.5310430.175335157.4475140.3454388167.34497
DUSP111.5268630.35019238.5613770.70146488.8182490.5148774106.75434
PLK37.31272170.45938415.31076340.292848625.4386760.36669925119.47468
PPP1R15A8.714250.65008246.5564140.320099866.76386450.3106922103.9078
Table 2. Confusion matrix of the first decision tree.
abcClassification
1001a = symptomatic
099b = asymptomatic
0315c = healthy controls
Table 3. Confusion matrix of the second decision tree.
abcClassification
902a = symptomatic
0810b = asymptomatic
0810c = healthy controls
Table 4. Confusion matrix of the third decision tree.
abcClassification
1010a = symptomatic
369b = asymptomatic
0117c = healthy controls
Table 5. GO terms significantly enriched.
Descriptionp Valuep AdjustGene IDlog_p Value
L-aspartate transmembrane transport0.001747880.04632427UCP22.75748815
Neutrophil-mediated killing of bacterium0.001747880.04632427TREM12.75748815
Neutrophil-mediated killing of symbiont cell0.001906680.04632427TREM12.71972261
Neutrophil-mediated cytotoxicity0.002224220.04632427TREM12.65282186
Phosphate ion transmembrane transport0.00254170.04632427UCP22.59487596
Sulfate transmembrane transport0.00254170.04632427UCP22.59487596
Sulfate transport0.002700410.04632427UCP22.56857004
Aspartate transmembrane transport0.003017790.04632427UCP22.52031141
Response to lead ion0.00333510.04632427UCP22.47689177
Glutamine metabolic process0.004286620.04632427UCP22.36788545
Phosphate ion transport0.004286620.04632427UCP22.36788545
C4-dicarboxylate transport0.004286620.04632427UCP22.36788545
Response to superoxide0.004445140.04632427UCP22.35211421
Killing by host of symbiont cells0.004445140.04632427TREM12.35211421
Response to oxygen radical0.004603650.04632427UCP22.33689727
Liver regeneration0.004603650.04632427UCP22.33689727
Neutrophil mediated immunity0.005554370.05188886TREM12.2553654
Mitochondrial fission0.006346170.05188886UCP22.19748861
Negative regulation of insulin secretion0.006346170.05188886UCP22.19748861
Disclaimer/Publisher’s Note: The statements, opinions and data contained in all publications are solely those of the individual author(s) and contributor(s) and not of MDPI and/or the editor(s). MDPI and/or the editor(s) disclaim responsibility for any injury to people or property resulting from any ideas, methods, instructions or products referred to in the content.