Article

A Tutorial Toolbox to Simplify Bioinformatics and Biostatistics Analyses of Microbial Omics Data in an Island Context

1
Transmission, Reservoir and Diversity of Pathogens Unit, Pasteur Institute of Guadeloupe, 97139 Les Abymes, Guadeloupe, France
2
Laboratoire des Interactions Virus-Hôtes, Institut Pasteur de la Guyane, 97300 Cayenne, Guyane Française, France
3
Biomics Technological Platform, Institut Pasteur, 75015 Paris, Île-de-France, France
4
Medical and Environmental Bacteriology Group, Pasteur Institute of New Caledonia, 98845 Noumea, New Caledonia, France
5
Faculty of Medicine Hyacinthe Bastaraud, University of the Antilles, 97110 Pointe-à-Pitre, Guadeloupe, France
6
INSERM, Centre for Clinical Investigation 1424, 97110 Pointe-à-Pitre, Guadeloupe, France
7
Department of Pathogenesis and Control of Chronic and Emerging Infections, University of Montpellier, INSERM, 34394 Montpellier, Occitania, France
8
Laboratory of Clinical Microbiology, University Hospital Centre of Guadeloupe, 971110 Pointe-à-Pitre, Guadeloupe, France
9
Laboratoire de Mathématiques Informatique et Applications (LAMIA), Université des Antilles, 97110 Pointe-à-Pitre, Guadeloupe, France
*
Author to whom correspondence should be addressed.
These authors contributed equally to this work.
BioMedInformatics 2025, 5(2), 27; https://doi.org/10.3390/biomedinformatics5020027
Submission received: 1 March 2025 / Revised: 26 April 2025 / Accepted: 28 April 2025 / Published: 19 May 2025

Abstract

:
Background: Bioinformatics is increasingly used in various scientific works. Large amounts of heterogeneous data are being generated these days. It is difficult to interpret and analyze these data effectively. Several software tools have been developed to facilitate the handling and analysis of biological data, based on specific needs. Methods: The Galaxy web platform is one of these software tools, allowing free access to users and facilitating the use of thousands of tools. Other software tools, such as Bioconda or Jupyter Notebook, facilitate the installation of tools and their dependencies. In addition to these tools, RStudio can be mentioned as a powerful interface that facilitates the use of the R programming language for data analysis and statistics. Results: The aim of this study is to provide the scientific community with guides on how to perform bioinformatics/biostatistical analyses in a simpler manner. With this work, we also try to democratize well-documented software tools to make them suitable for both bioinformaticians and non-bioinformaticians. We believe that user-friendly guides and real-life/concrete examples will provide end-users with suitable and easy-to-use methods for their bioinformatics analysis needs. Furthermore, tutorials and usage examples are available on our dedicated GitHub repository. Conclusions: These tutorials/examples (In English and/or French) could be used as pedagogical tools to promote bioinformatics analysis and offer potential solutions to several bioinformatics needs. Special emphasis is placed on microbial omics data analysis.

1. Introduction

With the rapid growth of diverse biological data collections, particularly in DNA sequencing around the world, robust bioinformatics and statistical methods are essential to draw meaningful conclusions. Approaches such as metagenomics, metabarcoding, genome assembly and annotation, comparative genomics, and data visualization significantly enhance our understanding of these complex datasets. Bioinformatics plays a crucial role in addressing public health challenges, including antibiotic resistance in pathogens, and requires constant updating [1,2].
For statistical analysis and data visualization, R software (version 4.2.2) and related packages are a popular choice. Other platforms, such as BiostaTGV (https://biostatgv.sentiweb.fr/, accessed on 25 April 2025), RAWGraphs, and iTOL, allow users to perform rapid statistical analyses, create data visualizations, and conduct phylogenetic annotations online, respectively [3,4]. In addition, several dedicated software tools have been developed to facilitate the analysis of biological data. For example, the SPAdes software is specifically designed for de novo genome assembly, while Prokka is used for the annotation of prokaryotic genomes [5,6]. Ongoing initiatives aim to enhance the accessibility of these bioinformatic software tools while also promoting the reproducibility of genomic analyses. Galaxy, KBase, AnVIL, Anvi’o, and QIIME2 are excellent examples of web-based tools, computing environments, or software ecosystems that are actively maintained by a large community of scientists [7,8,9,10,11]. Many instances of Galaxy are freely available worldwide, providing easy access to thousands of specialized bioinformatics tools, regardless of the user’s level of computer training. Other software tools, such as Bioconda (v3.7.2) and Jupyter Notebook v7 (https://jupyter.org/, accessed on 25 April 2025), facilitate the easy use of command lines to install or run bioinformatics scripts directly from a terminal [12]. In addition, following the example of the bio.tools platform, efforts are being made to improve the descriptions of software tools and other digital resources [13].
Many bioinformatics programs are tailored for the UNIX-like operating systems (OS) such as Linux, which also offers software container tools (Docker, Singularity/Apptainer) and workflow management systems (Nextflow, Snakemake) that facilitate access to bioinformatics codes [14,15]. However, non-(bio)informatician scientists often use Microsoft Windows. This second OS lacks the intuitive and flexible command-line interface of Linux. While there are solutions such as virtual machines (VMs) to bridge this gap, command-line interfaces can still present a significant learning curve for these users. One of the main goals of our initiative is to strengthen the scientific community in Guadeloupe (French West Indies) and improve student training by making bioinformatics analysis more accessible [16]. In addition to the comprehensive overview provided below and illustrated in Figure 1, we will provide guides and tutorials on bacterial genomics, metabarcoding, and related statistical analyses. To support these efforts, we have created and will continue to maintain a comprehensive public GitHub repository (version 2.18.1) that brings together valuable resources on bioinformatics and biostatistics (https://github.com/karubiotools/AnssBin, accessed on 25 April 2025).

2. Results

Bioinformatics analysis relies on the management of large amounts of data, which requires both powerful computer systems and software development skills in multiple programming languages. All types of tools are defined with a clear scope of their usage, and contextualized examples will be provided. Whenever applicable, we will provide ready-to-use tools and further documentation.
In this section, we focus on the following: (i) The computer systems/environments that can provide access to bioinformatics tools. (ii) The main steps in genomics and metagenomics are illustrated by concrete examples based on MinION sequencing, one of the most democratized sequencing platforms. (iii) Recommendations are made to users for more reproducible analyses.

2.1. Trained Bioinformatics Users

2.1.1. High Performance Computing in Bioinformatics

High-performance computing (HPC) facilities are essential for analyzing bioinformatics data and accelerating code execution. HPC uses supercomputers and clusters to solve complex problems, providing a powerful infrastructure and environment for research compared to a conventional laptop (Table 1). Typically, an HPC system consists of several compute nodes with central processing units (CPUs) and may also include graphical processing units (GPUs) to enhance computational processes. A notable example is the Exocet cluster at the University of the West Indies, which is well-defined and serves several islands in the Caribbean archipelago (http://calamar.univ-ag.fr/c3i/exocet.html, accessed on 25 April 2025). Most HPC systems, including Exocet, are equipped with a cluster management and job scheduling system called Slurm. An informative user guide is available at https://slurm.schedmd.com/quickstart.html, and practical examples can be found in our GitHub repository.

2.1.2. Programming Languages

An algorithm is a set of rules or procedures that can be followed to perform calculations or solve problems. Various programming languages are used to develop specific software tools depending on the needs (Table 2). Some languages and tools, like R with RStudio (version 2024.12.1+563), are particularly well-suited for statistical analyses [17]. Other languages, such as C/C++ (version 23) and Java (version 24), are used to develop fast-running algorithms. C/C++ are low-level languages used for intensive computing tools. C++ also enables object-oriented programming. Python/Perl and R offer specific packages for bioinformatics applications. Today, Perl seems to be less widely used in bioinformatics, while Python and R are still widely used and offer numerous libraries/APIs. These languages have benefited from the development of big data analysis. For instance, the Biopython library is commonly used for the manipulation of bioinformatics/sequencing files (such as FASTA or FASTQ) [18]. Languages like Perl or Shell scripting can be useful for text processing and automating tasks, especially when working with command-line tools. Finally, Bash scripts are used to easily execute programs or code in the terminal or on HPC installations. Golang (often referred to as Go) and Rust are both modern programming languages designed to address different aspects of software development. Go has a simple syntax and a small set of language features, which makes it easy to learn and use. However, the Rust programming language is designed for performance and can match the speed of C/C++.

2.1.3. Virtual Machines and Windows Subsystem for Linux

VMs are fully virtualized environments that run on a physical machine. Multiple VMs running different OS, such as Linux, macOS, and Microsoft Windows, can coexist on the same machine. Among these, VirtualBox is an open-source software that enables OS virtualization. An example of how to easily install it is available in our GitHub repository (https://github.com/karubiotools/AnssBin/tree/main/Virtual_Machine; V6.1; Linux Ubuntu distribution, accessed on 25 April 2025), and was initially shared within the KaruBioNet network [16]. This complements other tutorials available online (https://www.virtualbox.org/wiki/Documentation, accessed on 25 April 2025). Additionally, Windows Subsystem for Linux (WSL) allows users to install a Linux distribution on their Windows OS (https://docs.microsoft.com/en-us/windows/wsl/install, accessed on 25 April 2025). Users can also remotely access a Unix cluster using tools such as PuTTY (https://www.putty.org/, accessed on 25 April 2025) or MobaXterm (https://mobaxterm.mobatek.net/, accessed on 25 April 2025).

2.1.4. Jupyter Notebook

Jupyter Notebook is an open-source web-based interactive platform allowing users to develop/write computing code intuitively and visualize data easily. User-friendly guides exist to better understand how Jupyter works (e.g., https://pyspc.readthedocs.io/fr/latest/_downloads/6a923115b1304685790dcacca223bc7f/guide.pdf, accessed on 25 April 2025). Jupyter Notebook supports interactive computing, allowing users to write and execute code in real-time. This is particularly useful for data analysis, scientific research, and educational purposes. Although it was originally developed for Python, Jupyter Notebook supports over 40 programming languages, including R, Julia, and Scala, through different kernels. Users can embed rich media, such as images, videos, and LaTeX equations, within the notebook, making it a versatile tool for creating comprehensive reports and presentations. Notebooks can be shared with others, ensuring that computational experiments and analyses can be reproduced. This is crucial for scientific research and collaborative projects. This user-friendly web interface makes it accessible for both beginners and experienced programmers. The ability to combine code, text, and visualizations in a single document enhances the learning experience, providing a rich environment for developers and specialized teachers. It serves as an excellent educational tool for teaching programming, data science, and other computational subjects. The ability to combine code with explanatory text makes it ideal for tutorials and lectures. Finally, Jupyter Notebook can be extended with various plugins and widgets, adding functionality such as interactive visualizations and custom user interfaces.

2.1.5. Containers and Package Managers

Docker (https://www.docker.com/, accessed on 25 April 2025) and Singularity/Apptainer (https://sylabs.io/guides/3.0/user-guide/quick_start.html, accessed on 25 April 2025) containers have been developed to facilitate the deployment and use of certain bioinformatics tools. These software containers are widely used and integrate many software tools. Bioconda v3.7.2 (https://bioconda.github.io/, accessed on 25 April 2025) is a distribution of bioinformatics software created as a channel for the versatile Conda package manager (https://conda.io/, accessed on 25 April 2025). Bioconda particularly facilitates bioinformatics software installation by providing full control over the software environment and the possibility to run programs on various machines. The cheat sheet of Conda (https://docs.conda.io/projects/conda/en/stable/user-guide/cheatsheet.html, accessed on 25 April 2025) represents an interesting document that allows you to better familiarize yourself with the use of Conda. It is an open-source environment manager that allows you to install different packages and dependencies, and to switch easily from one environment to another (https://docs.conda.io/projects/conda/en/stable/, accessed on 25 April 2025).
Simplified workflows and a word cloud showing some examples of bioinformatics and biostatistics analyses are shown in Figure 1. Analysis of sequencing data from genomes and metagenomes is used to answer scientific questions. Raw sequencing data must be assembled and/or annotated before being used in meta-and phylogenomic comparative analyses. Some bacterial genomics tools were used to illustrate tutorials/examples.

2.2. Untrained Bioinformatics Users

2.2.1. Galaxy Web Interface

The Galaxy project website (https://galaxyproject.org/, accessed on 25 April 2025) provides global information about the Galaxy platform [19]. It also allows developers to set up their own Galaxy instances by providing well-documented user guides.
The Galaxy web-based platform is designed to make computational biology accessible to everyone, regardless of their programming expertise. It allows users to run bioinformatics tools through a graphical user interface (GUI), without the need to install anything or write code. It was developed with a vision of democratizing bioinformatics by providing accessible, reproducible, and transparent tools for biological data analysis, according to the FAIR principles. It has since evolved into a global community-supported initiative, with hundreds of servers around the world, including public, institutional, and cloud-hosted instances. Galaxy allows the integration of thousands of bioinformatics tools in one place. It is a very intuitive platform, allowing beginners to perform the analysis of their data quickly. Furthermore, Galaxy provides an intuitive way to upload, manage, and share datasets. Users can perform the following tasks: (i) Upload files from their computers, FTP servers, or URLs; (ii) Use public datasets from repositories such as ENA, NCBI, and UCSC; (iii) Organize their data into histories, which record every step of the analysis. Galaxy automatically tracks every step of the analysis, including tool versions, parameters, and input/output files. This ensures that results can be reproduced by anyone at any time, which is a cornerstone of modern science. One of Galaxy’s most powerful features is its workflow editor, which lets users build complex pipelines by connecting tools in a drag-and-drop interface. These workflows can be saved, shared, and reused, helping to standardize and automate analyses. In addition, Galaxy users can share data, workflows, histories, and visualizations with collaborators. This promotes transparency, teaching, and community-driven science. Many published papers now include links to Galaxy histories and workflows.
For many beginners, the need to learn programming languages like Python, R, or bash scripting is a major barrier. Galaxy eliminates this requirement by providing a fully graphical interface. New users can run complex analyses by simply selecting tools from menus, filling out parameter fields, and clicking on the “execute” button. Many university courses, MOOCs, and workshops now incorporate Galaxy into their bioinformatics curricula, including our KaruBioNet network workshops. Each tool within Galaxy includes built-in help documentation and links to tutorials. Beginners can easily follow this documentation, as well as dedicated services such as Galaxy Training (https://training.galaxyproject.org/, accessed on 25 April 2025). This web-based platform offers several tutorials across areas such as genomics, transcriptomics, metagenomics, etc., and it includes sample datasets, hands-on exercises, and instructor materials. The Galaxy Training web portal was used to develop various training materials to help users use our local Galaxy KaruBioNet platform (http://calamar.univ-ag.fr/c3i/galaxy_karubionet.html, accessed on 25 April 2025).

2.2.2. EPI2ME

EPI2ME is a GUI provided by Oxford Nanopore as a companion tool to make bioinformatics analyses accessible to non-bioinformaticians. It is accompanied by a GitHub repository containing several workflows (https://github.com/epi2me-labs, accessed on 25 April 2025). The platform is open-source and offers a range of workflows for various applications, including human genetics, assembly, metagenomics, direct RNA sequencing, infectious disease research, and targeted sequencing. Users can install these workflows with a single click once the EPI2ME GUI is installed on their computer. Most of the workflow documentation can be found in the same GitHub repository. EPI2ME also integrates Nextflow to provide scalable and reproducible bioinformatics tools across different platforms. EPI2ME supports both local and cloud-based analysis, making it versatile for different research environments. The platform is compatible with macOS, Windows, and Linux, and can be installed on various devices, including laptops, desktops, clusters, or cloud services. EPI2ME aims to simplify the installation and use of bioinformatics software by providing a user-friendly interface and comprehensive resources for quick and efficient data analysis. The platform is designed to enable anyone to analyze their own data, regardless of their prior experience with bioinformatics or computer programming skills.

2.3. Genomics and Metagenomics Workflows: Example of MinION Sequencing

Nanopore sequencing is a third-generation sequencing approach providing long-read sequencing. It allows the sequencing of polynucleotides in the form of native DNA or RNA [20]. This sequencing technology is widely used in many laboratories (although other long-read sequencing technologies are also available, such as Pacific Biosciences). The MinION (https://nanoporetech.com/products/minion, accessed on 25 April 2025) is one of the Nanopore sequencing devices and provides portable, real-time, flexible, and powerful sequencing capabilities.
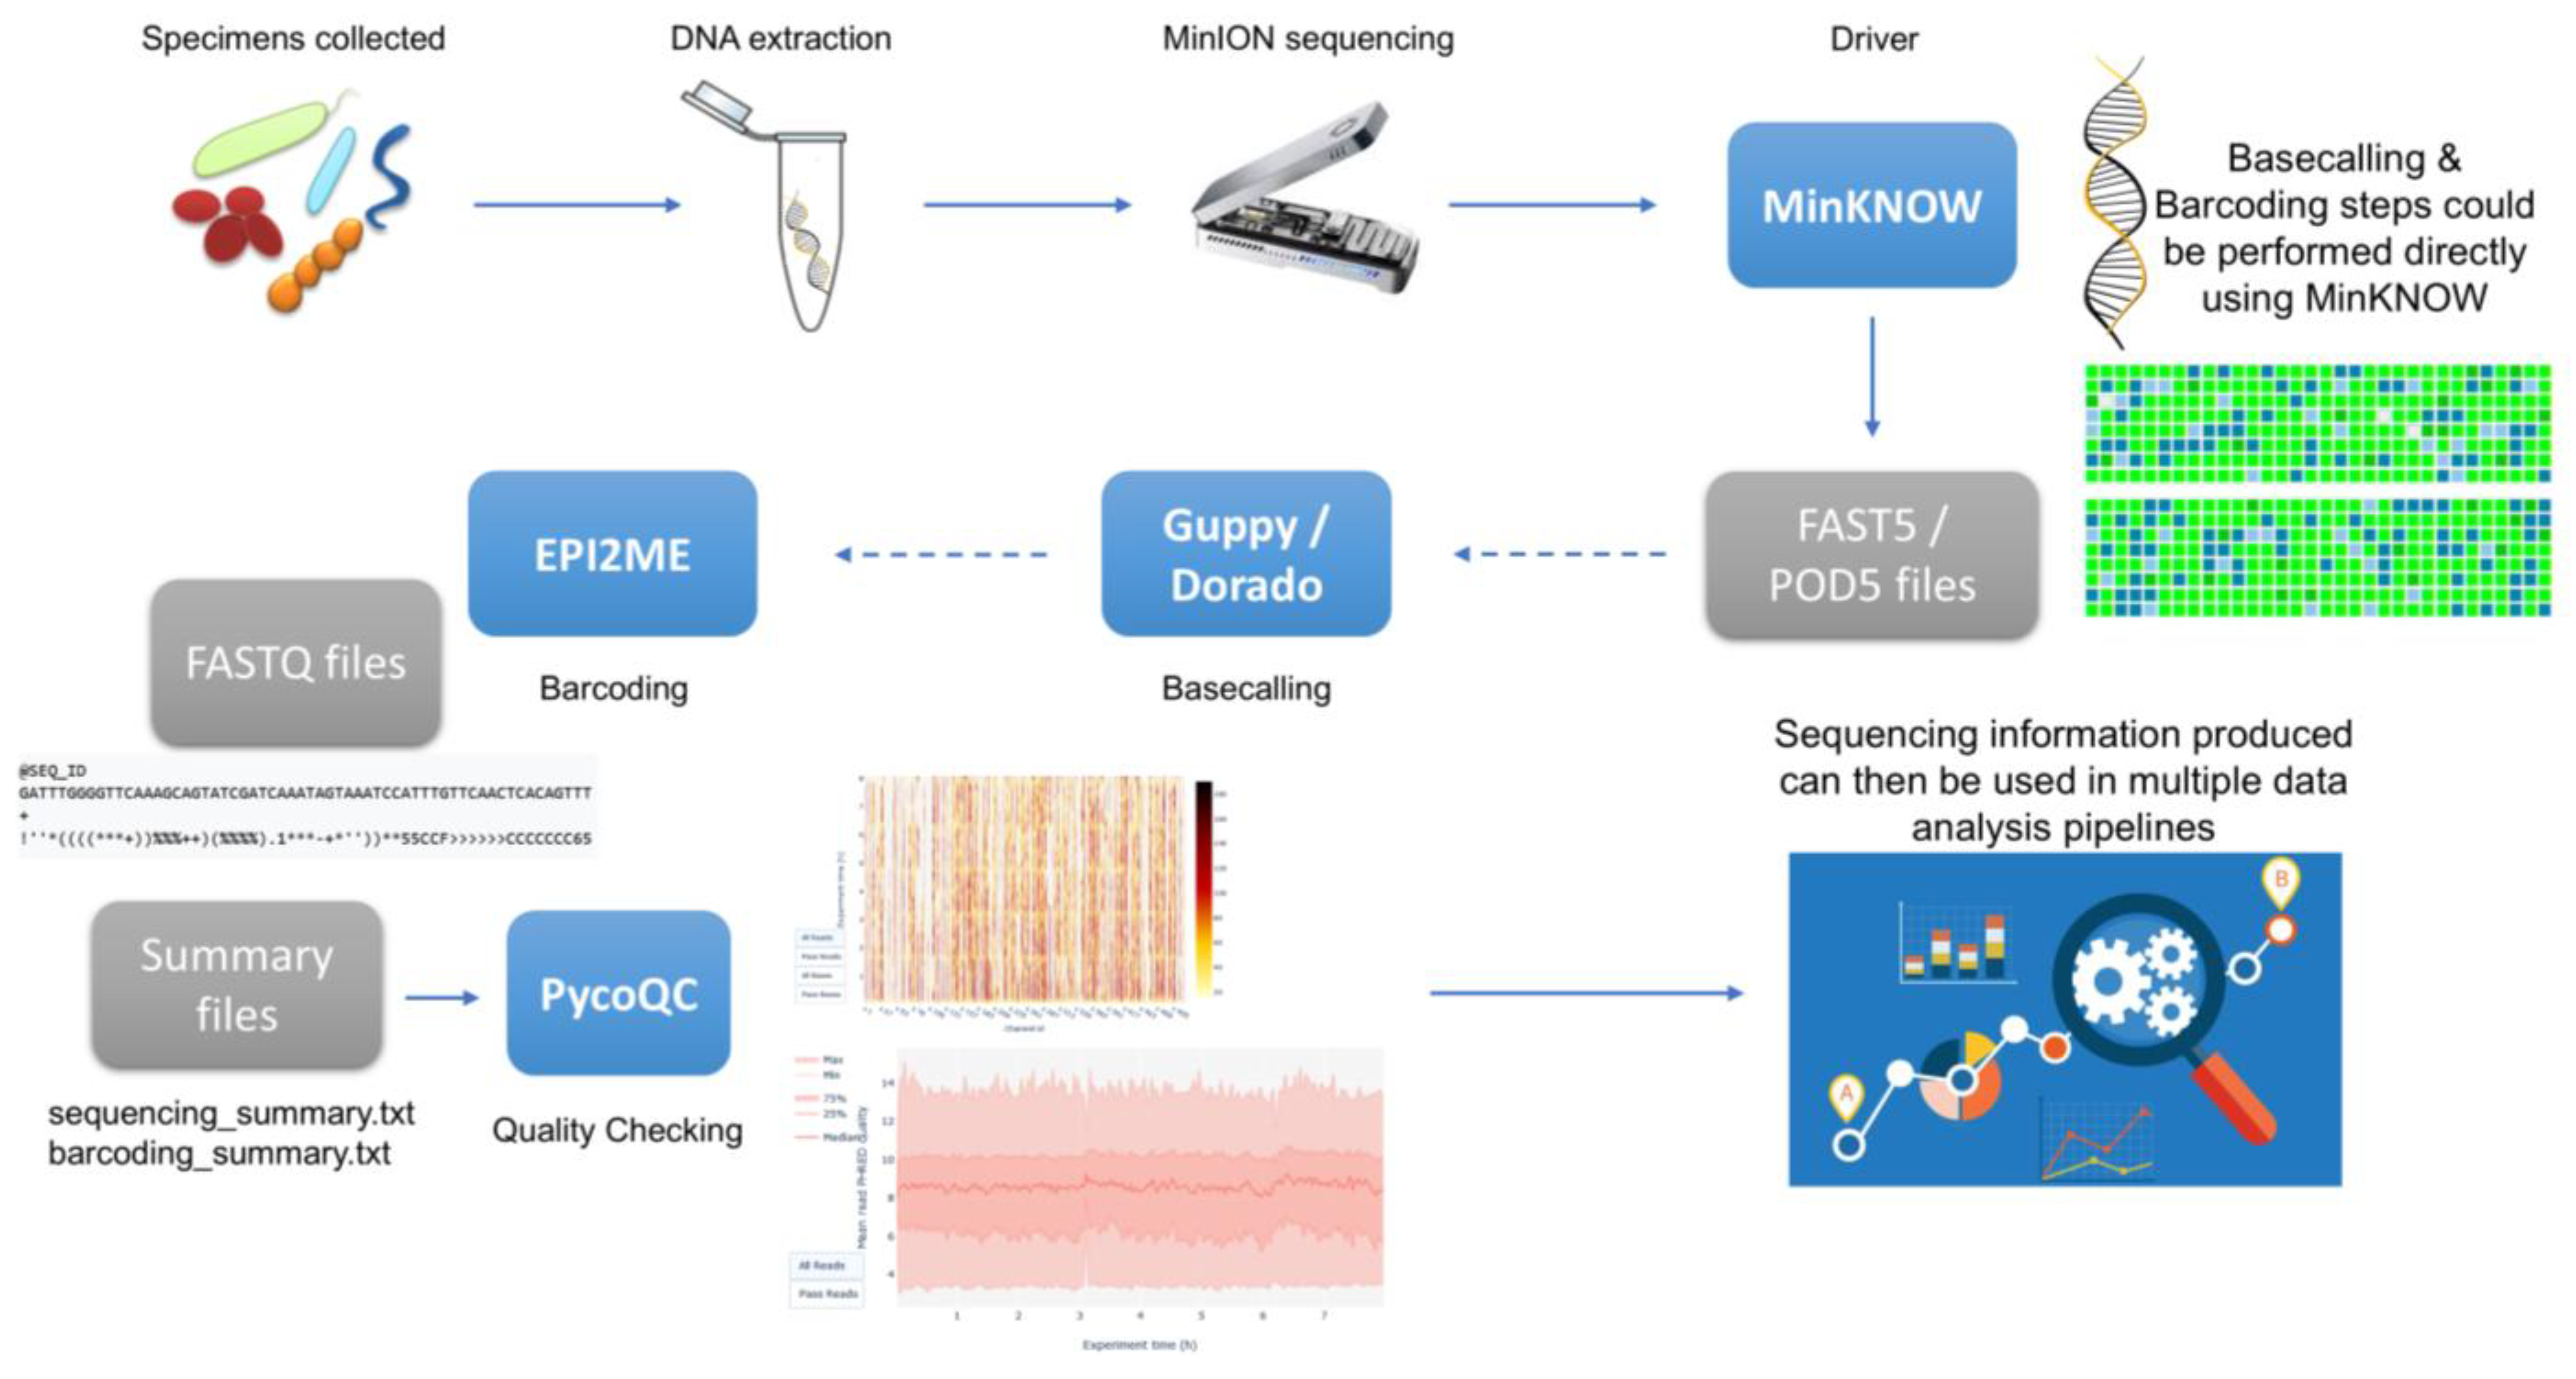
The generated FASTQ genomic reads can then be processed for de novo genome assembly using tools such as Flye or Dragonflye (among others) [21]. If Illumina short-reads are also available, hybrid assembly software tools such as Unicycler [22] can be used to complement the long-reads. For deeper analyses, several dedicated bioinformatics tools could be used from the Oxford Nanopore Technologies GitHub repository (https://github.com/nanoporetech, accessed on 25 April 2025). Basecalling and demultiplexing of the raw fast5 files can be performed directly using the MinKNOW software version 24.02.10 (https://nanoporetech.com/about-us/news/introducing-new-minknow-app, accessed on 25 April 2025). However, dedicated software tools can be used for basecalling: Guppy (https://timkahlke.github.io/LongRead_tutorials/BS_G.html, accessed on 25 April 2025) or the newest released version Dorado (https://github.com/nanoporetech/dorado, accessed on 25 April 2025) or Deepbinner (https://github.com/rrwick/Deepbinner, accessed on 25 April 2025) [23]; and for demultiplexing, the EPI2ME software tool (V5.0.2) provided by Oxford Nanopore Technologies can be used (https://labs.epi2me.io/, accessed on 25 April 2025). Guppy can also perform the demultiplexing step in real time. Once the sequence reads have been obtained and split into each barcode, software tools dedicated to performing the quality control of the data, such as pycoQC (https://a-slide.github.io/pycoQC/, accessed on 25 April 2025) [24] or MinIONQC (https://github.com/roblanf/minion_qc, accessed on 25 April 2025) [25], are used. Note that these quality control tools have been made available in our Galaxy instance. Figure 2 shows a simplified workflow for sequencing and processing data using the MinION.

2.3.1. Genome De Novo Assembly, Scaffolding, and Annotation

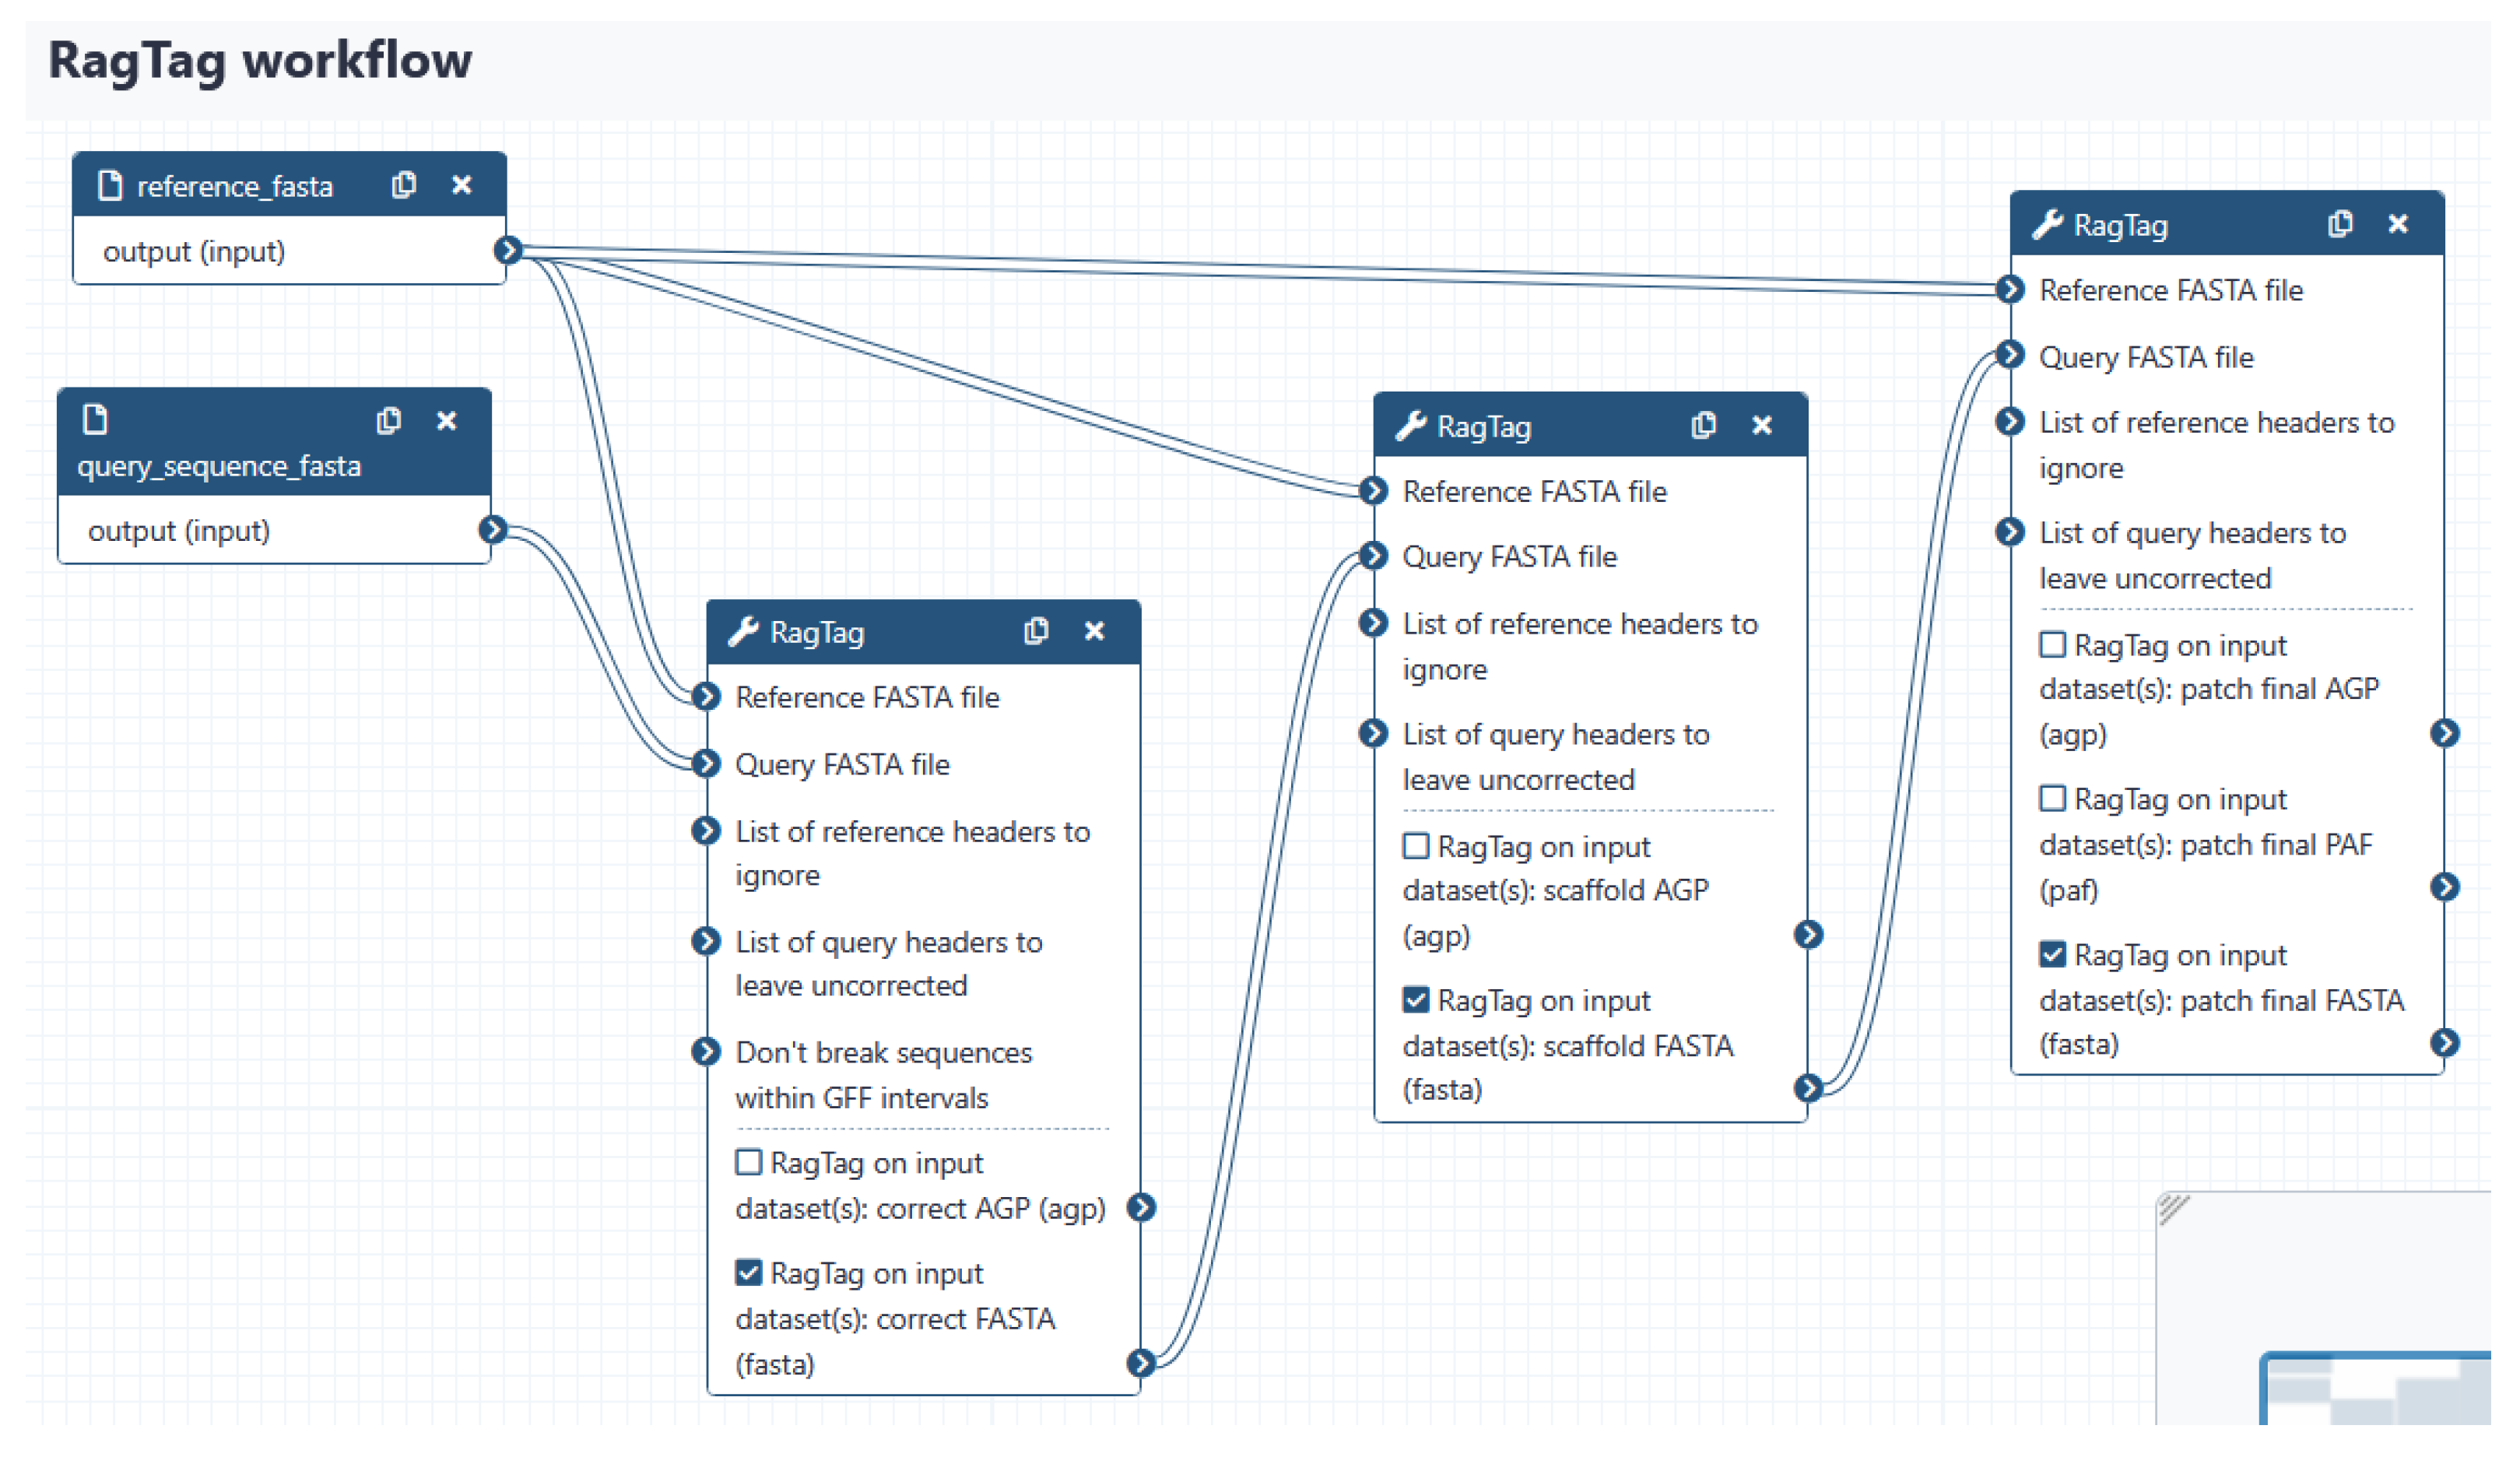
Genome de novo assembly is a key bioinformatics task that analyzes genomes (e.g., gene prediction, motif finding, etc.). Several genome assembly tools exist. For example, SPAdes is a recommended software tool to assemble prokaryotic genomes [3]. Then, an annotation tool like Prokka can be used to determine relevant genomic features (e.g., CDS, rRNA, tRNA, etc.) from de novo assembly data [4]. Other tools can be used for eukaryotic genome assembly and annotation (e.g., Canu, MaSuRCA, and BRAKER3) [26,27,28]. An example of a bacterial genome assembly and annotation performed using command lines is provided in our GitHub repository. Regarding assembly scaffolding methods, various approaches can be used [29]. Scaffolding methods provide a more complete and contiguous reference genome. These methods typically use alignments between contigs and sequencing reads to determine the orientation and order among contigs and to produce longer scaffolds. One of the most used tools is RagTag [30]. This tool allows for automating scaffolding and improving modern genome assemblies by providing homology-based genome assembly correction (RagTag “correct”) and scaffolding (RagTag “scaffold”) tools, as well as two new tools called “patch” and “merge” for genome assembly improvement. A Galaxy workflow (Figure 3) was notably proposed to automate various steps of the RagTag software (i.e., correction, scaffolding, and patching). This pipeline can easily be run from the Galaxy KaruBioNet platform (http://calamar.univ-ag.fr/c3i/galaxy_karubionet.html, accessed on 25 April 2025) by selecting the “Workflow” thumbnail and clicking on the “Run Workflow” button.
The same workflow (RagTag) has also been implemented in a Bash script, available at: https://github.com/karubiotools/AnssBin/blob/main/Bash/ragtag_workflow.sh, accessed on 25 April 2025.
This pipeline (Bash script) can be installed and operated using the provided guide (https://github.com/karubiotools/AnssBin/blob/main/Bash/How_to_install_and_use_RagTag_workflow.md, accessed on 25 April 2025).

2.3.2. Basic Local Alignment Search Tool (BLAST)

BLAST (version 2.16.0) is one of the most popular bioinformatics software packages [31]. BLAST is a sequence homology search tool based on local alignment between two sequences. BLAST performs its searches in two main steps. First, gapped (or not) short k-mers matching is performed between the queries (the sequences to be searched) and the subjects (the database, potentially known sequences). Then, the Smith–Waterman local alignment algorithm is used to determine the alignment between queries and subjects. BLAST can perform nucleotides vs nucleotides (BLASTn), nucleotides vs proteins (BLASTx), proteins vs proteins (BLASTp), proteins vs translated nucleotides (tBLASTn), and translated nucleotides vs translated nucleotides (tBLASTx) searches.
It remains one of the standard tools for taxonomic assignment in metagenomics studies. Since high-throughput sequencing produces huge amounts of data and an exponential increase in sequenced genes/genomes in reference databases, many adaptations were necessary to complete analyses in an acceptable amount of time. (i) As such, BLAST is called an “embarrassingly parallelizable” algorithm; hence, it can be accelerated by increasing the number of available CPUs, for example, in an HPC context. Many implementations using CPU instructions (e.g., PLAST) or MPI were published [32,33,34]. (ii) Some highly optimized homology search tools, such as DIAMOND and MMseqs2, are based on the BLAST algorithm [35,36]. Such tools gained popularity and replaced BLAST in metagenomics studies.
Concretely, BLAST is available as a web interface on INSDC (International Nucleotide Sequence Database Collaboration) member websites such as NCBI (National Center of Biotechnology) in the USA, ENA (European Nucleotide Archive) in Europe, and DDBJ (DNA Databank of Japan) in Japan. It is also available in an API on such websites. BLAST binaries and databases are also downloadable from (https://ftp.ncbi.nlm.nih.gov/blast/, accessed on 25 April 2025) or Conda-based sites.

2.3.3. Metabarcoding Analysis with DADA2, Phyloseq, and Vegan

Metagenomic analyses generally use two main approaches: (i) Targeted metagenomics (metabarcoding): This approach involves sequencing specific genes, or barcodes, that are conserved across species. By focusing on these marker genes, researchers can identify and quantify the diversity of organisms in a sample. (ii) Shotgun metagenomics: This approach sequences all the genetic material present in an environmental sample, regardless of the identity of the organism. This method captures the genomes of bacteria, viruses, fungi, and other organisms, providing a comprehensive view of the community.
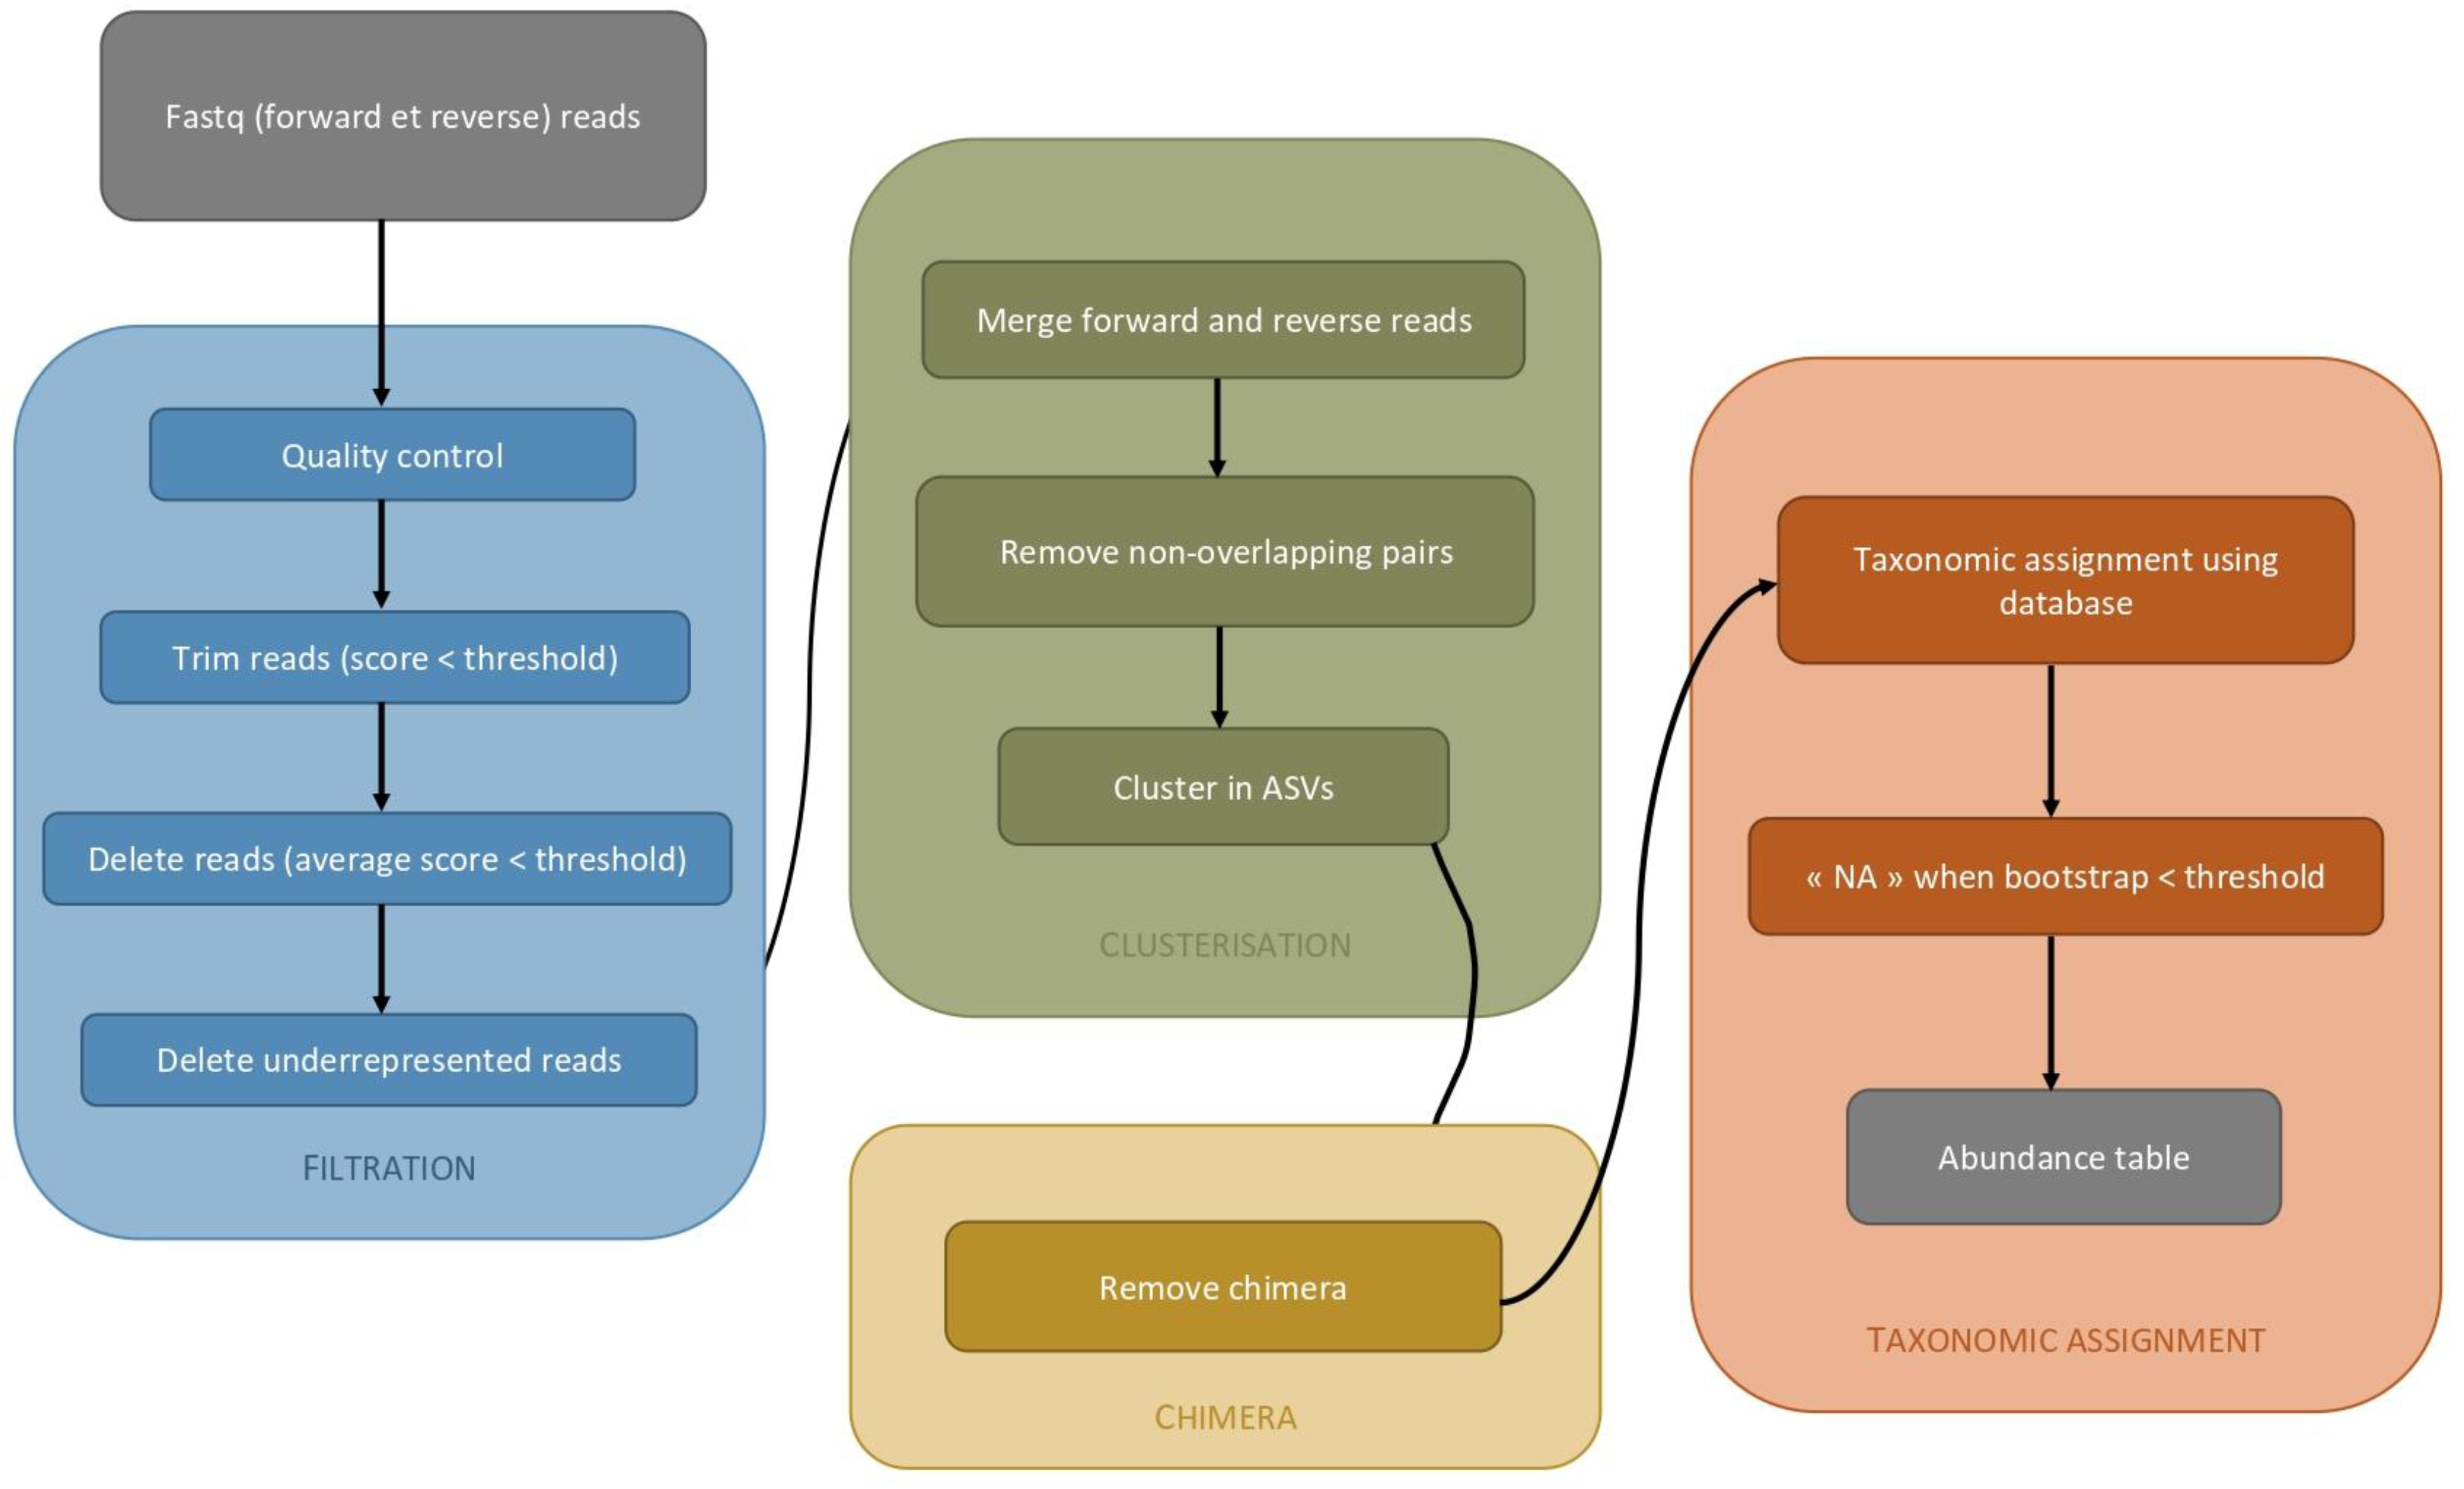
Among the variety of dedicated software tools and workflows, DADA2 is an R library that streamlines several essential steps in metabarcoding data analysis, including filtering, merging, clustering, chimera deletion, and taxonomic assignment [37]. This tool allows the deletion of errors from sequencing metabarcoding data. In fact, sequencing data is not 100% accurate, so a lot of cleaning steps are needed after sequencing. The filtering, the merging, the clustering, the deletion of chimeras, and the taxonomic assignment steps can be performed using this library. The particularity of this library is that the clustering step is based on amplicon sequence variants (ASVs) and not on operational taxonomic units (OTUs) as usual. OTUs are sequence reads with 97% sequence similarity, while ASVs are sequence reads with 100% sequence identity [38,39]. Often, taxa are lost when we use OTUs (https://en.wikipedia.org/wiki/Amplicon_sequence_variant, accessed on 25 April 2025). The ASV method allows us to get a better idea of the diversity of studied organisms and is reproducible [40]. The software outputs an abundance table with all the ASVs and their abundance in each sample.
Phyloseq (https://joey711.github.io/phyloseq/, accessed on 25 April 2025) is a package developed by Paul McMurdie and colleagues [41]. It allows us to perform the second part of the metabarcoding analysis, which includes alpha diversity and beta diversity. That is how the graphical representation of the metabarcoding information is generated. Information is provided by the output tables of the DADA2 library, as well as a table with all the sample data.
Vegan (https://rdrr.io/cran/vegan/, accessed on 25 April 2025) is a statistical library that allows statistical analysis to confirm or refute the exactitude of the data [42]. We can confirm or refute what you see in the graphics to see if a tendency is statistically confirmed. More specifically, the functions are diversity analysis, community ordination, and dissimilarity analysis. Figure 4 shows some cleaning steps that can be performed to initiate metabarcoding analyses.

2.3.4. Core Genome/SNP and Other Phylogenomic Analyses

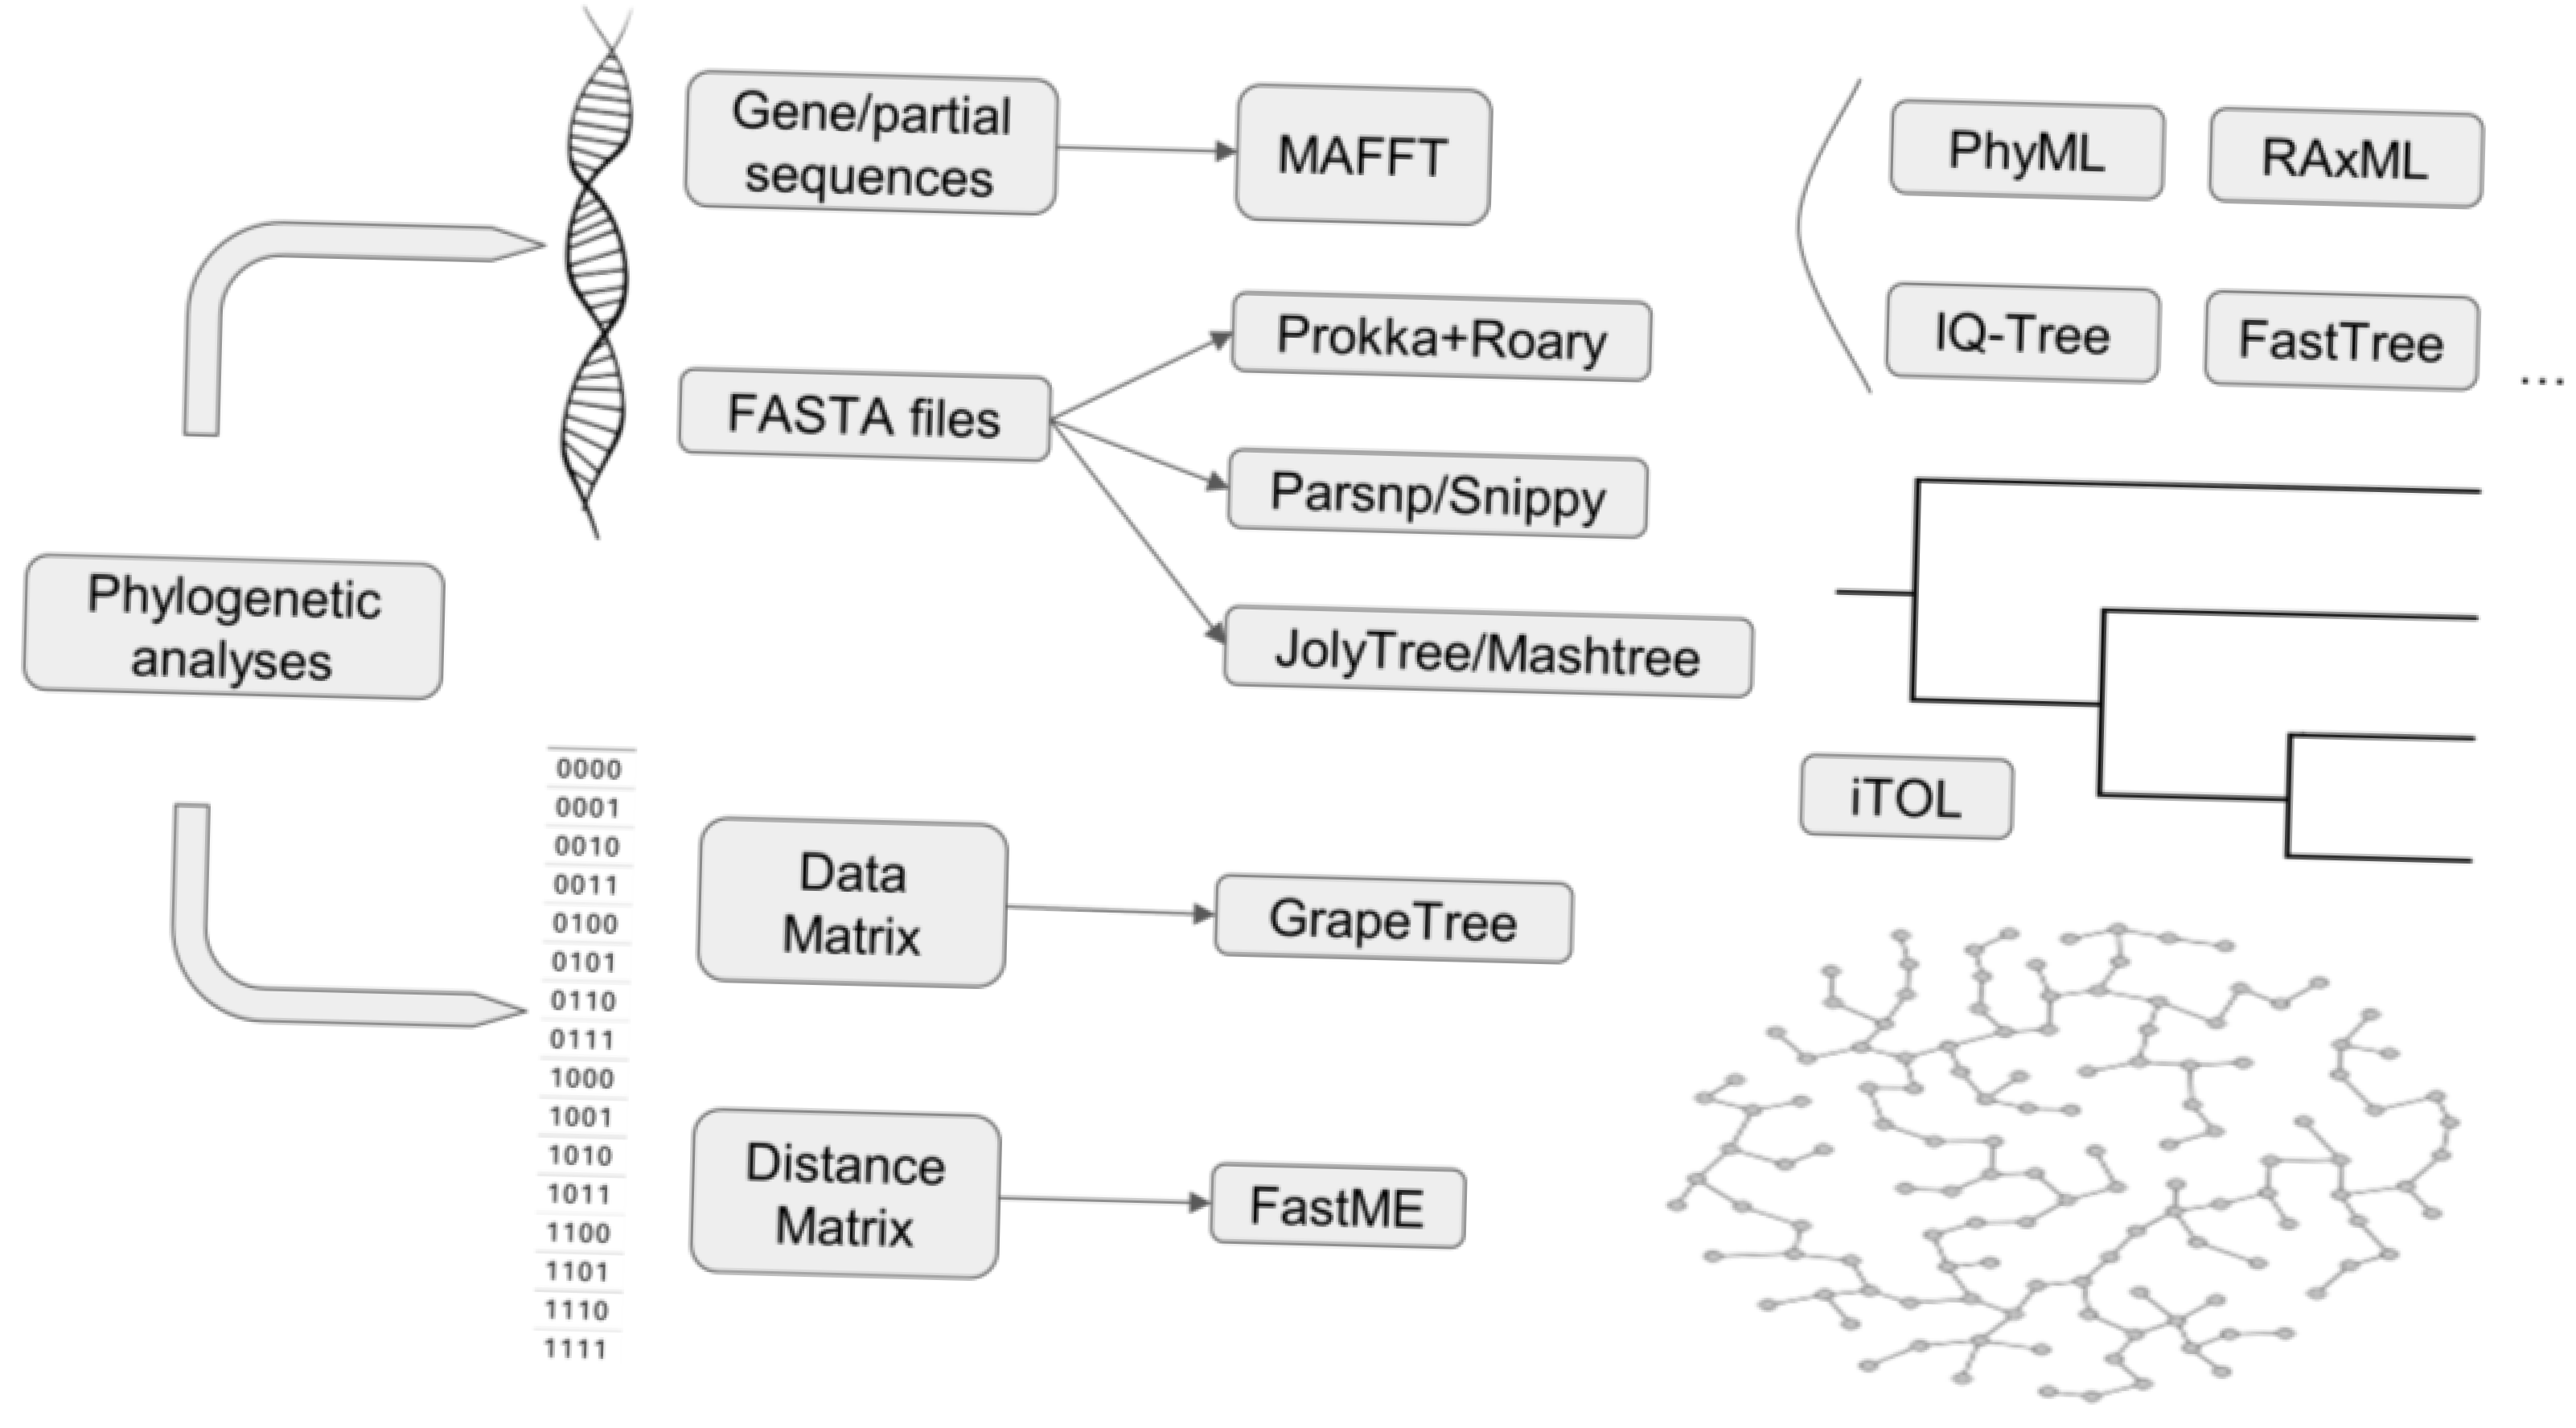
A wide range of tools exists to perform phylogenomic analyses. Some tools, such as Mashtree or JolyTree, could be used directly with FASTA genome sequence files [43,44]. In addition, various phylogenetic software packages based on maximum likelihood, such as RAxML, PhyML, FastTree, and IQ-Tree (among others), generally require an alignment file to function [45,46,47,48]. Figure 5 shows some examples of phylogenetic/phylogenomic analyses from sequence data or matrices. A classical phylogenetic analysis consists of multiple sequence alignment using software tools like MAFFT or MUSCLE [49,50]. Once sequences have been aligned, we can use various software tools to infer phylogenetic trees. A simple workflow is available in our Galaxy instance. Deeper analyses based on SNPs or core genome alignment could be used for specific studies regarding intra-species comparative genomics (for example). A widely used software tool like Roary needs annotated genomes (In the GFF3 format provided by Prokka) as input [51]. Then it can produce a core gene alignment file that can be used in classical phylogenetic software tools. Snippy and Parsnp are other tools that can produce a core SNP alignment file for phylogenetic analyses [52]. Core genome or core SNP phylogenies allow us to get a better overview of evolutionary relations between biological isolates (or genome sequences). Focusing on a few marker genes is also an interesting approach. However, this allows a less in-depth description of the relationships between isolates. Furthermore, phylogenetic inferences can be performed from a data table or a distance matrix using tools such as GrapeTree or FastME, respectively [53,54]. Figure 5 also provides an overview of some tools that could be used for phylogenetic analyses.

2.4. Reproducibility of Pipelines and Workflow Management Systems

In practice, the results published in scientific articles can be difficult to reproduce for various reasons. Variability factors can be experimental (biological and technical variations) or computational (environment, version, tools, and parameter variations). To reproduce a computational analysis, the data analysis must be realized in the same environment, with the same methods, packages/libraries, tools, and their versions as the initial analysis. When producing a computational analysis, a great method to ensure its reproducibility is to use containers and workflow approaches.
Docker, Singularity/Apptainer, and Biocontainers offer great opportunities to develop and manage reproducible pipelines or codes [55,56]. To ensure reproducibility, the computational environment is important, including the different packages/libraries, tools, and their versions. This represents a lot of information to contain. Furthermore, there may be conflicts between them, as each project has its own necessary set of libraries, tools, and versions. To avoid that, the use of virtual environments is recommended, with each computational project having its own virtual environment. Several free, easy-to-use user guides and tutorials are available online, offering practical reproducibility.
Creating a workflow enables you to define a pipeline, i.e., a set of steps (or processes) that always follow each other in the same order, with the same structure of inputs, outputs, and defined parameters. Thus, if someone recovers a workflow from a previous analysis and uses the same identical input data in the workflow, it will produce identical output results (only if the working environment is stable, as mentioned above). An example of a workflow framework is Nextflow (https://www.nextflow.io/docs/latest/basic.html, accessed on 25 April 2025).
Nextflow is a workflow manager that also uses containers to ensure efficient operation and reproducibility. Nextflow is based on a succession of independent processes each with an input and output. Each process can communicate with the other via channels. Snakemake (https://snakemake.readthedocs.io/en/stable/index.html, accessed on 25 April 2025) is also another workflow management system with a Python-based language. These tools are used in GitHub specialized bioinformatic repositories such as nf-core [57].

2.5. Limitations of Proposed Workflows and Tools

Workflows and tools proposed in this manuscript present a non-exhaustive list of available bioinformatics materials for various microbial “omics” analyses. Our approach rather shows an overview of software tools and processes usually employed in the KaruBioNet network to analyze data and set up training sessions. Bioinformatics workflows and tools are essential for analyzing biological data, but they often come with limitations that can affect their usability, scalability, and efficiency. Some of the tools mentioned here show some limitations that are difficult to overcome without appropriate resources. For example, genome assembly tools like SPAdes or Flye need huge computing resources to perform efficiently. SPAdes is not designed for larger genomes, such as mammalian-sized genomes, due to its high memory requirements. For instance, it can require up to 500 GB of RAM or more in multithreaded mode, which is a significant computational burden. Flye, while efficient, still requires high memory usage, especially for large datasets. This can be a limiting factor for researchers without access to high-performance computing resources. Other bioinformatics tools have similar limits.
Although it provides an intuitive and easy-to-use web-based platform for data analysis, the Galaxy Project’s web-based interface can be a limitation for users who need to perform computationally intensive analyses. The platform’s performance can be affected by the number of concurrent users and the size of the datasets being processed. Table 3 shows a comparison of selected bioinformatics tools for genome assembly, basecalling or phylogeny, in terms of computational efficiency, usability, and accuracy.
Finally, we provide a dedicated GitHub page (https://github.com/karubiotools/AnssBin, accessed on 25 April 2025) allowing users to get some information and various examples on how to use software tools for specific or general needs. It is intended to be constantly enriched in the future, with new tools and tutorials. Users new to bioinformatics are directed towards educational platforms like Galaxy or easier-to-learn programming languages like Python (version 3.12). Table 4 summarizes models such as Galaxy, the command line interface (CLI) from an HPC or laptop, which can help bioinformatics users (whatever their level of experience) in the analysis of their data, depending on the size of the dataset and the requirements of the project.

3. Conclusions and Future Directions

In summary, here we offer a GitHub repository providing guides for both bioinformaticians and non-bioinformatics users who would be interested in performing bioinformatics analyses by themselves. We also offer a learning scheme with emphasis on more concrete examples and practical uses based on real data. This GitHub repository aims to evolve in the future to provide more examples and tutorials on concrete lab needs regarding bioinformatics and biostatistics analyses. Supplementary databases and dedicated tools will continue to be developed in the future. These developments will certainly create other needs and strategies for more accurate and efficient data analysis. Specific bioinformatics pipelines or workflows will be added to our GitHub repository as needed. The arrival of artificial intelligence (AI) is also a challenge that will have to be met to promote new ways of analyzing data.

Author Contributions

Conceptualization, D.C. (David Couvin) and V.G.; Methodology, D.C. (David Couvin), V.G., I.Q., S.T., D.C. (Damien Cazenave), S.F., S.V., A.L. and S.B.; software, D.C. (David Couvin), I.Q., S.T., D.C. (Damien Cazenave), N.A. and C.B.; Validation, D.C. (David Couvin), I.Q., S.F. and V.G.; MinION sequencing, S.F., C.B., D.B.M., V.N., Y.R., M.P. and D.C. (David Couvin); Resources, D.C. (David Couvin), I.Q., S.T., D.C. (Damien Cazenave), N.A., C.B., S.F., Y.R., M.P., D.B.M., V.N. and V.G.; Data curation, D.C. (David Couvin), I.Q., S.T., D.C. (Damien Cazenave), N.A., C.B., S.F., Y.R., M.P., S.B., D.B.M., V.N. and V.G.; Writing—original draft preparation, D.C. (David Couvin), V.G., I.Q., S.T., N.A., S.F., S.B., Y.R., C.B. and D.C. (Damien Cazenave); Writing—review and editing, D.C. (David Couvin), V.G., I.Q., S.T., N.A., S.F., M.P., S.B., Y.R., C.B. and D.C. (Damien Cazenave); Visualization, D.C. (David Couvin), D.C. (Damien Cazenave), S.T. and I.Q.; Supervision, A.L., S.B., S.V., S.F. and D.C. (David Couvin). All authors have read and agreed to the published version of the manuscript.

Funding

This study was partly conducted in the framework of the project MALIN ‘Surveillance, diagnosis, control, and impact of infectious diseases of humans, animals, and plants in tropical islands’, grant # 2015-FED-186, supported by the European Union in the framework of the European Regional Development Fund (ERDF) and the Regional Council of Guadeloupe. The funders had no role in study design, data collection and analysis, decision to publish, or preparation of the manuscript.

Institutional Review Board Statement

Not applicable.

Informed Consent Statement

Not applicable.

Data Availability Statement

Data are contained within the article.

Acknowledgments

We are thankful to the Centre Commun de Calcul Intensif (C3I) of the Université des Antilles (Raphaël Pasquier and Pascal Poullet) (http://calamar.univ-ag.fr/c3i/, accessed on 25 April 2025). We would like to thank Alexis Dereeper for his help with the Galaxy platform. We are also grateful to Antoine Talarmin and Nalin Rastogi for the helpful discussions about this work.

Conflicts of Interest

The authors declare no conflicts of interest.

References

  1. Pot, M.; Reynaud, Y.; Couvin, D.; Dereeper, A.; Ferdinand, S.; Bastian, S.; Foucan, T.; Pommier, J.-D.; Valette, M.; Talarmin, A.; et al. Emergence of a Novel Lineage and Wide Spread of a blaCTX-M-15/IncHI2/ST1 Plasmid among Nosocomial Enterobacter in Guadeloupe. Antibiotics 2022, 11, 1443. [Google Scholar] [CrossRef] [PubMed]
  2. Dereeper, A.; Gruel, G.; Pot, M.; Couvin, D.; Barbier, E.; Bastian, S.; Bambou, J.-C.; Gelu-Simeon, M.; Ferdinand, S.; Guyomard-Rabenirina, S.; et al. Limited Transmission of Klebsiella pneumoniae among Humans, Animals, and the Environment in a Caribbean Island, Guadeloupe (French West Indies). Microbiol. Spectr. 2022, 10, e0124222. [Google Scholar] [CrossRef] [PubMed]
  3. Mauri, M.; Elli, T.; Caviglia, G.; Uboldi, G.; Azzi, M. RAWGraphs: A visualisation platform to create open outputs. In Proceedings of the 12th Biannual Conference on Italian SIGCHI Chapter, Cagliari, Italy, 18–20 September 2017; ACM: New York, NY, USA, 2017; pp. 28:1–28:5. [Google Scholar] [CrossRef]
  4. Letunic, I.; Bork, P. Interactive Tree of Life (iTOL) v6: Recent updates to the phylogenetic tree display and annotation tool. Nucleic Acids Res. 2024, 52, W78–W82. [Google Scholar] [CrossRef] [PubMed]
  5. Bankevich, A.; Nurk, S.; Antipov, D.; Gurevich, A.A.; Dvorkin, M.; Kulikov, A.S.; Lesin, V.M.; Nikolenko, S.I.; Pham, S.; Prjibelski, A.D.; et al. SPAdes: A new genome assembly algorithm and its applications to single-cell sequencing. J. Comput. Biol. 2012, 19, 455–477. [Google Scholar] [CrossRef]
  6. Seemann, T. Prokka: Rapid Prokaryotic Genome Annotation. Bioinformatics 2014, 30, 2068–2069. [Google Scholar] [CrossRef] [PubMed]
  7. The Galaxy Community; Afgan, E.; Nekrutenko, A.; Blankenberg, D.; Goecks, J.; Schatz, M.C.; Ostrovsky, A.E.; Mahmoud, A.; Lonie, A.J.; Syme, A.; et al. The Galaxy platform for accessible, reproducible and collaborative biomedical analyses: 2022 update. Nucleic Acids Res. 2022, 50, W345–W351. [Google Scholar] [CrossRef]
  8. Arkin, A.P.; Cottingham, R.W.; Henry, C.S.; Harris, N.L.; Stevens, R.L.; Maslov, S.; Dehal, P.; Ware, D.; Perez, F.; Canon, S.; et al. KBase: The United States Department of Energy Systems Biology Knowledgebase. Nat. Biotechnol. 2018, 36, 566–569. [Google Scholar] [CrossRef]
  9. Schatz, M.C.; Philippakis, A.A.; Afgan, E.; Banks, E.; Carey, V.J.; Carroll, R.J.; Culotti, A.; Ellrott, K.; Goecks, J.; Grossman, R.L.; et al. Inverting the model of genomics data sharing with the NHGRI Genomic Data Science Analysis, Visualization, and Informatics Lab-space. Cell Genom. 2022, 2, 100085. [Google Scholar] [CrossRef]
  10. Eren, A.M.; Kiefl, E.; Shaiber, A.; Veseli, I.; Miller, S.E.; Schechter, M.S.; Fink, I.; Pan, J.N.; Yousef, M.; Fogarty, E.C.; et al. Community-led, integrated, reproducible multi-omics with anvi’o. Nat. Microbiol. 2021, 6, 3–6. [Google Scholar] [CrossRef]
  11. Bolyen, E.; Rideout, J.R.; Dillon, M.R.; Bokulich, N.A.; Abnet, C.C.; Al-Ghalith, G.A.; Alexander, H.; Alm, E.J.; Arumugam, M.; Asnicar, F.; et al. Reproducible, Interactive, Scalable and Extensible Microbiome Data Science using QIIME 2. Nat. Biotechnol. 2019, 37, 852–857. [Google Scholar] [CrossRef]
  12. Grüning, B.; Dale, R.; Sjödin, A.; Chapman, B.A.; Rowe, J.; Tomkins-Tinch, C.H.; Valieris, R.; Köster, J.; Bioconda Team. Bioconda: Sustainable and comprehensive software distribution for the life sciences. Nat. Methods 2018, 15, 475–476. [Google Scholar] [CrossRef] [PubMed]
  13. Ison, J.; Rapacki, K.; Ménager, H.; Kalaš, M.; Rydza, E.; Chmura, P.; Anthon, C.; Beard, N.; Berka, K.; Bolser, D.; et al. Tools and data services registry: A community effort to document bioinformatics resources. Nucleic Acids Res. 2016, 44, D38–D47. [Google Scholar] [CrossRef] [PubMed]
  14. Di Tommaso, P.; Chatzou, M.; Floden, E.W.; Barja, P.P.; Palumbo, E.; Notredame, C. Nextflow enables reproducible computational workflows. Nat. Biotechnol. 2017, 35, 316–319. [Google Scholar] [CrossRef]
  15. Mölder, F.; Jablonski, K.P.; Letcher, B.; Hall, M.B.; Tomkins-Tinch, C.H.; Sochat, V.; Forster, J.; Lee, S.; Twardziok, S.O.; Kanitz, A.; et al. Sustainable data analysis with Snakemake. F1000Research 2021, 10, 33. [Google Scholar] [CrossRef]
  16. Couvin, D.; Dereeper, A.; Meyer, D.F.; Noroy, C.; Gaete, S.; Bhakkan, B.; Poullet, N.; Gaspard, S.; Bezault, E.; Marcelino, I.; et al. KaruBioNet: A network and discussion group for a better collaboration and structuring of bioinformatics in Guadeloupe (French West Indies). Bioinform. Adv. 2022, 2, vbac010. [Google Scholar] [CrossRef] [PubMed]
  17. R Core Team. R: A Language and Environment for Statistical Computing; R Foundation for Statistical Computing: Vienna, Austria, 2022; Available online: https://www.R-project.org/ (accessed on 11 December 2023).
  18. Cock, P.J.A.; Antao, T.; Chang, J.T.; Chapman, B.A.; Cox, C.J.; Dalke, A.; Friedberg, I.; Hamelryck, T.; Kauff, F.; Wilczynski, B.; et al. Biopython: Freely available Python tools for computational molecular biology and bioinformatics. Bioinformatics 2009, 25, 1422–1423. [Google Scholar] [CrossRef]
  19. Afgan, E.; Baker, D.; Batut, B.; van den Beek, M.; Bouvier, D.; Čech, M.; Chilton, J.; Clements, D.; Coraor, N.; Grüning, B.A.; et al. The Galaxy platform for accessible, reproducible and collaborative biomedical analyses: 2018 update. Nucleic Acids Res. 2018, 46, W537–W544. [Google Scholar] [CrossRef] [PubMed]
  20. Lu, H.; Giordano, F.; Ning, Z. Oxford Nanopore MinION Sequencing and Genome Assembly. Genom. Proteom. Bioinform. 2016, 14, 265–279. [Google Scholar] [CrossRef]
  21. Kolmogorov, M.; Yuan, J.; Lin, Y.; Pevzner, P.A. Assembly of long, error-prone reads using repeat graphs. Nat. Biotechnol. 2019, 37, 540–546. [Google Scholar] [CrossRef]
  22. Wick, R.R.; Judd, L.M.; Gorrie, C.L.; Holt, K.E. Unicycler: Resolving bacterial genome assemblies from short and long sequencing reads. PLoS Comput. Biol. 2017, 13, e1005595. [Google Scholar] [CrossRef]
  23. Wick, R.R.; Judd, L.M.; Holt, K.E. Deepbinner: Demultiplexing barcoded Oxford Nanopore reads with deep convolutional neural networks. PLoS Comput. Biol. 2018, 14, e1006583. [Google Scholar] [CrossRef]
  24. Leger, A.; Leonardi, T. pycoQC, interactive quality control for Oxford Nanopore Sequencing. J. Open Source Softw. 2019, 4, 1236. [Google Scholar] [CrossRef]
  25. Lanfear, R.; Schalamun, M.; Kainer, D.; Wang, W.; Schwessinger, B. MinIONQC: Fast and simple quality control for MinION sequencing data. Bioinformatics 2018, 35, 523–525. [Google Scholar] [CrossRef] [PubMed]
  26. Koren, S.; Walenz, B.P.; Berlin, K.; Miller, J.R.; Bergman, N.H.; Phillippy, A.M. Canu: Scalable and accurate long-read assembly via adaptive k-mer weighting and repeat separation. Genome Res. 2017, 27, 722–736. [Google Scholar] [CrossRef] [PubMed]
  27. Zimin, A.V.; Marçais, G.; Puiu, D.; Roberts, M.; Salzberg, S.L.; Yorke, J.A. The MaSuRCA genome assembler. Bioinformatics 2013, 29, 2669–2677. [Google Scholar] [CrossRef]
  28. Gabriel, L.; Brůna, T.; Hoff, K.J.; Ebel, M.; Lomsadze, A.; Borodovsky, M.; Stanke, M. BRAKER3: Fully automated genome annotation using RNA-Seq and protein evidence with GeneMark-ETP, AUGUSTUS and TSEBRA. Genome Res. 2024, 34, 769–777. [Google Scholar] [CrossRef] [PubMed]
  29. Luo, J.; Wei, Y.; Lyu, M.; Wu, Z.; Liu, X.; Luo, H.; Yan, C. A comprehensive review of scaffolding methods in genome assembly. Briefings Bioinform. 2021, 22, bbab033. [Google Scholar] [CrossRef]
  30. Alonge, M.; Lebeigle, L.; Kirsche, M.; Jenike, K.; Ou, S.; Aganezov, S.; Wang, X.; Lippman, Z.B.; Schatz, M.C.; Soyk, S. Automated assembly scaffolding using RagTag elevates a new tomato system for high-throughput genome editing. Genome Biol. 2022, 23, 1–19. [Google Scholar] [CrossRef]
  31. Boratyn, G.M.; Camacho, C.; Cooper, P.S.; Coulouris, G.; Fong, A.; Ma, N.; Madden, T.L.; Matten, W.T.; McGinnis, S.D.; Merezhuk, Y.; et al. BLAST: A more efficient report with usability improvements. Nucleic Acids Res. 2013, 41, W29–W33. [Google Scholar] [CrossRef]
  32. Van Nguyen, H.; Lavenier, D. PLAST: Parallel local alignment search tool for database comparison. BMC Bioinform. 2009, 10, 329. [Google Scholar] [CrossRef]
  33. Mirdita, M.; Steinegger, M.; Breitwieser, F.; Söding, J.; Karin, E.L. Fast and sensitive taxonomic assignment to metagenomic contigs. Bioinformatics 2021, 37, 3029–3031. [Google Scholar] [CrossRef] [PubMed]
  34. Yim, W.C.; Cushman, J.C. Divide and Conquer (DC) BLAST: Fast and easy BLAST execution within HPC environments. PeerJ 2017, 5, e3486. [Google Scholar] [CrossRef] [PubMed]
  35. Buchfink, B.; Reuter, K.; Drost, H.-G. Sensitive protein alignments at tree-of-life scale using DIAMOND. Nat. Methods 2021, 18, 366–368. [Google Scholar] [CrossRef]
  36. Steinegger, M.; Söding, J. MMseqs2 enables sensitive protein sequence searching for the analysis of massive data sets. Nat. Biotechnol. 2017, 35, 1026–1028. [Google Scholar] [CrossRef] [PubMed]
  37. Callahan, B.J.; Mcmurdie, P.J.; Rosen, M.J.; Han, A.W.; Johnson, A.J.A.; Holmes, S.P. DADA2: High-resolution sample inference from Illumina amplicon data. Nat. Methods 2016, 13, 581–583. [Google Scholar] [CrossRef]
  38. Kopylova, E.; Navas-Molina, J.A.; Mercier, C.; Xu, Z.Z.; Mahé, F.; He, Y.; Zhou, H.-W.; Rognes, T.; Caporaso, J.G.; Knight, R. Open-Source Sequence Clustering Methods Improve the State of the Art. mSystems 2016, 1, e00003-15. [Google Scholar] [CrossRef]
  39. Westcott, S.L.; Schloss, P.D. De novo clustering methods outperform reference-based methods for assigning 16S rRNA gene sequences to operational taxonomic units. PeerJ 2015, 12, e1487. [Google Scholar] [CrossRef] [PubMed]
  40. Callahan, B.J.; McMurdie, P.J.; Holmes, S.P. Exact sequence variants should replace operational taxonomic units in marker-gene data analysis. ISME J. 2017, 11, 2639–2643. [Google Scholar] [CrossRef]
  41. McMurdie, P.J.; Holmes, S. phyloseq: An R package for reproducible interactive analysis and graphics of microbiome census data. PLoS ONE 2013, 8, e61217. [Google Scholar] [CrossRef]
  42. Oksanen, J.; Blanchet, F.G.; Friendly, M.; Kindt, R.; Legendre, P.; McGlinn, D.; Minchin, P.R.; O’hara, R.B.; Simpson, G.L.; Solymos, P.; et al. Vegan: Community Ecology Package. R package version 2.5-7. Preprint, 2020. [Google Scholar]
  43. Katz, L.; Griswold, T.; Morrison, S.; Caravas, J.; Zhang, S.; Bakker, H.; Deng, X.; Carleton, H. Mashtree: A rapid comparison of whole genome sequence files. J. Open Source Softw. 2019, 4, 1762. [Google Scholar] [CrossRef]
  44. Criscuolo, A. A fast alignment-free bioinformatics procedure to infer accurate distance-based phylogenetic trees from genome assemblies. Res. Ideas Outcomes 2019, 5, e36178. [Google Scholar] [CrossRef]
  45. Stamatakis, A. RAxML version 8: A tool for phylogenetic analysis and post-analysis of large phylogenies. Bioinformatics 2014, 30, 1312–1313. [Google Scholar] [CrossRef]
  46. Guindon, S.; Dufayard, J.-F.; Lefort, V.; Anisimova, M.; Hordijk, W.; Gascuel, O. New Algorithms and Methods to Estimate Maximum-Likelihood Phylogenies: Assessing the Performance of PhyML 3.0. Syst. Biol. 2010, 59, 307–321. [Google Scholar] [CrossRef]
  47. Price, M.N.; Dehal, P.S.; Arkin, A.P. FastTree 2—Approximately Maximum-Likelihood Trees for Large Alignments. PLoS ONE 2010, 5, e9490. [Google Scholar] [CrossRef]
  48. Minh, B.Q.; Schmidt, H.A.; Chernomor, O.; Schrempf, D.; Woodhams, M.D.; von Haeseler, A.; Lanfear, R. IQ-TREE 2: New Models and Efficient Methods for Phylogenetic Inference in the Genomic Era. Mol. Biol. Evol. 2020, 37, 1530–1534. [Google Scholar] [CrossRef] [PubMed]
  49. Katoh, K.; Standley, D.M. MAFFT Multiple Sequence Alignment Software Version 7: Improvements in Performance and Usability. Mol. Biol. Evol. 2013, 30, 772–780. [Google Scholar] [CrossRef] [PubMed]
  50. Edgar, R.C. MUSCLE: Multiple sequence alignment with high accuracy and high throughput. Nucleic Acids Res. 2004, 32, 1792–1797. [Google Scholar] [CrossRef]
  51. Page, A.J.; Cummins, C.A.; Hunt, M.; Wong, V.K.; Reuter, S.; Holden, M.T.G.; Fookes, M.; Falush, D.; Keane, J.A.; Parkhill, J. Roary: Rapid large-scale prokaryote pan genome analysis. Bioinformatics 2015, 31, 3691–3693. [Google Scholar] [CrossRef] [PubMed]
  52. Treangen, T.J.; Ondov, B.D.; Koren, S.; Phillippy, A.M. The Harvest suite for rapid core-genome alignment and visualization of thousands of intraspecific microbial genomes. Genome Biol. 2014, 15, 524. [Google Scholar] [CrossRef]
  53. Zhou, Z.; Alikhan, N.-F.; Sergeant, M.J.; Luhmann, N.; Vaz, C.; Francisco, A.P.; Carriço, J.A.; Achtman, M. GrapeTree: Visualization of core genomic relationships among 100,000 bacterial pathogens. Genome Res. 2018, 28, 1395–1404. [Google Scholar] [CrossRef]
  54. Lefort, V.; Desper, R.; Gascuel, O. FastME 2.0: A Comprehensive, Accurate, and Fast Distance-Based Phylogeny Inference Program. Mol. Biol. Evol. 2015, 32, 2798–2800. [Google Scholar] [CrossRef] [PubMed]
  55. Kurtzer, G.M.; Sochat, V.; Bauer, M.W. Singularity: Scientific containers for mobility of compute. PLoS ONE 2017, 12, e0177459. [Google Scholar] [CrossRef] [PubMed]
  56. Leprevost, F.d.V.; Grüning, B.A.; Aflitos, S.A.; Röst, H.L.; Uszkoreit, J.; Barsnes, H.; Vaudel, M.; Moreno, P.; Gatto, L.; Weber, J.; et al. BioContainers: An open-source and community-driven framework for software standardization. Bioinformatics 2017, 33, 2580–2582. [Google Scholar] [CrossRef] [PubMed]
  57. Ewels, P.A.; Peltzer, A.; Fillinger, S.; Patel, H.; Alneberg, J.; Wilm, A.; Garcia, M.U.; Di Tommaso, P.; Nahnsen, S. The nf-core framework for community-curated bioinformatics pipelines. Nat. Biotechnol. 2020, 38, 276–278. [Google Scholar] [CrossRef]
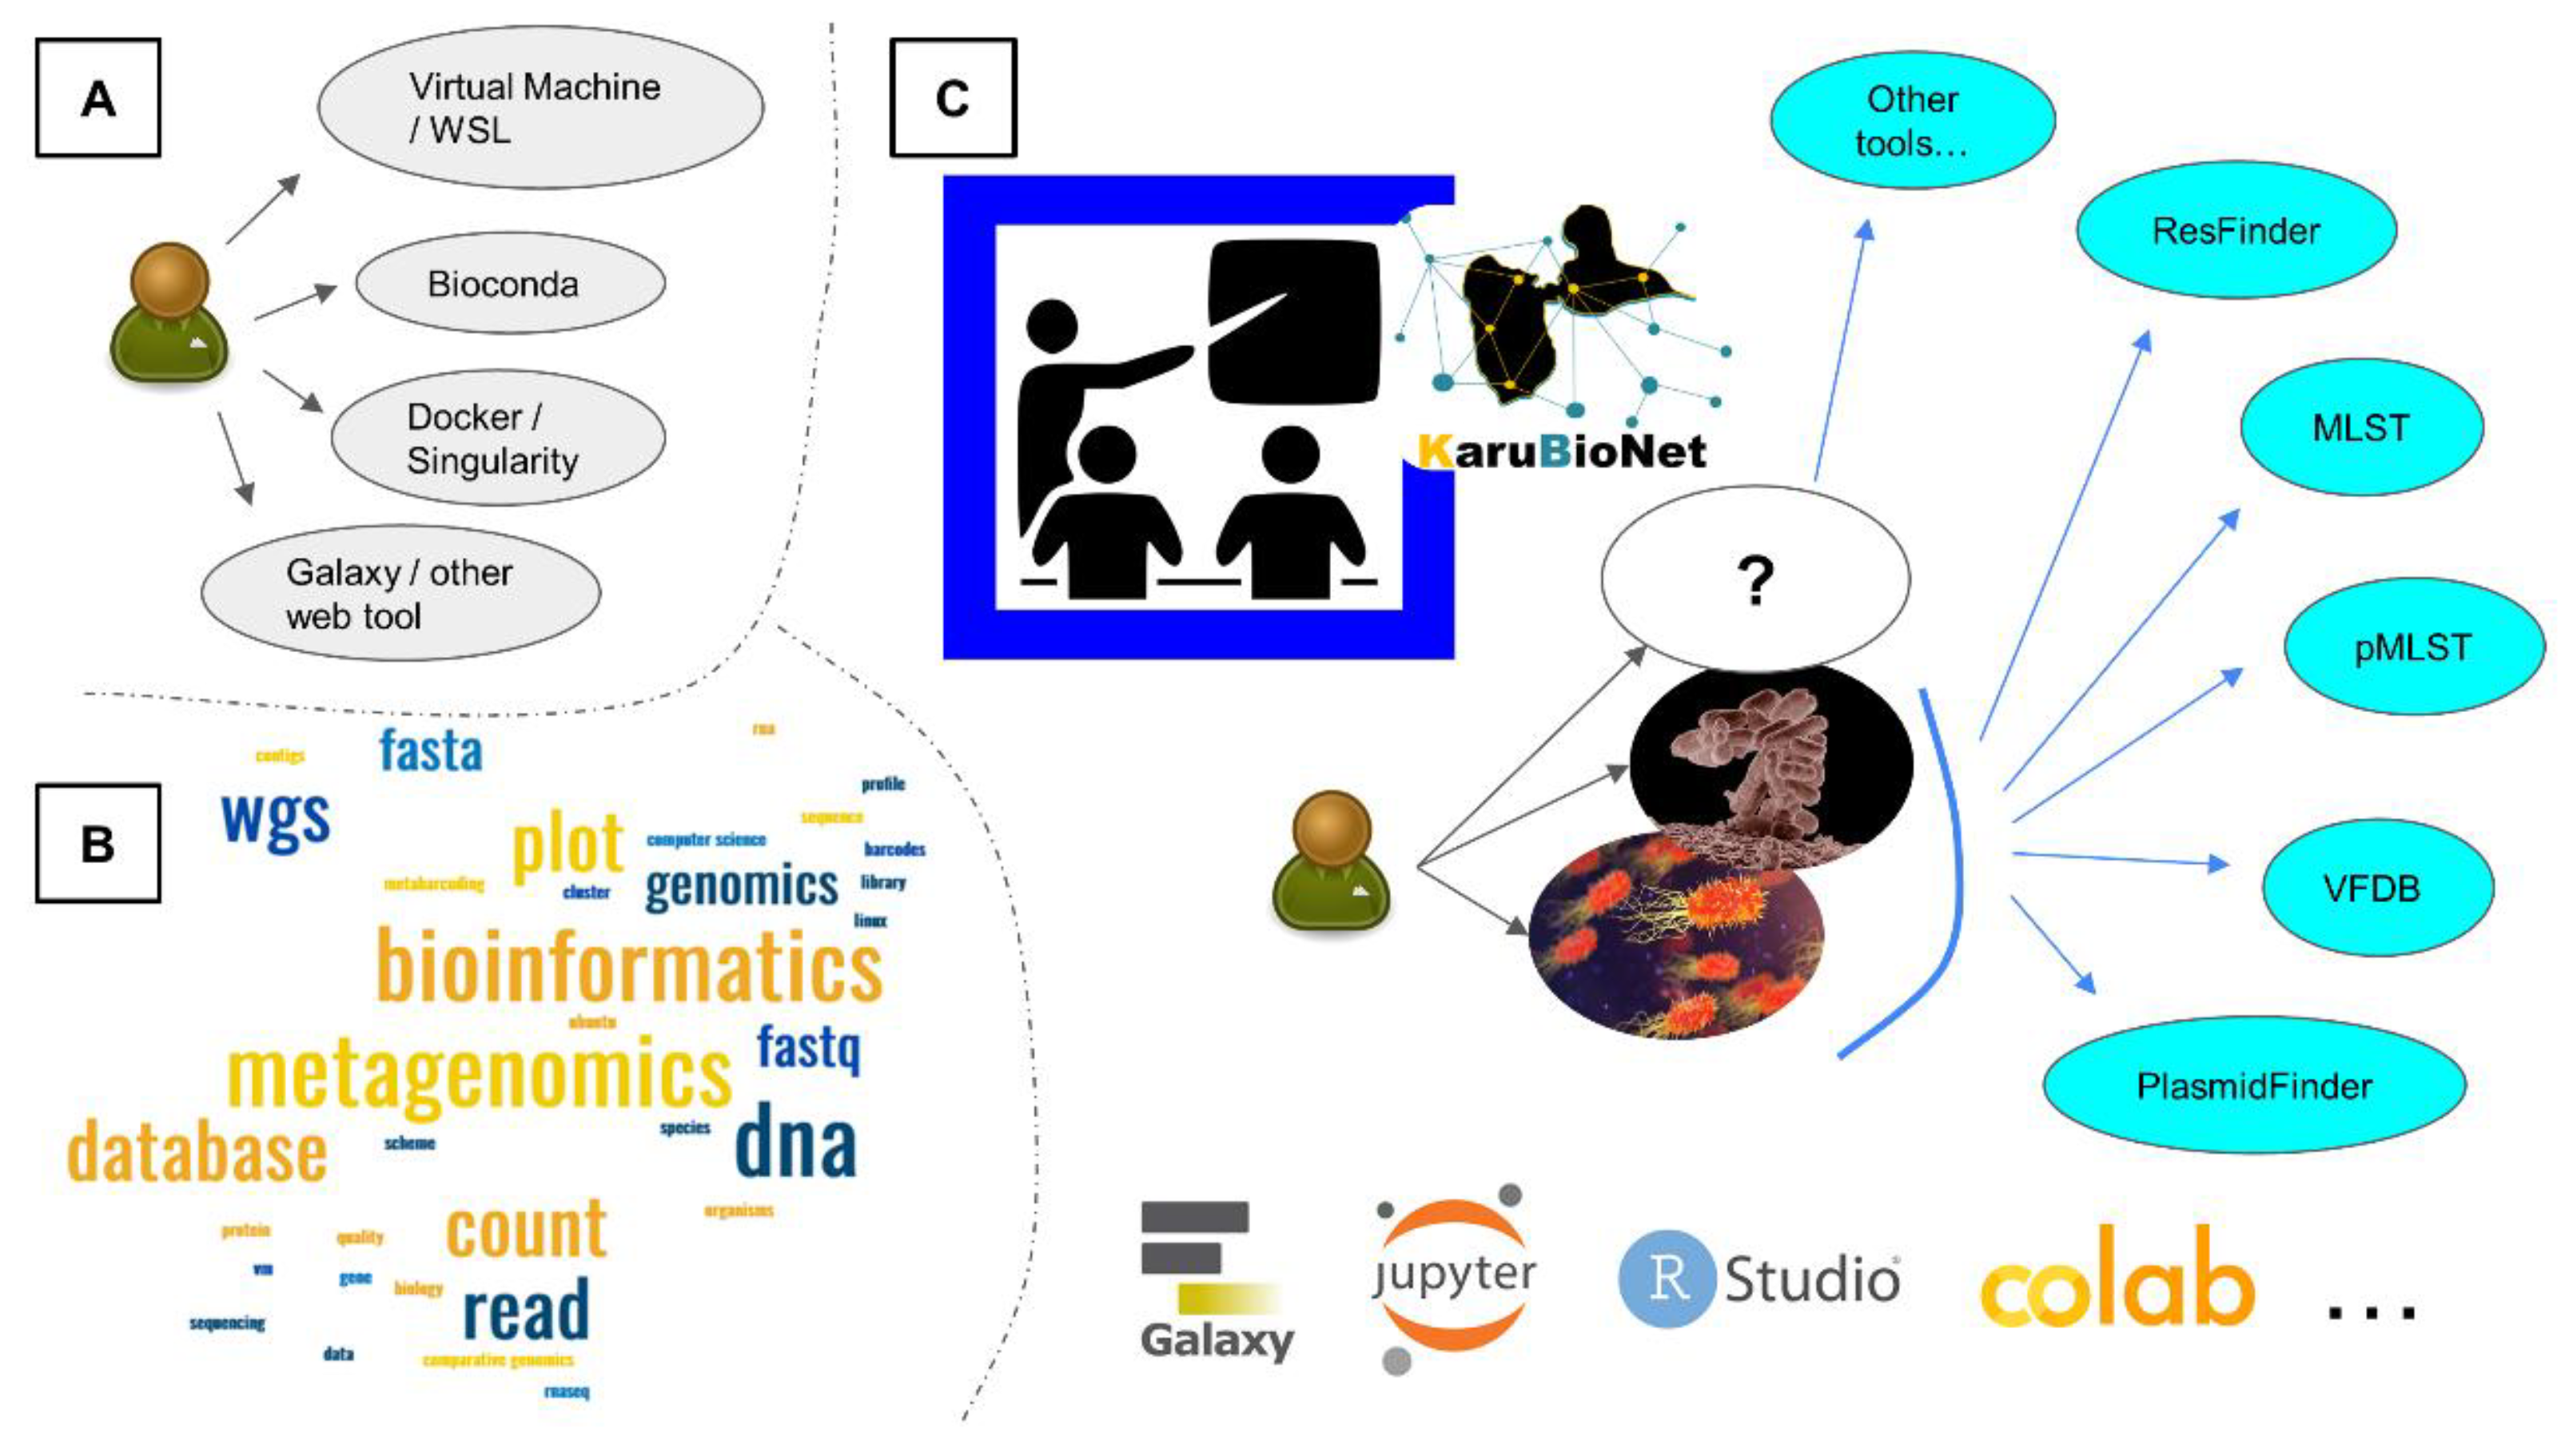
Figure 1. (A) Workflow showing some platforms that can help users initiate analyses; (B) Word Cloud showing some keywords used in bioinformatics analyses; (C) Workflow and software tools that can help perform bioinformatics and biostatistics analyses for bacteria studied in our lab specifically.
Biomedinformatics 05 00027 g001
Figure 2. MinION sequencing and data processing workflow.
Biomedinformatics 05 00027 g002
Figure 3. RagTag Galaxy workflow.
Biomedinformatics 05 00027 g003
Figure 4. Workflow representing the data cleaning steps to initiate metabarcoding analyses.
Biomedinformatics 05 00027 g004
Figure 5. Phylogenetic workflow showing some example tools that could be used from sequence data or from data/distance matrices.
Biomedinformatics 05 00027 g005
Table 1. The main differences between a conventional laptop and an HPC system.
FeatureConventional LaptopHPC System
Processing PowerLimited to a single CPU with few coresMultiple nodes with many CPUs and cores
Memory (RAM)Typically 8–32 gigabyte (GB)Hundreds to thousands of GBs distributed across nodes
StorageLimited storage (gigabyte—terabyte)Large-scale distributed storage systems (e.g., petabytes)
CPU TypeGeneral-purpose CPUs (e.g., Intel i5/i7, AMD Ryzen)High-end server-grade CPUs (e.g., Intel Xeon, AMD EPYC)
GPUOptional, usually for basic graphics tasksOften includes powerful GPUs for parallel processing
NetworkingBasic Wi-Fi/Ethernet connectivityHigh-speed interconnects (e.g., InfiniBand) for fast data transfer
Power ConsumptionLow, suitable for personal useHigh, requires dedicated cooling and power supply
CostAffordable, consumer-level pricingHigh-cost, enterprise-level investment
Use CasesEveryday tasks, basic software developmentScientific simulations, big data analysis, Artificial Intelligence (AI) training
ScalabilityLimited to hardware constraintsHighly scalable, can add more nodes as needed
MaintenanceMinimal, user-level maintenanceRequires dedicated informaticians for management and upkeep
Operating System (OS)General-purpose OS (e.g., Windows, macOS, Linux)Often runs Linux-based OS optimized for HPC tasks
SoftwareGeneral productivity and entertainment appsSpecialized scientific and engineering software
Table 2. Most widely used programming languages and their key characteristics.
LanguageExecution SpeedEase of UseMain ApplicationsParadigm(s)Community & Support
PythonMedium (interpreted)Very easy, clear syntaxData Science, AI, Web, AutomationObject-oriented, FunctionalVery large, excellent support
JavaScriptMediumEasy to learn for the WebWeb Development (Frontend/Backend), MobileObject-oriented, FunctionalVery large, strong web support
JavaFast (compiled to bytecode)Moderate, strict syntaxWeb Apps, Mobile (Android), Enterprise SoftwareObject-orientedLarge, strong enterprise support
CVery fast (compiled)Complex (manual memory management)Embedded Systems, OS, Low-Level SoftwareProceduralLarge, but more technical
C++Very fast (compiled)More complex than C but powerfulGame Development, Heavy Software, AI, Embedded SystemsObject-oriented, ProceduralLarge, performance-focused
C#Fast (compiled to bytecode)Moderate, inspired by JavaWindows Apps, Game Development (Unity)Object-orientedLarge, Microsoft-backed
SwiftFast (compiled)Easy for beginnersiOS/macOS DevelopmentObject-oriented, FunctionalLarge, Apple-focused
Go (Golang)Very fast (compiled)Simple, clean syntaxCloud Applications, Backend, NetworkingProcedural, ConcurrentGrowing, strong support
PHPMedium (interpreted)Easy for web developmentWeb Backend DevelopmentProcedural, Object-orientedLarge, primarily for web
RustVery fast (compiled)Complex (strict memory management)Embedded Systems, Security, Performance-Critical ApplicationsFunctional, SystemExpanding rapidly
RMedium (interpreted)Steeper learning curveStatistics, Data analysis, machine learningFunctional, with some support for Object-oriented programmingLarge and active community
Table 3. Comparison of selected bioinformatics tools.
CategoryToolComputational EfficiencyUsabilityAccuracy
Genome AssemblySPAdesModerate; optimized for short-read dataUser-friendly with extensive documentationHigh accuracy for small genomes
CanuLower efficiency due to intensive long-read correction algorithmsModerate; may require parameter tuningHigh accuracy for long-read assemblies
FlyeHigh; particularly efficient with long readsRelatively easy to use with sensible default settingsGood accuracy; performance can vary with dataset quality
Nanopore BasecallingDoradoHigh; leverages GPU acceleration for faster processingHighly usable; streamlined interface with regular updatesHigh accuracy with continuous improvements
BonitoModerate; designed for research with deep learning frameworksRequires command-line familiarity; active developmentCompetitive accuracy; often used in experimental settings
DeepNano-blitzVariable; experimental approaches may affect speedLower usability; fewer support resources availableModerate accuracy; not as widely validated in the community
PhylogeneticRAxMLComputationally intensive, especially with large datasetsSteep learning curve; primarily command-line basedHigh accuracy using maximum likelihood
IQ-TREEHigh; optimized algorithms for rapid inferenceUser-friendly; offers both GUI and command-line optionsHigh accuracy with integrated model selection
FastTreeExtremely efficient; ideal for very large datasetsVery easy to use with minimal configuration requiredGood accuracy; some compromises on precision
PhyMLModerate; performs well on small to medium datasetsReasonably user-friendly; includes GUI and web interfacesHigh accuracy for likelihood-based tree estimation
Table 4. Summary of the benefits and drawbacks of the models (Galaxy and CLI from an HPC or laptop), depending on the size of the dataset and the user’s level of experience.
User LevelDataset SizeModelWhy?BenefitsDrawbacks
BeginnerSmall (<1 GB)GalaxyEasy GUI, no installation needed, available onlineIntuitive interface, built-in tools, no codingLimited customization, slower for large data
IntermediateMedium (1–10 GB)Galaxy or Laptop Command LineGalaxy if no CLI experience; CLI for learningGalaxy easy to use; CLI builds skillsGalaxy job limits; CLI setup can be tough
ExpertLarge (>10 GB)HPC Command LineGalaxy may fail or queue jobs too longHPC handles big data wellRequires technical skills, setup time
Disclaimer/Publisher’s Note: The statements, opinions and data contained in all publications are solely those of the individual author(s) and contributor(s) and not of MDPI and/or the editor(s). MDPI and/or the editor(s) disclaim responsibility for any injury to people or property resulting from any ideas, methods, instructions or products referred to in the content.