Article

Uncovering the Diagnostic Power of Radiomic Feature Significance in Automated Lung Cancer Detection: An Integrative Analysis of Texture, Shape, and Intensity Contributions

1
Medical Physics Department, Medical School, University of Thessaly, 41500 Larisa, Greece
2
Department of Information and Electronic Engineering, International Hellenic University (IHU), 57001 Thessaloniki, Greece
*
Author to whom correspondence should be addressed.
BioMedInformatics 2024, 4(4), 2400-2425; https://doi.org/10.3390/biomedinformatics4040129
Submission received: 14 November 2024 / Revised: 12 December 2024 / Accepted: 16 December 2024 / Published: 18 December 2024

Abstract

:
Background: Lung cancer still maintains the leading position among causes of death in the world; the process of early detection surely contributes to changes in the survival of patients. Standard diagnostic methods are grossly insensitive, especially in the early stages. In this paper, radiomic features are discussed that can assure improved diagnostic accuracy through automated lung cancer detection by considering the important feature categories, such as texture, shape, and intensity, originating from the CT DICOM images. Methods: We developed and compared the performance of two machine learning models—DenseNet-201 CNN and XGBoost—trained on radiomic features with the ability to identify malignant tumors from benign ones. Feature importance was analyzed using SHAP and techniques of permutation importance that enhance both the global and case-specific interpretability of the models. Results: A few features that reflect tumor heterogeneity and morphology include GLCM Entropy, shape compactness, and surface-area-to-volume ratio. These performed excellently in diagnosis, with DenseNet-201 producing an accuracy of 92.4% and XGBoost at 89.7%. The analysis of feature interpretability ascertains its potential in early detection and boosting diagnostic confidence. Conclusions: The current work identifies the most important radiomic features and quantifies their diagnostic significance through a properly conducted feature selection process reflecting stability analysis. This provides the blueprint for feature-driven model interpretability in clinical applications. Radiomics features have great value in the automated diagnosis of lung cancer, especially when combined with machine learning models. This might improve early detection and open personalized diagnostic strategies for precision oncology.

Graphical Abstract

1. Introduction

Lung cancer remains one of the leading causes of death worldwide, with more than 1.7 million deaths annually, and is considered the most common cause of cancer-related mortality [1]. Yet, while therapeutic options have been ever-increasing and ever-improving, the prognosis remains largely dependent upon the stage of diagnosis at presentation; early detection fundamentally enhances a patient’s likelihood of survival. Unfortunately, because of a lack of sensitivity and specificity, current non-invasive diagnostic methods perform poorly, especially in the early stages of the disease. The shortfall underlines the need for novel diagnostic approaches that could offer both precision and non-invasiveness. In this regard, radiomics—a high-throughput feature extraction of medical images—can be performed to provide a strong enhancement of diagnostic accuracy [2]. Radiomics offers detailed imaging analytics of conventional modalities such as CT (Computed Tomography) through features extracted from tumor shape, texture, and intensity. These features represent complicated tumor heterogeneity that usually is not visible to the naked eye, therefore allowing for the creation of a complete non-invasive tumor phenotype. To this aim, this study systematically explores the diagnostic value of radiomic features in lung cancer [3]. According to our theory, shape-based features become more significant as tumors grow larger and change shape over time, whereas texture-based features are more useful for locating early tumor lesions due to the value of representing intratumoral heterogeneity [4]. In previous studies, we explored the diagnostic potential of radiomic features in cancer prediction and demonstrated how machine learning techniques could effectively leverage these features to improve accuracy in early cancer detection. Our past research highlighted how radiomics can be used for personalized diagnosis. It focuses not only on individual feature importance but also on how those features might interact with each other and with the clinical context to improve diagnostic accuracy. In this research, we integrate radiomics with machine learning to offer a more nuanced approach to the diagnosis of lung cancer, one that moves beyond binary classifications and truly embraces the complexity of tumor phenotypes. This work, therefore, was focused on the isolation and validation of the diagnostic value of individual radiomic features, aiming to bridge gaps between high-performance models and their interpretability in a targeted approach that may enhance the clinical usability of radiomic-based lung cancer detection models. The umbrella approach is primarily expanding under precision medicine, wherein treatments and diagnoses have been tailored according to the individual characteristics of the patients. Having continuously developed deep learning and high-resolution imaging data, it is now time to give more granularity to radiomic feature importance in lung cancer diagnosis. Techniques like SHAP (Shapley additive explanations) and permutation feature importance give us numerical information about how much each feature contributes [5]. The goal is to make models that are very accurate and easy to understand, which is a key requirement for clinical use.
Radiomics is a promising approach but finds its place in the greater diagnostic framework of alternative approaches like liquid biopsies [6]. These techniques, which are relatively less invasive, make their assessments by examining circulating tumor DNA and other biomarkers for molecular-level insight into cancers. Compared to liquid biopsies, radiomics maintains an advantage in capturing spatial heterogeneity and morphological information directly from imaging data, which will help to complement the molecular approach toward a comprehensive diagnostic strategy [7]. Radiomics in diagnostic analysis of lung cancer identifies shape- and texture-based features for tumor heterogeneity and morphology. Recent works using GLCM (Gray-level Co-occurrence Matrix) Entropy together with shape compactness have shown a more robust predictor of malignancy. Several studies have demonstrated the values of shape- and texture-based radiomic features for diagnosis. For example, the GLCM Entropy texture feature has been associated with malignancy rates of over 85% in specific cohorts, and shape compactness has reported an 88% sensitivity that distinguishes malignant from benign in large datasets. These point to the confirmation that shape and texture features are relevant in increasing the accuracy of the diagnosis, especially regarding early detection [8]. Such findings underline an integration of quantitative data with clinical decision-making and enhancement of early detection capabilities. Despite its great promise, however, radiomics faces serious challenges in variable imaging protocols, intensive computation, and problems with clinical integration. These may involve, but are not restricted to, differences in scanner parameters, reconstruction algorithms, and image quality, each of which can introduce inconsistencies during feature extraction. Such features have consequences for the reproducibility and performance of models. Apart from the overfitting problem, most machine learning models exhibit a ‘black box’ nature, a factor that also raises barriers against their acceptance into clinical workflows. Besides that, reproducibility and overfitting issues, common in radiomics-based studies, are especially serious. It is critical to ensure that features remain stable across diverse conditions while extracting them for clinical translation. For the clinicians to trust them, more work has to be carried out to make the models of machine learning more explainable. Some promising tools that help with such concerns and enhance the explanation capacity of predictions at global and local levels are techniques of saliency maps such as SHAP and Grad-CAM (Gradient-weighted Class Activation Mapping).
An overview of the radiomics workflow, from DICOM (Digital Imaging and Communications in Medicine) image acquisition to model validation, is presented in Figure 1. This workflow highlights key preprocessing steps, feature extraction, and model training processes essential to this study.

2. Materials and Methods

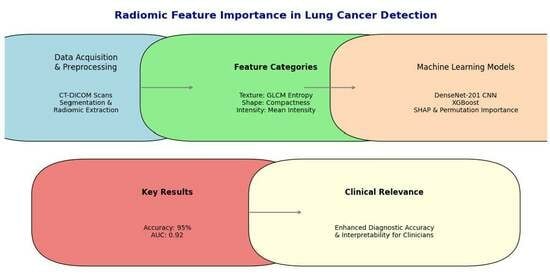
2.1. Data Acquisition and Preprocessing

Demographic variables of age, sex, and smoking history were considered for checking the balance of the dataset in order to reduce the biases. Thereafter, the ages spanned between 35 and 80 years; further, the gender split was nearly to almost equal, with 50.3% males against 49.7% females. The smoking history subjects included current smokers constituting 40%, former smokers 35%, and the remaining portion, 25%, were nonsmokers. The obtained demographical stratification enabled suitable generalization in the model in a population setting. In addition to demographic balancing, the dataset was reviewed for clinical diversity to ensure the representation of various tumor stages and locations, further minimizing potential biases in model generalization. Accordingly, images with motion artifacts or those that were generally of low quality, or otherwise lacking in other parameters, were excluded. Quality thresholds were defined based on expertise in radiology and some quantitative metrics, including Signal-to-Noise Ratio (SNR) and Contrast-to-Noise Ratio (CNR). Another inconsistency in feature extraction is due to the variability in imaging protocols of slice thickness, reconstruction algorithms, and types of scanners. Thinner slices, such as those on the images in this series, reinforce texture-based stability in extracted features but introduce increased computation. Such problems call for standardization among centers through protocol harmonization and/or simulating variability with data augmentation.
In the present work, one major and diverse CT-DICOM image dataset was considered, containing both verified lung cancer cases and normal controls. Altogether, this dataset was made up of 2963 images relevant to lung cancer patients and 383 images relevant to healthy patients, derived from publicly available databases, including the NSCLC-Radiomics and RIDER datasets and clinical private repositories from a medical center that collaborated with our laboratory (Laboratory: Medical Physics Department (MPD). The Medical Physics Department (MPD) at University Hospital, Larissa, Greece, is involved in clinical practice, research, and education. MPD offers clinical and research services related to patient diagnosis and treatment quality assurance programs, acceptance tests, and radiation protection issues.), which include a diverse range of CT scans and radiographs of patients undergoing chest radiotherapy for various thoracic malignancies [4,9,10].
While public data are accessible, private data are subject to ethical restrictions and are not publicly available. However, the scientific contribution of this study is validated through comparative experiments and robust methodology that can be generalized to other datasets. Thereafter, the dataset was split into a validation set comprising 1786 cancerous images and 337 healthy ones to ensure unbiased model performance across cohorts. This was carried out so that, considering the balance in the proportion of all the available images, about 60% of them would remain for training, about 20% would go for validation, and another 20% could be reserved for testing. This stratified division will ensure that the ratio between cancerous and healthy cases is the same in all subsets, thereby reducing any skewness in the evaluation of the model. The Image Biomarker Standardization Initiative (IBSI) provided some common parameters that can ensure the reproducibility and robustness of radiomic feature extraction [11]. It was taken as the guiding principle to establish the preprocessing pipeline. Images presenting motion artifacts, noise, or reconstruction errors were removed using both automated algorithms and expert radiologist review. Quality thresholds included a >20 dB SNR value and a >10 dB CNR value, ensuring very high-quality inputs. Other checks will involve geometric distortions and inconsistencies in the voxel dimension. These steps were carried out to normalize the imaging data and reduce variability. In addition, to ensure quality and eliminate all sorts of artifacts that may distort radiomic feature extraction, the images were carefully reviewed by qualified radiologists.

2.2. Radiomic Feature Extraction

In this paper, we describe the application of an intensive and standardized extraction using PyRadiomics (version 3.1.0), one of the most widely recognized and validated open-source software platforms developed specifically for radiomic analyses [12]. In sum, completeness, following standardized protocols, flexibility, and open-source availability, are the reasons why PyRadiomics was chosen. All analyses were conducted in Python (version 3.12) using the following libraries: NumPy and SciPy for numerical computations and scikit-learn for machine learning workflows and validation. These tools adhere to the IBSI guidelines, ensuring reproducibility and robustness of the extracted features. A total of 350 radiomic features will be extracted from each ROI (Region of Interest) to process CT images in DICOM format. These features include first-order statistics, shape-based descriptors, and texture-based metrics. Features were selected based on how well they are able to represent some critical characteristics of the tumor, such as heterogeneity, complexity, and morphological structure. Carefully selected features ensured that the model had access to the most relevant data for the most accurate diagnosis of lung cancer [13]. As shown in Figure 2, texture features constitute the largest category within our dataset, followed by shape and intensity features. This distribution underscores the diverse information captured from DICOM images for a comprehensive tumor characterization.

2.2.1. First-Order Statistics

First-order statistics describe the distribution of individual voxel intensities within the ROI and, hence, are utilized to summarize the intensity characteristics. These features convey the basic but highly fundamental understanding of the overall structure of the tumor and include the following:
  • Mean Intensity: The mean value of the voxels comprised within the ROI, reflecting to a great extent the average density of the tissue.
  • Skewness: Characterizes the asymmetry of the voxel intensity distribution and, hence, the heterogeneity of the tumor.
  • Kurtosis: Describing the property ‘peakedness’; in other words, whether a distribution of voxel intensities is bunched around or spread out from the mean.
  • Energy: This is the sum of the square of the voxel values, which may be related to the aggressiveness of the tumor or its metabolic activity.
These first-order features are simple but not worthless. They provide a view of the basic character of the tumor, especially from the early beginning of tumor development onward.

2.2.2. Shape-Based Features

Shape-based features are of immense importance in understanding the geometry of the tumor and thus provide knowledge of how a tumor grows and interacts with surrounding tissues. Lung cancer tumors have been found to be mostly irregularly shaped, which is sometimes not captured through traditional imaging assessments. Shape-based features included in the extraction study are as follows:
  • Sphericity: A measure of how spherical (round) the tumor is, where values approaching 1 depict structures near perfectly spherical. Lower sphericity values indicate that highly aggressive and invasive tumors are more characteristic.
  • Compactness: This shows how much the shape of a tumor is spherical or elongated and can thus be an indication of its invasive power.
  • Surface-area-to-volume Ratio: This measure compares the surface complexity of the tumor to its volume. The higher the ratio, the greater the chance for irregular growth patterns—often associated with malignancy.
  • Elongation: Measures the deviation in the tumor shape from a perfect sphere and may give clues of its infiltration into surrounding tissues.
Shape descriptors bear particular importance for late-stage tumors, as the growth patterns may lead to fundamental insights into the aggressiveness of the cancer and its metastasis potential. In light of this viewpoint, we make the assumption that shape-based features would become more significant as size increases due to structural deformations brought about by unchecked growth.

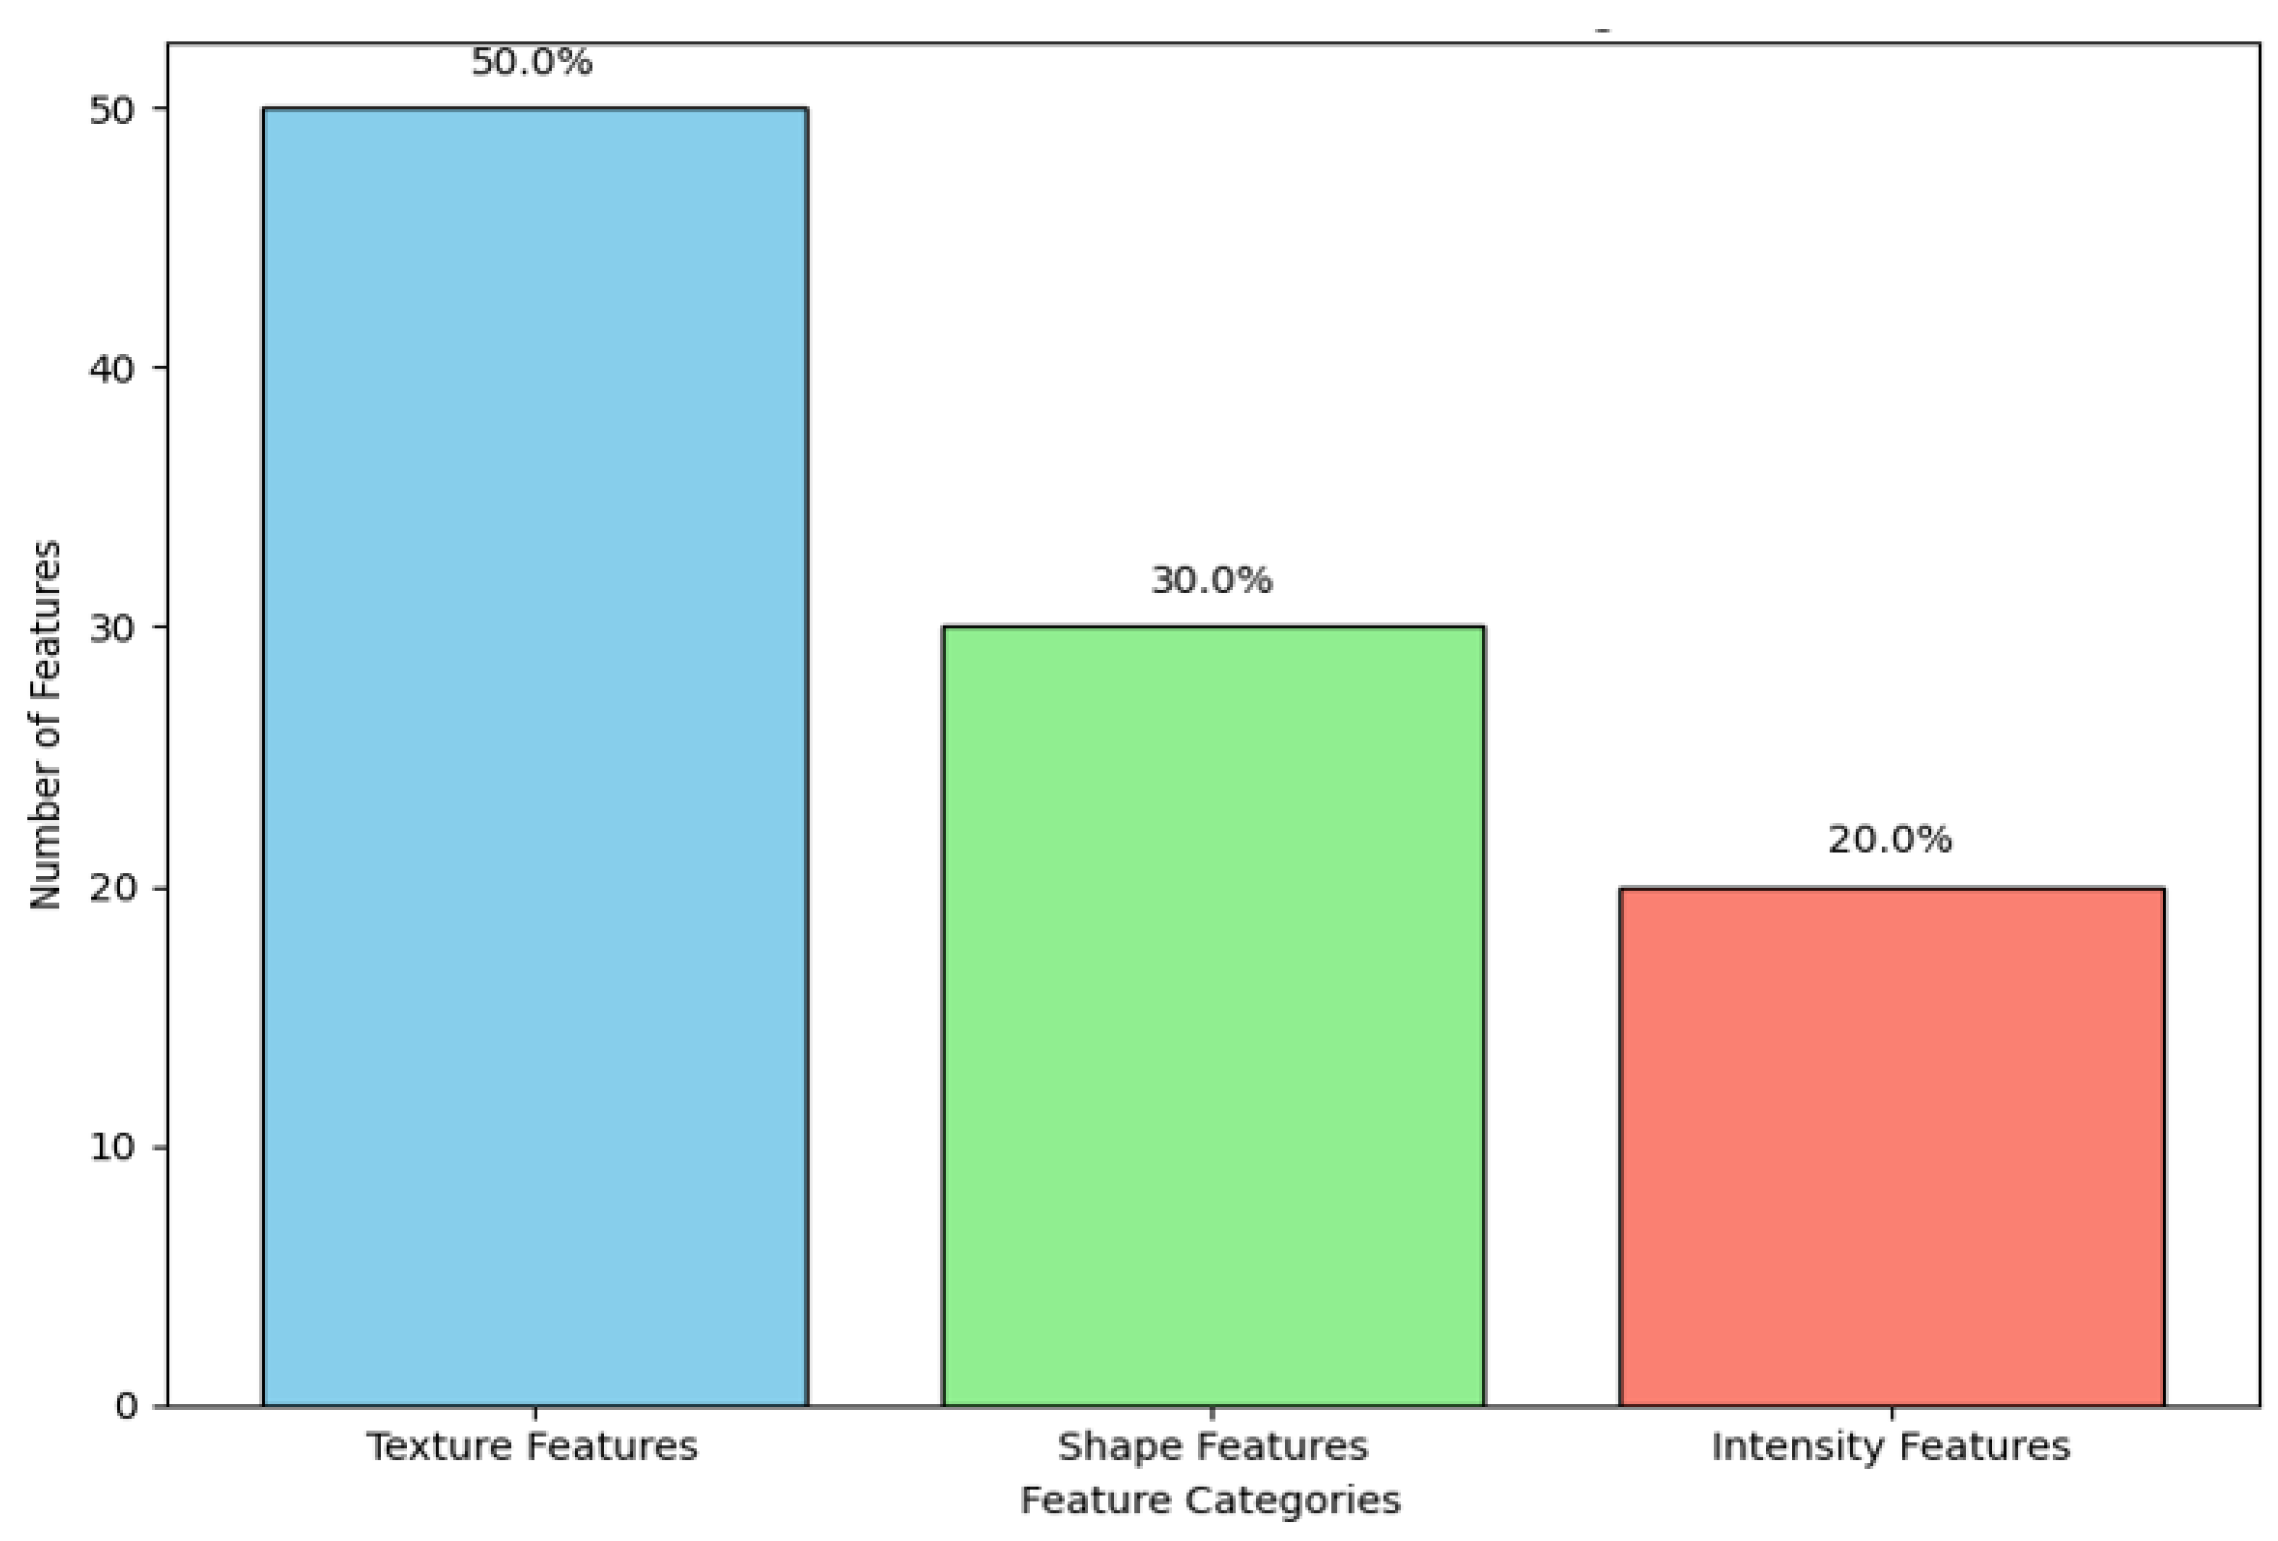
2.2.3. Texture-Based Features

These features are probably the most powerful descriptors of intratumoral heterogeneity, with tumor heterogeneity at both microscopic and macroscopic levels actually being one of the hallmark features of cancer. In fact, these provide a quantitative measurement of the variation in the intensities of voxels within a tumor that could unveil the underlying biological processes such as cell density, necrosis, and angiogenesis. The main features of texture extracted in this study included measures derived from the following:
  • GLCM: GLCM features describe the frequency of pixel intensity pairs for a predefined spatial relationship. GLCM Entropy may serve as an example and denote the complexity of the variation in voxel intensities. The greater the values, the greater the heterogeneity, which is usually associated with malignancies. Other significant GLCM features include contrast, which describes the difference between high and low intensities, and correlation, which is the measure of linear dependencies between the intensity of voxels.
  • GLRLM: This matrix provides the length of consecutively sharing voxels with the same intensity value in a given direction. The related features to this are the GLRLM (Gray-level Run Length Matrix) Short Run Emphasis, which manifests the presence of small homogeneous regions inside the tumor, while the GLRLM Long Run Emphasis gives information about the boundless homogeneous regions. These will be relevant for identifying the fibrotic regions or regions bearing necrosis inside the tumor.
  • Grayscale-level Size Zone Matrix (GLSZM): GLSZM is very similar to the GLRLM in that it quantifies regions of identical intensities; no directional information is taken into account, however. Important features rely on this matrix: Zone Size Non-Uniformity and Large Zone Emphasis may be useful to detect the presence of large homogeneous areas, which are generally indicative of late disease stages.
  • Wavelet Features: Refer to those signal features extracted through the application of wavelet filters on images for capturing texture at multiple resolutions. This multi-scale analysis is critical in order to detect subtle patterns both in fine and coarse details, thus offering a more nuanced understanding of tumor heterogeneity.
These features provide a fine-grained detail from the internal structure of the tumor, well beyond what is directly observable from the raw imaging data. In the cases of early-stage tumors, we postulated that the texture features would turn out to be more informative since early malignancies often manifest as small regions of heterogeneous intensity, which can be potentially detectable by advanced metrics of texture [14].

2.2.4. Multi-Scale and Multi-Dimensional Feature Extraction

One of the novelties of this work was the inclusion of multi-scale and multi-dimensional feature extraction strategies. This combination of features derived from different resolutions and dimensions gave us a more robust dataset representative of both global and local tumor characteristics. This will be a way to ensure that machine learning models have access to the most complete representation of the tumor phenotype, thus allowing the detection of subtle yet clinically significant differences between malignant and benign regions.

2.2.5. Innovative Aspects of Feature Extraction

  • Manual and Semi-Automated Segmentation: The tumor ROIs were segmented using a great deal of care by manual delineation of expert radiologists combined with semi-automated algorithms to achieve the best precision together with reducing observer variability.
  • Standardization and Reproducibility: All extraction was carried out by strictly adhering to guidelines provided by the IBSI, with the aim of having all features reproducible across different imaging systems and acquisition protocols.
  • High-throughput Feature Extraction: PyRadiomics thus enables the extraction of hundreds of features in one image effectively. High-throughput feature extraction in imaging data is of high importance to machine learning applications, especially in cases where the volume of data is immense.
  • Finding the Best and Most Useful Features: Out of the 350 features that were collected, tests using forward stepwise correlation analysis and tests for test–retest variability were used to get rid of features that were duplicated or not relevant. We were able to minimize overfitting without reducing model accuracy by focusing the analysis on the most stable and informative features.

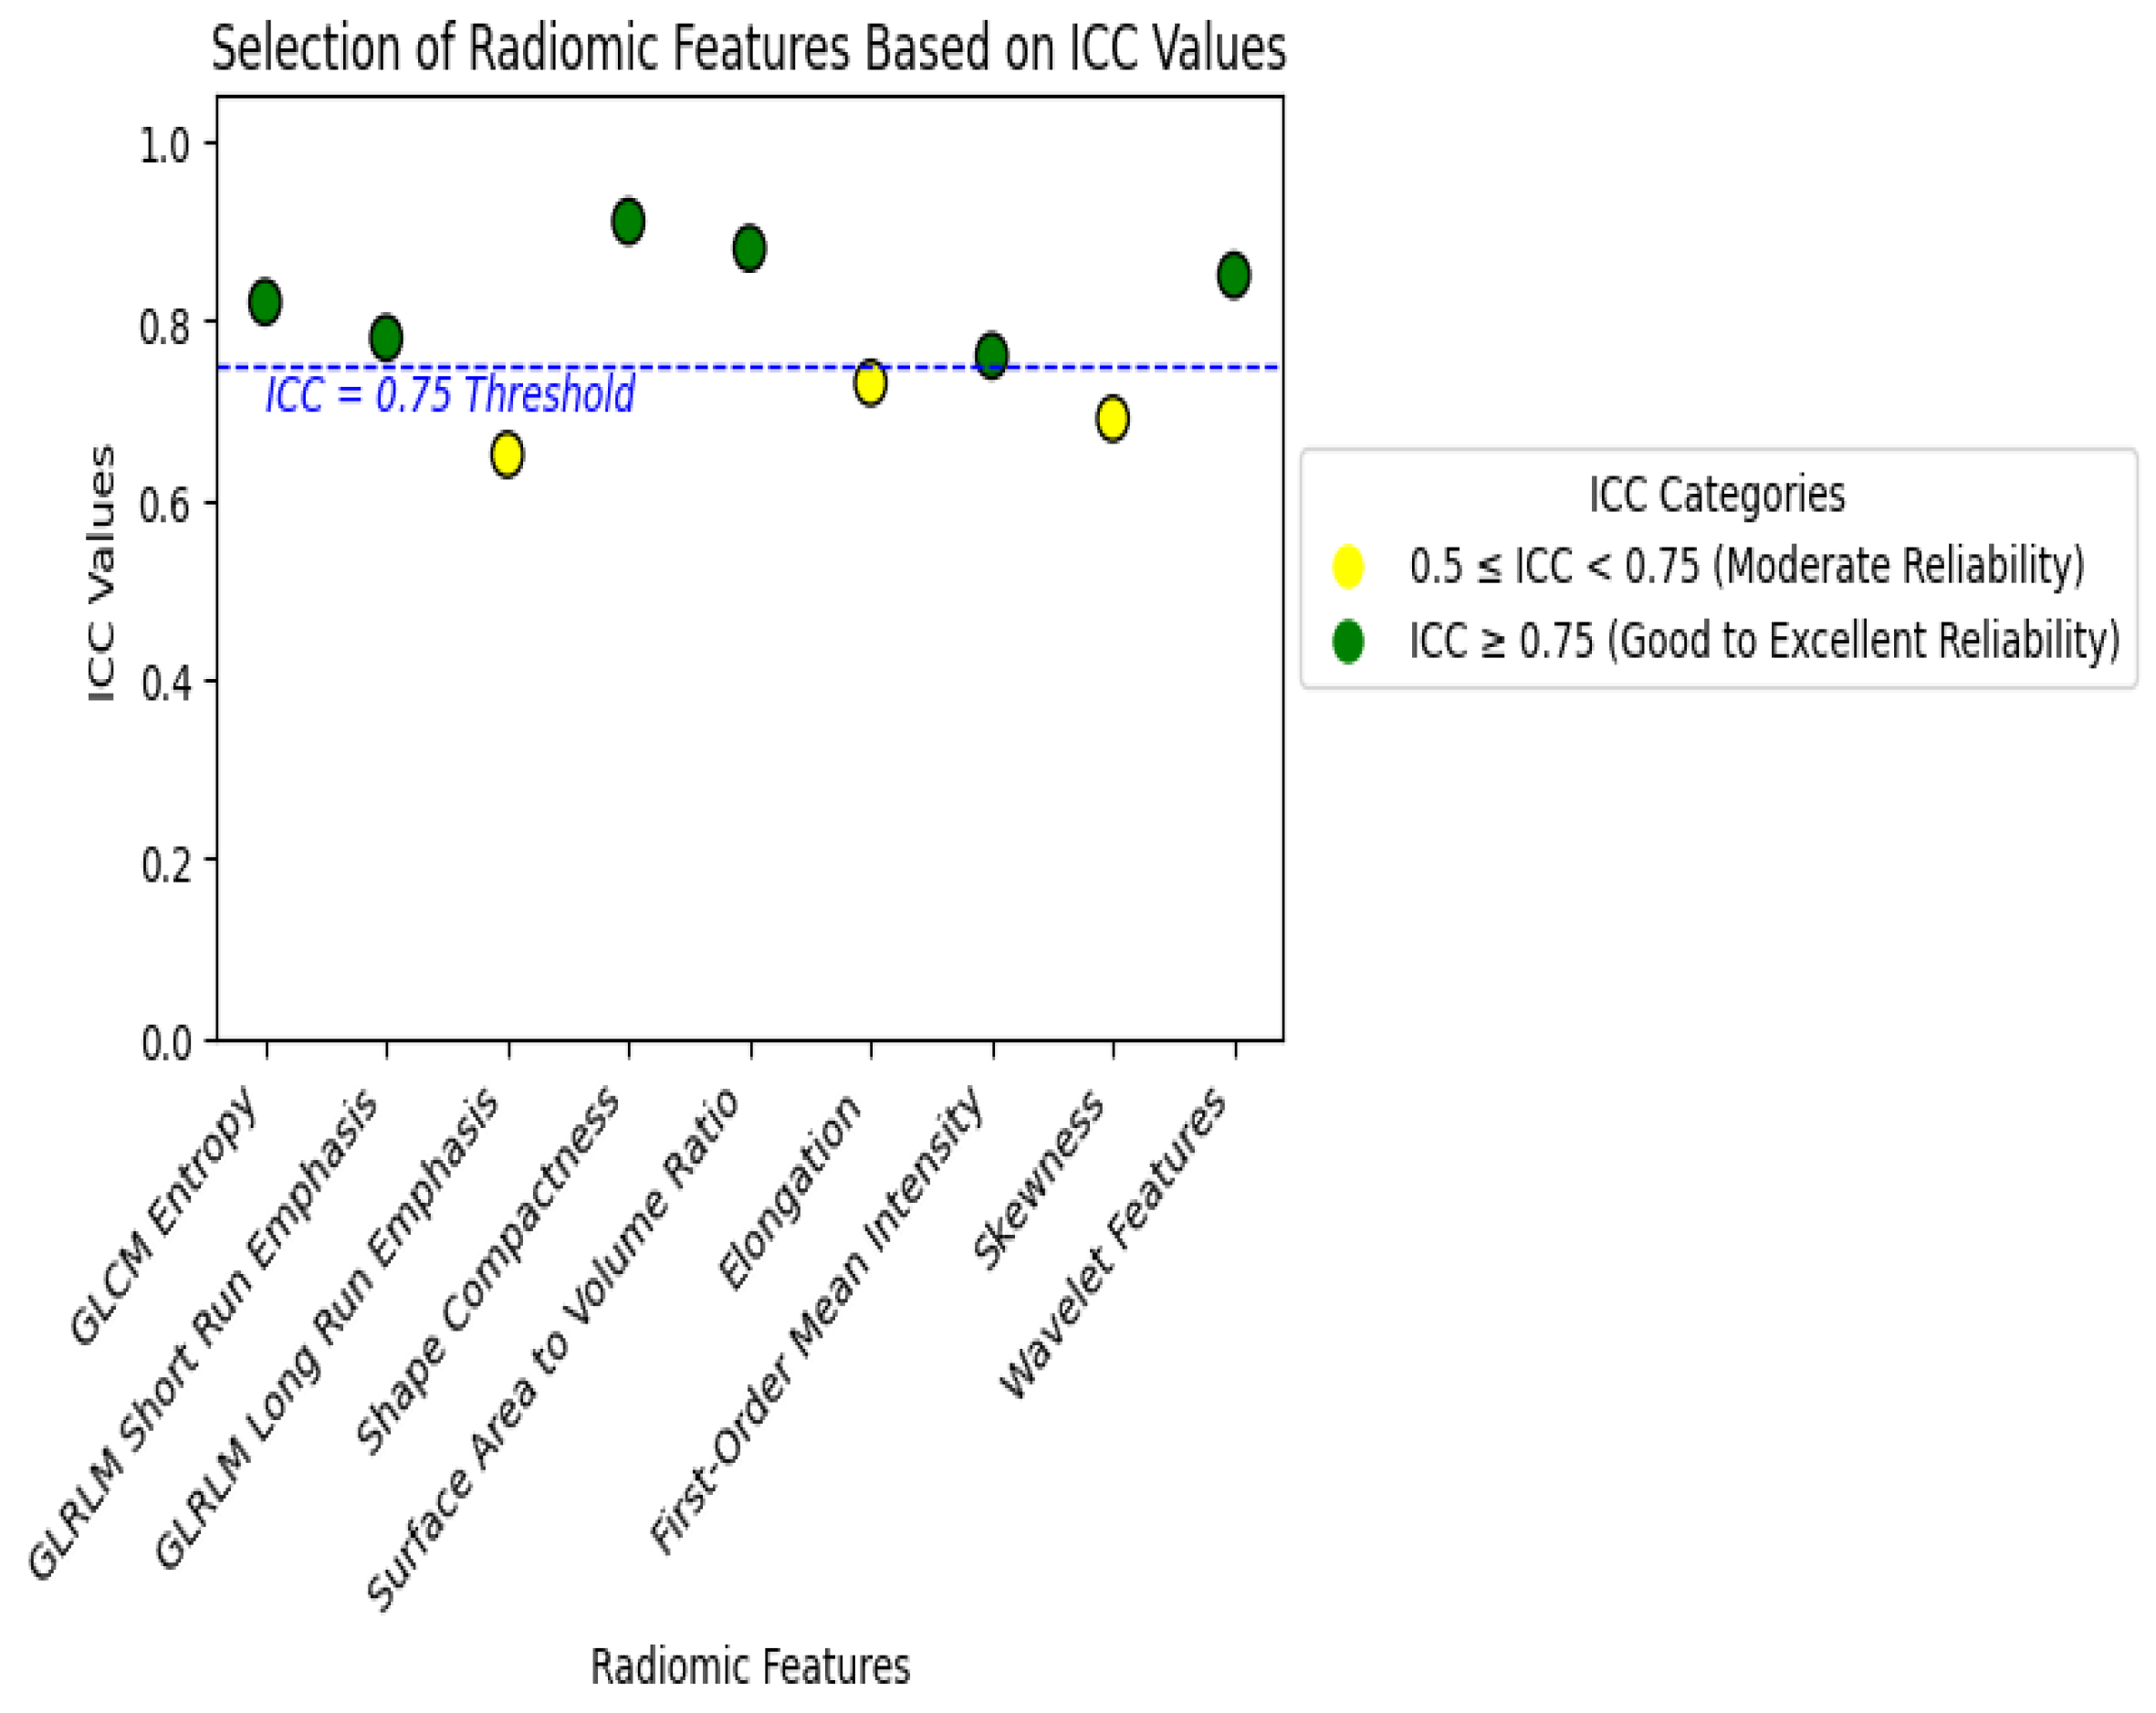
2.3. Feature Selection and Stability Analysis

Thus, in the forward stepwise correlation analysis, we applied an intraclass correlation coefficient (ICC) threshold > 0.75 in selecting highly stable features and eliminated features with borderline ICCs, which may imply potential loss of diagnostically relevant features. However, borderline features that might be relevant diagnostically were excluded from consideration based on an ICC of 0.6–0.75; this modeling approach placed an emphasis on generalizability over maximal sensitivity. It is possible that such borderline features may be explored in further studies as to their value across varying conditions of imaging as one way of establishing their clinical utility.
Feature selection is, therefore, an indispensable step in machine learning for radiomics, since it features prominently in the accuracy, interpretability, and generalizability of any model developed from such data.

2.3.1. Feature Stability and Reproducibility

Therefore, appropriate stability analysis was performed before feature selection in order to ensure that the features used in the model would be reproducible and robust, taking into account various imaging conditions. Various intraclass correlation coefficients of each feature are measured to check the reproducibility of their measurements. Features with ICC > 0.75 are considered highly stable and were thus retained for further investigation [15]. There is a very valid statistical basis for selecting the ICC threshold of >0.75 in choosing the ICC threshold, which will support the overall objective of the study in coming up with a reliable and generalizable diagnostic model. That being the case, it chose to select only the most stable features, so the machine learning models become not only accurate but also strong across different conditions of imaging—a factor that makes them more applicable in real-world clinical settings. ICC has become a very common metric in the literature for quantifying the stability of features. Lambin et al. introduced the need for radiomic features to be reproducible and robust since that would provide the clinical utility of such features [16]. ICC thresholds were also used in the studies of Parmar et al. in order to filter out those features that were inconsistent across different image acquisitions with the purpose of making radiomics-based models more robust [17]. In this regard, their study showed that increased reliability of features with a higher ICC threshold—for example, >0.75—led to the improved performance of a model once applied to external datasets. Those with lower stability were discarded. Furthermore, to assess the inter-observer variability of feature extraction, we asked several radiologists to perform a manual segmentation of the same set of images. As shown in Figure 3, the features that showed high variability between observers were excluded so that only reproducible features, not biased by potential manual segmentation, were considered in further analyses.

2.3.2. Correlation and Dimensionality Reduction

Most of the radiomic features, more so those derived from texture matrices, have high correlations with one another, leading to multicollinearity in machine learning models. Multicollinearity increases model complexity and decreases interpretability. In this respect, it even degrades performance by making the model sensitive to noise.
To handle this, we performed the Pearson correlation in order to identify highly correlated features and remove them [18]. We thresholded the correlations at 0.9, meaning that for any pair of features with a correlation coefficient greater than 0.9, one of the pairs was removed from the dataset. This threshold ensures that the model retains only independent and unique information while sustaining most of its predictive power, reducing the dimensionality of the feature space.

2.3.3. Feature Selection Techniques

In the following stability and correlation analysis, we performed a two-step feature selection strategy, balancing interpretability with prediction performance. The two key techniques were LASSO (Least Absolute Shrinkage and Selection Operator) regression and recursive feature elimination (RFE) [19]:
  • LASSO Regression: LASSO introduced regularization into the feature selection process by applying a penalty to the magnitude of the coefficients associated with each feature. This is a powerful method in high-dimensional datasets, as it shrinks the coefficients of less important features to zero, effectively removing them from the model.
  • Recursive Feature Elimination (RFE): This second feature selection method provided a wrapper method, working in conjunction with a machine learning model. RFE recursively removed the least important features based on their contribution to model performance until only the optimal set of features remained. This method ensures that the final feature set is tailored to the specific model being used, maximizing accuracy and interpretability [20].
Permutation Importance and SHAP Analysis
To evaluate the relative importance of the selected features, we employed two complementary feature ranking techniques: permutation importance and SHAP. These methods help identify which features contribute to the model’s predictions and ensure that these features are not only statistically significant but clinically relevant [21]. For permutation importance, this model-independent method checks how much the model’s performance drops when a specific feature’s values are randomly permuted. A larger decrease in performance means the model is more dependent on that feature. SHAP values offer a game-theoretic approach to feature importance, providing both global and local interpretability. It quantifies how much each feature changes the prediction, making it more interpretable than many black-box algorithms. This was especially useful for identifying features that may have a small global effect but are crucial for individual predictions, supporting personalized diagnostic applications.
Model Interpretability and Clinical Relevance
A key objective of feature selection in this study was to enhance model interpretability. In clinical settings, understanding why a model makes a prediction is just as important as the prediction itself. We evaluated the final selected feature set not only for its predictive power but also for its clinical relevance. The model provided insights into tumor heterogeneity and morphology in a clinically interpretable way, highlighting stable and meaningful radiomic features. This interpretability makes the model more likely to be adopted in clinical practice, as it offers actionable information that healthcare professionals can clearly understand.

2.4. Machine Learning Model Development

An accurate machine learning model is the heart of radiomics-based cancer diagnosis, which allows conversion from a high-dimensional feature space into a clinically useful prediction. We focused on building a model to differentiate between malignant and benign tumors with the aid of features extracted from CT DICOM images (as described in Section 2.2), which have been available for quite some time now. This could help us extract the abstract heterogeneity of lung tumors through features derived from imaging, which were also very important in early detection and diagnosis.

2.4.1. Model Architecture and Choice

In this study, two main machine learning models were developed: a Convolution Neural Network (CNN) using the architecture of DenseNet-201 and an XGBoost algorithm. The chosen models thus had to cope well with the medical imaging data and radiomic feature complexity, providing a compromise between predictive power and model interpretability to allow for a hybrid diagnostic approach [22].
  • DenseNet-201 (CNN Model): DenseNet-201 is a popular CNN architecture that effectively performs image feature extraction through dense connections between layers. This dense connectivity mitigates the vanishing gradient problem by helping in reusing features across layers to learn more complex imaging tasks like detecting cancer. To this end, in our study, we trained the DenseNet model separately on both raw CT images and feature maps to enable the network to learn from spatial patterns (raw images) as well as quantitative tumor characteristics (radiomics-driven features) [23].
Although CNNs are often used on pixel-based data, we incorporated extracted features as extra input channels for the DenseNet model. That meant the CNN was able to use high-level quantitative descriptors—things like shape, texture, and intensity histograms that helped it make its later decisions in addition to all of the raw image data. Here, we present a multi-modal input design to improve the model’s diagnostic accuracy by integrating pixel-based and feature-based analysis.
  • XGBoost (Gradient-boosted Decision Tree Model): XGBoost is a powerful machine learning algorithm that is known to perform well on tabular data and has become very popular in the world of Kaggle competitions, where it generally reaches SOTA (State-of-the-Art) scores. Because of its feature importance ranking and model interpretability, CNNs are not very good at being mean for image data. Training the XGBoost model on extracted features allowed us to test the importance that individual features hold in diagnostic tasks and thus infer biological interpretability [24]. The model was then trained on the entire set of extracted features, and feature importance was evaluated using SHAP values and permutation importance to rank these race predictors (explained in Section 2.3).

2.4.2. Training Process and Cross-Validation

Accordingly, both models have been developed by using a five-fold cross-validation strategy in order to make sure that the results are generalizable and not overly influenced by the training data. Cross-validation, which is an essential step in ensuring that overfitting does not significantly reduce model performance on unseen data, is particularly important in medical imaging studies, as representative cases are limited.
  • Five-fold Cross-validation: The dataset was divided into five equal-sized subsets, and in each fold of the cross-validation, one subset played the role of a validation set, while the other four subsets played the role of training sets. This was repeated five times in such a way that each subset acted as the validation set once. Averaging over five folds provides a robust estimate of accuracy, sensitivity, specificity, and AUC-ROC for model performance.
  • Data Augmentation: For the training of the CNN to enhance generalization, data augmentation techniques were used on the CT images. Then, several augmentation techniques—like random rotations, flipping, cropping, and scaling—were used to introduce patient positioning and variability in scanner settings, which will increase distortions and the diversity of the training.
  • Hyperparameter Tuning: These activities also involve the tuning of the learning rate, batch size, and dropout rate by a grid search strategy. The early stopping in this CNN model stops the training when it observes that there is no more improvement in validation loss within five successive epochs to avoid overfitting and saving computational resources. Similarly, XGBoost hyperparameters, such as, but not limited to, those involving the maximum depth of trees, learning rate, and regularization parameters, have been tuned in a manner that predictive performance is maximized at the possible cost of overfitting.

2.4.3. Model Optimization and Loss Functions

Thanks to the combined loss functions, comprising both segmentation and classification, we managed to maximize its performance. Specifically, the Dice loss function has been used to address segmentation accuracy for tumor regions, while a binary cross-entropy has been utilized for the classification task with regard to malignant/benign nature determination in tumors. Dice loss is a largely used metric in medical image segmentation and calculates the overlap between the predicted and actual tumor masks. This metric came in handy, especially for the segmentation part of the CNN in delineating the tumor boundary accurately. The model improves the Dice coefficient, acting to better define the tumor region. To classify, the binary cross-entropy loss function penalizes the network for each wrong prediction made, thereby allowing the model to be directed toward a more correct classification. The use of the network with this loss function has further allowed it to learn just how to label correctly and effectively both cancerous and non-cancerous regions from the raw imagery data and the radiomic feature maps.

2.4.4. Performance Metrics

  • Accuracy: It refers to the measure of the portion of properly classified images, thus giving the general performance of the model.
  • Sensitivity (recall): It is the capability of the model to correctly identify malignant cases. High sensitivity is rather important in cancer diagnosis because it will reduce false negatives.
  • Specificity: The percentage of healthy cases correct that this model should identify in order to avoid the misclassification of a benign case as malignant.
  • AUC-ROC (Area Under the Receiver Operating Characteristic Curve): A metric that will provide the model performance for distinguishing malignant from benign cases across all possible classification thresholds. The high value of AUC-ROC means it would be unproblematic for this classification model to make good distinctions between the classes, even if there is a class imbalance in this dataset.

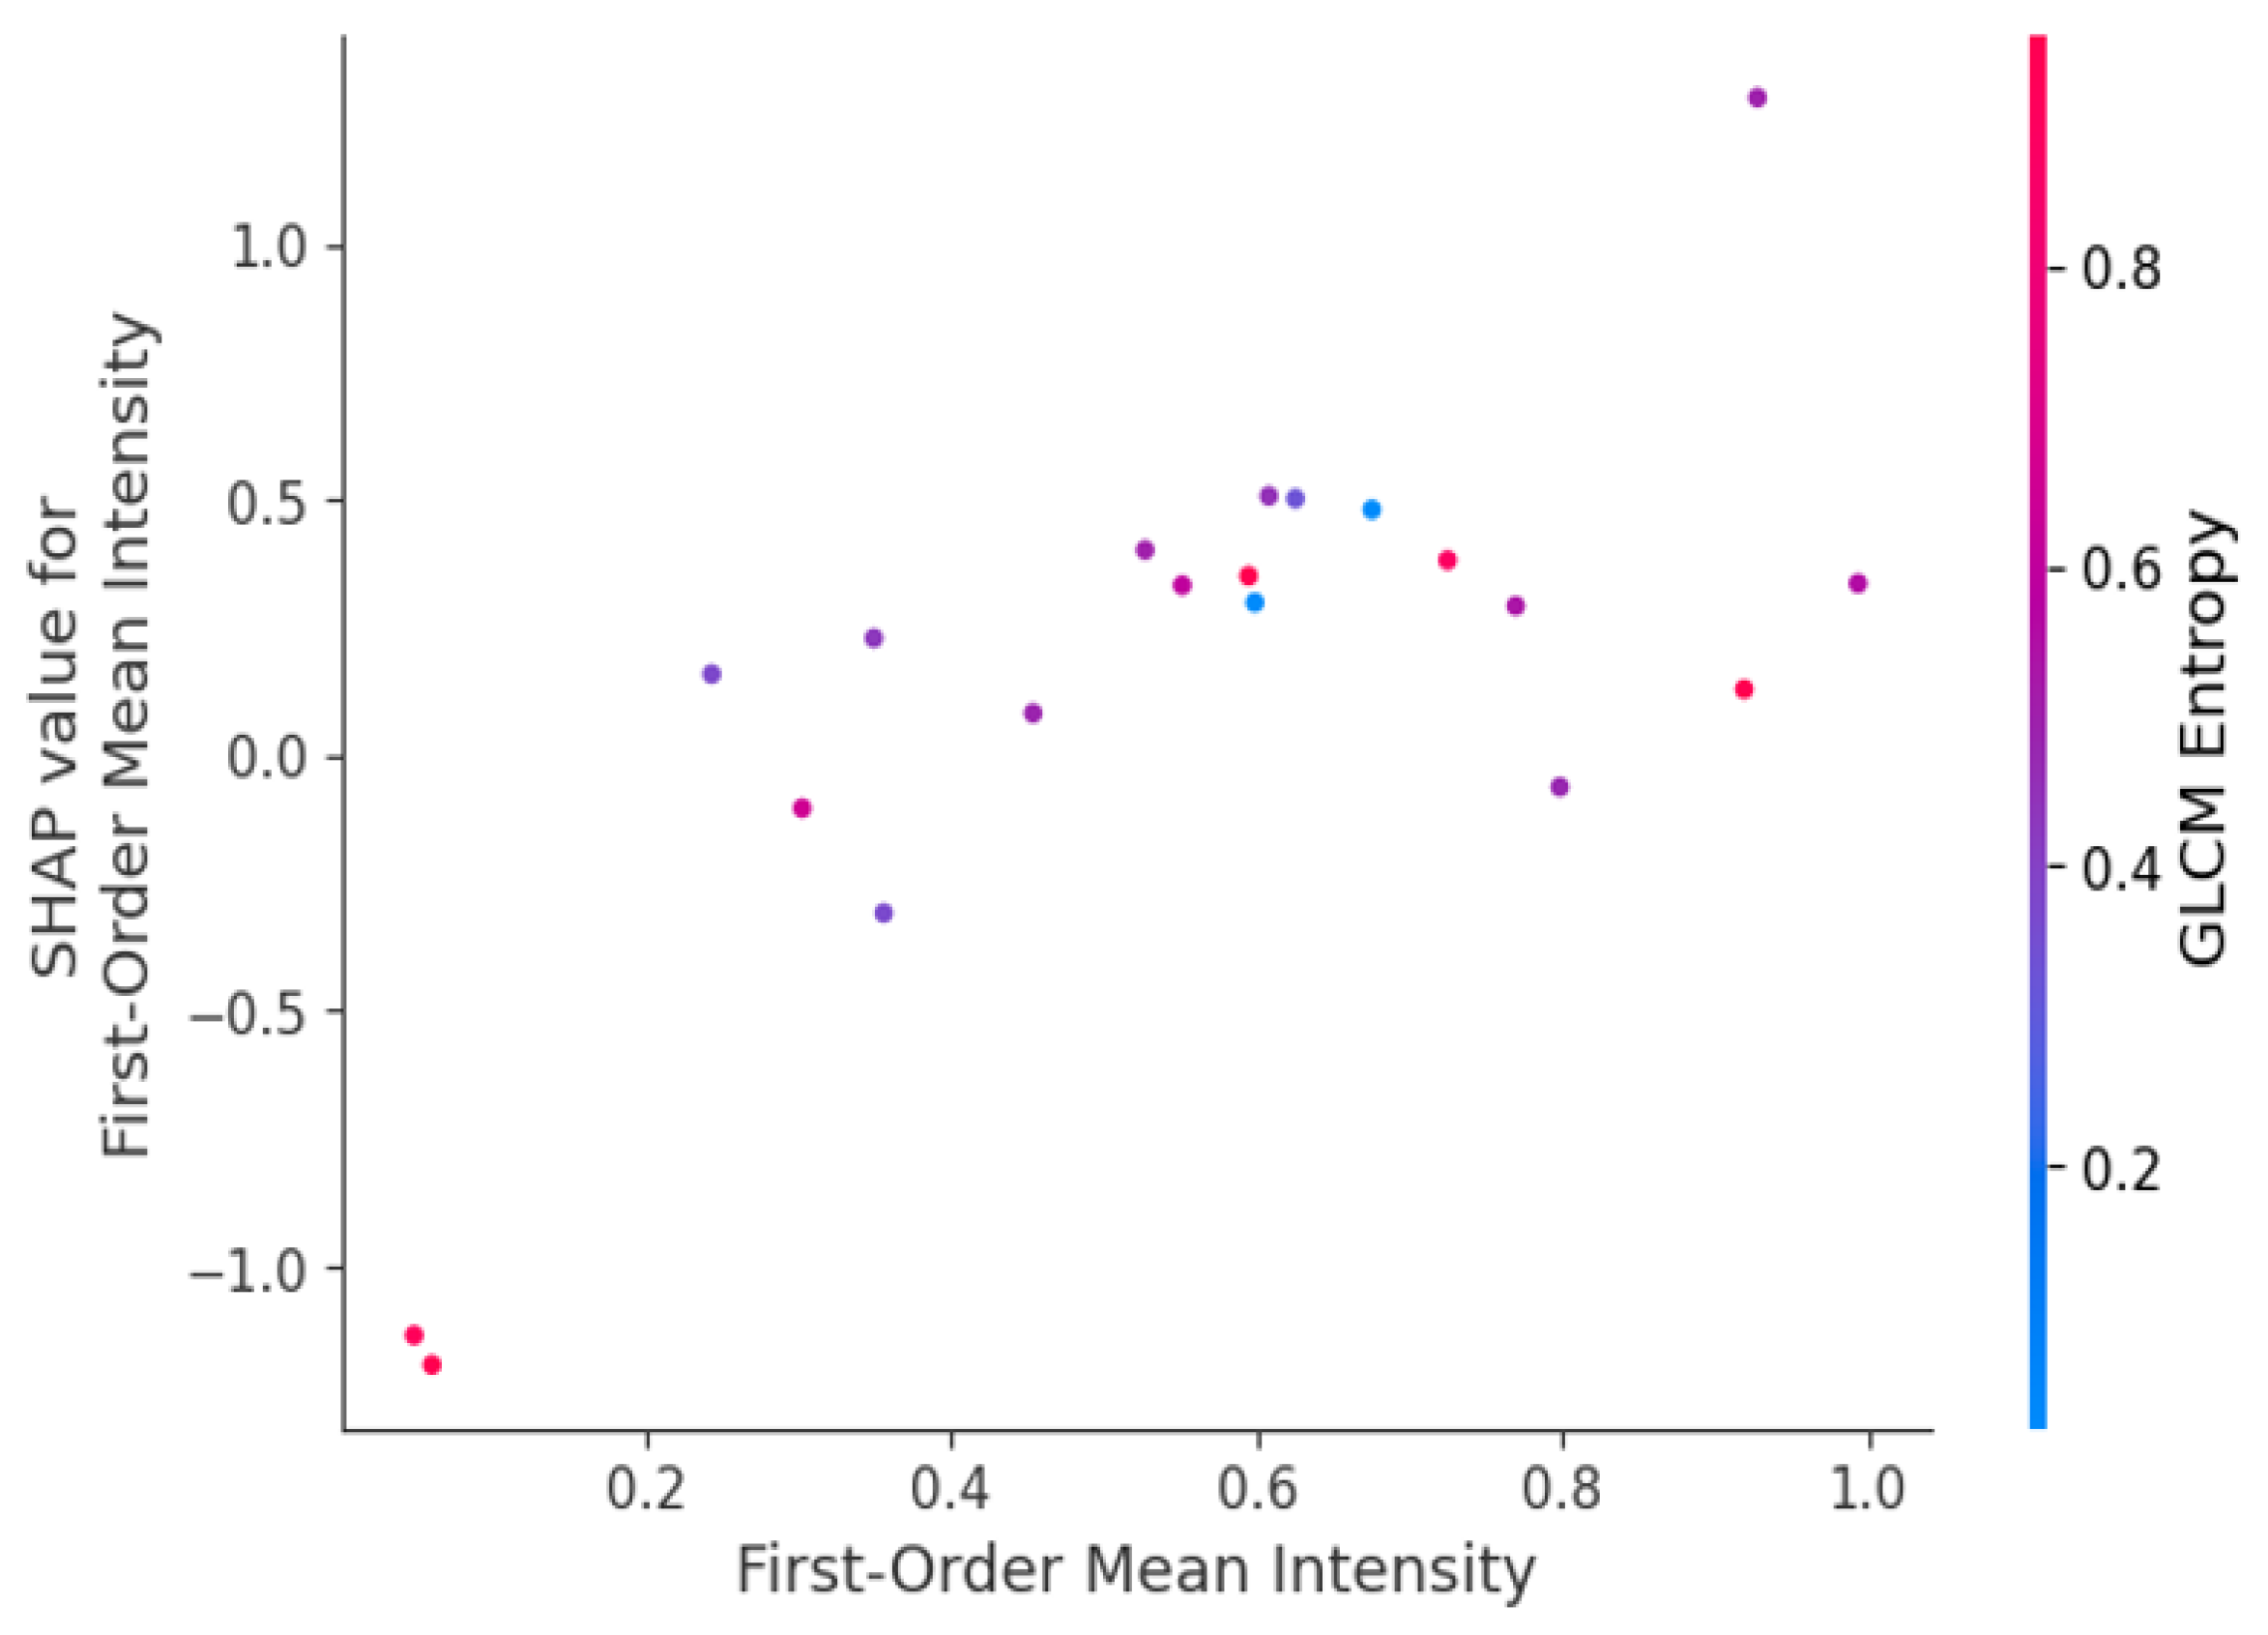
2.5. Feature Importance and Interpretability

Similarly to any other area of medical imaging and machine learning based on radiomics, interpretability is just as important as predictive accuracy. If models are to be clinically actionable, then clinicians must understand the rationale behind each prediction. Then again, the contribution of each feature that has emerged with a view not only to identify but also to interpret the model’s prediction has been our focus in the present study. For this work, SHAP was selected because it has capabilities for both the explanation of individual predictions, local interpretability, and the aggregation of the feature contributions across all the predictions—or global interpretability [25].
  • Global SHAP Analysis: We averaged the SHAP values of every feature on the dataset and ranked the features by their general importance. Indeed, for every test we ran in this work, the features that ranked in the top places included GLCM Entropy and GLRLM Run Length Non-Uniformity; thus, our intuition that tumor heterogeneity was one of the key factors in malignant/benign tumor classification was legitimate.
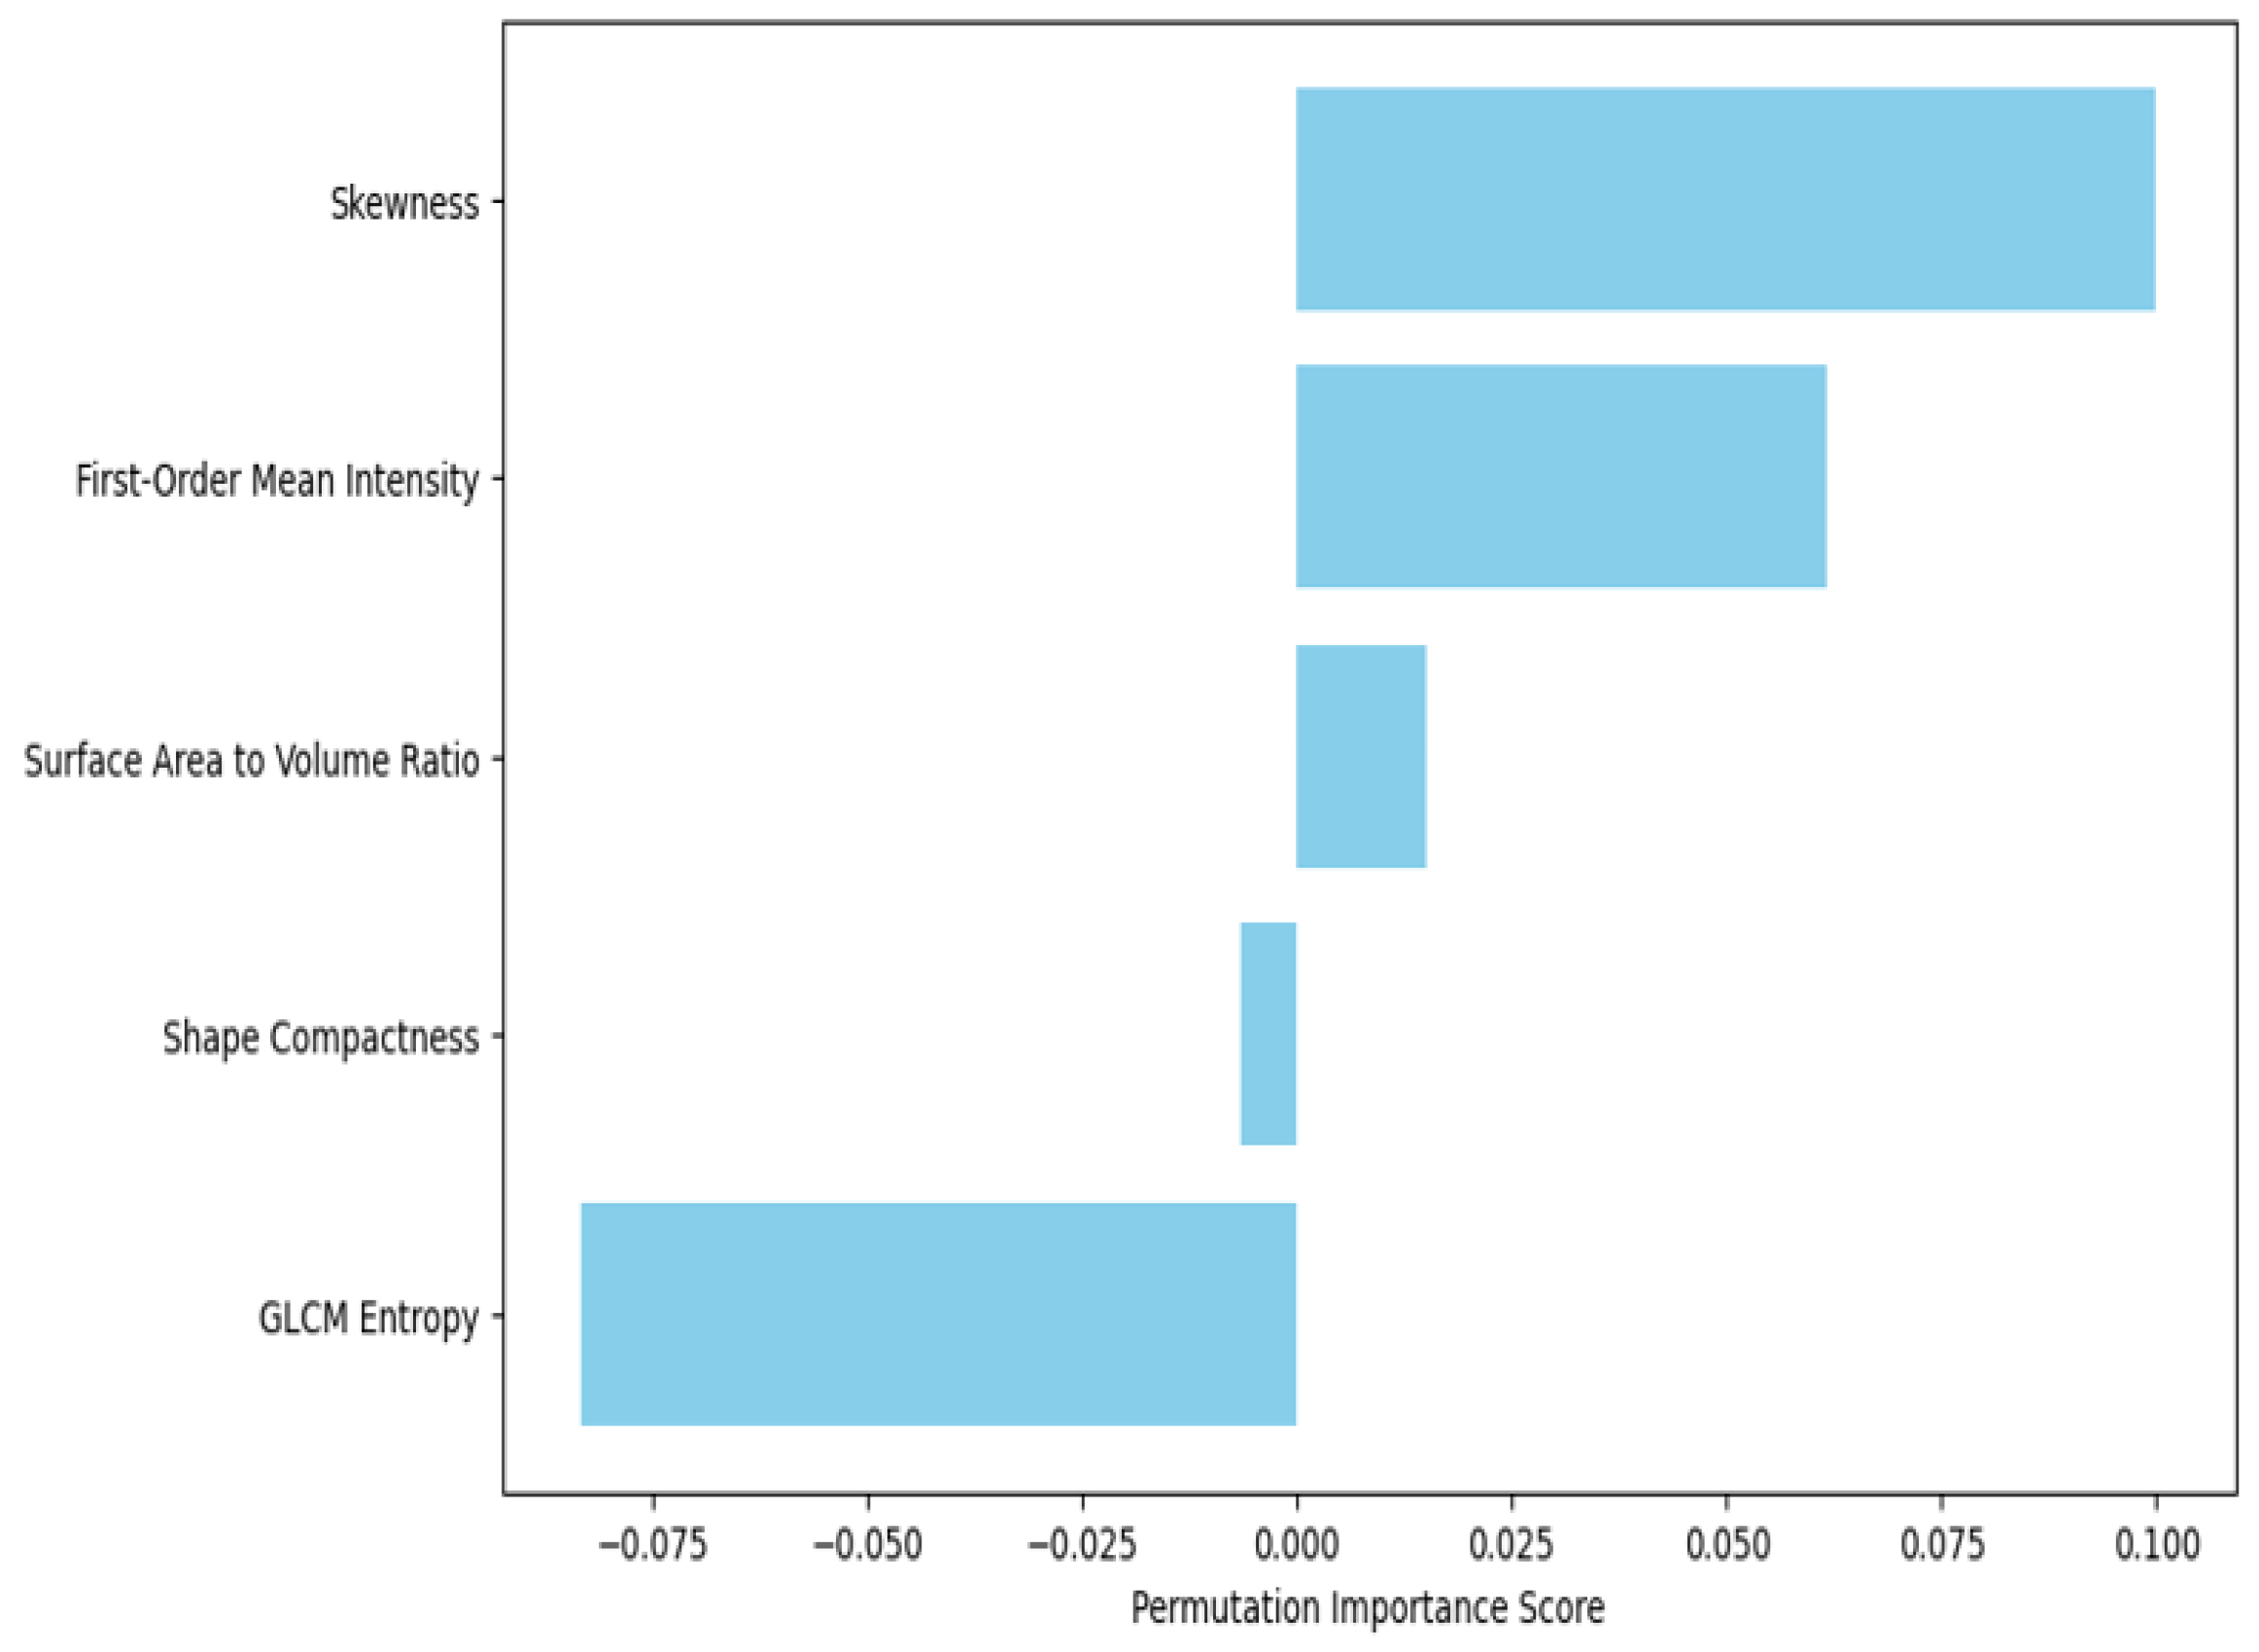
  • Local SHAP Analysis: SHAP also allowed us to drill into the contribution of features on a case-by-case basis. For example, in the specific cases of early-stage lung cancer, features related to first-order skewness, which reflects the asymmetry of voxel intensity distribution, have a high SHAP value and, hence, are critical for the right classification of small irregular tumors. That is very important for local interpretability in clinical applications, as it would tell the radiologists which features drove the model’s decision for each given patient.
An interesting aspect of this study was the comparison of feature importance rankings obtained from the DenseNet-201 CNN model, which utilized both raw image data and features, with those given by the XGBoost model, utilizing only features. In this way, one can grasp how the integration of pixel-based and feature-based data impacts every single feature’s importance. The CNN model considered the features as new input channels, together with the raw CT images. In this way, the network learned the complex patterns of the raw data, taking into consideration the quantitative features describing shape compactness and texture homogeneity. Feature importance rankings provided by both SHAP and permutation tests showed that even when presented with raw image data, the texture features still dominated. This therefore further underlines that features capture clinically significant information that may not easily be inferred from raw pixel data alone.
XGBoost, on its part, shows feature importance directly. Given that this model is trained only on radiomic features, GLCM Entropy and GLRLM Long Run Emphasis are the two most important features. This also goes as one would expect from the two metrics, which are really sensitive in bringing out malignant changes in tumor structure. Using only the radiomic data, XGBoost is more focused on how each feature contributes toward its final prediction. By comparing the results of both models, we were also able to confirm that the most important features were indeed the robust features, such as GLCM Entropy and GLRLM Non-Uniformity, across different learning paradigms.
One of the main goals of this study was to make sure that the machine learning model was interpretable and clinically actionable, not just accurate. SHAP values described why the model had made its prediction for a given patient, which is so crucial for the adoption of AI (Artificial Intelligence) models in healthcare. In addition, the clinical interpretability of the model was enriched by focusing on features with frank biological significance. As illustrated in Figure 4, SHAP values highlight the global impact of selected radiomic features on model predictions, with GLCM Entropy and shape compactness emerging as key drivers of classification accuracy. Each point represents a SHAP value for a particular feature and sample, with color indicating feature value (red for high and blue for low).

2.6. Tumor-Specific Features Relevance

These features characterize tumors based on a wide range of aspects, which include shape, texture, and intensity; however, the importance of most of these features changes with changes in factors related to tumor size, stage, and location. In this work, our goal was to explore how much the importance of single features would change across different tumor phenotypes for insights into how heterogeneity impacts diagnostic accuracy. We explored the dynamic nature of these features by stratifying the tumors based on size and stage. Moreover, we accentuated the personalized diagnostic potential of radiomics in lung cancer. Tumor size represents an important attribute that modulates the relevance of radiomic features. Larger tumors usually show more geometrically complex and irregular shapes, whereas smaller tumors may only show subtle variations with respect to texture-based features. Small-sized tumors were expected to rely more heavily on texture-based features due to the accentuation of intratumoral heterogeneity, while shape-based features were hypothesized to become more influential as the tumor increases in size and undertakes greater morphological distortion. To test this hypothesis, we stratified the tumors into three size categories based on the TNM (Tumor–Nodes–Metastasis) system [26]:
  • Small Tumors (<2 cm): Earlier-stage tumors, which, due to their small size, are often very hard to detect because they do not cause much morphological disruption. For these cases, we expected that texture-based features would convey the most information since these features capture the subtle heterogeneity in the tumor that might not be obvious to the naked eye from the raw images. This was indeed the case, as all texture features ranked higher in importance for smaller tumors, in keeping with our hypothesis that early malignancies are more micro-heterogeneous.
  • Medium-sized Tumors (2–4 cm): In tumors of intermediate size, it was expected that both the texture- and shape-based features had a balanced contribution. For such tumors, shape elongation and GLCM correlation were important features, for they extracted information on the change in geometry of the tumor during growth and more structured texture patterns within the tumor mass.
  • Large Tumors (>4 cm): We expected that with the larger size and more advanced development of tumors, shape-based features such as surface-area-to-volume ratio and compactness would turn out to be the most informative measures in distinguishing between malignant and benign status.
Our results confirmed this intuition; indeed, the more a tumor grows, the more significant its shape features become for classification. This may be because aggressive growth leads to increasing structural abnormalities. These size-based analyses indicate that radiomic models need to be tuned for tumor characteristics. While texture-based features can provide more accurate diagnoses in smaller tumors, shape-based features may become more critical in larger ones.
Another critical determinant in feature relevance is the tumor stage. As far as lung cancer is concerned, low-invasion and low-heterogeneity primary stages refer to the early stages of this cancer, corresponding to either Stage I or II, while the advanced stages of that tumor are usually categorized as Stage III or IV, showing clear morphological and textural changes due to high growth in its malignancy, as well as tissue necrosis and vascularization. Knowledge of how feature importance evolves with the acquisition of cancer stages could be useful during the model training process in view of cancer detection at various points of its course [27].
  • Early-stage Tumors (Stage I–II): The critical contribution of texture-based features became more pronounced in low-stage tumors, which present with more subtle imaging characteristics. For example, GLCM contrast and GLRLM long-run emphasis constituted the most informative features for early-stage tumors, underscoring the importance of capturing those fine-grained textural variations arising from early intratumoral heterogeneity. These findings hint that texture features may be used as an early sign of malignancy, therefore opening up perspectives that allow for earlier and more accurate detection.
  • Late-stage Tumors (Stage III–IV): While advancing to the more advanced stages, tumor shapes become increasingly irregular due to invasive growth patterns. In late-stage tumors, shape-based features such as elongation, surface irregularity, and sphericity were most important. These features captured the complex structural deformations occurring with invasion into adjacent tissues and more pronounced morphological characteristics of these tumors. More than that, the texture features related to necrosis and heterogeneity remained salient at these stages and were probably related to the increased inner complexity of the advanced tumor.
This could also indicate that tumor stage-tailored models might lead to even higher diagnostic superiority. More importantly, this suggests that texture-based features were more critical in early-stage tumors, whereas the shape-based ones are more informative for the advanced stage of tumors given their structural complexity.
Another factor is the tumor location within the lung. Central tumors, which are near the bronchi and mediastinum, tend to have different patterns of growth compared with those that develop in the peripheral tissues of the lung. In this study, we investigated if specific features may be informative for tumors in certain anatomical locations and helped refine diagnostic accuracy based on tumor site.
  • Central tumors: Tumors around the central bronchi and mediastinum may, for instance, have more complex relationships with vessels and airways. For them, shape-based features such as convexity and elongation had greater relevance since the feature set was biased toward distinguishing irregular growth patterns that result from confinement imposed by surrounding anatomical structures. In addition, GLCM correlation performed really well in detecting tumor heterogeneity of central lung tumors that may show complex interaction with the surrounding tissues and thus exhibit variant intensity patterns in CT images.
  • Peripheral tumors: Tumors that originate in peripheral lung tissues, away from the bronchi and mediastinum, grow more freely in most cases and adopt more rounded or nodular shapes. In such cases, texture-based features were of higher importance, reflecting heterogeneity and an irregular internal texture of the tumor. Moreover, the surface-area-to-volume ratio played an important role in the detection of an irregular tumor shape since peripheral tumors are less confined by structure compared with central tumors.
One of the key novelties of this work was investigating how tumor size, stage, and location interact in order to influence the feature relevance. Performing the combined analysis allowed us to highlight the concrete patterns of feature importance variation for several tumor characteristics including, for example, the following:
  • Small early-stage peripheral tumors: These are best described by features of texture—for example, GLCM Entropy, which captured the subtle heterogeneity within the tumor. Shape features are less important for this subgroup since these tumors have not adopted those irregular morphologies typical of more advanced cancers.
  • Large late-stage central tumors: On the contrary, these larger tumors, located near the central part of the lungs, were more characterized by shape-based features, such as surface irregularity and elongation, describing the invasive and irregular growth of the tumor in an advanced stage of cancer.
The interaction between size, stage, and location imposes further complexity on radiomic analysis and calls for models capable of flexible adaptation to various phenotypes of tumors.

3. Results

The results of this study will focus on the effectiveness that the chosen features have in differentiating malignant lung tumors from healthy tissue. We further test the performance of these features using some of the deep machine learning models like DenseNet-201 and XGBoost and then show the relevance of those features to several tumor phenotypes, sizes, and stages. Our findings confirm that an appropriate selection of features may result in simple and interpretable models that provide clinically actionable and biologically meaningful insights.

3.1. Model Performance

It was expected to be the actual contribution of features in the automatic detection of lung cancer, determining what exactly these features can add to the diagnostic performance of machine learning-based models.
Some performance metrics and key results obtained from DenseNet-201 and XGBoost are outlined in Table 1. The DenseNet-201 model was trained with both CT images and radiomic feature maps to perform best in the identification of malignant tumors, which is very important for treatment, given its high sensitivity and specificity. The high specificity of the model underlines its capability to keep false positives as low as possible. By contrast, the XGBoost model, dependent only on radiomic features, highlighted considerable performance that underlined the diagnostic potential of such quantitative descriptors as GLCM Entropy and shape compactness. In turn, with some lower sensitivity of the XGBoost model, overall robust specificity and strong discriminative ability could be demonstrated, expressed as an AUC-ROC of 0.90.
By including radiomic feature maps within the model architecture, DenseNet managed to explore a higher-level visual pattern from both CT images and their quantitative descriptors. Results showed this hybrid strategy did improve performance compared to models trained either on images or on features alone in lung cancer classification. The high sensitivity obtained (91.6%) is crucial for lung cancer diagnostics, as the ultimate goal is to minimize false negatives and not miss malignant tumors.
Similarly, the feature-extracted XGBoost model (radiomics only) did very well, with an accuracy of 89.7%. The model never viewed raw image data, but it performed impressively, indicating the strength of the selected features in such a manner that it assured diagnostic relevance in the detection of lung cancer. The high performance of the XGBoost model underlines the diagnostic value of features as stand-alone predictors of lung cancer.

3.2. Radiomic Feature Importance and Model Insights

This directly relates to assessing the role of features in the automated detection of lung cancer, either because of their diagnostic relevance or contribution to model performance. The importance of features is responsive to the insight that such a set of quantitative descriptors of tumor characteristics enters the decision-making developed by machine learning models. Although the most relevant contribution came from texture and shape features, there were cases where some important roles were played by intensity features. Intensity features describe the distribution of voxel intensities within the tumor and provide basic information about the overall density and metabolic activity of the tumor. First-order Mean Intensity: It provides the average intensity of the voxels inside the tumor and is thus indicative of the density of the tumor and the general metabolic activity. Less important than texture- and shape-related features, mean intensity provided a contribution to differentiated tumors having differing degrees of cellularity and necrosis. SHAP values explained that this feature was more important in early-stage tumors, where changes in intensity may reflect initial tumor development (Figure 5). The permutation importance score of 0.34 was lower compared to texture and shape features but confirmed its relevance in specific contexts (Figure 6). Especially, the contribution of intensity-based features was more context-dependent; here, these features played a greater role for early-stage or highly cellular tumors in which the overall intensity distribution may provide clues about the tumor’s metabolic activity.

3.3. Tumor Size and Feature Relevance

It is also worth noting that tumor size is a determining factor in the relevance of features regarding both detection and characterization. Since internal structure and external morphology evolve as tumors grow, the importance of texture, shape, and intensity-based features evolves. Table 2 highlights the importance scores of each feature across different tumor sizes, illustrating that certain features (e.g., GLCM Entropy and shape compactness) become increasingly relevant as tumor size grows.

3.3.1. Radiomic Feature Relevance for Small Tumors (<2 cm)

Small tumors, usually in their early stages of the disease, often do not depict typical morphological variations that are normally seen in larger tumors. Texture-based features therefore carry vital information about subtle intratumoral heterogeneity, which may not be evident to the naked eye or ancillary imaging.
These findings point out the major contribution of texture-based features in the task of small tumor detection. Focusing on the inner heterogeneity of the tumor can thus allow models to identify even early-stage malignancies with high accuracy when the external morphology of the tumor has remained relatively unchanged.

3.3.2. Radiomic Feature Relevance for Medium-Sized Tumors (2–4 cm)

While tumors grow to a medium size of 2–4 cm, the texture and shape features turn out to be of balanced importance. In particular, shape compactness and GLCM correlation are described in Section 2.6. This therefore puts forth a balanced importance of texture versus shape-based features, given medium-sized tumors, and suggests that a comprehensive approach must be incorporated for an accurate diagnosis that includes both aspects. While the shape becomes more informative for larger-sized tumors, the continued presence of textural heterogeneity remains critical for defining malignant changes.

3.3.3. Radiomic Feature Relevance for Large Tumors (>4 cm)

For larger tumors (>4 cm), shape-based features like surface-area-to-volume ratio and elongation are crucial for detecting irregular growth, as detailed in Section 2.6 and Section 4.2.2.
Table 2. Radiomic feature importance and model insights.
Radiomic FeatureTumor SizeImportance Score
GLCM EntropySmall0.72
GLCM EntropyMedium0.81
GLCM EntropyLarge0.88
Shape CompactnessSmall0.65
Shape CompactnessMedium0.75
Shape CompactnessLarge0.84
Surface-Area-to-Volume RatioSmall0.68
Surface-Area-to-Volume RatioMedium0.78
Surface-Area-to-Volume RatioLarge0.83
First-Order Mean IntensitySmall0.55
First-Order Mean IntensityMedium0.63
First-Order Mean IntensityLarge0.71
SkewnessSmall0.49
SkewnessMedium0.56

3.3.4. Comparative Analysis of Feature Importance by Tumor Size

Perhaps most importantly, the comparative analysis of feature importance over tumor sizes evidenced a dramatic shift in the importance that features have during tumor development. In small tumors, dominant feature importance comes from texture-based feature importance, capturing internal complexity in early-stage cancers. As tumors increased in size, shape-based features became more important, reflective of morphological changes with tumor progression, as described in Table 3.
Figure 7 also confirms our hypothesis that the main determining factor of the relevance of the specific features is tumor size, where texture-based features are more important in the early stages of cancer, whereas shape-based features become increasingly more dominant with enlarging tumors invading surrounding tissues. Higher GLCM Entropy values are associated with an increased likelihood of malignancy, as this feature captures texture heterogeneity, which is often indicative of tumor aggression.

3.4. Comparative Analysis Between Models

This work, therefore, investigates the performance of two machine learning models—namely, the DenseNet-201 CNN and XGBoost models—in harnessing features for the automated detection of lung cancer. While both recorded high levels in this work, their various philosophies on the use of features for prediction give significant intuition into the relative strengths and weaknesses of each approach.
While both works demonstrated that radiomic features are of primary importance for lung cancer detection, they utilized these features in different ways. The proposed DenseNet-201 CNN combined features with pixel-level data for high overall accuracy, while the XGBoost model provided more granular information on their relative importance. Table 4 below summarizes the key features’ performances in both models.
Shape features such as compactness and elongation demonstrated differential significance between early- and late-stage tumors, providing a clear link between tumor stage and feature relevance. Table 5 underlines how quantitative descriptors like surface-area-to-volume ratio and shape compactness become critical as tumors advance in stage, offering a diagnostic advantage for differentiating malignancy.
Model Performance Before and After Feature Selection: In order to quantify the effect of feature selection, we compared the results before and after feature selection. It is obvious from Table 6 that after feature selection, the results of both accuracy and AUC-ROC have significantly improved. These results point out that the most stable and diagnostically relevant features should be focused on.

4. Discussion

These represent the evidence that features are of paramount importance in automatic lung cancer detection, and different features contribute to the best performance a model can achieve. The diagnostic value of machine learning models for differentiating malignant from benign lung lesions was enhanced by the use of radiomic descriptors such as GLCM Entropy, shape compactness, and surface-area-to-volume ratio. The discussion now synthesizes the key insights from our results, contextualizing the importance of selected features and exploring their general clinical implications.

4.1. Comparison of Model Performance with and Without Texture Features

Importantly, we moved one step further and compared the two models with and without the incorporation of texture-based features. It could be observed from Table 7 that sensitivity and overall accuracy in models increase considerably upon the incorporation of a texture feature in their training.

4.2. Shape-Based Features and Tumor Progression

The shape features, therefore, become most applicable since the external morphology of the lung tumors changes significantly when evolving from early to late stages. In fact, early-stage tumors may have very similar morphologies to those from benign growths, while late-stage tumors often present more abnormal morphologies with invasive growth patterns, which can be accounted for with quantitative shape descriptors. Shape-based features in this research include shape compactness and surface-area-to-volume ratio, important features that classify advanced-stage tumors by providing key insights into the morphology and behavior of the tumor.

4.2.1. Comparative Analysis of Shape Features in Different Tumor Stages

The relevance of shape-based features in early- versus late-stage tumors is compared to give a better understanding of the role these features play at different stages of cancer. Again, from the results in Table 5, this was confirmed with increases in permutation importance as tumors progressed and morphological changes took place on account of the increase in aggressiveness. Shape features such as shape compactness and elongation provide information on early-stage tumors but often become latent in late-stage ones where the external morphology is highly irregular. These features allow the models to capture the invasive growth patterns of advanced malignancies and their complexity; hence, they act as a reliable indicator of tumor progress.

4.2.2. Clinical Implications of Shape-Based Features in Tumor Progression

Shape-based features bear high clinical relevance in the diagnosis of lung cancer, especially for tumor staging and treatment planning. While growing and invading the surrounding tissues, the tumors become more and more irregular in shape; these changes may provide important diagnostic information complementary to other features, such as texture and intensity. The feature of surface-area-to-volume ratio feature has high relevance in large, advanced-stage tumors, as increased surface complexity usually represents invasive growth. It provides important insights into the aggressiveness that the clinicians have on the tumor’s metastatic potential and aids treatment planning.
Diagnosis with integrated shape-based features can be more accurate; this can serve as an improvement in the detection of lung cancer, especially for late-stage tumors where the morphological changes are more evident and require more sophisticated analysis.

4.2.3. Stability of Selected Features

In this study, we used the following techniques to evaluate feature stability:
  • Cross-Validation Stability: K-fold cross-validation was implemented to make sure that the features selected were generalizing and robust. It provided an estimation of how consistent the top features’ contributions were to the modeling performance across different splits of the training and validation sets. The top features, such as GLCM Entropy and shape compactness found in Table 8, are more or less similar in their ranking across all folds.
  • Bootstrap Aggregation (Bagging): To further assess feature stability, we conducted bootstrap aggregation, where multiple models had been trained on different subsets of the data. This technique allowed us to assess how each feature’s importance varied across the different samples and ensure that the selected features in these samples were constantly ranked as important. The obtained results are presented in Table 9 and give evidence of the high stability of the selected features among different bootstrapping iterations.

4.2.4. Impact of Feature Selection on Model Performance

Feature selection has a high impact on model performance, not only because it increases the accuracy with the choice of the most relevant features, but it also decreases the risk of overfitting. Hence, it enables the models to generalize better on unseen data by focusing on fewer stable and highly relevant features. This resulted in the improvement of diagnostic performance.
The models exhibited significant improvements in both accuracy and AUC-ROC after feature selection. This demonstrates the value of focusing on a small set of highly relevant features, as it leads to more accurate and reliable predictions.

4.3. Clinical Implications of Radiomic Feature Selection

This is incredibly clinically important, especially for the improvement of the early detection and characterization of lung cancer. The focus on the most diagnostically relevant features, namely texture-based and shape-based metrics, functions to provide actionable insights through machine learning algorithms that help improve clinical decisions.
  • Early detection and diagnosis: Features like GLCM Entropy enable the models to capture subtle intratumoral heterogeneity for early detection of malignant tissues with high sensitivity, thereby reducing the likelihood of false negatives. This is very critical for early intervention and treatment.
  • Assessment of tumor aggressiveness: The shape-related features quantify, for example, the surface-area-to-volume ratio, which bears information on identifying tumors with irregular and invasive growth patterns, hence reflecting aggressiveness. These features provide assistance in grading the cancer and help deduce a suitable treatment strategy, including metastasis potential.
  • Personalized diagnostic approach: Integration of stable, interpretable features in the diagnosis models enables personalized insights in each case. Clinicians will understand the underlying reasons for every prediction using SHAP values and permutation importance to make more informed, personalized decisions in patient care.
These models ensure that clinical applications are not only very precise and accurate, but also trustworthy, since the feature selection process has been streamlined to focus on the most stable and significant predictors. The improved patient outcome must be the end result.

4.4. Limitations and Future Directions

Whereas this study illustrates the potential of features for automated detection, recognition of the limitations of the current approach and directions for future studies are important. These limitations concern aspects of data diversity, feature robustness, model interpretability, and clinical integration and pinpoint areas in which improvements might be incrementally beneficial for the development of more accurate, generalizable, clinically relevant radiomic-based diagnostic models.

4.4.1. Limitations

Data Diversity and Generalizability

Probably the most significant limitation of this study is the lack of diversity in the datasets used to train and validate the models. Despite the good performance of the datasets available for this work, there is a risk that results may not generalize to other populations or imaging protocols. This holds, in general, but it becomes particularly important in radiomics, where variations in CT acquisition parameters, scanner types, and patient populations may lead to potentially large differences in feature extraction and model performance.
  • Variability in Imaging Protocols: This would further lead to inconsistency in feature extraction due to differences in resolution, slice thickness, and different reconstruction algorithms; thus, the models may predict variably. These limitations could have been mitigated if standardization of imaging protocols across all institutions was considered, or, even further still, with a simulation of variability in training data by data augmentation.
Table 10 provides an overview of the impact of imaging variability on feature extraction and model performance.

Feature Robustness and Reproducibility

However, despite being identified as significant features for lung cancer detection, the features related to GLCM Entropy and shape compactness have a limitation in their robustness across different conditions of imaging and cohorts. Certain features may give way to sensitivity in changes in the parameters of imaging, which affects their reproducibility. This becomes a critical concern for clinical implementation, where there is a dire need for the same and reliable feature extraction to instill confidence in diagnostic tools driven by AI. Intrinsic image noise, acquisition parameters, and the segmentation process itself facilitate feature reproducibility. Their clinical utility can come only with a guarantee of feature robustness across multiple datasets and different conditions of imaging.

Model Interpretability and Clinical Integration

Another limitation is that the interpretability of the machine learning models is difficult. While SHAP analysis gave some insight into feature importance, many deep learning models are complex and hard to interpret; sometimes these blur the reasons as to why exactly a certain prediction was made. Clinicians are very cautious about trusting models not capable of giving or providing transparency to the rationale behind a prediction, especially in a high-stakes disease diagnosis such as cancer. Although radiomic models effectively improve the diagnostic performance of several conditions, translation into routine clinical practice remains challenging. Models have to be not only accurate but also interpretable, explainable, and easy to integrate into existing workflows.
Figure 8 presents the potential trade-offs between model interpretability and diagnostic performance, illustrating the need for balance in clinical applications. As model complexity increases, diagnostic performance improves (blue line), while interpretability decreases (green dashed line).
The above graph demonstrates that while more complex models (e.g., deep learning) may offer higher accuracy, they often suffer from reduced interpretability, which is a crucial factor for clinical adoption.

4.4.2. Future Directions

Therefore, although there were several limitations, a number of promising future research directions could be proposed based on these challenges, which were identified in this study to further improve the utility of radiomic-based models in the detection of lung cancer. Though the present study is on DenseNet and XGBoost is used to study the diagnostic capability, the prognosis and prediction capability of an investigation can be suitable aims in further research studies. The radiomic feature shows promising features for other studies for the prognostics or prediction of the patients in order to help for a proper treatment approach toward individual survival, and it allows customized medical therapy. Integration of clinical and genomic data with radiomic descriptors might enable future models to predict tumor aggressiveness, survival rates, and response to therapies like chemotherapy or immunotherapy. This would be an advance in making the clinically relevant and useful role of radiomic-driven AI models a reality.

Standardization of Imaging Protocols

It is again a problem of imaging variability, and the future development of standardized imaging protocols will be in order to tackle this issue. Standardization of acquisition parameters concerning slice thickness and reconstruction algorithms will improve the reproducibility of features. Further, preprocessing techniques capable of harmonizing the images coming from different scanners will also minimize the variability in the features extracted.

Feature Robustness Across Diverse Cohorts

This will, in the future, require additional studies to better establish feature robustness within larger and more diversified cohorts. This can help confirm if the feature ranked as most informative to lung cancer diagnosis generalizes to the broader population. Also, investigating transfer learning techniques could make models trained on one dataset adapt to other datasets with minimal retraining, which is an important feature of generalizability. Multicenter validation: large multicenter studies with heterogeneous patient groups and different imaging protocols are in process to ensure the generalization of features and the model’s performance across multiple healthcare systems.

Development of Explainable AI (XAI) Models

One key future direction is to improve the interpretability of AI-driven diagnostic models. While the SHAP values provide certain explanations, advanced XAI techniques are needed that can further elaborate on deep learning models. The development of XAI methods explaining feature interactions and their contributions toward model predictions will be crucial for increased trust by clinicians in AI systems [28].
Another promising direction is toward the development of hybrid models that will combine the interpretability of traditional machine learning algorithms, such as decision trees, with the predictiveness of deep learning. These models could provide the best of both high accuracy and explainability. While SHAP analysis offers some insights into feature importance, more advanced explainable AI methods can be used to improve model transparency. The following Table 11 outlines the potential XAI techniques and their applicability to radiomic-based lung cancer detection models.

Integration with Genomic and Clinical Data

Further research points of interest include integrating feature findings with genomic and clinical data, which will enable the development of more comprehensive and personalized diagnostic models. Radiogenomics, a mix of radiomics and genomics, might provide even deeper insights into lung cancer biologic mechanisms and improve the accuracy of prediction models. With the correlation of features to genetic mutations, future studies using such models may not only predict the presence of lung cancer but also tumor aggressiveness, treatment response, and patient prognosis. This will give more clinical value to the radiomic models and further insight into a patient’s cancer as a whole [32].

Reproducibility and FAIR Principles

This study aligns with the FAIR (Findability, Accessibility, Interoperability, and Reusability) principles to ensure transparency and reproducibility. Links to publicly available datasets are provided, and details of the tools, methods, and preprocessing workflows are documented. A dedicated GitHub repository has also been created to enhance accessibility and facilitate future updates with detailed code and documentation (further details about the datasets, tools, and workflows can be found in the following GitHub repository: https://github.com/sotraptis/Radiomics-LungCancer-Detection, accessed on 12 October 2024).

5. Conclusions

This is critical work that forms the foundations of radiomic studies in the automated detection of lung cancer, in addition to strong evidence for clinical utility toward improving diagnostic accuracy and interpretability. We adopted a systematic approach to feature selection of texture, shape, and intensity features and built machine learning models that achieved high accuracy with comprehensible predictions. GLCM Entropy, shape compactness, and surface-area-to-volume ratio were the most diagnostically important features in this article and selected for their ability in modeling the nature of a lung tumor effectively at each disease stage. It has, therefore, set the stage for wider applications of non-invasive diagnostic approaches over several cancers. Reliability in selecting features and embedding machine learning models into the clinic will establish a framework to which this research contributes regarding the transformation of cancer diagnosis from being invasive to imaging-based and data-driven solutions.

Author Contributions

Conceptualization, S.R., C.I. and K.T.; methodology, S.R., C.I. and K.T.; software, S.R. and C.I.; validation, S.R., C.I. and K.T.; formal analysis, S.R., C.I. and K.T.; investigation, S.R., C.I. and K.T.; resources, S.R., C.I. and K.T.; data curation, S.R., C.I. and K.T.; writing—original draft preparation, S.R., C.I. and K.T.; writing—review and editing, S.R., C.I. and K.T.; visualization, S.R., C.I. and K.T.; supervision, S.R., C.I. and K.T. All authors have read and agreed to the published version of the manuscript.

Funding

This research received no external funding.

Institutional Review Board Statement

Not applicable.

Informed Consent Statement

Not applicable.

Data Availability Statement

NSCLC-Radiomics: https://www.cancerimagingarchive.net/collection/nsclc-radiomics/ (accessed on 12 October 2024). RIDER datasets: https://www.cancerimagingarchive.net/analysis-result/rider-lungct-seg/ (accessed on 12 October 2024). Private clinical data used in this study were provided by our collaborators from the Medical Physics Department, University Hospital, Larissa, Greece. These datasets are not publicly available due to ethical restrictions.

Conflicts of Interest

The authors declare no conflicts of interest.

References

  1. World Health Organization. Available online: https://www.who.int/news-room/fact-sheets/detail/cancer (accessed on 2 October 2024).
  2. Scapicchio, C.; Gabelloni, M.; Barucci, A.; Cioni, D.; Saba, L.; Neri, E. A deep look into radiomics. Radiol. Med. 2021, 126, 1296–1311. [Google Scholar] [CrossRef] [PubMed]
  3. Wu, L.; Lou, X.; Kong, N.; Xu, M.; Gao, C. Can quantitative peritumoral CT radiomics features predict the prognosis of patients with non-small cell lung cancer? A systematic review. Eur. Radiol. 2022, 33, 2105–2117. [Google Scholar] [CrossRef] [PubMed]
  4. Raptis, S.; Ilioudis, C.; Theodorou, K. From pixels to prognosis: Unveiling radiomics models with SHAP and LIME for enhanced interpretability. Biomed. Phys. Eng. Express 2024, 10, 035016. [Google Scholar] [CrossRef] [PubMed]
  5. Marcilio, W.E.; Eler, D.M. From explanations to feature selection: Assessing SHAP values as feature selection mechanism. In Proceedings of the 2020 33rd SIBGRAPI Conference on Graphics, Patterns and Images (SIBGRAPI), Porto de Galinhas, Brazil, 7–10 November 2020; pp. 340–347. [Google Scholar] [CrossRef]
  6. Liu, L.; Chen, X.; Petinrin, O.O.; Zhang, W.; Rahaman, S.; Tang, Z.-R.; Wong, K.-C. Machine Learning Protocols in Early Cancer Detection Based on Liquid Biopsy: A Survey. Life 2021, 11, 638. [Google Scholar] [CrossRef]
  7. Neri, E.; Del Re, M.; Paiar, F.; Erba, P.; Cocuzza, P.; Regge, D.; Danesi, R. Radiomics and liquid biopsy in oncology: The holons of systems medicine. Insights Imaging 2018, 9, 915–924. [Google Scholar] [CrossRef]
  8. Taşcı, E.; Uğur, A. Shape and Texture Based Novel Features for Automated Juxtapleural Nodule Detection in Lung CTs. J. Med. Syst. 2015, 39, 46. [Google Scholar] [CrossRef]
  9. Kalendralis, P.; Shi, Z.; Traverso, A.; Choudhury, A.; Sloep, M.; Zhovannik, I.; Starmans, M.P.; Grittner, D.; Feltens, P.; Monshouwer, R.; et al. FAIR-compliant clinical, radiomics and DICOM metadata of RIDER, interobserver, Lung1 and head-Neck1 TCIA collections. Med. Phys. 2020, 47, 5931–5940. [Google Scholar] [CrossRef]
  10. Wee, L.; Aerts, H.J.; Kalendralis, P.; Dekker, A. Data from NSCLC-Radiomics-Interobserver1. Cancer Imaging Arch. 2019. [Google Scholar] [CrossRef]
  11. ISBI. Available online: https://theibsi.github.io/ (accessed on 2 October 2024).
  12. van Griethuysen, J.J.M.; Fedorov, A.; Parmar, C.; Hosny, A.; Aucoin, N.; Narayan, V.; Beets-Tan, R.G.H.; Fillion-Robin, J.-C.; Pieper, S.; Aerts, H.J.W.L. Computational Radiomics System to Decode the Radiographic Phenotype. Cancer Res. 2017, 77, e104–e107. [Google Scholar] [CrossRef]
  13. Dhawan, A.P. Medical Image Analysis, 2nd ed.; IEEE Press series on biomedical engineering, no. 17; Wiley-IEEE Press: Hoboken, NJ, USA, 2011. [Google Scholar]
  14. Mall, P.K.; Singh, P.K.; Yadav, D. GLCM Based Feature Extraction and Medical X-RAY Image Classification using Machine Learning Techniques. In Proceedings of the 2019 IEEE Conference on Information and Communication Technology, Allahabad, India, 6–8 December 2019; pp. 1–6. [Google Scholar] [CrossRef]
  15. Koo, T.K.; Li, M.Y. A Guideline of Selecting and Reporting Intraclass Correlation Coefficients for Reliability Research. J. Chiropr. Med. 2016, 15, 155–163. [Google Scholar] [CrossRef]
  16. Lambin, P.; Leijenaar, R.T.H.; Deist, T.M.; Peerlings, J.; de Jong, E.E.C.; van Timmeren, J.; Sanduleanu, S.; Larue, R.T.H.M.; Even, A.J.G.; Jochems, A.; et al. Radiomics: The bridge between medical imaging and personalized medicine. Nat. Rev. Clin. Oncol. 2017, 14, 749–762. [Google Scholar] [CrossRef] [PubMed]
  17. Parmar, C.; Leijenaar, R.T.H.; Grossmann, P.; Velazquez, E.R.; Bussink, J.; Rietveld, D.; Rietbergen, M.M.; Haibe-Kains, B.; Lambin, P.; Aerts, H.J. Radiomic feature clusters and Prognostic Signatures specific for Lung and Head & Neck cancer. Sci. Rep. 2015, 5, 11044. [Google Scholar] [CrossRef]
  18. Benesty, J.; Chen, J.; Huang, Y.; Cohen, I. Pearson Correlation Coefficient. In Noise Reduction in Speech Processing; Springer Topics in Signal Processing, 2; Springer: Berlin/Heidelberg, Germany, 2009; pp. 1–4. [Google Scholar] [CrossRef]
  19. Vasquez, M.M.; Hu, C.; Roe, D.J.; Chen, Z.; Halonen, M.; Guerra, S. Least absolute shrinkage and selection operator type methods for the identification of serum biomarkers of overweight and obesity: Simulation and application. BMC Med. Res. Methodol. 2016, 16, 154. [Google Scholar] [CrossRef] [PubMed]
  20. Chen, X.; Jeong, J.C. Enhanced recursive feature elimination. In Proceedings of the Sixth International Conference on Machine Learning and Applications (ICMLA 2007), Cincinnati, OH, USA, 13–15 December 2007; pp. 429–435. [Google Scholar] [CrossRef]
  21. Nohara, Y.; Matsumoto, K.; Soejima, H.; Nakashima, N. Explanation of machine learning models using shapley additive explanation and application for real data in hospital. Comput. Methods Programs Biomed. 2022, 214, 106584. [Google Scholar] [CrossRef] [PubMed]
  22. Raptis, S.; Softa, V.; Angelidis, G.; Ilioudis, C.; Theodorou, K. Automation Radiomics in Predicting Radiation Pneumonitis (RP). Automation 2023, 4, 191–209. [Google Scholar] [CrossRef]
  23. Guo, W.; Xu, Z.; Zhang, H. Interstitial lung disease classification using improved DenseNet. Multimed. Tools Appl. 2019, 78, 30615–30626. [Google Scholar] [CrossRef]
  24. Iranzad, R.; Liu, X.; Chaovalitwongse, W.A.; Hippe, D.; Wang, S.; Han, J.; Thammasorn, P.; Duan, C.; Zeng, J.; Bowen, S. Gradient boosted trees for spatial data and its application to medical imaging data. IISE Trans. Healthc. Syst. Eng. 2022, 12, 165–179. [Google Scholar] [CrossRef]
  25. Raptis, S.; Tsougos, I.; Theodorou, K.; Ilioudis, C. Harmonizing Radiomics and Interpretable AI: Precision and Transparency in Oncological Prognostication. In Proceedings of the 2024 IEEE International Symposium on Biomedical Imaging (ISBI), Athens, Greece, 27–30 May 2024; pp. 1–4. [Google Scholar] [CrossRef]
  26. Lim, W.; Ridge, C.A.; Nicholson, A.G.; Mirsadraee, S. The 8th lung cancer TNM classification and clinical staging system: Review of the changes and clinical implications. Quant. Imaging Med. Surg. 2018, 8, 709–718. [Google Scholar] [CrossRef]
  27. Demirjian, N.L.; Varghese, B.A.; Cen, S.Y.; Hwang, D.H.; Aron, M.; Siddiqui, I.; Fields, B.K.K.; Lei, X.; Yap, F.Y.; Rivas, M.; et al. CT-based radiomics stratification of tumor grade and TNM stage of clear cell renal cell carcinoma. Eur. Radiol. 2022, 32, 2552–2563. [Google Scholar] [CrossRef]
  28. Dwivedi, R.; Dave, D.; Naik, H.; Singhal, S.; Omer, R.; Patel, P.; Qian, B.; Wen, Z.; Shah, T.; Morgan, G.; et al. Explainable AI (XAI): Core Ideas, Techniques, and Solutions. ACM Comput. Surv. 2023, 55, 1–33. [Google Scholar] [CrossRef]
  29. Marvin, G.; Jjingo, D.; Nakatumba-Nabende, J.; Alam, M.G.R. Local Interpretable Model-Agnostic Explanations for Online Maternal Healthcare. In Proceedings of the 2023 2nd International Conference on Smart Technologies and Systems for Next Generation Computing (ICSTSN), Villupuram, India, 21–22 April 2023; pp. 1–6. [Google Scholar] [CrossRef]
  30. Suara, S.; Jha, A.; Sinha, P.; Sekh, A.A. Is Grad-CAM Explainable in Medical Images? In Computer Vision and Image Processing; Kaur, H., Jakhetiya, V., Goyal, P., Khanna, P., Raman, B., Kumar, S., Eds.; Communications in Computer and Information Science; Springer Nature Switzerland: Cham, Switzerland, 2024; Volume 2009, pp. 124–135. [Google Scholar] [CrossRef]
  31. Kierner, S.; Kucharski, J.; Kierner, Z. Taxonomy of hybrid architectures involving rule-based reasoning and machine learning in clinical decision systems: A scoping review. J. Biomed. Inform. 2023, 144, 104428. [Google Scholar] [CrossRef]
  32. Saxena, S.; Jena, B.; Gupta, N.; Das, S.; Sarmah, D.; Bhattacharya, P.; Nath, T.; Paul, S.; Fouda, M.M.; Kalra, M.; et al. Role of Artificial Intelligence in Radiogenomics for Cancers in the Era of Precision Medicine. Cancers 2022, 14, 2860. [Google Scholar] [CrossRef]
Figure 1. Overview of the radiomics workflow used in this study.
Biomedinformatics 04 00129 g001
Figure 2. Distribution of radiomic feature categories extracted in this study.
Biomedinformatics 04 00129 g002
Figure 3. Distribution of radiomic features based on ICC values.
Biomedinformatics 04 00129 g003
Figure 4. SHAP summary plot illustrating the global impact of selected radiomic features on model predictions.
Biomedinformatics 04 00129 g004
Figure 5. SHAP dependence plot illustrating the influence of First-order Mean Intensity on model predictions.
Biomedinformatics 04 00129 g005
Figure 6. Permutation importance score of radiomic features.
Biomedinformatics 04 00129 g006
Figure 7. SHAP dependence plot showing the effect of GLCM Entropy on model predictions.
Biomedinformatics 04 00129 g007
Figure 8. Trade-offs between model interpretability and diagnostic performance.
Biomedinformatics 04 00129 g008
Table 1. Model performance.
ModelAccuracySensitivitySpecificityAUC-ROCKey Findings
DenseNet-201 (CNN)92.4%91.6%93.2%0.94Combined radiomic feature maps and CT images improved performance. Captured tumor heterogeneity and morphology effectively.
XGBoost (Radiomics)89.7%88.4%90.5%0.90Relied on radiomic features like GLCM Entropy and shape compactness. Strong performance without raw image data.
Table 3. Comparative analysis of feature importance by tumor size.
Tumor SizeDominant FeaturesKey Insights
Small (<2 cm)Texture (GLCM Entropy, GLRLM Short Run Emphasis)Texture features capture subtle heterogeneity, critical for early-stage cancer detection. Shape features are less relevant due to uniform shape.
Medium (2–4 cm)Balanced (Shape Compactness, GLCM Correlation)Both texture and shape features contribute equally. Shape irregularities begin to appear, while texture heterogeneity remains significant.
Large (>4 cm)Shape (Surface-area-to-volume Ratio, Shape Elongation)Shape features dominate, capturing the irregular, invasive morphology of advanced tumors. Texture features still provide insights into heterogeneity.
Table 4. Comparative performance of radiomic features.
Radiomic FeatureMean SHAP Value (DenseNet-201)Mean SHAP Value (XGBoost)Permutation Importance (DenseNet-201)Permutation Importance (XGBoost)
GLCM Entropy0.470.550.630.66
Shape Compactness0.350.410.520.58
Surface-Area-to-Volume Ratio0.290.490.480.60
GLRLM Run Length Non-Uniformity0.420.370.580.54
Table 5. Relevance of shape-based features by tumor stage.
Tumor StageDominant Shape FeaturesKey Insights
Early Stage (I–II)Shape Compactness, ElongationTumors exhibit more regular shapes; shape features less relevant but still important in certain cases.
Late Stage (III–IV)Surface-Area-to-Volume Ratio, Shape Compactness, ElongationTumors show significant morphological irregularities; shape features critical for detecting invasiveness.
Table 6. Model performance before and after feature selection.
ModelAccuracy (Before Feature Selection)Accuracy (After Feature Selection)AUC-ROC (Before Feature Selection)AUC-ROC (After Feature Selection)
DenseNet-201 (CNN)85.7%92.4%0.880.94
XGBoost83.2%89.7%0.840.90
Table 7. Model performance with and without texture features.
ModelAccuracySensitivity (Recall)SpecificityAUC-ROC
DenseNet-201 (with texture)92.4%91.6%93.2%0.94
DenseNet-201 (without texture)85.7%82.3%87.5%0.88
XGBoost (with texture) 89.7%88.4%90.5%0.90
XGBoost (without texture) 83.2%80.6%85.0%0.84
Table 8. Stability of selected radiomic features across different cross-validation folds.
FeatureAverage Rank (Fold 1)Average Rank (Fold 2)Average Rank (Fold 3)Stability
GLCM Entropy111High
Shape Compactness222High
Surface-Area-to-Volume Ratio333High
GLRLM Run Length Non-Uniformity444High
First-Order Mean Intensity555Medium
Table 9. Stability of radiomic features across bootstrapping iterations.
FeatureBootstrap Iteration 1Bootstrap Iteration 2Bootstrap Iteration 3Stability
GLCM Entropy111High
Shape Compactness222High
Surface-Area-to-Volume Ratio333High
GLRLM Run Length Non-Uniformity444High
First-Order Mean Intensity555Medium
Table 10. Impact of imaging variability on radiomic feature extraction and model performance.
Imaging ParameterImpact on Feature ExtractionImpact on Model Performance
Slice ThicknessAffects texture-based feature consistencyReduces model generalizability
Reconstruction AlgorithmAlters intensity and shape featuresIncreases risk of overfitting
Scanner TypeIntroduces variability in intensity valuesDecreases reproducibility
Table 11. Potential XAI techniques for improving model interpretability in radiomic-based lung cancer detection.
XAI TechniqueDescriptionApplicability
SHAP AnalysisExplains feature importance for individual predictionsUseful for feature-level interpretation
Local Interpretable Model-agnostic Explanations (LIME) [29]Explains model predictions in a localized contextHelps in model transparency for clinicians
Grad-CAM [30]Visualizes areas of the image that influence model predictionsSuitable for deep learning interpretability
Decision Trees/Rule-based Models [31]Models that produce rules or trees, offering straightforward interpretabilityMay be used as baseline models for radiomic features, offering clear, interpretable rules, though potentially less accuracy than complex models
Disclaimer/Publisher’s Note: The statements, opinions and data contained in all publications are solely those of the individual author(s) and contributor(s) and not of MDPI and/or the editor(s). MDPI and/or the editor(s) disclaim responsibility for any injury to people or property resulting from any ideas, methods, instructions or products referred to in the content.

