Article

Explainable Machine Learning-Based Approach to Identify People at Risk of Diabetes Using Physical Activity Monitoring

Department of Health Science and Technology, Aalborg University, Selma Lagerløfs Vej 249, 12-02-048, 9260 Aalborg, Denmark
*
Author to whom correspondence should be addressed.
BioMedInformatics 2025, 5(1), 1; https://doi.org/10.3390/biomedinformatics5010001
Submission received: 14 November 2024 / Revised: 17 December 2024 / Accepted: 20 December 2024 / Published: 24 December 2024

Abstract

Objective: This study aimed to investigate the utilization of patterns derived from physical activity monitoring (PAM) for the identification of individuals at risk of type 2 diabetes mellitus (T2DM) through an at-home screening approach employing machine learning techniques. Methods: Data from the 2011–2014 National Health and Nutrition Examination Survey (NHANES) were scrutinized, focusing on the PAM component. The primary objective involved the identification of diabetes, characterized by an HbA1c ≥ 6.5% (48 mmol/mol), while the secondary objective included individuals with prediabetes, defined by an HbA1c ≥ 5.7% (39 mmol/mol). Features derived from PAM, along with age, were utilized as inputs for an XGBoost classification model. SHapley Additive exPlanations (SHAP) was employed to enhance the interpretability of the models. Results: The study included 7532 subjects with both PAM and HbA1c data. The model, which solely included PAM features, had a test dataset ROC-AUC of 0.74 (95% CI = 0.72–0.76). When integrating the PAM features with age, the model’s ROC-AUC increased to 0.79 (95% CI = 0.78–0.80) in the test dataset. When addressing the secondary target of prediabetes, the XGBoost model exhibited a test dataset ROC-AUC of 0.80 [95% CI; 0.79–0.81]. Conclusions: The objective quantification of physical activity through PAM yields valuable information that can be employed in the identification of individuals with undiagnosed diabetes and prediabetes.

Graphical Abstract

1. Introduction

Type 2 diabetes mellitus (T2DM) represents one of the most significant and increasing health problems worldwide, affecting hundreds of millions of individuals [1]. Its long-term complications, such as cardiovascular disease, neuropathy, retinopathy, and nephropathy, place a tremendous burden on both individuals and healthcare systems [2,3,4].
Early diagnosis and intervention are crucial for reducing these complications and improving the overall prognosis of individuals with T2DM [5,6]. While traditional risk assessment and diagnostic methods have been valuable, there is a growing imperative for the development of innovative approaches that enable earlier detection and intervention [7]. In this regard, the application of machine learning and physical activity monitoring represents a promising avenue for identifying individuals at risk of undiagnosed T2DM [8,9,10,11].
Early diagnosis is critical in patients with T2DM due to the nature of the disease in its initial stages. Many individuals remain undiagnosed for several years [12]. The consequence is that by the time T2DM is diagnosed, individuals may already develop complications [13]. The prevention of these complications and the management of T2DM primarily rely on timely diagnosis and the initiation of lifestyle modifications and pharmacological interventions [14].
Machine learning, particularly in the context of healthcare, has emerged as a transformative tool with the potential to revolutionize disease diagnosis and risk assessment [10,11,15]. The integration of machine learning algorithms with vast datasets that include clinical, genetic, and lifestyle information has enabled the development of models that can predict the risk of T2DM and complications more accurately than traditional risk factors alone [16,17,18,19,20,21]. Furthermore, recent advances in wearable technology and the widespread adoption of activity-tracking devices, such as smartphones and watches, have made it possible to monitor an individual’s physical activity patterns continuously [22].
Physical activity (PA), an essential component of lifestyle, has a direct and significant impact on T2DM risk. It has been established that sedentary behavior and inadequate physical activity are closely associated with the development of insulin resistance and subsequent T2DM [23]. The challenge lies in harnessing the data generated by these wearable devices to identify patterns that are indicative of undiagnosed T2DM. The potential advantages of this approach are twofold: first, it can serve as a noninvasive, low-cost, and easily accessible means of identifying individuals at risk, and second, it may enable the detection of T2DM at an earlier stage, thus potentially reducing the long-term complications associated with the disease.
The aim of this study was to explore the notion that patterns in physical activity monitoring, when analyzed with machine learning techniques, could represent a novel approach to identifying individuals at risk of T2DM in a home-based screening approach.
Statement of Significance
ProblemUndiagnosed type 2 diabetes mellitus (T2DM) remains a significant public health issue, often leading to delayed intervention and increased complications.
What is Already KnownPhysical activity is closely linked to T2DM risk, and wearable devices enable continuous activity monitoring. Machine learning has shown potential in leveraging such data for early disease detection, but current models primarily rely on clinical or demographic data and often overlook physical activity patterns.
What This Paper AddsThis study introduces a novel approach by utilizing physical activity monitoring (PAM) data, combined with machine learning techniques, to identify individuals at risk of undiagnosed T2DM and prediabetes. By using features derived from PAM data in combination with age, the study demonstrates improved model performance and offers a noninvasive, low-cost method for diabetes risk screening at home.
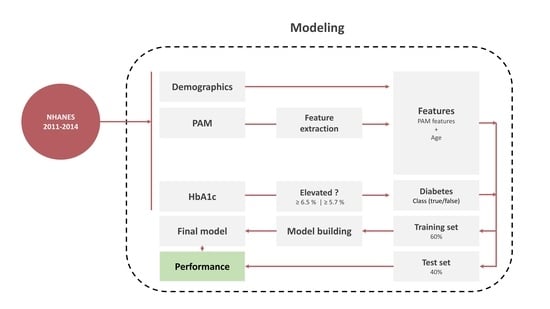
2. Methods

2.1. Data Sources

The purpose of this study was to explore the possibility of identifying undiagnosed diabetes using physical activity patterns in an at-home based screening approach. We analyzed data from the 2011–2014 National Health and Nutrition Examination Survey (NHANES) [24], which included the physical activity monitoring (PAM) component. The data are available at https://wwwn.cdc.gov/nchs/nhanes/ (accessed on 10 April 2024). The NHANES is a large-scale program administered by the National Center for Health Statistics (NCHS), a part of the Centers for Disease Control and Prevention (CDC), aimed at evaluating the health and nutritional status of the U.S. population. The NHANES stands out for its methodology, which integrates interviews, physical exams, and lab tests to collect comprehensive health data. It consists of two main parts: a household interview and an extensive physical exam conducted in a mobile examination center (MEC). The NHANES dataset was selected for its ability to represent the general population due to its sampling design [24], making it well-suited for evaluating the real-world applicability of this screening method.
This study analyzed NHANES participants aged 18 and older who had both physical activity monitor (PAM) data and HbA1c measurements available from the mobile examination center (MEC). Age, a well-established independent risk factor for type 2 diabetes (T2DM) [25], was included as a predictor due to its relevance and ease of availability in home-based screening settings. To align with the study’s focus on an at-home screening approach, additional predictors were excluded from the analysis. Potential predictors such as blood pressure, BMI, waist circumference, diet, and genetics were omitted because they either require specialized measuring equipment or are subject to both measurement uncertainty and/or daily inter-individual variations.

2.2. Physical Activity Monitoring (PAM)

All NHANES participants aged 2 years and older were instructed to wear a physical activity monitor (PAM) for seven consecutive days. The PAM was to be worn starting from the day of their examination at the NHANES mobile examination center (MEC). Participants were asked to wear the device continuously, from midnight on the first day through to midnight on the seventh day, and to remove it on the morning of the ninth day.
To preprocess the data, the device recorded acceleration data along the xyz axes, which was summarized into Monitor-Independent Movement Summary (MIMS) units in hourly intervals [26]. In this analysis, only individuals with a complete seven-day monitoring period were included. Additionally, only hours with a data quality rate exceeding 80% of valid minutes were considered for analysis. The modeling approach used in this study is illustrated in Figure 1.

2.3. Targets

The primary target was the identification of diabetes, defined as an HbA1c level ≥ 6.5% (48 mmol/mol) [27]. The secondary target also included people with prediabetes, defined as those with an HbA1c level ≥ 5.7% (39 mmol/mol).

2.4. Feature Engineering

To comprehensively analyze the PA data obtained from the PAM, we evaluated a range of potential predictors of diabetes. The selection of potential features was guided by an exploratory approach, aiming to capture various aspects of the PAM signal. These predictors encompassed time-domain [28], statistical [29], and waveform shape [30] features. We computed these features using the PAM data from each individual and assessed a total of 22 features for relevance. Specific thresholds for the features were found empirically using the training data and 5-fold cross-validation. The overview of the features with mathematical definition is presented in Table 1.

2.5. Model Development

In this analysis, we evaluated a binary outcome scenario involving the classification of individuals as either having diabetes or not having diabetes. We developed two predictive models using the XGBoost classification algorithm [31] and logistic regression (LR). XGBoost is a machine learning technique recognized for its capability to manage datasets with non-linear dependencies. XGBoost functions by integrating multiple simple predictive models, known as decision trees, to form a powerful ensemble model. It performs well, capturing non-linear relationships, managing imbalanced or missing data, and preventing overfitting, resulting in good predictive accuracy. Its effectiveness in clinical prediction has been demonstrated across various medical domains and applications [32,33,34,35]. LR is a statistical method used for binary classification problems, predicting the probability of an event occurring by modeling the relationship between input features and a target variable through a logistic function. The model assumes a linear relationship between the independent variables and the log-odds of the dependent variable. Studies has shown that the predictive capabilities are often comparable to non-linear models in the medical domains [36].
In search of the best model performance, hyperparameter adjustment of the XGBoost model is necessary. However, this process can be challenging due to the multitude of hyperparameters involved. We used a grid search strategy for hyperparameter optimization [37]. To manage the complexity of the parameter space, we selected a subset of hyperparameter combinations (max_depth:1, 2, 3, 4, 5; gamma: 0.1, 0.2, 0.3, 0.4; learning_rate: 0.01, 0.1, 0.2; n_estimators; 50, 100, 200, 300). Model selection was strictly assessed through a five-fold cross validation approach.
All analyses were performed using MATLAB (R2021b), Python (v3), the scikit-learn library (v0.23.2) for machine learning tasks, and the XGBoost package (v1.7.5). The final model was then evaluated on the test dataset. The essential code and details of all versions can be found in the Supplementary Materials.

2.6. Model Assessment

The receiver operating characteristic (ROC) curve plots the relationship between the True-Positive Rate (TPR) and the False-Positive Rate (FPR) at various thresholds. The Area Under the Curve (AUC) quantifies the overall ability of the model to discriminate between the positive and negative classes. It is calculated as the integral of the ROC curve. The model’s performance was evaluated by examining its discriminative ability, measured by the area under the receiver operating characteristic curve (ROC-AUC), using the test dataset [38].
ROC-AUC confidence intervals (CIs) were calculated using 1000 bootstrap replicates. In this approach, the test dataset was resampled with replacements 1000 times to create multiple bootstrapped datasets, each of the same size as the original dataset. For each bootstrap replicate, the ROC-AUC was calculated, resulting in a distribution of 1000 ROC-AUC values.
From this distribution, the 2.5th and 97.5th percentiles were determined to define the 95% confidence interval for the ROC-AUC. This method provides a robust, non-parametric estimate of uncertainty around the ROC-AUC metric, accommodating potential variability in the sample data.
To visualize the distribution of predicted probabilities for both classes, a normalized frequency plot was generated. To assess the clinical relevance of the model, the relative risk (RR) was calculated across different decision thresholds, ranging from 0% to 100% of patients, with a particular focus on those identified as at-risk (positive predictions). A given proportion, p, of the population was selected based on predicted risk. The predicted group includes the top p % of the population based on risk scores. The non-predicted group includes the remaining (1 − p) % of the population.
R i s k p r e d = N u m b e r   o f   e v e n t s   i n   t o p   p % T o t a l   n u m b e r   o f   i n d i v i d u a l s   i n   t o p   p %
R i s k n o n p r e d = N u m b e r   o f   e v e n t s   i n   b o t t o m   ( 1 p ) % T o t a l   n u m b e r   o f   i n d i v i d u a l s   i n   b o t t o m   ( 1 p ) %
R R = R i s k p r e d R i s k n o n p r e d
Since the cutoff between diabetes and non-diabetes is not strictly deterministic and may include individuals with prediabetes, and to gain deeper insight into the model’s performance and its clinical implications, we analyzed HbA1c levels among both false-positive and true-negative predictions. If physical activity data, such as that collected from smartwatches or smartphones, were used for preliminary diabetes screening, subsequent confirmation would be necessary at a clinical facility. Notably, false-positive individuals with elevated blood glucose levels may be at increased risk of developing diabetes and related comorbidities, making them important candidates for targeted preventive interventions.

2.7. Analyzing Feature Importance and Model Interpretability

Machine learning models like XGBoost pose challenges in terms of interpretability, as their predictions can be difficult to understand. To address this, SHapley Additive exPlanations (SHAP) values [39] offer a valuable method for elucidating the model’s predictions. SHAP values provide a robust framework for explaining the outputs of machine learning models, and are based on Shapley values from cooperative game theory. These values assign an importance score to each feature in a prediction, revealing how much each feature contributes to the final outcome. The SHAP framework was used to evaluate the significance of features in the proposed model, and a box plot was generated to further explore the contribution of individual features.

3. Results

We included 7532 (of 19,931) patients with available PAM and HbA1c data from the NHANES 2011–2014. The median age was 39 years [interquartile range (IQR), 22–57]; the BMI was 26.6 kg/m2 [interquartile range (IQR), 22.8–31.3]; the WC was 93.2 cm [interquartile range (IQR), 81.7–105]; and 51.9% were women. A total of 10.4% had diabetes, defined by the HbA1c criteria. The box plot for all included potential predictors is shown in Figure 2.

3.1. Model Performance

The included subjects were divided into a dataset for training (60%) and a dataset for testing (40%), and the model performance was reported based on the independent test dataset. Including only PAM features, the XGBoost model had an ROC-AUC of 0.74 [95% CI; 0.72–0.76] in the test dataset. Including the PAM features with age, the XGBoost model had an ROC-AUC of 0.79 [95% CI; 0.78–0.80] in the test dataset. The hyperparameter tuning using the training set and cross-validation provided the final hyperparameters (max_depth: 2; gamma: 0.1; learning_rate: 0.1; n_estimators: 50). Including only PAM features, the LR model had an ROC-AUC of 0.72 [95% CI; 0.69–0.74] in the test dataset. Including the PAM features with age, the LR model had an ROC-AUC of 0.77 [95% CI; 0.75–0.78] in the test dataset.
Figure 3 presents the normalized predicted probabilities for diabetes versus no diabetes (upper left). The distributions reveal a discernible difference between the two groups. The analysis (lower right) further demonstrates that false-positive patients exhibited higher HbA1c levels compared to true-negative patients, regardless of the selected decision boundary or the percentage of patients identified as at risk. This points toward false-positive cases that could also be a target of clinical interest. The RRs associated with the patients at risk are illustrated in Figure 3 (lower left). This analysis shows that the RRs of having undiagnosed diabetes in the model-predicted group is substantially increased for up to 20% of the samples’ predicted values.
The results for the secondary targets, including prediabetes, are presented in the Supplementary Material Figures S1 and S2.
Including only PAM features, the XGBoost model had an ROC-AUC of 0.71 [95% CI; 0.69–0.72] in the test dataset. Including the PAM features with age, the XGBoost model had an ROC-AUC of 0.80 [95% CI; 0.79–0.81] in the test dataset. Including only PAM features, the LR model had an ROC-AUC of 0.69 [95% CI; 0.68–0.71] in the test dataset. Including the PAM features with age, the LR model had an ROC-AUC of 0.79 [95% CI; 0.78–0.80] in the test dataset.

3.2. Feature Importance

SHAP feature importance analysis revealed that age was the single feature with the highest importance for identifying patients with and without diabetes. Moreover, several PAM features also had a significant impact on the model’s discriminative performance (Figure 4). These findings highlight that the combination with PA patterns provides information on the risk of diabetes. The mean PA measured in the MIMS (Figure 2 and Figure 4) was not a good discriminator in itself; however, PAM features related to PA dynamics and high-intensity activity were shown to contain better discriminative information. Entropy was shown to be the best PAM feature. This analysis suggests that general measures of PA alone may not be sufficient to reliably distinguish between individuals with and without undiagnosed diabetes. Incorporating multiple aspects of PA, such as entropy, variance, mean levels, and peak-to-peak amplitude, could enhance the model’s discriminative ability and improve its effectiveness in identifying individuals at risk.

4. Discussion

Using a cohort representative of the U.S. population, we developed and internally validated machine learning models to predict the risk of dysglycemia. These models leverage objectively measured physical activity data and readily available age information, with an emphasis on investigating a potential at-home screening. The final best model using PAM data was shown to have acceptable discriminative ability (ROC-AUC, 0.74), and the model utilizing both the PAM and age was shown to have good discriminative ability (ROC-AUC, 0.79). The main driver for the prediction models was, not surprisingly, age; however, several PAM features also had a substantial impact on the prediction. The mean physical activity measured via the MIMS did not have good discriminative ability; this finding indicates that the dynamics of PA combined have better discriminative ability between people with and without diabetes.
In comparison between the XGBoost and LR models, the non-linear approach using XGBoost might have a slightly better performance than the linear LR approach. However, further studies are needed to validate these findings.
Our data further demonstrated that, in addition to the binary discriminative capability of the models, false positives within the at-risk groups exhibited higher HbA1c levels than true negatives. This highlights the model’s ability to identify not only individuals with clinically defined diabetes but also those with prediabetes who are at risk of developing diabetes.

4.1. Comparison to Related Work

Eskelund and colleagues [40] demonstrated that insufficient physical activity is linked to insulin resistance and the development of type 2 diabetes mellitus. Notably, the amount of time spent in sedentary or light-intensity activities was not significantly associated with insulin resistance, whereas engaging in physical activities of moderate and vigorous intensity was correlated with insulin resistance [40]. This finding is in line with our findings, indicating that the mean objectively measured PA is not a good discriminator. A review [41] on PA in T2DM patients reported that, irrespective of the method of measurement, the data reported, or the study’s geographical location, adults with T2DM exhibit low levels of physical activity and a high degree of sedentary behavior. Individuals with T2DM are notably less active and more sedentary than individuals without T2DM. Lam et al. [42] investigated the hypothesis that accelerometer trace measures of physical activity can be used as a predictor of T2DM. Lam and colleagues [42] showed that PA patterns measured by an accelerometer improved the model’s performance compared to a model that included sociodemographic, lifestyle, and anthropometric predictors. These findings are in line with the findings of the present research.

4.2. Strengths and Limitations

The NHANES comprises a representative sample of the United States population, which can enhance the applicability of these findings to real-world screening scenarios. However, despite the dataset available from the NHANES 2011–2014, in which a cohort of individuals with T2DM can be identified, discerning differences between those with T2DM and the control group remains a challenge owing to the relatively low prevalence of this disease in the population. This is evident in our study, where the dataset available for training machine learning models was relatively small.
The study defined diabetes using the HbA1c criterion and the absence of a previously reported diabetes diagnosis. Relying solely on a single HbA1c measurement may not be the optimal approach for diagnosing diabetes, as variations can arise from various factors. Our study’s results offer intriguing insights into the potential use of physical activity monitoring (PAM) in diabetes screening or prescreening. Nevertheless, in future studies it is essential to validate these findings in individuals beyond the NHANES 2011–2014 sample, including various regions, cohorts, and other cultures, to ensure their broader applicability. Future studies should incorporate a standardized definition of diabetes, such as requiring two abnormal glucose test results, including HbA1c, to reduce the likelihood of false-positive diagnoses. Additionally, the analysis relies on data from wearable activity monitors, which may be influenced by user compliance challenges and potential measurement inaccuracies, particularly for certain types of physical activities [43].

5. Conclusions

We developed and internally validated machine learning models for predicting undiagnosed diabetes. The use of objective physical activity measurements offers valuable insights that can aid in identifying individuals with dysglycemia, including diabetes and prediabetes, using an in-home screening approach. However, further research is necessary to validate these findings across diverse populations, encompassing different regions, cohorts, and cultural contexts, to ensure their generalizability and broader applicability.

Supplementary Materials

The following supporting information can be downloaded at: https://www.mdpi.com/article/10.3390/biomedinformatics5010001/s1, Figure S1: (secondary target). (Upper right plot) shows the receiver operating characteristics curve for the test dataset. (Upper left plot) shows the normalized predicted probabilities for the controls and those with unknown diabetes. (Lower right plot) shows the HbA1c as a function of individuals predicted as at-risk. (Lower left plot) shows the RR for the test datasets as a function of individuals predicted as at-risk.; Figure S2: (secondary target). Mean Absolute SHAP value bar plot, illustrating the features with the most importance to the model’s prediction for the secondary target.

Author Contributions

S.L.C. had access to all data analyzed in this study and assumes responsibility for the integrity and accuracy of the data analysis and results. S.L.C., O.H. and C.B. contributed to the study’s design, concept, data analysis, and interpretation. S.L.C. drafted the manuscript and conducted the statistical analysis, while C.B. participated in the critical revision of the manuscript. All authors have read and agreed to the published version of the manuscript.

Funding

This research received no external funding.

Institutional Review Board Statement

The presented study is a reanalysis of existing and anonymized data from NHANES. The presented study in this paper did not need any approval form institutional and/or licensing committee, cf. Danish law on “Bekendtgørelse af lov om videnskabsetisk behandling af sundhedsvidenskabelige forskningsprojekter og sundhedsdatavidenskabelige forskningsprojekter” (Komitéloven, kap. 4, § 14, stk. 3).

Informed Consent Statement

Informed consent was obtained from in the original study (NAHNES) all subjects involved in the study.

Data Availability Statement

The data are available at https://wwwn.cdc.gov/nchs/nhanes (accessed on 13 November 2024).

Conflicts of Interest

The authors declare no conflicts of interest.

Abbreviations

Centers for Disease Control and Prevention (CDC); confidence intervals (CIs); mobile examination center (MEC); National Health and Nutrition Examination Survey (NHANES); area under the receiver operating characteristic curve (ROC-AUC); physical activity (PA); physical activity monitor (PAM); physical activity monitoring (PAM); SHapley Additive exPlanations (SHAP); relative risk (RR); type 2 diabetes mellitus (T2DM).

References

  1. Ong, K.L.; Stafford, L.K.; McLaughlin, S.A.; Boyko, E.J.; Vollset, S.E.; Smith, A.E.; Dalton, B.E.; Duprey, J.; Cruz, J.A.; Hagins, H.; et al. Global, regional, and national burden of diabetes from 1990 to 2021, with projections of prevalence to 2050: A systematic analysis for the Global Burden of Disease Study 2021. Lancet 2023, 402, 203–234. [Google Scholar] [CrossRef] [PubMed]
  2. Eppens, M.C.; Craig, M.E.; Cusumano, J.; Hing, S.; Chan, A.K.; Howard, N.J.; Silink, M.; Donaghue, K.C. Prevalence of Diabetes Complications in Adolescents with Type 2 Compared with Type 1 Diabetes. Diabetes Care 2006, 29, 1300–1306. [Google Scholar] [CrossRef]
  3. TODAY Study Group. Long-Term Complications in Youth-Onset Type 2 Diabetes. N. Engl. J. Med. 2021, 385, 416–426. [Google Scholar] [CrossRef]
  4. Tancredi, M.; Rosengren, A.; Svensson, A.M.; Kosiborod, M.; Pivodic, A.; Gudbjörnsdottir, S.; Wedel, H.; Clements, M.; Dahlqvist, S.; Lind, M. Excess Mortality among Persons with Type 2 Diabetes. N. Engl. J. Med. 2015, 373, 1720–1732. [Google Scholar] [CrossRef]
  5. Turner, R. Intensive blood-glucose control with sulphonylureas or insulin compared with conventional treatment and risk of complications in patients with type 2 diabetes (UKPDS 33). Lancet 1998, 352, 837–853. [Google Scholar] [CrossRef]
  6. Holman, R.R.; Paul, S.K.; Bethel, M.A.; Matthews, D.R.; Neil, H.A.W. 10-Year Follow-up of Intensive Glucose Control in Type 2 Diabetes. N. Engl. J. Med. 2008, 359, 1577–1589. [Google Scholar] [CrossRef]
  7. Selph, S.; Dana, T.; Blazina, I.; Bougatsos, C.; Patel, H.; Chou, R. Screening for Type 2 Diabetes Mellitus: A Systematic Review for the U.S. Preventive Services Task Force. Ann. Intern. Med. 2015, 162, 765–776. [Google Scholar] [CrossRef]
  8. Cichosz, S.L.; Fleischer, J.; Hoeyem, P.; Laugesen, E.; Poulsen, P.L.; Christiansen, J.S.; Ejskjær, N.; Hansen, T.K. Objective measurements of activity patterns in people with newly diagnosed Type 2 diabetes demonstrate a sedentary lifestyle. Diabet. Med. 2013, 30, 1063–1066. [Google Scholar] [CrossRef]
  9. Whelan, M.E.; Orme, M.W.; Kingsnorth, A.P.; Sherar, L.B.; Denton, F.L.; Esliger, D.W. Examining the use of glucose and physical activity self-monitoring technologies in individuals at moderate to high risk of developing type 2 diabetes: Randomized trial. JMIR mHealth uHealth 2019, 7, e14195. [Google Scholar] [CrossRef]
  10. Sidey-Gibbons, J.A.M.; Sidey-Gibbons, C.J. Machine learning in medicine: A practical introduction. BMC Med. Res. Methodol. 2019, 19, 64. [Google Scholar] [CrossRef]
  11. Bzdok, D.; Altman, N.; Krzywinski, M. Statistics versus machine learning. Nat. Methods 2018, 15, 233–234. [Google Scholar] [CrossRef] [PubMed]
  12. Demmer, R.T.; Zuk, A.M.; Rosenbaum, M.; Desvarieux, M. Prevalence of Diagnosed and Undiagnosed Type 2 Diabetes Mellitus Among US Adolescents: Results from the Continuous NHANES, 1999–2010. Am. J. Epidemiol. 2013, 178, 1106–1113. [Google Scholar] [CrossRef] [PubMed]
  13. Zoungas, S.; Woodward, M.; Li, Q.; Cooper, M.E.; Hamet, P.; Harrap, S.; Heller, S.; Marre, M.; Patel, A.; Poulter, N.; et al. Impact of age, age at diagnosis and duration of diabetes on the risk of macrovascular and microvascular complications and death in type 2 diabetes. Diabetologia 2014, 57, 2465–2474. [Google Scholar] [CrossRef] [PubMed]
  14. Herman, W.H.; Ye, W.; Griffin, S.J.; Simmons, R.K.; Davies, M.J.; Khunti, K.; Rutten, G.E.; Sandbaek, A.; Lauritzen, T.; Borch-Johnsen, K.; et al. Early detection and treatment of type 2 diabetes reduce cardiovascular morbidity and mortality: A simulation of the results of the Anglo-Danish-Dutch study of intensive treatment in people with screen-detected diabetes in primary care (ADDITION-Europe). Diabetes Care 2015, 38, 1449–1455. [Google Scholar] [CrossRef]
  15. Cichosz, S.L.; Jensen, M.H.; Olesen, S.S. Development and Validation of a Machine Learning Model to Predict Weekly Risk of Hypoglycemia in Patients with Type 1 Diabetes Based on Continuous Glucose Monitoring. Diabetes Technol. Ther. 2024, 26, 457–466. [Google Scholar] [CrossRef]
  16. Cichosz, S.L.; Hejlesen, O. Classification of Gastroparesis from Glycemic Variability in Type 1 Diabetes: A Proof-of-Concept Study. J. Diabetes Sci. Technol. 2022, 16, 1190–1195. [Google Scholar] [CrossRef]
  17. Cichosz, S.L.; Kronborg, T.; Jensen, M.H.; Hejlesen, O. Penalty weighted glucose prediction models could lead to better clinically usage. Comput. Biol. Med. 2021, 138, 104865. [Google Scholar] [CrossRef]
  18. Fregoso-Aparicio, L.; Noguez, J.; Montesinos, L.; García-García, J.A. Machine learning and deep learning predictive models for type 2 diabetes: A systematic review. Diabetol. Metab. Syndr. 2021, 13, 148. [Google Scholar] [CrossRef]
  19. Sambyal, N.; Saini, P.; Syal, R. A Review of Statistical and Machine Learning Techniques for Microvascular Complications in Type 2 Diabetes. Curr. Diabetes Rev. 2020, 17, 143–155. [Google Scholar] [CrossRef]
  20. Tigga, N.P.; Garg, S. Prediction of Type 2 Diabetes using Machine Learning Classification Methods. Procedia Comput. Sci. 2020, 167, 706–716. [Google Scholar] [CrossRef]
  21. Cichosz, S.L.; Lundby-Christensen, L.; Johansen, M.D.; Tarnow, L.; Almdal, T.P.; Hejlesen, O.K.; The, C.I.M.T. Trial Group. Prediction of excessive weight gain in insulin treated patients with type 2 diabetes. J. Diabetes 2016, 9, 325–331. [Google Scholar] [CrossRef] [PubMed]
  22. Bölen, M.C. From traditional wristwatch to smartwatch: Understanding the relationship between innovation attributes, switching costs and consumers’ switching intention. Technol. Soc. 2020, 63, 101439. [Google Scholar] [CrossRef]
  23. Weinstein, A.R.; Sesso, H.D.; Lee, I.M.; Cook, N.R.; Manson, J.E.; Buring, J.E.; Gaziano, J.M. Relationship of Physical Activity vs Body Mass Index with Type 2 Diabetes in Women. JAMA 2004, 292, 1188–1194. [Google Scholar] [CrossRef] [PubMed]
  24. Chen, T.C.; Parker, J.D.; Clark, J.; Shin, H.C.; Rammon, J.R.; Burt, V.L. National Health and Nutrition Examination Survey: Estimation procedures, 2011–2014. Vital Health Stat 2018, 177, 1–26. [Google Scholar]
  25. Haffner, S.M. Epidemiology of Type 2 Diabetes: Risk Factors. Diabetes Care 1998, 21, C3–C6. [Google Scholar] [CrossRef]
  26. John, D.; Tang, Q.; Albinali, F.; Intille, S. An Open-Source Monitor-Independent Movement Summary for Accelerometer Data Processing. J. Meas. Phys. Behav. 2019, 2, 268–281. [Google Scholar] [CrossRef]
  27. American Diabetes Association Professional Practice Committee. 2. Classification and Diagnosis of Diabetes: Standards of Medical Care in Diabetes—2022. Diabetes Care 2022, 45, S17–S38. [Google Scholar] [CrossRef]
  28. Srinivasan, V.; Eswaran, C.; Sriraam, A.N. Artificial neural network based epileptic detection using time-domain and frequency-domain features. J. Med. Syst. 2005, 29, 647–660. [Google Scholar] [CrossRef]
  29. Hoffmann, R.G. Statistics in the Practice of Medicine. JAMA 1963, 185, 864–873. [Google Scholar] [CrossRef]
  30. Alexakis, C.; Nyongesa, H.O.; Saatchi, R.; Harris, N.D.; Davies, C.; Emery, C.; Ireland, R.H.; Heller, S.R. Feature Extraction and Classification of Electrocardiogram (ECG) signals related to hypoglycaemia. Comput. Cardiol. 2003, 30, 537–540. [Google Scholar] [CrossRef]
  31. Chen, T.; Guestrin, C. XGBoost: A Scalable Tree Boosting System. In Proceedings of the 22nd ACM SIGKDD International Conference on Knowledge Discovery and Data Mining, San Francisco, CA, USA, 13–17 August 2016; pp. 785–794. [Google Scholar] [CrossRef]
  32. Yadaw, A.S.; Li, Y.C.; Bose, S.; Iyengar, R.; Bunyavanich, S.; Pandey, G. Clinical features of COVID-19 mortality: Development and validation of a clinical prediction model. Lancet Digit. Health 2020, 2, e516–e525. [Google Scholar] [CrossRef] [PubMed]
  33. Xu, Y.; Yang, X.; Huang, H.; Peng, C.; Ge, Y.; Wu, H.; Wang, J.; Xiong, G.; Yi, Y. Extreme Gradient Boosting Model Has a Better Performance in Predicting the Risk of 90-Day Readmissions in Patients with Ischaemic Stroke. J. Stroke Cerebrovasc. Dis. 2019, 28, 104441. [Google Scholar] [CrossRef] [PubMed]
  34. Ogunleye, A.; Wang, Q.G. XGBoost Model for Chronic Kidney Disease Diagnosis. IEEE/ACM Trans. Comput. Biol. Bioinform. 2020, 17, 2131–2140. [Google Scholar] [CrossRef] [PubMed]
  35. Cichosz, S.L.; Bender, C. Development of Machine Learning Models for the Identification of Elevated Ketone Bodies During Hyperglycemia in Patients with Type 1 Diabetes. Diabetes Technol. Ther. 2024, 26, 403–410. [Google Scholar] [CrossRef]
  36. Christodoulou, E.; Ma, J.; Collins, G.S.; Steyerberg, E.W.; Verbakel, J.Y.; Van Calster, B. A systematic review shows no performance benefit of machine learning over logistic regression for clinical prediction models. J. Clin. Epidemiol. 2019, 110, 12–22. [Google Scholar] [CrossRef]
  37. Lerman, P.M. Fitting Segmented Regression Models by Grid Search. J. R. Stat. Soc. Ser. C Appl. Stat. 1980, 29, 77–84. [Google Scholar] [CrossRef]
  38. Metz, C.E. Basic principles of ROC analysis. Semin. Nucl. Med. 1978, 8, 283–298. [Google Scholar] [CrossRef]
  39. Lundberg, S.M.; Allen, P.G.; Lee, S.-I. A Unified Approach to Interpreting Model Predictions. arXiv 2017, arXiv:1705.07874. [Google Scholar]
  40. Ekelund, U.; Brage, S.; Griffin, S.J.; Wareham, N.J. Objectively Measured Moderate- and Vigorous-Intensity Physical Activity but Not Sedentary Time Predicts Insulin Resistance in High-Risk Individuals. Diabetes Care 2009, 32, 1081–1086. [Google Scholar] [CrossRef]
  41. Kennerly, A.M.; Kirk, A. Physical activity and sedentary behaviour of adults with type 2 diabetes: A systematic review. Pract. Diabetes 2018, 35, 86–89g. [Google Scholar] [CrossRef]
  42. Lam, B.; Catt, M.; Cassidy, S.; Bacardit, J.; Darke, P.; Butterfield, S.; Alshabrawy, O.; Trenell, M.; Missier, P. Using Wearable Activity Trackers to Predict Type 2 Diabetes: Machine Learning-Based Cross-sectional Study of the UK Biobank Accelerometer Cohort. JMIR Diabetes 2021, 6, e23364. [Google Scholar] [CrossRef]
  43. Butte, N.F.; Ekelund, U.; Westerterp, K.R. Assessing physical activity using wearable monitors: Measures of physical activity. Med. Sci. Sports Exerc. 2012, 44, S5–S12. [Google Scholar] [CrossRef]
Figure 1. An overview of the modeling approach employed in this study. Data were sourced from multiple years of NHANES (2011–2014), focusing on cases where PAM measurements were available. The machine learning workflow begins with splitting the dataset into a training set (Train) and a test set (Test). Features are extracted from the PAM data, and the binary outcome is determined based on HbA1c levels. The training set is used to develop the model by minimizing prediction error. The model’s performance in predicting diabetes risk is evaluated on the test set, considering metrics such as predictive accuracy, uncertainty estimates, interpretability, and the identification of at-risk characteristics.
Biomedinformatics 05 00001 g001
Figure 2. Boxplot for normalized features grouped by undiagnosed diabetes class.
Biomedinformatics 05 00001 g002
Figure 3. Several key plots are displayed: the upper right plot presents the receiver operating characteristic (ROC) curve for the test dataset, while the upper left plot illustrates the normalized predicted probabilities for controls and individuals with unknown diabetes. The lower right plot shows HbA1c levels as a function of individuals predicted to be at risk, and the lower left plot depicts the relative risks (RRs) for the test dataset in relation to the % individuals predicted to be at risk.
Biomedinformatics 05 00001 g003
Figure 4. Bar plot of the mean absolute SHAP values, illustrating the features most important for model prediction.
Biomedinformatics 05 00001 g004
Table 1. The PAM-derived features for input to the models. These predictors encompassed time-domain [28], statistical [29], and waveform shape [30] features.
FeatureExplanationDefinition
Statistical
MeanMean value of the PAM signalμ
VarianceSpread or dispersion of the signalσ2
SkewnessAsymmetry of the signal distribution 1 N i = 1 N x i μ 3 1 N i = 1 N x i μ 2 3 / 2
KurtosisPeakedness of the signal distribution 1 N i = 1 N x i μ 4 1 N i = 1 N x i μ 2 2
Root Mean Square (RMS)Square root of the mean of the squared values of the signal 1 N i = 1 N x i 2
Time Domain
Zero-Crossing RateNumber of times the signal crosses a given threshold i = 1 N 1 x i l i m x i + 1 < l i m N 1
Time AboveFraction of time spent above a given threshold 100 · 1 N i = 1 N 1   0 o t h e r w i s e i f   x i   l i m
Signal EnergySum of squared values of the signal 1 N t = 1 N x i 2
AutocorrelationSimilarity between the signal and its delayed versions R k = 1 n t = 1 N k x t x ¯ x t + k x ¯
EntropySignal’s complexity or uncertainty i = 1 n p i · l o g p i
Waveform Shape
Peak-to-Peak AmplitudeRange (maximum and minimum values of the signal) m a x x m i n x
Crest FactorRatio of the peak value to the RMS value of the signal m a x x r m s x
Slope Sign ChangeNumber of directional changes in the signal t = 1 N 2 s i g n d i f f x i s i g n d i f f x i + 1
Waveform LengthThe total of the absolute differences between each pair of consecutive samples in the signal t = 1 N 1 x i + 1 x i
Disclaimer/Publisher’s Note: The statements, opinions and data contained in all publications are solely those of the individual author(s) and contributor(s) and not of MDPI and/or the editor(s). MDPI and/or the editor(s) disclaim responsibility for any injury to people or property resulting from any ideas, methods, instructions or products referred to in the content.

