1. Introduction
Homozygosity refers to having two identical alleles of a gene inherited from each parent [
1], and due to common ancestry between the parents or due to identity by descent (IBD), it is called autozygosity [
2]. Runs of homozygosity (ROHs) are continuous segments of the genome identical in both copies of a chromosome pair (alleles) ranging from tens of kilobases to megabases [
3]. ROHs can arise from consanguineous marriages (estimated to affect ~10% of people worldwide) [
4], inbreeding [
5,
6], or the founder effect [
7], increasing the risk of recessive diseases in the offspring. ROHs may also be “runs of hemizygosity”, when there is a deletion in one copy of a chromosome, leading to a loss of heterozygosity [
8].
ROH patterns reflect the level of kinship and autozygosity, both reduced by people’s mobility and globalization [
9]. Short ROHs are characteristic of admixed populations resembling ancient parental relatedness, whereas longer ROHs reflect higher consanguinity levels and recent parental relatedness [
10,
11,
12,
13]. ROH patterns reflect population and demographic history [
14,
15], including differences in consanguinity and number of ROHs between ethnic subgroups [
10,
16,
17,
18,
19,
20,
21]. Understanding these patterns in diverse populations is essential for assessing disease risk and identifying disease-causing genetic variants, particularly in admixture isolates [
11,
22,
23,
24].
As consanguinity increases, so does the number and size of ROHs, raising the risk of autosomal recessive (AR) diseases. ROH analysis increases the diagnostic rate of recessive diseases, especially in consanguineous families, for finding candidate genes [
25,
26,
27,
28,
29] and disease-causing homozygous variants [
30] and corroborating the historical context of communities [
31]. Furthermore, it is crucial for identifying candidate genes for specific recessive diseases [
32,
33,
34,
35,
36], even in non-consanguineous families [
37]. Biodemographic and genetic studies provide insights into population structure and its link to diseases by exploring the human genome’s significance in population history and consanguinity practices [
14,
38].
Homozygosity mapping (ROH detection) aids gene discovery by assuming that individuals with AR diseases likely have homozygous markers surrounding the disease
locus, searching for and identifying regions harboring the affected gene. If other relatives also have the disease, the strategy includes identifying ROHs exclusive to affected individuals within the family [
39]. It was first applied in 1987 by Lander and Botstein in consanguineous families affected by a recessive disease using restriction fragment length polymorphisms (RFLPs) [
40]. Homozygosity mapping evolved to utilize Single-Nucleotide Polymorphism (SNP) array data, and with the advent of next-generation sequencing (NGS), software tools were designed to accommodate these sequencing data as input [
39].
The introduction of NGS enables simultaneous homozygosity mapping and variant detection, generating vast data volumes surpassing previous technologies in speed and cost-effectiveness. Since 454 sequencing by Roche, NGS has evolved through second-generation (short-read) and third/fourth-generation (long-read) technologies [
41]. Second-generation sequencing generates short DNA fragments (100–600 bp), with Illumina being widely used for genetic testing [
41,
42]. Third/fourth-generation sequencing achieves reads of over 10 kb, effectively detecting genome-wide repeats and structural variants, suitable for diagnostic and clinical applications [
41,
43]. The two main technologies are provided by Pacific Biosciences (PacBio) [
44] and Oxford Nanopore (ONT) [
45].
NGS applications include single genes, targeted multigene panels, whole-exome sequencing (WES), whole-genome sequencing (WGS), and transcriptomes (RNA sequencing), all effective for genetic testing [
46]. WES, which targets protein-coding exons, where ~85% of the known Mendelian disease variants occur, has become a mainstream approach due to its cost-effectiveness and simplified data management [
47,
48,
49]. WES can be performed individually or in trio (enhanced variant identification) [
50]. Its limitations include sensitivity to GC-rich regions, reliance on Sanger sequencing to confirm low-quality variants, challenges with variants of uncertain significance (VUS), shared homology between genomic regions (segmental duplications/pseudogenes), and failure to genotype highly repetitive regions completely, especially in the presence of large repeats (expansions) [
2,
51,
52].
Reanalyzing genomic data enhances diagnostic rates by uncovering novel gene–disease associations, improving bioinformatics techniques for CNV detection and variant calling, incorporating consanguinity assessment (ROH filter) to narrow down the list of candidate variants, and integrating the Human Phenotype Ontology (HPO) [
51] terms. HPO terms describe human phenotypic information in a standardized way (used for supporting clinical diagnostics and genetic research). Estimating consanguinity through ROH analysis allows for an unbiased determination of parental or ancestral consanguinity, overcoming the limitations of self-reports or inferences based on family context [
52].
Both adapted and new homozygosity mapping tools have emerged, enhancing diagnostic rates by integrating WES data with ROH analysis [
39,
53,
54]. The software can be based on sliding-window or hidden Markov model (HMM) algorithms [
39]. Sliding-window algorithms, originally designed for SNP array data analysis, move a fixed-size window along the chromosome to find stretches of consecutive homozygous SNPs [
39]. PLINK [
39] is widely used on its own [
16,
55,
56,
57,
58,
59,
60,
61,
62,
63,
64,
65], as a complementary analysis [
66], or integrated into other algorithms [
67]. Other software followed, such as Obelisc [
68], GERMLINE [
39], EX-HOM (EXome-HOMozygosity) [
69], and HomozygosityMapper (HM) [
70]. PLINK, GERMLINE and HomozygosityMapper (HM) were subsequently adapted for WES data [
39,
71]. Other software created include HOMWES [
72], GARLIC [
73], HomSI [
39,
74], and Automap [
75].
Hidden Markov models (HMMs) represent observed data as outputs generated by hidden states, modeled as a Markov chain [
76]. In ROH detection, HMMs estimate the likelihood of a genotype (observation) being homozygous or heterozygous (hidden states) [
77]. The software tools available are H
3M
2 [
77,
78]; IBDSeq and GIBDLD [
78]; BEAGLE [
79]; ROHMM and BCFtools/RoH [
77,
80]; and Python packages FILTUS and hapROH [
81,
82,
83]. According to the literature, ROHMM demonstrates higher performance than sliding-window algorithms [
80].
The accuracy of these tools can be influenced by many factors, such as the choice of algorithm used, sample sequencing depth and coverage, SNP density and sequence quality, the need for phased data, loss of short and medium-sized ROHs, and false positives [
39,
82]. These factors should be considered when selecting the appropriate software for a project [
39,
83].
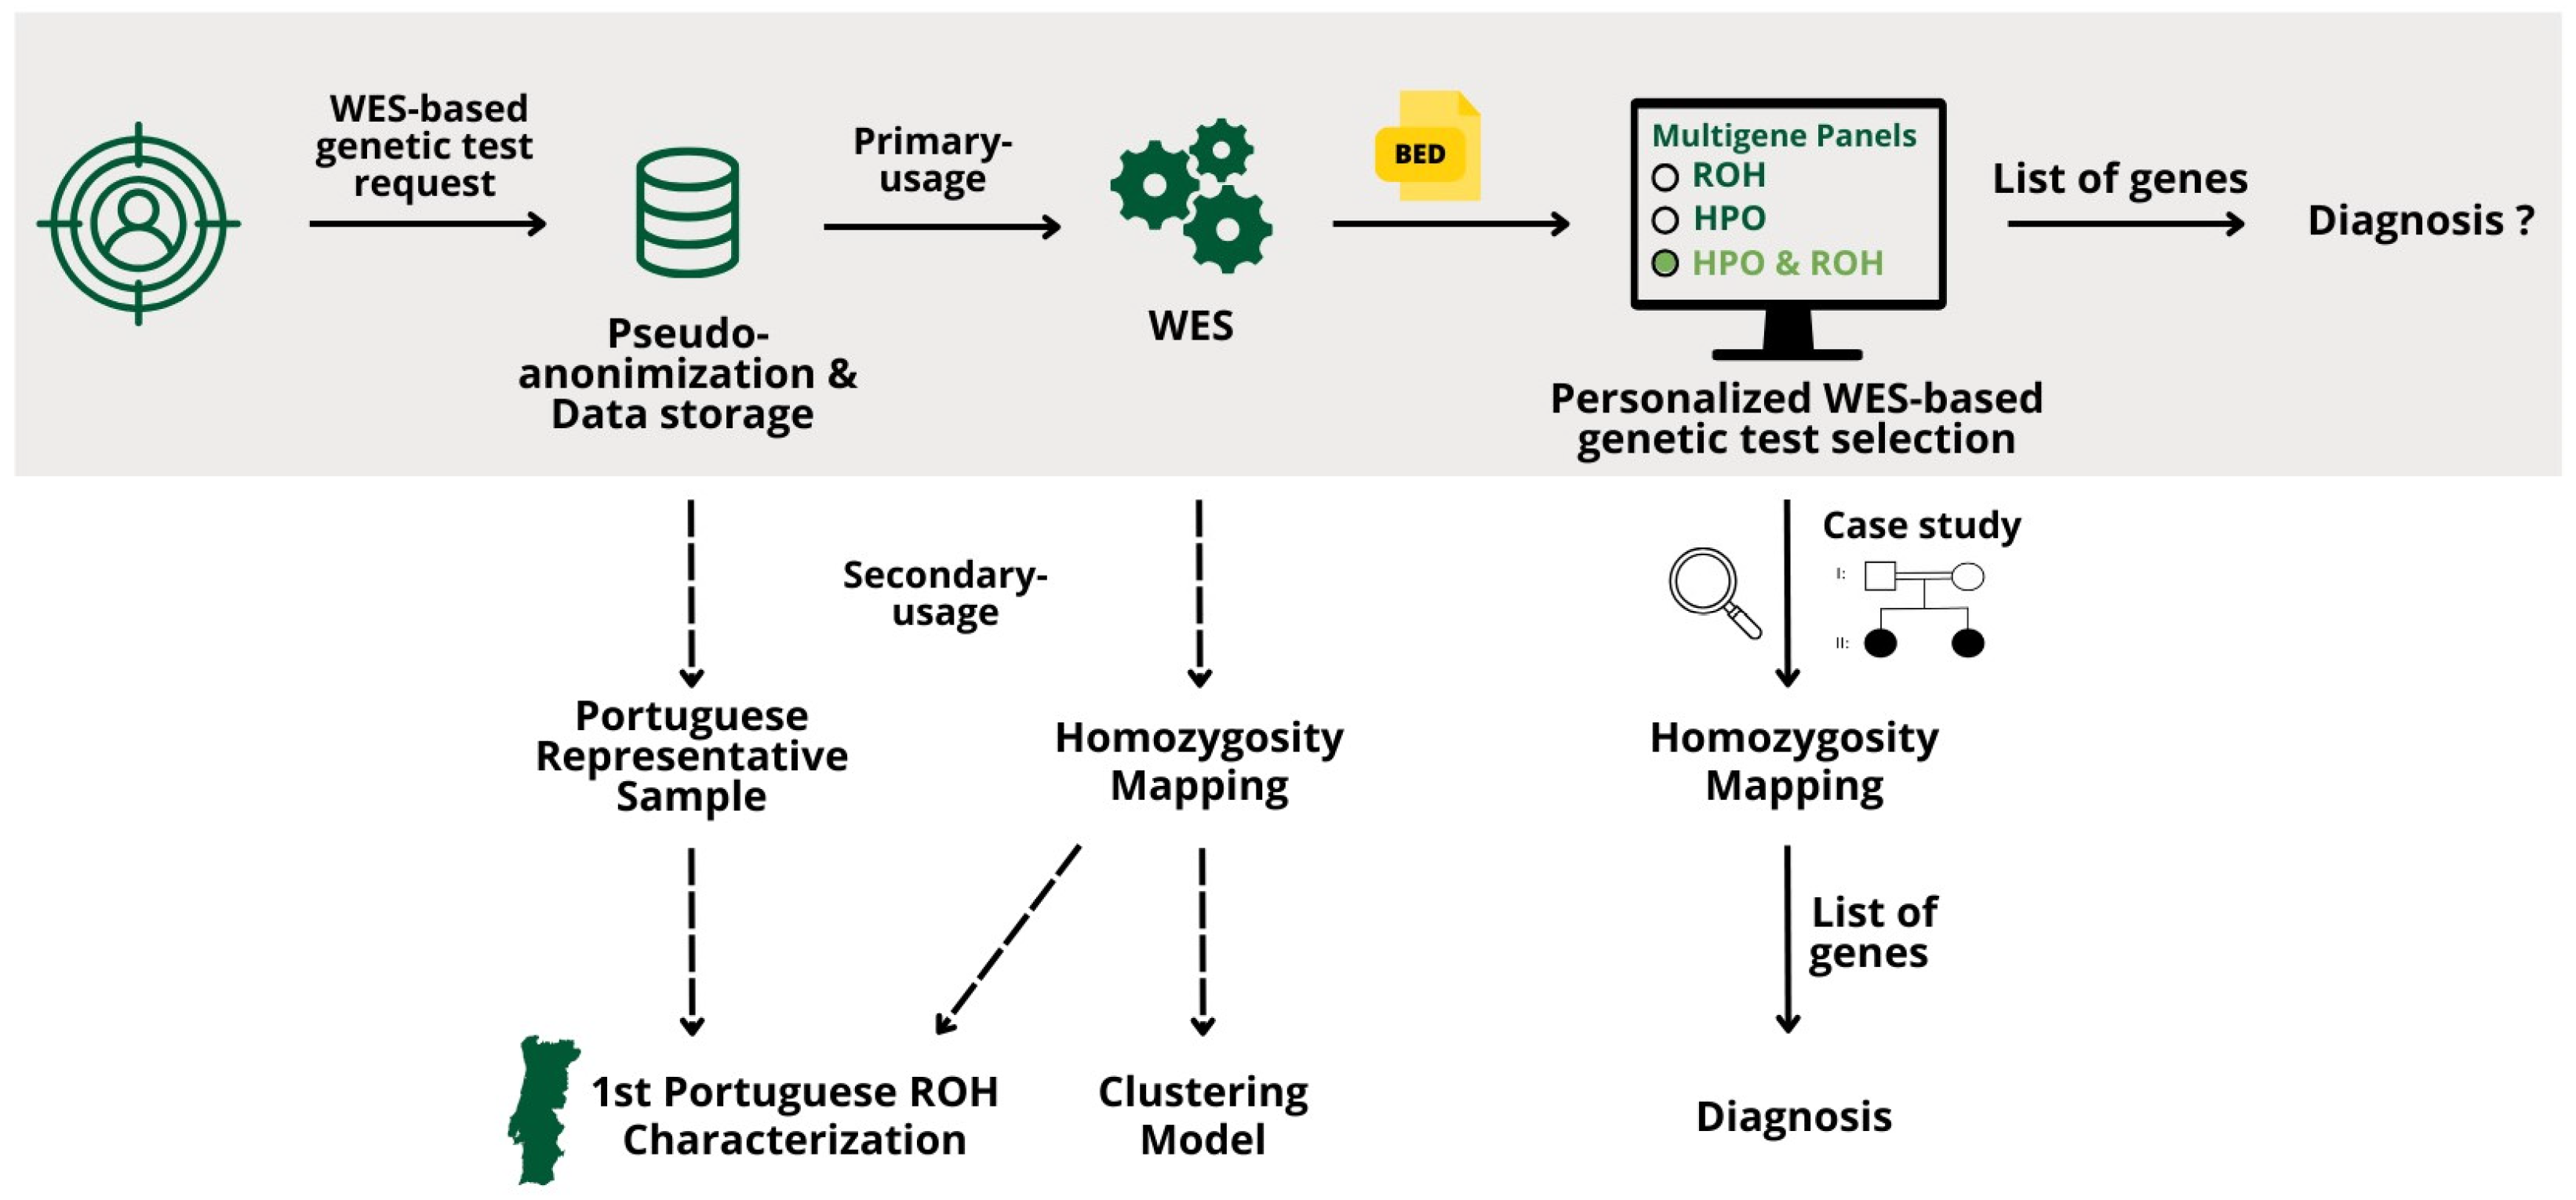
This work presents new bioinformatics approaches to address the creation of personalized multigene panels based on WES data using ROH and/or HPO terms, integrated into a Django Web application. Its impact on diagnostics is illustrated by the genetic characterization of two siblings affected by a recessive disease. Analysis of ROHs at a genomic scale in a representative sample of 3941 patients advances ROH analysis using WES data, highlighting its diagnostic potential and significance in population genetics.
2. Materials and Methods
The dataset used in this work consisted of WES samples from patients who performed genetics tests at the Center for Predictive and Preventive Genetics (CGPP), Portugal.
2.1. Creation of Personalized Multigene Panels Based on ROHs
Multigene panels based on the patient’s ROHs focus on the analysis of regions of the genome more likely to contain recessive disease-causing variants. By targeting genes within these ROHs, the panels are more likely to identify relevant genetic variants, particularly in a consanguinity context or shared ancestry.
The samples used for the creation of these panels were analyzed using two homozygosity mapping algorithms: HomozygosityMapper (HM), which uses a sliding-window algorithm, and ROHMM Command Line Interface (ROHMMCLI), which uses a hidden Markov model (HMM) algorithm. Each patient has a pseudo-anonymized ID without any personal information.
Both algorithms output data in different formats: HM outputs a raw data text file with chromosome, position, and score, while ROHMMCLI outputs a BED file. To generate the Uniform Resource Locator (URL), a connection to the HM database was initiated and the project number (project_no) was retrieved using the patient ID. With the URL generated, the data were collected and saved in a BED file. Then, the HM and ROHMMCLI BED files were merged using a shell script. This script takes the patient ID and the current date as inputs and is divided into four Linux commands, as follows:
Clean up the ROHMMCLI BED file to contain only chromosome and start and end positions.
Merge the HM and the cleaned ROHMMCLI BED files using bedtools merge with option −d of 1,000,000 bp, the maximum distance between ROHs to be merged.
Use bedtools intersect to find overlaps between the merged BED file and the coding sequence coordinate BED file, producing another BED file with the list of gene coordinates found within ROHs.
Create a text file with a list of gene Entrez IDs present in the identified ROHs.
The process of obtaining the gene list is outlined in
Figure 1.
The final step to generate multigene panels consists of comparing the genes’ list with the coverage for the representative transcript of each gene, described in
Figure 3. Genes are divided into three lists based on the percentage of horizontal coverage at 20x: white (≥0.9), grey (0.1–0.9), and black (≤0.1). Only the white and grey genes are included in the multigene panel. Another list, containing the genes that were not assorted to any of the previous lists, is generated.
Copy Number Variations (CNVs), more specifically heterozygous deletions, can mimic ROHs, given that the single-nucleotide variants (SNVs) encompassed by the deletion cannot be heterozygous (and are in fact hemizygous). To incorporate such a possible impact in the multigene panel creation, the following steps were implemented:
Find the CNV results for the sample in analysis and filter by CNVs with a span above 500,000 bp and that are ‘Heterozygous Deletion’, resulting in a BED file with CNV genomic coordinates.
Filter by non-empty files, meaning files that contain CNVs.
The shell script uses bedtools jaccard tool to calculate the Jaccard index for each CNV that intersects an ROH, using the merged ROH results and CNV BED files.
The Jaccard index (Equation (1)) is a single statistic that reflects the similarity of the two BED files based on the intersections between them, where a value of 0.0 indicates no overlap and 1.0 represents complete overlap.
where the
intersection is the difference between the end of the ROH and the start of the CNV; the
ROH length is the difference between the end and start coordinates of the ROH; and the
CNV length is the difference between the end and start coordinates of the CNV.
2.5. Establishing the First Portuguese ROH Characterization on a Genomic Scale
To establish the first Portuguese ROH characterization on a genomic scale, the dataset initially consisted of over 12,000 WES samples. Since there were municipalities that were over-represented, normalization and down-sampling processes were automated. The final number of samples was 3941 WES samples (detailed process in
Supplementary File S1).
The process of establishing the first Portuguese ROH characterization started with the assessment of the ROH levels through the genome-wide autozygosity measure from ROHs (
), calculated using Equation (2).
Here, is the total length of all of an individual’s ROHs above a specified minimum length and is the length of the autosomal genome covered by WES, after removing the telomeres, pericentric regions, and centromeres (which are excluded to prevent overestimating autozygosity).
For each sample, three values were calculated, using three ROH minimum size thresholds to calculate : 0.5, 1.5, and 5 Mb.
The calculation of
involved using the Integrative Genomics Viewer (IGV) to determine the genomic coordinates of the first and last genes on the p and q arms of each chromosome. These coordinates were used to calculate the size of each chromosomal arm using Equation (3):
The sum of both chromosomal arms’ sizes corresponds to the size of the autosome without the centromeres. The value is the total size of all autosomes, calculated as 2638.813981 Mb.
The patients’ address information was obtained from the internal database, consisting of patients’ ID, postcode, municipality, and district names. All patients’ VCF files were previously processed by HM and ROHMMCLI and both results were merged. Homozygosity mapping data were organized into standardized CSV (*.csv) files containing the detailed patient ROH profile (chromosome, ROH’s start and end position, ROH length (bp), ROH length (Mb), and ROH length/chromosome length), and the general patient’s profile (number of ROHs, number of ROHs > 1 Mb, and sum of ROHs (Mb)).
To calculate the FROH, the information needed was combined into separate CSV (*.csv) files:
One containing ROHs > 0.5 Mb;
One containing ROHs > 1.5 Mb;
One containing ROHs > 5 Mb.
Then, the was calculated per patient, grouping the ROHs, from each CSV (*.csv) file and summing its total per patient.
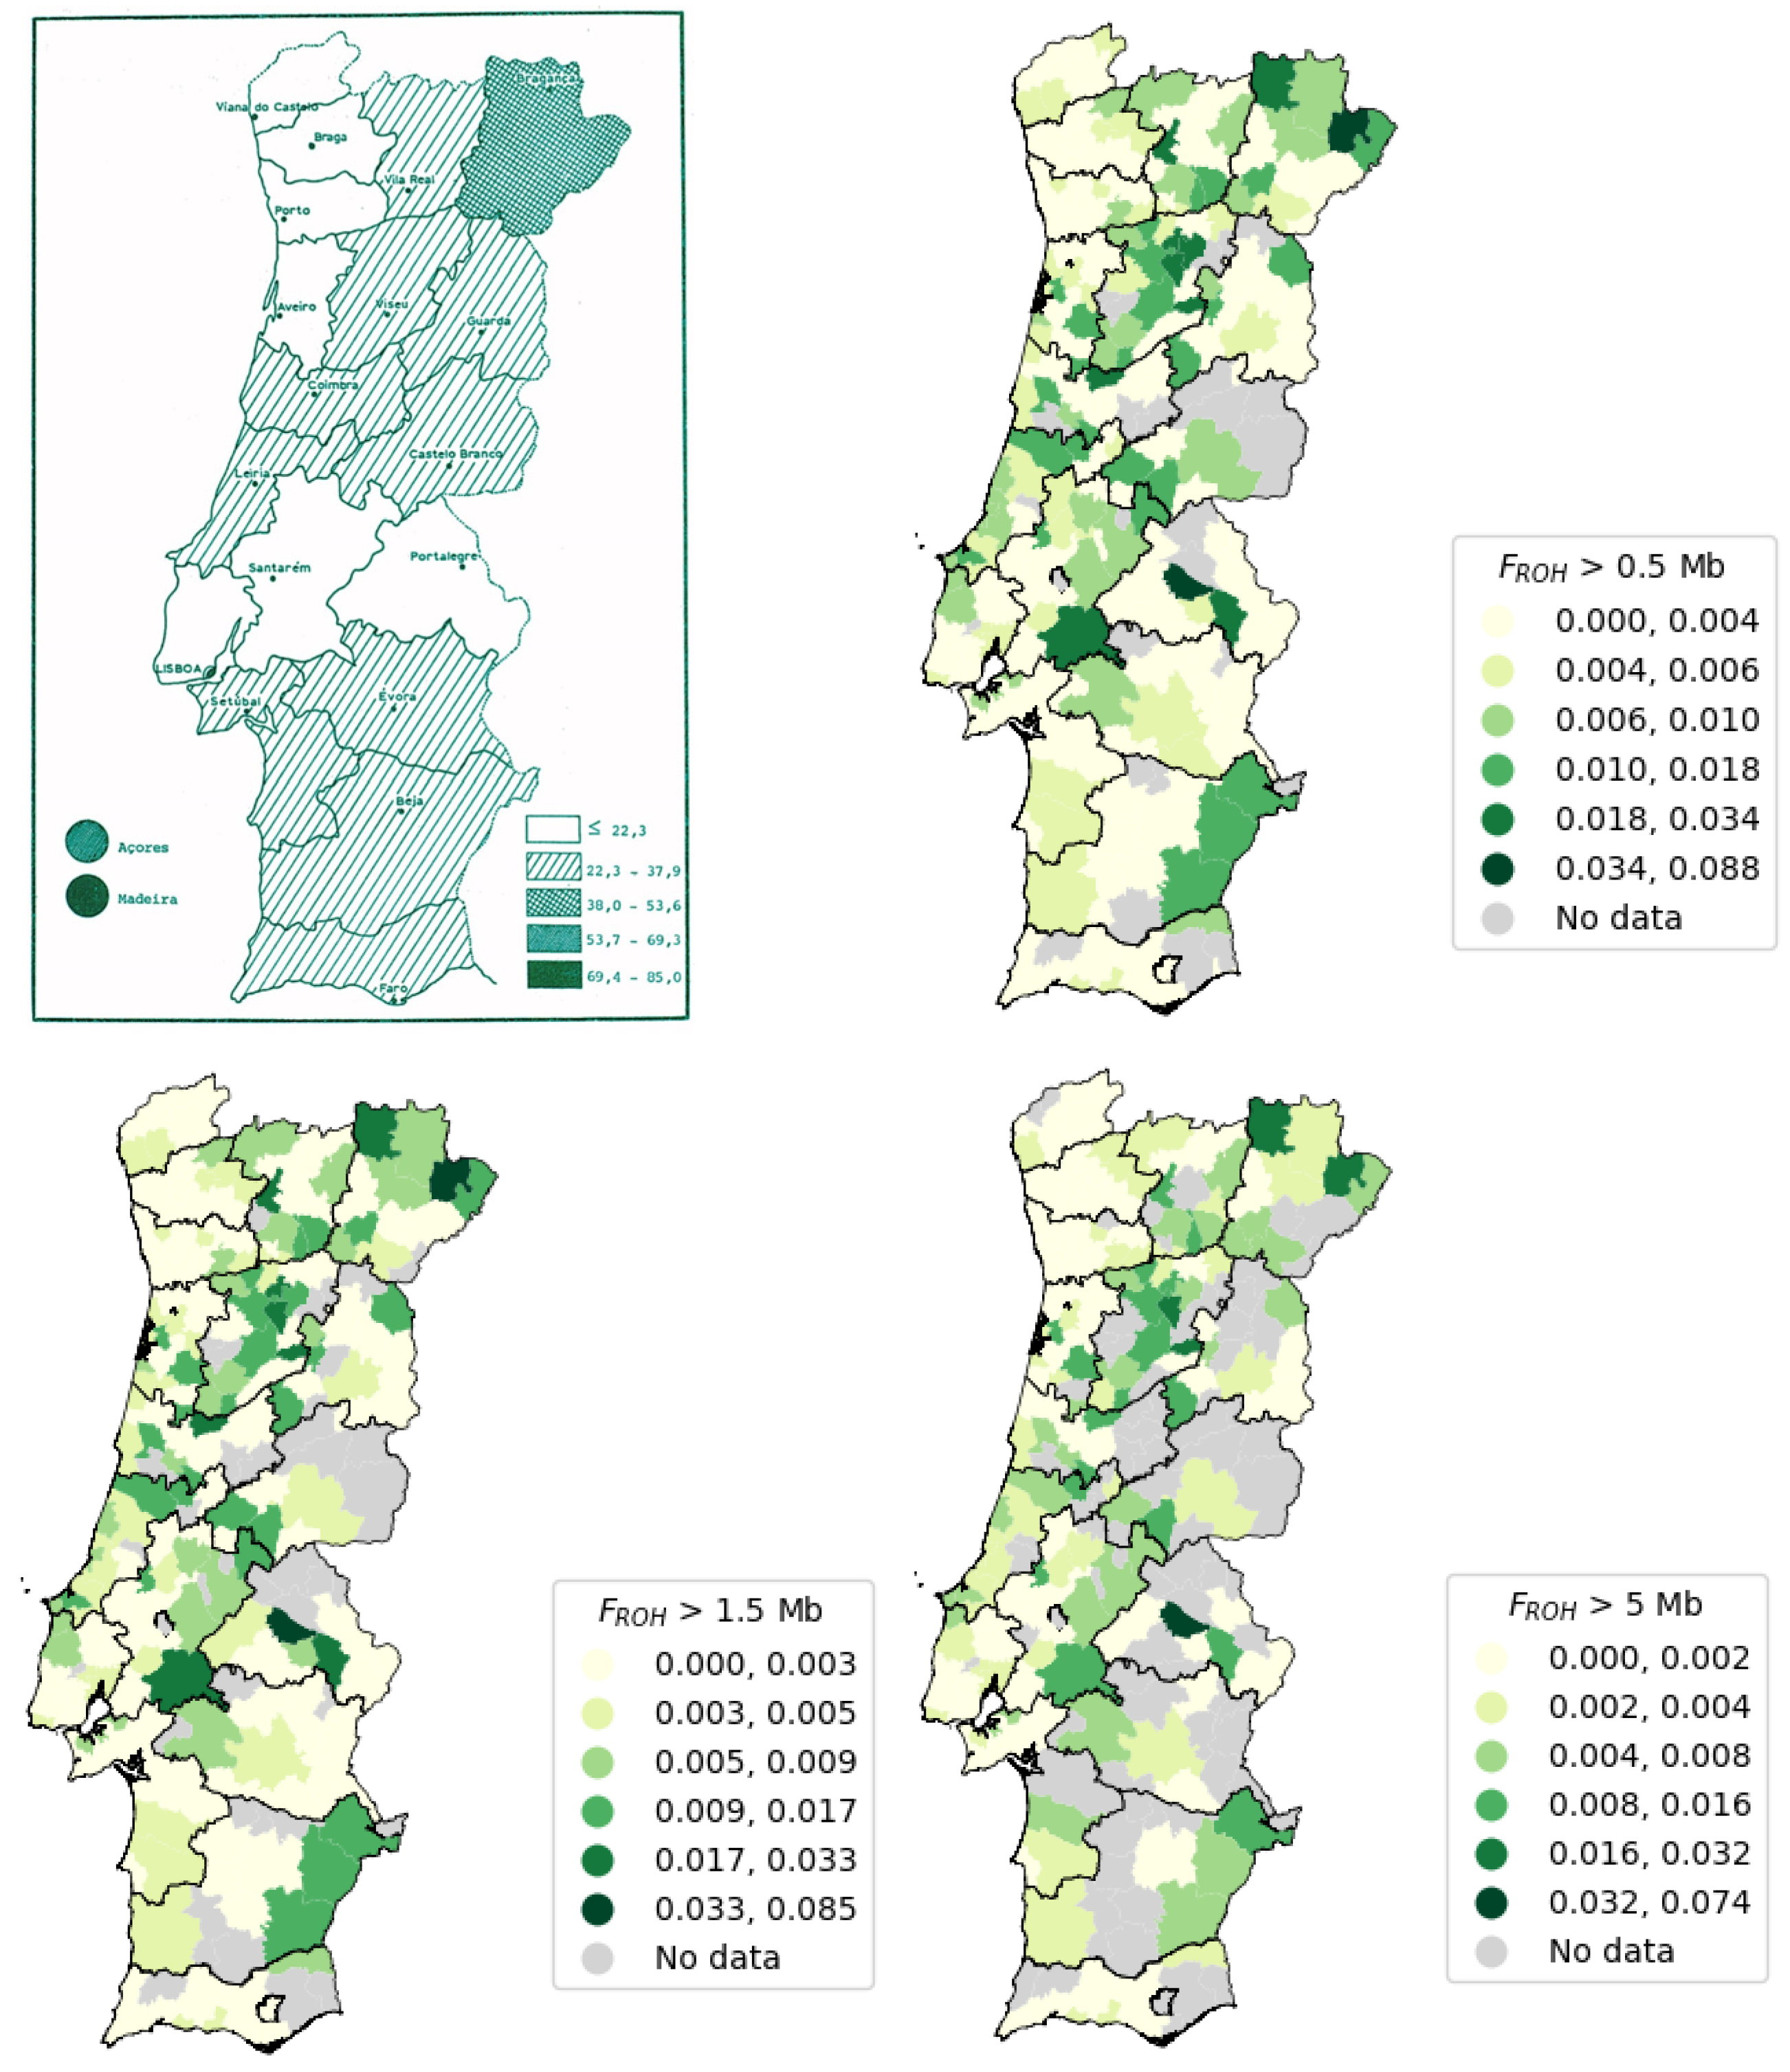
The value of FROH was calculated for each patient using the corresponding value, for each minimum ROH size, resulting in a CSV (*.csv) file containing the patients’ ID and FROH. Portugal comprises 18 districts and 2 Autonomous Regions (Açores and Madeira), divided into a total of 308 municipalities. With this information, and the address information, patients were grouped by municipality, and the mean FROH was calculated (per municipality) and used to create maps of the Portugal Mainland and Autonomous Regions (Açores and Madeira) per municipality.
There were two types of maps, the classical and the interactive ones, created for each FROH mean calculated using minimum ROH sizes of 0.5, 1.5, and 5 Mb.
To create the maps, several data were necessary. The geographical data, at the municipality level (shapefile), were obtained from dados.gov (
https://dados.gov.pt/en/datasets/concelhos-de-portugal/, accessed on 6 June 2023), the Portuguese Public Administration’s open data portal. Then, we established the connection to the internal SQL database to obtain the municipality and respective districts’ association, the CSV (*.csv) files per municipality, and a CSV (*.csv) file containing the number of people per municipality and respective ratio, so that only the municipalities with representativity were used for the maps. For the creation of the maps, since we were dealing with geospatial data, we used the GeoPandas package. The maps created were stored as PNG (*.png) files.
The interactive maps were created using the explore method on a Geodata Frame and were saved as HTML files.
4. Discussion
Clinical diagnostics is evolving towards more personalized approaches, demanding the development of new genetic tests and the adaptation of existing ones. There are platforms created to support virtual gene panel curation, such as Genomics England PanelApp [
91]. This is a database for storing virtual gene panel information while gathering community feedback, helping to build a consensus on the evidence needed to establish a gene–disease association.
With this work, we automated the process of creating personalized multigene panels based on different scenarios. Generically, all panels described in this work are less time-consuming to create, releasing professionals to other tasks to increase the number of tests carried out, and help narrow down the number of genes being analyzed. Since all the described tests are based on WES data, physicians can request a reanalysis of patient data without the need for additional sample sequencing, thereby conserving resources. In terms of storage, one sequencing per patient and a more personalized approach mean less data being analyzed and consequently less allocated space.
Multigene panels based only on the specific ROHs identified in a patient narrow the analysis to genes located within the identified ROHs, thereby increasing the likelihood of detecting recessive disease-causing variants in those genes. Since the CNV assessment was also included in these panels, the diagnostic technician analyzing the case knows where the CNVs overlap with ROHs, eliminating this confounding factor from ROH analysis.
The multigene panels based only on HPO terms take into consideration the possible phenotype or phenotypes that the patient presents. Resorting to a publicly available database, HPO, the panel is built only with the genes that are within the specified terms.
The use of HPO terms and ROH overlap results, simultaneously, is an even more personalized approach, by narrowing down the list of genes to create personalized multigene panels. In this case, only the genes associated with the HPO term(s) in analysis are taken into account and their presence is checked in the patient’s ROHs. This allows a higher level of personalization, proven to be useful in the clinical case of the two sisters previously presented.
After obtaining the gene list from the two sisters’ case, the common genes between the two were analyzed and visualized on IGV. The results were interpreted using the Online Mendelian Inheritance in Man (OMIM) database to find the phenotype associated with the genes. According to OMIM, the CSTB gene is associated with the phenotype “Epilepsy, progressive myoclonic 1A (Unverricht and Lundborg)” (gene MIM number 601,145 and phenotype MIM number 254,800), and the mode of inheritance is AR. This result is in accordance with the analysis performed, since the ROHs are used to target diseases with AR modes of inheritance. The gene SIK1, on the other hand, is associated with the phenotype “Developmental and epileptic encephalopathy 30”, with an autosomal dominant (AD) mode of inheritance. The gene SLC32A1 does not currently have an associated phenotype, but the gene encodes an amino acid transporter that loads gamma-aminobutyric acid (GABA) and glycine to synaptic vesicles. Even though there were no variants present in these genes, the diagnosis of epilepsy was only possible through this multigene panel approach, through the visualization of the biallelic expansion on the CSTB gene.
Knowing our cohort background in terms of ROHs is also important. In our study, we showed the ROH distribution in Portugal (
Figure 10), where most ROHs (9358 ROHs) are within the size range of 0.5 to 1.0 Mb, followed by a decreasing tendency as the length of the ROHs increases until 4.0 Mb. Then, there is a small peak of 708 ROHs in the interval from 4.0 to 5.0 Mb, followed by a decreasing number of ROHs until the interval from 10.0 and 15.0 Mb and another decreasing tendency in the next intervals. The minimum value is 0.5 Mb, the maximum value is 72.42 Mb, and the mean value is 2.29 Mb. This is typical of a more ancient parental relatedness of the overall population.
Using the same sample with the 3941 exomes, and by calculating the F
ROH per individual using the thresholds 0.5, 1.5, and 5 Mb, it was possible to build three maps using the mean value for each municipality. Consequently, we found that the top five districts exhibiting higher F
ROH values were Portalegre, Viseu, Bragança, Madeira, and Vila Real. Furthermore, another notable finding from this study was the striking similarity between the patterns of admixed and consanguinity demographics observed in the Portuguese population when examining the number of ROHs versus the sum of ROHs, available in
Supplementary File S4.
The overall mean value of FROH for the thresholds 0.5, 1.5, and 5 Mb decreased as the minimum threshold increased. There are less samples with ROHs above a certain minimum length, with a smaller number of ROHs but with bigger sizes, per individual. The municipality of Alter do Chão from Portalegre district is the municipality with the highest value of mean FROH for all the presented minimum ROH size thresholds (0.5, 1.5, and 5 Mb), which might indicate more consanguinity.
The disparities observed in the data can derive from various factors, one significant contributor being the sample sizes utilized. In our study, we analyzed a sample of 3941 individuals, with 3769 exhibiting a F
ROH distinct from zero. In contrast, the comparative study only included 49 individuals. Notably, we compared populations from diverse geographic regions: an insular population from the Orkney Isles in northern Scotland [
87] with a comprehensive Portuguese population encompassing individuals from Portugal Mainland as well as the Autonomous Regions of Madeira and the Açores. Another differing factor was the way L
auto was calculated, since the reference study described using the length of the autosomal genome covered by SNPs in an array, excluding the centromeres, and in our study, we used the length of the autosomal genome covered by WES, excluding the centromeres.
According to the results from the study shown in
Figure 14 [
89], the Autonomous Region of Madeira exhibits the highest number of consanguineous marriages, closely followed by the Autonomous Region of the Açores. This observation can be attributed to the isolation of island populations due to limited population mobility during the 1980s. However, improved transportation infrastructure has since increased population mobility to and from the islands. In Portugal Mainland, the district with the highest incidence of consanguineous marriages is Bragança [
89]. Furthermore, the top five districts (as shown in
Table 6) with the highest number of consanguineous marriages, listed in descending order, are Madeira, the Açores, Bragança, Viseu, and Vila Real.
Our findings revealed that the top five districts with the highest FROH mean remain consistent, considering thresholds of 0.5, 1.5, and 5 Mb. The ranking from highest to lowest FROH mean value for 0.5 and 1.5 Mb thresholds is the following: Portalegre, Viseu, Bragança, Madeira, and Vila Real. Meanwhile, the ranking for the 5 Mb threshold is Portalegre, Bragança, Viseu, Madeira, and Vila Real.
Portalegre stands out with the highest FROH mean values across all three thresholds in our data, despite having fewer consanguineous marriages compared to other districts. This might be due to our sample including fewer individuals from Portalegre, which may suggest that those from this region who were referred for genetic testing were more likely to have been screened due to consanguinity. Surprisingly, the results show low FROH values across all three thresholds for the Autonomous Region of the Açores, which are not in accordance with the reference data on consanguineous marriages. This is possibly due to insufficient sample localization. Porto, the district with the lowest number of consanguineous marriages, also shows the lowest FROH mean across all thresholds. Additionally, we were unable to acquire information regarding the country of origin or birth of individuals included in the sample; this parameter was not used as an exclusion criterion. Moving forward, we should take this into consideration because certain countries present higher levels of consanguinity due to religious and cultural practices. We must also acknowledge the potential presence of samples from immigrants residing in our country, which could introduce biases into the data.
The presence of an admixed pattern denotes our country’s history, whilst the consanguineous pattern is a result of the marriages between cousins, leading to an increase in the sum of ROHs.
The data used for this work originated from the genetic testing activities performed at CGPP, thus having a higher likelihood of having individuals with genetic diseases (including autosomal recessive inheritance). To reduce possible biases in our representative sample, during the sample selection process, we prioritized healthy individuals (e.g., healthy parents when analyzing trios). We de-prioritized the number of male samples and excluded pre-natal diagnosis samples and individuals identified as consanguineous in our database. We also restricted our dataset to unrelated individuals (detailed process in
Supplementary File S1).
Having a model to predict patient consanguinity based on ROH features is useful in clinical centers. They can be used for the genetic test decision process and for assessing the risk of recessive diseases, knowing that the presence of consanguinity increases the risk of having recessive genetic diseases. Tier 0 (count and sum of ROHs) of the model presented provided the majority of the predictive power for consanguinity classification (0.94). A test F1-score of 0.96 was achieved with additional features.
Although ROH analysis is a powerful tool for identifying recessive disease-causing variants, its utility may be reduced in patients that are offspring of non-consanguineous parents. These individuals tend to have fewer and smaller ROHs, which may go undetected by some algorithms, thus complicating the identification of pathogenic variants causing recessive diseases. In such cases, smaller ROHs may be mistaken for population genetic artefacts, limiting the diagnostic yield of this approach.
Transitioning from WES to WGS might open some doors in terms of genetic testing, by adding insights into the non-coding regions of the genome. This will be of great interest particularly for undiagnosed patients and accelerate the diagnosis.
With this work, we demonstrated the applicability and utility of the newly developed resources and their impact on diagnostics, by solving the genetic etiology of a rare recessive disease. The representative sample of 3941 WES individuals used in this work allowed us to provide an extensive analysis of ROHs on a genomic scale for the first time ever in the Portuguese population. In summary, this research advances ROH analysis using WES data, highlighting its diagnostic potential and significance in population genetic characterization.


 ,
, 


