Article

Early Breast Cancer Detection Based on Deep Learning: An Ensemble Approach Applied to Mammograms

by
Youness Khourdifi
1,*,
Alae El Alami
2,
Mounia Zaydi
3,
Yassine Maleh
4 and
Omar Er-Remyly
5
1
Laboratory of Materials Science, Mathematics and Environment, Polydisciplinary Faculty, Sultan Moulay Slimane University, Khouribga 25000, Morocco
2
Department of Computer Engineering, Higher School of Technology, University Moulay Ismail, Meknes 50050, Morocco
3
ICL, Junia, Université Catholique de Lille, LITL, 59000 Lille, France
4
LaSTI Laboratity, ENSA Khouribga, Sultan Moulay Slimane University, Khouribga 25000, Morocco
5
MISI Laboratory, Faculty of Sciences and Techniques, Hassan First University of Settat, Settat 26002, Morocco
*
Author to whom correspondence should be addressed.
BioMedInformatics 2024, 4(4), 2338-2373; https://doi.org/10.3390/biomedinformatics4040127
Submission received: 17 November 2024 / Revised: 4 December 2024 / Accepted: 9 December 2024 / Published: 13 December 2024
(This article belongs to the Topic Computational Intelligence and Bioinformatics (CIB))

Abstract

:
Background: Breast cancer is one of the leading causes of death in women, making early detection through mammography crucial for improving survival rates. However, human interpretation of mammograms is often prone to diagnostic errors. This study addresses the challenge of improving the accuracy of breast cancer detection by leveraging advanced machine learning techniques. Methods: We propose an extended ensemble deep learning model that integrates three state-of-the-art convolutional neural network (CNN) architectures: VGG16, DenseNet121, and InceptionV3. The model utilizes multi-scale feature extraction to enhance the detection of both benign and malignant masses in mammograms. This ensemble approach is evaluated on two benchmark datasets: INbreast and CBIS-DDSM. Results: The proposed ensemble model achieved significant performance improvements. On the INbreast dataset, the ensemble model attained an accuracy of 90.1%, recall of 88.3%, and an F1-score of 89.1%. For the CBIS-DDSM dataset, the model reached 89.5% accuracy and 90.2% specificity. The ensemble method outperformed each individual CNN model, reducing both false positives and false negatives, thereby providing more reliable diagnostic results. Conclusions: The ensemble deep learning model demonstrated strong potential as a decision support tool for radiologists, offering more accurate and earlier detection of breast cancer. By leveraging the complementary strengths of multiple CNN architectures, this approach can improve clinical decision making and enhance the accessibility of high-quality breast cancer screening.

1. Introduction

Breast cancer remains the most frequently diagnosed cancer among women and a leading cause of cancer-related deaths worldwide. According to the World Health Organization (WHO) [1], breast cancer accounted for 2.3 million new cases and 685,000 deaths in 2020, making it the most common cancer globally [2]. The burden of this disease is projected to increase significantly, with estimates indicating that over 3 million new cases will be diagnosed annually by 2040, primarily due to population growth and aging [3]. Despite advances in treatment, breast cancer continues to represent the leading cause of cancer-related disability-adjusted life years (DALYs) among women, underlining its devastating impact on individuals and societies. Early detection and timely intervention remain critical to reducing mortality rates and improving patient outcomes.
Breast cancer primarily originates in the cells of the breast and can occur in any woman after puberty, with risk increasing significantly with age. Although certain risk factors, such as family history, hormonal therapies, and excessive alcohol consumption, are associated with higher incidence rates, nearly half of all cases occur in women with no identifiable risk factors beyond age and gender. The two major subtypes of breast cancer, ductal carcinoma in situ (DCIS) [4,5] and invasive ductal carcinoma (IDC) [6,7,8], differ significantly in their behavior and prognosis. DCIS, confined to the ducts, accounts for 20–53% of cases and grows slowly, often having a less severe impact on quality of life. In contrast, IDC, responsible for approximately 80% of diagnoses, is more aggressive, with the potential to invade surrounding tissues and metastasize, making it the more dangerous form. Early and accurate detection of these subtypes is crucial to ensuring effective treatment and improving survival rates [9].
Mammography remains the gold standard for breast cancer screening, but it faces significant challenges. Radiologists miss 10–30% of cancers, particularly in dense breast tissue, and up to 80% of recalls are false positives [10,11]. These errors persist despite technological advancements, often due to human factors in search, perception, and decision making [10]. To address these limitations, new technologies such as tomosynthesis, automated ultrasound, and AI-driven image analysis are being developed [12,13]. However, technology alone cannot solve all issues, and a personalized approach to screening based on individual risk factors and breast density is recommended [12,13]. Additionally, ensuring equitable access to advanced screening technologies is crucial to mitigate disparities in breast cancer detection and outcomes [13]. Ongoing research aims to optimize screening efficacy while reducing overdiagnosis and focusing on clinically significant cancers.
Recent advances in deep learning, particularly convolutional neural networks (CNNs), have shown great potential in revolutionizing breast cancer detection and diagnosis through medical imaging analysis. CNNs can automatically extract features from mammograms, improving sensitivity and specificity in cancer detection compared with traditional computer-aided detection systems [14,15]. These deep learning models have demonstrated the ability to perform at or above human-level performance in various breast imaging tasks, including lesion detection, risk assessment, and image classification [14,16]. However, challenges remain in achieving domain generalization across diverse datasets due to variations in imaging protocols, patient demographics, and breast tissue density [17]. Researchers are exploring techniques such as transfer learning, data augmentation, and multi-view image analysis to improve the robustness and adaptability of these models [18,19]. Further research and prospective trials are needed to validate these tools for real-world clinical use [20].
Ensemble learning has emerged as a promising approach to overcome these limitations by combining the predictions of multiple models. By leveraging the complementary strengths of different CNN architectures, ensemble techniques reduce variance and bias, achieving better generalization across diverse datasets [21]. For instance, architectures such as VGG16, DenseNet121, and InceptionV3 excel in different aspects of image analysis. VGG16 is adept at detecting fine-grained features, DenseNet121 promotes feature reuse and efficient gradient flow, and InceptionV3 captures multi-scale features, making it suitable for detecting lesions of varying sizes and textures [22]. When used in isolation, these architectures often fail to address the full spectrum of diagnostic challenges. Ensemble frameworks that integrate these models provide a balanced solution, enhancing both diagnostic accuracy and robustness.
This study proposes a novel ensemble deep learning model that integrates VGG16 [23], DenseNet121 [24,25], and InceptionV3 [26,27] to improve breast cancer detection from mammographic images. By combining the unique strengths of these architectures, the model achieves a balance between sensitivity and specificity, addressing the limitations of individual CNNs. The proposed model is validated on two benchmark datasets: INbreast and CBIS-DDSM. INbreast is known for its high-resolution mammograms and detailed annotations, while CBIS-DDSM offers a more extensive and diverse dataset, challenging the model to generalize across varied imaging conditions. With accuracy rates of 90.1% on INbreast and 89.5% on CBIS-DDSM, the model demonstrates its potential for robust performance across datasets with differing complexities.
Our contributions are threefold. First, we present a robust ensemble model that integrates the strengths of multiple CNN architectures, addressing the limitations of individual models. Second, we validate the model’s performance on two diverse datasets, providing evidence of its generalizability and practical applicability. Third, we highlight the importance of advanced deep learning techniques in reducing false positives and negatives, ultimately offering a more reliable diagnostic tool for clinical practice.
The remainder of this paper is organized as follows: Section 2 reviews related works, discussing recent advancements in deep learning and ensemble methods for breast cancer detection. Section 3 details the methodology, including datasets, preprocessing techniques, and the design of the ensemble model. Section 4 presents the results, comparing the ensemble model’s performance against individual CNNs. Section 5 discusses the implications of the findings, highlighting the advantages and potential limitations of the proposed approach. Finally, Section 6 concludes the study and outlines future research directions.

2. Related Works

Breast cancer detection has significantly evolved with the advent of advanced imaging technologies and computational methods. Traditional techniques such as mammography [12,28], ultrasound [29,30], and MRI [31,32] remain the primary diagnostic tools due to their ability to identify treatable tumors at early stages. Among these, mammography is widely acknowledged for its effectiveness in early detection, but it suffers from inherent limitations, including human error, variability in diagnostic outcomes, and reduced sensitivity in dense breast tissue [28]. These limitations underscore the need for automated and reliable diagnostic tools.

2.1. Transition to Machine Learning and Deep Learning

The field of breast cancer detection has shifted from traditional machine learning (ML) approaches to deep learning (DL), particularly convolutional neural networks (CNNs). Early ML models such as decision trees, support vector machines (SVMs), and k-nearest neighbors (KNN) achieved moderate success but required manual feature extraction, which limited their applicability to complex medical imaging tasks [33,34]. CNNs have addressed this challenge by automatically learning hierarchical features from raw image data, significantly enhancing sensitivity and specificity [35].
CNN architectures like VGG16, DenseNet121, and InceptionV3 have demonstrated robust performance in breast cancer detection. VGG16 excels at capturing fine-grained details, DenseNet121 promotes efficient feature reuse, and InceptionV3 captures multi-scale features, making it versatile for detecting tumors of varying sizes. However, individual CNNs often struggle with generalization across diverse datasets due to differences in image quality, annotation standards, and class imbalance.

2.2. Emergence of Ensemble Learning

Ensemble learning has become a cornerstone technique in breast cancer detection, addressing the limitations of individual models by combining their outputs to enhance accuracy and robustness. Recent studies demonstrate a wide range of ensemble approaches, leveraging both deep learning and traditional machine learning frameworks.
Chintala et al. [36] introduced an optimized Deep Recurrent Neural Network (DRNN) framework that integrates feature selection and dropout optimization, achieving a high accuracy of 99.16%. Their work highlights the importance of combining robust features and neural optimization techniques to outperform traditional machine learning methods. Munshi et al. [37] proposed a novel ensemble framework combining a custom CNN with Random Forest (RF) and support vector machine (SVM) models. Their method also incorporated Explainable AI (XAI), reaching a remarkable accuracy of 99.99%, showcasing the potential of integrating numerical and image features.
Other studies focused on leveraging multiple CNN architectures. Noor Eldin et al. [38] demonstrated the impact of ensemble learning by combining DenseNet169, ResNet50, and ResNet101 models for biopsy microscopy images, improving classification accuracy to 92.5% with data augmentation. Similarly, Amgad et al. [39] implemented a two-stage ensemble approach using soft voting, weighted voting, and meta-learning to achieve an F1-score of 89.2%, surpassing baseline CNN performance by over 20%. Kumar and Batra [40] applied a soft voting ensemble across seven CNN models, achieving an accuracy of 96.91% on histopathology images, further emphasizing the role of ensemble techniques in boosting classification metrics.
Beyond traditional ensemble frameworks, advanced techniques like BreastNet18, proposed by Montaha et al. [41], used ablation studies and transfer learning to refine VGG16-based architectures, achieving a test accuracy of 98.02%. This approach demonstrates the power of fine-tuned transfer learning when combined with ensemble methods. Al-Haija et al. [42] leveraged ResNet50 for transfer learning and achieved 99% accuracy on the BreakHis dataset, demonstrating the efficacy of combining pre-trained models with ensemble integration.
While ensemble learning methods have demonstrated substantial improvements in breast cancer detection, challenges persist. Many ensemble models rely on basic aggregation techniques such as soft voting or majority voting, which may fail to fully exploit the complementary strengths of the individual models. Advanced integration strategies, including weighted voting, meta-learning, and hybrid models, offer promising alternatives but require careful optimization and significant computational resources.
In parallel, Explainable Artificial Intelligence (XAI) has emerged as a vital component in healthcare AI systems, addressing the need for transparency and interpretability in clinical decision making [43,44]. XAI techniques such as LIME and SHAP provide feature importance and enhance trust in complex machine learning models by offering interpretable insights [43]. These methods have been successfully tailored to medical fields like radiology, pathology, cardiology, and oncology, improving diagnostic accuracy and treatment decisions [44]. However, the adoption of XAI faces challenges, including diverse stakeholder requirements, cognitive barriers, and a perceived trade-off between model accuracy and interpretability [45]. Addressing these issues requires interdisciplinary approaches such as data fusion techniques and user-centric designs for explainability methods [45]. In medical image analysis, XAI approaches can be categorized into explanation methods—text-based, visual-based, and example-based—and technical methods, providing a framework for evaluating and improving interpretability [46]. By integrating advanced ensemble strategies with XAI principles, future systems could achieve both high diagnostic accuracy and clinical transparency, paving the way for more reliable and interpretable AI-driven healthcare solutions.

2.3. Challenges in Dataset Variability and Transfer Learning

Performance discrepancies across datasets like INbreast and CBIS-DDSM highlight challenges in model generalization. INbreast offers high-resolution, well-annotated mammograms, while CBIS-DDSM presents a larger, more heterogeneous dataset with diverse imaging conditions [47]. Data augmentation and transfer learning [48], where pre-trained models like ResNet50 and MobileNet are fine-tuned on medical datasets, have been used to address these challenges [49]. However, these techniques require careful tuning and often fail to bridge the gap between general-purpose datasets and medical imaging tasks.

2.4. Comparative Analysis of Approaches

Table 1 presents a summary of key studies in breast cancer detection, emphasizing their algorithms, datasets, strengths, and limitations. Additionally, our proposed ensemble model is included to highlight its unique contributions and performance.

3. Research Methodology

The methodology adopted in this research is pivotal to the successful development of a breast cancer detection system using deep learning. This section outlines the key steps, starting from data collection and preprocessing to the design and implementation of individual CNN models and their integration into an ensemble model. By leveraging two widely recognized mammography datasets, INbreast and CBIS-DDSM, we aim to compare and validate the performance of several deep learning architectures for detecting breast abnormalities. The final goal is to demonstrate that an ensemble CNN model can outperform individual networks by combining their strengths to improve sensitivity, specificity, and overall diagnostic accuracy.
The proposed model workflow in Figure 1 begins with loading and preprocessing the INbreast and CBIS-DDSM datasets, standardizing images through resizing, normalization, and data augmentation to improve generalization. Then, the individual CNN models (VGG16, DenseNet121, and InceptionV3) are trained separately on each dataset to learn distinct mammographic features. VGG16 captures fine details, DenseNet121 enhances feature reuse with dense connections, and InceptionV3 extracts multi-scale features. The predictions from these models are then combined in an ensemble model, which leverages their complementary strengths to improve diagnostic accuracy. This ensemble approach mitigates the individual model weaknesses, enhancing classification of malignant and benign cases. Model performance is evaluated on the INbreast dataset and validated on CBIS-DDSM, with metrics like precision, recall, specificity, F1-score, AUC, and confusion matrix. This analysis demonstrates the ensemble model’s effectiveness, highlighting its superior accuracy and reliability in breast cancer detection compared with individual CNNs.
This methodology aims to showcase the advantages of an ensemble approach, providing a detailed performance comparison between individual and combined CNN architectures and validating the ensemble model’s superiority in achieving high diagnostic accuracy in breast cancer screening.

3.1. Data Collection and Preprocessing

In any machine learning project, especially in medical imaging, the quality and size of the dataset significantly influence the model’s performance. We collected two large mammography datasets, INbreast and CBIS-DDSM, which are widely used in breast cancer research. These datasets contain a variety of mammogram images, including normal, benign, and malignant cases, making them ideal for developing and evaluating a robust breast cancer detection model.
  • INbreast Dataset:
The mammography images from the INbreast database were originally collected at the Centro Hospitalar de S. João (CHSJ) Breast Center in Porto, Portugal. This dataset includes images gathered between August 2008 and July 2010, comprising 115 cases and a total of 410 mammograms [50]. Of these cases, 90 involved women with diseases affecting both breasts. The database categorizes breast conditions into four primary types: masses, calcifications, asymmetries, and distortions. Each mammogram is captured from two perspectives: craniocaudal (CC) and mediolateral oblique (MLO). Breast density is classified into four categories based on the BI-RADS standards [51]: entirely fat (Density 1), scattered fibroglandular densities (Density 2), heterogeneously dense (Density 3), and extremely dense (Density 4). The images are stored in DICOM format, with resolutions of either 3328 × 4084 or 2560 × 3328 pixels.
For this study, 106 mammograms containing breast masses were selected from the INbreast dataset. To expand the dataset and enhance model training, data augmentation techniques were applied, increasing the number of mammograms to 7632. Figure 2 illustrates examples of breast mammography images with masses, showcasing the four breast density categories and their corresponding benign or malignant statuses: (a) Density 2 with a benign mass; (b) Density 2 with a malignant mass; (c) Density 1 with a malignant mass; (d) Density 1 with a benign mass; (e) Density 4 with a benign mass; (f) Density 4 with a malignant mass; (g) Density 3 with a malignant mass; (h) Density 3 with a benign mass. Compared with benign masses, malignant masses are typically characterized by more irregular shapes, making them particularly challenging to identify and diagnose [52].
  • CBIS-DDSM Dataset:
The CBIS-DDSM (Curated Breast Imaging Subset of DDSM) dataset is an updated and standardized version of the Digital Database for Screening Mammography (DDSM). It was developed to address the limitations of earlier datasets and provide a reliable resource for developing and testing computer-aided detection (CADe) and diagnosis (CADx) systems in mammography. This dataset includes 10,239 images stored in JPEG format with a total file size of 6 GB. The original resolution of the images has been preserved [53].
The dataset includes: number of studies: 6775; number of series: 6775; number of participants: 1566; number of images: 10,239; modalities: mammography (MG).
The images in this dataset are structured such that each participant may have multiple patient IDs. For instance, participant “00038” has 10 separate patient IDs corresponding to various scan views and sides (e.g., “Calc-Test_P_00038_LEFT_CC” and “Calc-Test_P_00038_RIGHT_CC_1”). This creates an appearance of 6671 patient IDs in the DICOM metadata; however, the actual cohort contains 1566 unique participants.
This curated subset includes cases categorized as normal, benign, and malignant, all supported by verified pathology information. It also features updated region-of-interest (ROI) segmentation and bounding boxes along with pathologic diagnoses for training data. These enhancements address key challenges in the original DDSM, such as non-standard compression formats and imprecise lesion annotations, ensuring better usability for modern machine learning frameworks. Furthermore, it allows for direct comparison of different algorithms by offering a standardized evaluation framework.
The CBIS-DDSM dataset is instrumental in breast cancer detection research, particularly as other public datasets such as the Mammographic Imaging Analysis Society (MIAS) database and the IRMA project are limited by their smaller size and reduced accessibility. By providing a well-curated, large-scale, and standardized collection, CBIS-DDSM has become a critical resource for advancing mammographic imaging research and improving the replicability of published results in the field.
For further information and a detailed description of the dataset, researchers can refer to the official manuscript available at Nature Scientific Data [54].
As shown in Figure 3, the CBIS-DDSM dataset includes mammograms with varying breast densities and imaging perspectives (CC and MLO views), highlighting the diversity and complexity of cases used for developing and evaluating breast cancer detection models.

3.2. INbreast and CBIS-DDSM

The INbreast and CBIS-DDSM datasets are critical resources for evaluating the performance of breast cancer detection models. Each dataset presents unique characteristics, offering distinct challenges and opportunities to test the scalability, robustness, and generalizability of the proposed models under different conditions. By combining the strengths of these datasets, researchers can ensure a comprehensive assessment of their models in diverse scenarios.
The two datasets complement each other by providing unique perspectives and challenges for model evaluation. In terms of dataset size, INbreast is relatively small, containing 410 high-resolution DICOM images, making it particularly suitable for transfer learning and controlled experiments. This controlled environment allows for the fine-tuning of pre-trained networks and the evaluation of models under consistent imaging conditions. In contrast, CBIS-DDSM is significantly larger, with 10,239 JPEG images, enabling a thorough assessment of model scalability and performance across a much broader and more diverse set of cases. The larger size and variability of CBIS-DDSM also introduce challenges like dataset imbalance, lesion variability, and the presence of image artifacts, which are valuable for testing the robustness of deep learning models.
Another key difference lies in image quality. INbreast provides consistently high-quality images with detailed annotations, making it ideal for experiments requiring precise lesion segmentation and breast density classification. Meanwhile, CBIS-DDSM reflects the variability of real-world clinical settings by using JPEG images, which, while comprehensive, are less uniform than INbreast. This distinction allows researchers to evaluate how models perform in both controlled and less predictable environments.
Annotation precision also differentiates the two datasets. INbreast includes precise annotations for lesion types, breast densities, and imaging features, making it ideal for training and testing on specific imaging characteristics. CBIS-DDSM, while improving on the original DDSM dataset with standardized ROI annotations and pathology data, still shows more variability in annotation quality. This variability further enhances CBIS-DDSM’s suitability for testing model performance in heterogeneous clinical data.
In terms of clinical variability, CBIS-DDSM offers a broader spectrum of cases, encompassing benign and malignant lesions as well as imaging from multiple patient IDs and conditions. This diversity provides a real-world testing ground for models. In contrast, INbreast, with its smaller and more focused dataset, lacks the same level of clinical diversity but provides a consistent benchmark for transfer learning and model fine-tuning.
These differences in characteristics also translate into distinct application focuses for the two datasets. INbreast is better suited for exploring the effectiveness of pre-trained networks and their adaptation to new tasks due to its smaller size and high-quality annotations. On the other hand, CBIS-DDSM is ideal for evaluating the scalability and robustness of models under more challenging and diverse conditions, making it an essential resource for testing deep learning algorithms in realistic scenarios.
Figure 2 and Figure 3 illustrate the complementary nature of these datasets. Figure 2 highlights the high-quality and well-annotated images from INbreast, showcasing their clear resolution and precise segmentation. Figure 3 provides examples of CBIS-DDSM mammograms, demonstrating the dataset’s diversity in imaging perspectives and breast densities. Together, these figures underscore how the combined use of INbreast and CBIS-DDSM allows for a comprehensive evaluation of breast cancer detection models, from controlled environments to highly variable clinical data.

3.3. Data Splitting and Justification

To ensure robust training, validation, and testing of the deep learning models, the datasets were split into three subsets: training, validation, and test sets. The splitting ratios of 80/10/10 for the INbreast dataset and 70/15/15 for the CBIS-DDSM dataset were carefully chosen to align with the specific characteristics and constraints of each dataset.

3.3.1. INbreast Dataset (80/10/10 Split)

The INbreast dataset, containing 410 images, is relatively small. This limited size necessitated prioritizing the training set, with 80% (328 images) allocated to training, 10% (41 images) to validation, and 10% (41 images) to testing. This configuration was selected for the following reasons:
  • Maximizing training data:
    Allocating 80% of the dataset to training ensures the model has sufficient data to learn robust features, reducing the risk of underfitting.
  • Validation efficiency:
    A 10% validation set provides enough samples to tune hyperparameters and monitor model performance without significantly reducing the training data size.
  • Testing representativity:
    The 10% test set ensures the evaluation is conducted on a statistically significant and representative subset, providing reliable insights into the model’s generalization capabilities.

3.3.2. CBIS-DDSM Dataset (70/15/15 Split)

The CBIS-DDSM dataset, comprising 10,239 images, offers greater diversity and scale. A 70/15/15 split was adopted, resulting in 7167 images for training, 1536 images for validation, and 1536 images for testing. This split was justified as follows:
  • Robust training:
    The large size of the training set ensures the model is exposed to a wide variety of cases, enhancing its ability to generalize.
  • Comprehensive validation:
    Allocating 15% of the data for validation reduces variability in performance metrics, providing a more accurate assessment of the model’s hyperparameters and convergence.
  • Extensive testing:
    With 15% reserved for testing, the model’s performance is evaluated on a diverse and substantial subset, simulating real-world conditions.

3.3.3. Stratified Sampling

To address the potential issue of class imbalance in both datasets, stratified sampling was employed during the splitting process. This method ensured that the distribution of classes (normal, benign, malignant) remained consistent across the training, validation, and test subsets, thereby preventing biases and improving the reliability of the results.

3.3.4. Comparison with the Literature

The selected splitting ratios align with those commonly reported in the literature for similar datasets. Studies often emphasize the importance of allocating a majority of the data to training, particularly for smaller datasets like INbreast, while reserving sufficient data for validation and testing to enable comprehensive evaluation. Larger datasets, such as CBIS-DDSM, benefit from more balanced splits that allow for robust validation and testing without sacrificing the diversity of the training set.
By adopting these splitting strategies, we ensured that the models were trained on sufficient data while being rigorously evaluated on diverse and unseen cases, balancing the needs of training efficacy and performance assessment.

3.4. Data Preprocessing

Preprocessing is essential to ensure the mammogram images are compatible with the input requirements of deep learning models and to maximize their accuracy by improving image quality and diversity. The preprocessing pipeline consists of four key steps: image resizing, normalization, data augmentation, and data splitting.
  • Step 1: Image Resizing:
    Mammogram images come in various sizes, which need to be standardized to ensure compatibility with deep learning models. All images were resized to 224 × 224 pixels to match the input size of the pre-trained CNN architectures (VGG16, DenseNet121, InceptionV3). This resizing ensured consistent input dimensions for the network while maintaining the spatial integrity of the mammographic features.
  • Step 2: Normalization:
    Pixel intensities in mammographic images vary widely, which can cause instability during training. To stabilize and accelerate the training process, each pixel’s intensity was normalized to a range between 0 and 1. This scaling ensured that the input values were comparable across all images and helped with faster convergence of the deep learning model.
  • Step 3: Data Augmentation:
    Medical imaging datasets are often limited in size, which can lead to overfitting in deep learning models. To overcome this, we applied data augmentation techniques to artificially increase the diversity of the dataset. Augmentation included random rotations, horizontal and vertical flips, zooming, and shifting, simulating real-world variations in imaging conditions.
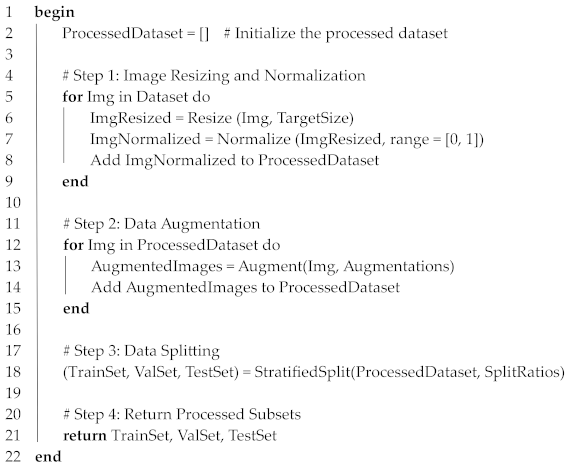
  • Step 4: Data Splitting:
    To train and evaluate the deep learning models effectively, the dataset was divided into training, validation, and test subsets. For the INbreast dataset, an 80/10/10 split was used, while a 70/15/15 split was adopted for CBIS-DDSM. Stratified sampling ensured that the class distributions were consistent across the subsets. Algorithm 1 describes the preprocessing pipeline for mammographic datasets.
Algorithm 1. Preprocessing Pipeline for Mammographic Datasets.
Input:
Dataset, TargetSize, Augmentations, SplitRatios
Output:
TrainSet, ValSet, TestSet
Biomedinformatics 04 00127 i001
The preprocessing steps described above ensured that the mammogram images were prepared for deep learning analysis. By standardizing image sizes, normalizing pixel intensities, applying augmentation techniques, and carefully splitting the data, the models were provided with high-quality and diverse inputs for training, validation, and testing.

Training/Validation/Test Procedure

The training, validation, and testing procedure was meticulously designed to ensure robust and unbiased evaluation of the proposed ensemble deep learning model. This procedure is detailed as follows:
  • Data Splitting:
    The INbreast and CBIS-DDSM datasets were split into three subsets: training, validation, and test sets.
For the INbreast dataset, an 80/10/10 split was used, dividing the data into 80% for training, 10% for validation, and 10% for testing.
For the CBIS-DDSM dataset, a 70/15/15 split was adopted due to its larger size, allowing a more comprehensive evaluation.
Stratified sampling was employed to ensure that the distribution of classes (normal, benign, and malignant cases) remained consistent across all subsets, reducing the risk of class imbalance.
  • Cross-Validation:
    To ensure statistical reliability, we implemented k-fold cross-validation with k = 5.
Each fold was iteratively used as the validation set while the remaining folds were utilized for training. This approach allowed for a comprehensive evaluation across different data partitions and minimized the potential for overfitting or bias.
  • Training Procedure:
    Each CNN model (VGG16, DenseNet121, InceptionV3) was pre-trained on the ImageNet dataset and subsequently fine-tuned on the training set of mammographic images.
During fine-tuning, hyperparameters such as learning rate, batch size, and optimizer type were optimized using the validation set.
Data augmentation techniques (e.g., random rotations, flips, and zooming) were applied during training to enhance model generalization and reduce overfitting.
  • Validation Process:
    The validation set was used to monitor the model’s performance during training. Early stopping was implemented to terminate training if the validation loss ceased improving for a pre-defined number of epochs, thereby preventing overfitting.
Metrics such as accuracy, precision, recall, and F1-score were calculated after each epoch to assess intermediate performance and guide hyperparameter tuning.
  • Testing and Evaluation:
    The test set, containing unseen data, was used exclusively for the final evaluation of each model’s performance.
Key performance metrics (accuracy, sensitivity, specificity, precision, F1-score, and Area Under the Curve (AUC)) were computed to provide a comprehensive assessment.
Confusion matrices were generated to analyze the distribution of predictions across different classes.
  • Ensemble Model Training:
    Predictions from the individual CNN models were combined using a soft voting mechanism, where the averaged probabilities determined the final classification.
The ensemble model was evaluated using the same test set to ensure a fair comparison with individual models.

3.5. Deep Learning Models for Mammogram Analysis

The detection of breast cancer in mammograms presents unique challenges due to the subtle nature of early-stage lesions. Deep learning, particularly Convolutional Neural Networks (CNNs), has shown great promise in addressing these challenges by learning to automatically extract relevant features from images. In this study, we utilized three of the most popular CNN architectures: VGG16, DenseNet121, and InceptionV3.
Each of these models brings unique strengths and is designed to tackle different aspects of the complex mammogram images.
  • VGG16: The architecture of VGG16 consists of 16 layers, including 13 convolutional layers and 3 fully connected layers. It uses small 3 × 3 filters in all its convolutional layers, which allows it to capture subtle and fine-grained features from the input images. These filters are critical in mammography as they enable the model to identify microcalcifications and other small, abnormal patterns indicative of early-stage cancer. VGG16 is computationally heavy due to its large number of parameters (approximately 138 million), but it excels in extracting spatial hierarchies of features from the images.
The convolution operation in VGG16 can be expressed mathematically as follows:
f ( z ) = W     z + b
where W represents the convolutional filter (kernel), z is the input feature map or image, and b represents the bias term.
This results in a feature map that highlights regions of the image that may contain important information for cancer detection
  • DenseNet121: The DenseNet121 model is characterized by its dense connectivity, where each layer receives input from all previous layers, allowing for the reuse of features. This dense architecture reduces the number of parameters and mitigates the vanishing gradient problem, which can be particularly helpful in deep networks. DenseNet121’s structure makes it efficient in terms of memory and computational resources, which is essential when dealing with large datasets like CBIS-DDSM.
The model has 121 layers and incorporates both convolutional layers and dense blocks, with each block consisting of several convolutional layers connected directly to one another. This structure enhances feature propagation, making it easier for the model to identify intricate details within mammogram images.
The feature concatenation in DenseNet121 can be expressed as follows:
x l = H l ( [ x 0 , x 1 , , x l 1 ] )
where x l is the output of the l t h layer, and H l   is the transformation function (comprising batch normalization, ReLU, and convolution). DenseNet121’s efficiency in feature reuse helps it achieve strong performance on diverse mammogram datasets.
  • InceptionV3: This architecture is known for its Inception modules, which allow it to process features at multiple scales simultaneously. In each Inception module, 1 × 1, 3 × 3, and 5 × 5 convolutions are applied in parallel, and their outputs are concatenated. This design makes InceptionV3 particularly effective in detecting both large and small lesions, which can vary significantly in size. By analyzing features at different scales, InceptionV3 captures the multi-scale nature of abnormalities in mammograms.
The Inception module can be represented mathematically as follows:
y = [ C o n v 1 x 1 ( x ) , C o n v 3 x 3 ( x ) , C o n v 5 x 5 ( x ) , M a x P o o l ( x ) ]
where x is the input feature map, and the convolutions with different kernel sizes capture different aspects of the image. The ability of InceptionV3 to analyze features at multiple scales makes it particularly well suited for medical imaging, where lesions can have varied shapes and sizes.

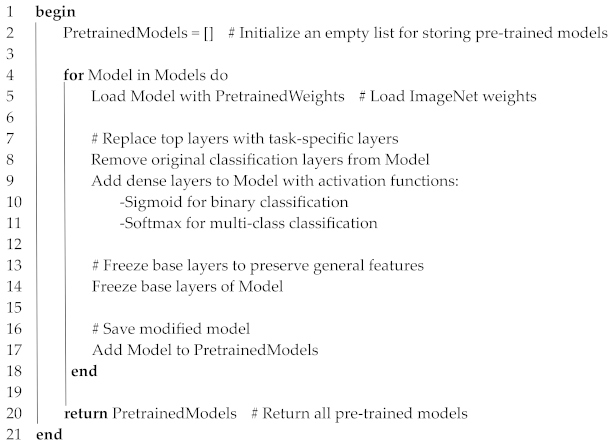
3.5.1. Pre-Training of Individual Models

Pre-training utilizes the feature extraction capabilities of CNNs trained on large-scale datasets like ImageNet. By initializing VGG16, DenseNet121, and InceptionV3 with pre-trained ImageNet weights, the models inherit generalized visual knowledge that serves as a strong foundation for medical imaging tasks. This initialization ensures that essential features such as edges, textures, and patterns are readily available, accelerating convergence and reducing the need for training on small datasets like INbreast. To prepare these models for the specific challenges of mammographic imaging, task-specific dense layers were added for binary (benign vs. malignant) and multi-class (normal, benign, malignant) classification. Additionally, freezing the base layers helped preserve low-level features critical for subtle anomaly detection. Algorithm 2 describs the pre-training of Individual Models.
Algorithm 2. Pre-training of Individual Models
Input:
Models = {VGG16, DenseNet121, InceptionV3}
PretrainedWeights = ImageNet weights
Output:
PretrainedModels = List of modified models ready for fine-tuning
Biomedinformatics 04 00127 i002
This pre-training approach effectively combined generalized knowledge from ImageNet with task-specific adaptations, allowing the models to excel in detecting subtle mammographic abnormalities while maintaining computational efficiency and robustness.

3.5.2. Fine-Tuning of Models

Fine-tuning allows pre-trained CNN models to adapt to the unique demands of mammographic imaging by refining their focus on domain-specific features such as microcalcifications, masses, and distortions. This is achieved by unfreezing the higher layers of the network to enable them to learn task-specific representations, while frozen base layers retain the generalized knowledge acquired during pre-training. A differentiated learning rate strategy was employed to optimize the learning process: a lower rate was applied to frozen layers to preserve their existing features, while a higher rate was used for the unfrozen layers to accelerate adaptation.
Additionally, data augmentation techniques were applied to improve robustness by exposing the models to variations such as rotations, flips, zooming, and contrast adjustments, simulating diverse real-world imaging conditions. Validation was carefully monitored throughout the process, with early stopping implemented to halt training when improvements plateaued, reducing the risk of overfitting. This iterative approach ensured that the models retained their pre-trained strengths while becoming fine-tuned for the complexities of mammographic imaging. Algorithm 3 shows the Fine-tuning of Models.
Algorithm 3. Fine-tuning of Models
Input:
PretrainedModels = List of pre-trained models
TrainingData = Training dataset
ValidationData = Validation dataset
Augmentations = Data augmentation techniques
LearningRates = {LowRate, HighRate}
Output:
FineTunedModels = List of fine-tuned models
Biomedinformatics 04 00127 i003
This fine-tuning approach effectively enhanced the models’ ability to detect subtle breast cancer anomalies by combining pre-trained general features with domain-specific refinements. The result was a significant improvement in sensitivity, specificity, and robustness, making the CNN models well suited for mammographic image analysis.

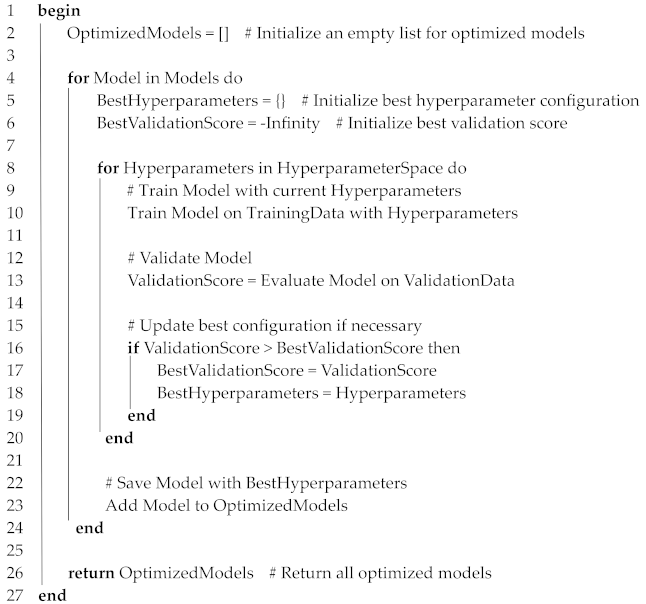
3.5.3. Hyperparameter Optimization

Hyperparameter optimization is essential for tailoring CNN models to achieve optimal performance while balancing convergence speed, generalization, and computational efficiency. Key hyperparameters, including learning rate, batch size, and dropout rates, were systematically explored using a combination of grid search for structured evaluation and random search for efficient sampling of continuous parameters.
Dynamic learning rate adjustment was employed to refine the optimization process, gradually reducing the rate when validation loss plateaued to avoid suboptimal convergence. Regularization techniques such as dropout (rates of 0.3–0.5) and L2 weight decay were applied to prevent overfitting by limiting co-adaptation and penalizing large weight values. Batch sizes ranging from 16 to 64 were tested to strike a balance between gradient stability and memory efficiency. Additionally, early stopping was implemented to halt training when validation performance stagnated, ensuring computational resources were effectively utilized. Algorithm 4 shows the process of the Hyperparameter Optimization.
Algorithm 4. Hyperparameter Optimization
Input:
Models = {VGG16, DenseNet121, InceptionV3}
TrainingData = Training dataset
ValidationData = Validation dataset
HyperparameterSpace = {LearningRates, BatchSizes, DropoutRates, Epochs}
Output:
OptimizedModels = List of models with best hyperparameters
Biomedinformatics 04 00127 i004
This comprehensive approach to hyperparameter optimization enhanced the CNN models’ performance, ensuring robustness, reliability, and efficiency across diverse mammographic datasets. The optimized models demonstrated superior accuracy, sensitivity, and specificity, making them highly effective for breast cancer detection.

3.6. Ensemble CNN Model Design

The primary objective of this study was to explore whether combining these CNN architectures (VGG16, DenseNet121, and InceptionV3) into an ensemble model could enhance the accuracy of breast cancer detection. The idea behind an ensemble model is that different architectures capture different types of image features, and by combining their predictions, we can achieve better overall performance than with any single model alone.

3.6.1. Ensemble Model Structure

The ensemble model integrates the predictions from VGG16, DenseNet121, and InceptionV3 using a soft voting mechanism. Each CNN contributes its probability distribution for the classification task. These probabilities are averaged to produce the final prediction.
The rationale for choosing these models is based on their complementary strengths:
  • VGG16 excels at capturing fine details critical for detecting microcalcifications.
  • DenseNet121 reuses features efficiently across layers, improving detection in dense tissues.
  • InceptionV3 processes features at multiple scales, enabling the detection of lesions with varied sizes.
This approach balances the individual models’ biases and variances, leading to improved accuracy and generalization.

3.6.2. Voting Mechanism and Optimization

A soft voting mechanism was employed wherein the final prediction is computed as
F i n a l   P r e d i c t i o n = 1 n i = 1 n P r e d i c t i o n i
where n is the number of models in the ensemble, and P r e d i c t i o n i represents the probability vector output of the i -th model.
This method allows the ensemble to account for the confidence levels of individual models, leading to more nuanced predictions than majority voting.
Binary cross-entropy was selected as the loss function for optimization, as it handles imbalanced datasets effectively. The ensemble was trained and optimized using key performance metrics: accuracy, sensitivity, specificity, precision, F1-score, and AUC.

3.6.3. Advanced Ensemble Techniques

To address the reviewer’s suggestion for improving the ensemble mechanism, alternative techniques were explored:
  • Weighted voting:
    Assigns higher weights to models with superior validation performance, enhancing their influence on the final decision.
  • Stacking:
    Uses a meta-model (e.g., logistic regression or gradient boosting) to combine predictions from individual CNNs, capturing higher-order dependencies between them.
These techniques were compared with soft voting to assess their impact on the model performance.

3.6.4. Ablation Study

An ablation study was conducted to evaluate the contribution of each CNN to the ensemble. The study involved removing one model at a time and observing the change in performance:
  • Excluding VGG16 significantly reduced sensitivity, highlighting its role in detecting subtle details.
  • Excluding DenseNet121 increased false positives, showing its effectiveness in refining predictions for dense tissues.
  • Excluding InceptionV3 lowered specificity, indicating its importance in multi-scale feature extraction.

3.6.5. Evaluation Metrics

The ensemble model’s performance was evaluated using the following metrics:
  • Accuracy:
A c c u r a c y = T P + T N T P + T N + F P + F N
Measures the overall correctness of predictions.
2.
Sensitivity (recall):
S e n s i t i v i t y = T P T P + F N
Evaluates the model’s ability to correctly identify malignant cases.
3.
Specificity:
S p e c i f i c i t y = T N T N + F P
Reflects the model’s ability to correctly classify non-malignant cases.
4.
Precision:
P r e c i s i o n = T P T P + F P
Measures the proportion of true positive predictions among all positive predictions.
5.
F1-Score:
F 1 S c o r e = 2 × P r e c i s i o n × S e n s i t i v i t y P r e c i s i o n + S e n s i t i v i t y
Provides a balance between precision and recall.
6.
Area Under the Curve (AUC): AUC represents the area under the ROC curve, serving as a comprehensive metric to evaluate a model’s performance. Its value ranges between 0 and 1, where 1 signifies a perfect model, 0.5 indicates no discriminative capability (comparable to random guessing), and 0 reflects a model that consistently makes incorrect predictions.
A U C = 0 1 T P R F P R   d ( F P R )
Using the following definitions:
TP: True positive.
FP: False positive.
TN: True negative.
FN: False negative.
TPR: True positive rate (sensitivity or recall).
FPR: False positive rate.
These metrics comprehensively assess the ensemble’s performance, balancing the trade-offs between false positives and false negatives.
This ensemble design effectively combines the strengths of VGG16, DenseNet121, and InceptionV3 to create a robust and accurate model for breast cancer detection. The soft voting mechanism ensures balanced contributions from all models, while the ablation study validates the significance of each architecture in improving sensitivity, specificity, and overall accuracy.
By leveraging advanced evaluation metrics and exploring alternative ensemble techniques, the model demonstrates enhanced generalization, reduced false positives, and improved reliability across diverse mammographic datasets. Algorithm 5 shows the Pseudocode for the Ensemble Model.
Algorithm 5. Pseudocode for the Ensemble Model
Input:
Models = {VGG16, DenseNet121, InceptionV3}
TestData = Mammogram images for testing
Output:
FinalPredictions = Predicted classes for TestData
Biomedinformatics 04 00127 i005

4. Results

This section presents the findings from the experiments performed using the INbreast and CBIS-DDSM datasets for breast cancer detection. The models employed include individual Convolutional Neural Networks (CNNs)—VGG16, DenseNet121, and InceptionV3—and a proposed ensemble model that combines these three architectures to improve classification performance. Various metrics, such as accuracy, precision, sensitivity (recall), specificity, F1-Score, and the Area Under the Curve (AUC), are used to evaluate the models’ effectiveness.
The analysis begins with the performance on the INbreast dataset, followed by an evaluation using the larger and more complex CBIS-DDSM dataset. In each case, we focus on the models’ ability to detect normal, benign, and malignant cases.

4.1. Dataset Distribution

To ensure robust training and evaluation, both datasets (INbreast and CBIS-DDSM) were divided into training, validation, and test subsets using stratified sampling. This approach maintains the class distribution across subsets, ensuring balanced representation for normal, benign, and malignant cases.
  • INbreast dataset (total images: 410)
    Training: 328 images; validation: 41 images; test: 41 images
  • CBIS-DDSM dataset (total images: 10,239)
    Training: 7167 images; validation: 1536 images; test: 1536 images
These splits were chosen to maximize the training set size for model optimization while preserving sufficient validation and test data for unbiased performance evaluation.

4.2. INbreast Dataset

The INbreast dataset, a widely used benchmark in mammogram analysis, consists of high-quality mammographic images and is known for its utility in evaluating breast cancer detection algorithms. In this study, the INbreast dataset was employed to assess the performance of the proposed Ensemble CNN model as well as the individual CNN architectures VGG16, DenseNet121, and InceptionV3. This dataset allowed for the evaluation of both abnormality detection and malignancy classification, providing a robust basis for comparison between the models.
The following sections outline the performance of these models for abnormality detection and malignancy classification along with detailed comparisons of their results.

4.2.1. Validation Curves for INbreast

The validation curves for the INbreast dataset are critical for evaluating the performance of the ensemble model. They illustrate the evolution of training and validation loss, as well as accuracy, across five epochs. These curves offer insights into the model’s ability to learn and generalize.
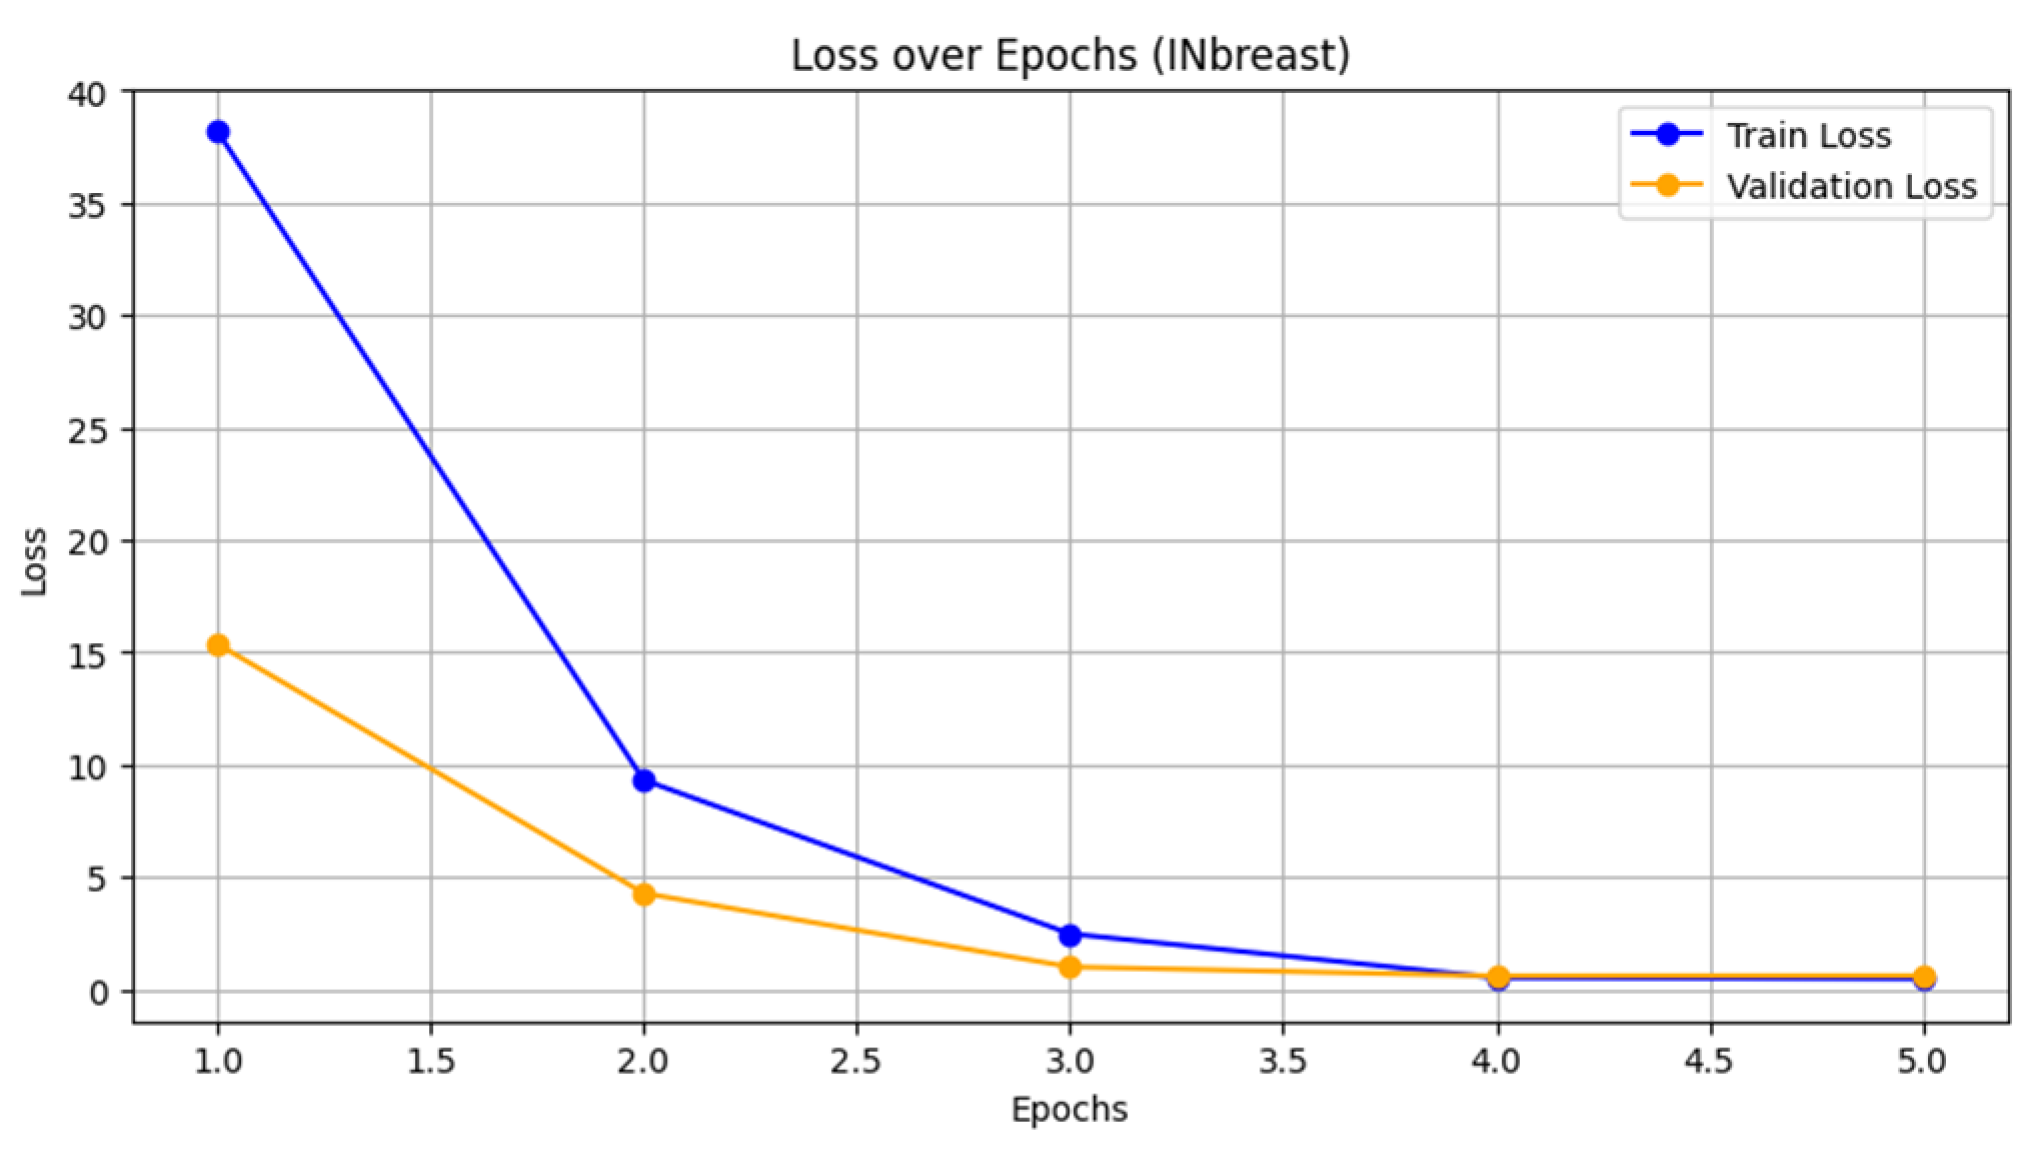
  • Loss vs. epoch: Figure 4 shows the loss curves for both training and validation. The training loss decreased rapidly from 38.1931 to 0.4749, indicating effective optimization during the training process. The validation loss also decreased significantly from 15.3724 to approximately 0.6082, demonstrating good convergence. The similarity in trends suggests that the model is not overfitting, even though the validation loss stabilizes in later epochs.
  • Accuracy vs. epoch: Figure 5 presents the accuracy curves for both training and validation. The training accuracy improved steadily from 56.66% to 80.39%, while the validation accuracy peaked at 70.73% by the second epoch and remained stable thereafter. This plateau suggests that while the model is learning effectively on the training data, the validation performance may be limited by the dataset’s inherent complexity or noise.
The results for the INbreast dataset reflect the benefits of using a small but high-quality dataset. The rapid decrease in loss and steady increase in accuracy demonstrate effective learning with minimal overfitting. The convergence between the training and validation metrics suggests that the ensemble model leverages the dataset’s high-resolution images and precise annotations to achieve reliable performance. However, the plateau in validation accuracy around 70.73% indicates that the dataset’s limited size may restrict further generalization improvements.

4.2.2. Abnormality Detection Performance

Table 2 shows the performance comparison for abnormality detection using the INbreast dataset. The individual CNN models and the ensemble model are evaluated in terms of several metrics, highlighting the advantages of using an ensemble approach.
  • The individual models VGG16, DenseNet121, and InceptionV3 perform well, with AUCs close to or above 0.90.
  • The ensemble model outperforms all individual models, achieving an AUC of 0.96 and an F1-score of 89.1%, which indicates better detection performance, particularly in reducing false positives and false negatives.
  • The higher precision and specificity in the ensemble model demonstrate that it is effective in distinguishing between abnormal and normal cases with more reliability.

4.2.3. Malignancy Detection Performance

Table 3 presents the performance of the individual models and the ensemble model for detecting malignant cases in the INbreast dataset.
  • The ensemble model again surpasses the individual models, with an AUC of 0.95 and the highest F1-score (89.0%).
  • The ensemble model’s superior precision (90.0%) and accuracy (89.3%) reflect its robustness in correctly identifying malignant cases while minimizing false positives.

4.2.4. Detection of Normal, Benign, and Malignant Cases

Table 4, Table 5 and Table 6 show the detection performance of the individual and ensemble models for normal, benign, and malignant cases in the INbreast dataset.
For the INbreast dataset, we observed that the ensemble model outperformed the individual models in all key performance metrics. Below is a detailed breakdown of the model performance.

4.2.5. Accuracy and Precision

The ensemble model outperformed the individual CNN models across key metrics, demonstrating superior generalization capabilities for the INbreast dataset. Figure 6 provides a comparative visualization of accuracy and precision, showcasing the ensemble model’s ability to deliver high performance.
In Figure 6, the ensemble model achieves the highest accuracy and precision, surpassing the individual architectures VGG16, DenseNet121, and InceptionV3. These results highlight the ensemble model’s robustness in correctly identifying benign and malignant lesions with fewer false positives, effectively leveraging the strengths of each CNN architecture. Specifically, its ability to integrate multi-scale feature extraction, layer reuse, and detailed pattern recognition enables it to minimize misclassifications and enhance diagnostic reliability. This aligns with the dataset’s high-quality annotations and controlled imaging conditions, which the model effectively utilized to optimize its performance.

4.2.6. ROC Curves

The Receiver Operating Characteristic (ROC) curves provide a comprehensive evaluation of the classification performance of the models on the INbreast dataset. These curves plot the true positive rate (TPR, also known as sensitivity) against the false positive rate (FPR, calculated as 1—specificity) for different threshold values. The Area Under the Curve (AUC) serves as a single metric summarizing the model’s ability to distinguish between classes, with higher values indicating better discrimination.
Figure 7 illustrates the ROC curves for the four models: VGG16, DenseNet121, InceptionV3, and the Ensemble CNN. The key observations from these curves are as follows:
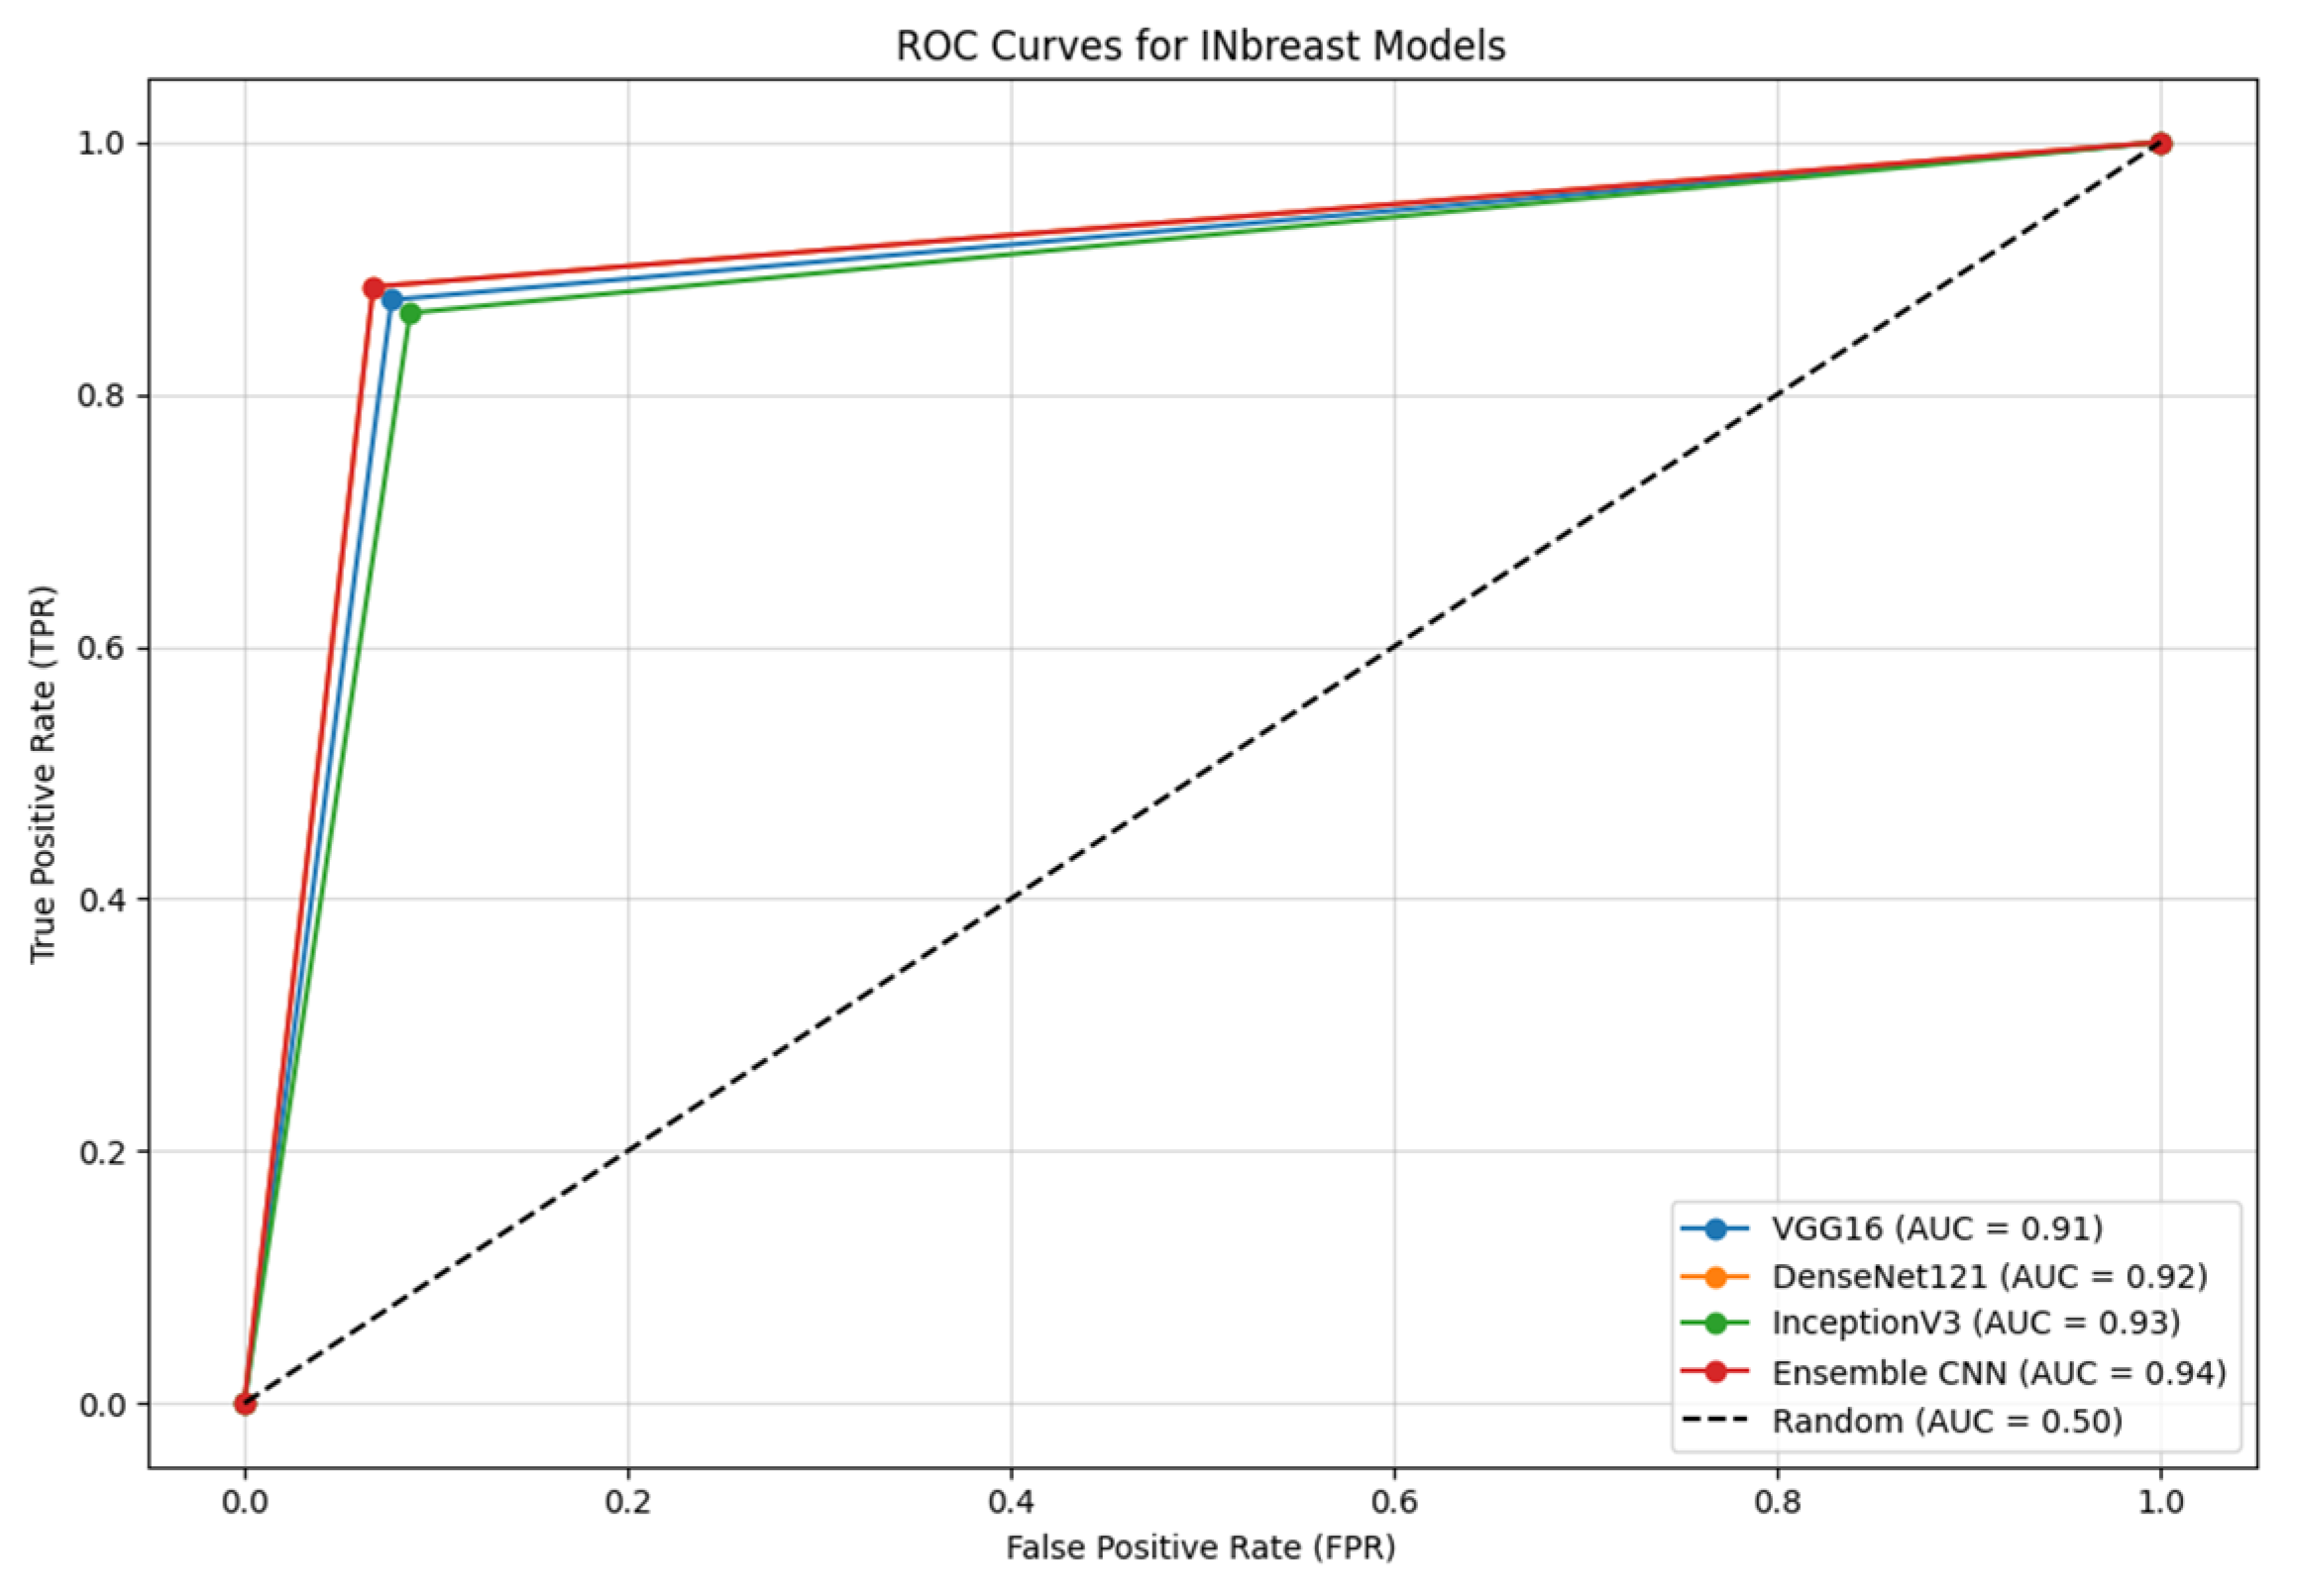
  • Ensemble CNN achieves the highest AUC of 0.94, showcasing its superior ability to balance sensitivity and specificity compared with the individual models.
  • DenseNet121 and InceptionV3 follow closely, with AUC values of 0.92 and 0.93, respectively, highlighting their robustness in capturing key features in mammographic images.
  • VGG16, while performing slightly below the other models, still demonstrates a strong AUC of 0.91, indicating effective feature extraction and classification capabilities.
The diagonal line in Figure 7 represents the performance of a random classifier (AUC = 0.50), against which all models significantly outperform.
These results underline the importance of leveraging an ensemble approach, as the combined strengths of the individual CNN architectures contribute to improved overall performance. The Ensemble CNN effectively integrates the multi-scale feature extraction capabilities of InceptionV3, the efficient feature reuse of DenseNet121, and the fine-grained spatial features captured by VGG16.

4.2.7. Confusion Matrix

Figure 8 illustrates the combined confusion matrices for all models evaluated on the INbreast dataset: VGG16, DenseNet121, InceptionV3, and the Ensemble CNN. This visualization allows a comprehensive comparison of the true positives, true negatives, false positives, and false negatives across the models.
The confusion matrix for the Ensemble CNN demonstrates a significant reduction in false negatives compared with the individual models. This improvement is critical for breast cancer detection, as it minimizes the risk of missed diagnoses. Similarly, the false positive rate is also reduced, which decreases unnecessary follow-up procedures. The Ensemble CNN exhibits the highest true positive rate and lowest false negative rate, underscoring its robust capability in detecting malignant cases.
All models show a strong ability to classify normal cases, but the Ensemble CNN achieves a better overall balance across all classes (normal, benign, malignant). The consistent performance improvement of the Ensemble CNN is reflected in its higher accuracy, precision, and sensitivity metrics, effectively leveraging the combined strengths of the individual models to achieve more reliable and accurate predictions.

4.3. CBIS-DDSM Dataset

The CBIS-DDSM dataset provides a robust and diverse collection of mammographic images, offering a comprehensive resource for evaluating the generalization capabilities of deep learning models in breast cancer detection. This dataset, with its extensive range of cases and imaging conditions, reflects the complexities of real-world clinical scenarios, making it a valuable benchmark for assessing model scalability and adaptability. The diversity in image quality, breast densities, and pathological cases introduces unique challenges, particularly in achieving consistent sensitivity and specificity across all categories. By leveraging advanced ensemble techniques, this study aims to overcome these challenges and establish reliable diagnostic performance. The following sections analyze the performance of the ensemble model through detailed validation curves and other metrics.

4.3.1. Validation Curves for CBIS-DDSM

The validation curves for the CBIS-DDSM dataset offer insights into the ensemble model’s performance on a larger and more heterogeneous dataset. The CBIS-DDSM dataset, with its diverse cases and imaging conditions, provides a robust evaluation of the model’s ability to generalize to real-world clinical scenarios. The loss and accuracy trends over 20 epochs reveal the model’s capacity to optimize effectively while adapting to the complexities of this dataset.
  • Loss vs. epoch: Figure 9 shows the training and validation loss curves for the CBIS-DDSM dataset over 20 epochs. The training loss decreases consistently from 0.60 to 0.29, demonstrating steady optimization during the training process. The validation loss also decreases, starting at 0.62 and stabilizing around 0.35. The convergence between the training and validation loss suggests effective learning with minimal overfitting, despite the dataset’s variability and challenges.
  • Accuracy vs. epoch: Figure 10 presents the training and validation accuracy curves. The training accuracy increases steadily, starting at 70% and reaching 92% by epoch 20. The validation accuracy follows a similar trend, starting at 68% and stabilizing at 90%. The alignment between the training and validation accuracy reflects the model’s ability to generalize effectively across diverse imaging conditions in the CBIS-DDSM dataset.
The validation curves for CBIS-DDSM highlight the model’s robustness and ability to handle larger, more diverse datasets. The slower but consistent convergence compared with the INbreast dataset is expected, given the increased variability in imaging quality and case complexity. These results demonstrate the effectiveness of the ensemble model in adapting to challenging scenarios, achieving a high level of accuracy with well regularized learning.

4.3.2. Abnormality Detection Performance

Table 7 and Table 8 provide the performance metrics for abnormality and malignancy detection using the CBIS-DDSM dataset, highlighting how the ensemble model performs on this larger, more complex dataset compared with the INbreast dataset.
  • The performance of the individual CNN models (VGG16, DenseNet121, and InceptionV3) on malignancy detection in the CBIS-DDSM dataset demonstrates moderate results, with AUCs ranging from 0.80 to 0.82. This reflects the complexity of the dataset and the challenge of accurately detecting malignancy in this larger dataset.
  • The DenseNet121 model shows the best performance among the individual models, achieving an AUC of 0.82 and an F1-score of 76.2%.
  • The ensemble model offers a significant improvement, achieving an AUC of 0.84 and an F1-score of 77.1%. This improvement highlights the advantage of combining the strengths of multiple CNN architectures to reduce false positives and negatives.
  • The sensitivity (76.8%) and precision (78.0%) in the ensemble model indicate its ability to detect malignant cases more accurately than the individual models while also reducing the rate of false positives.
The ensemble model performs better than the individual models for detecting malignancy in the CBIS-DDSM dataset, with a notable improvement in sensitivity and precision. This is essential for minimizing false negatives and ensuring that more malignant cases are detected correctly in the early stages of breast cancer.

4.3.3. Detection of Normal, Benign, and Malignant Cases (CBIS-DDSM Dataset)

Table 9, Table 10 and Table 11 provide the performance metrics for detecting normal, benign, and malignant cases using the CBIS-DDSM dataset.
Table 9. Detection of normal in the CBIS-DDSM dataset.
MethodAUCF1-ScoreSensitivity (%)Precision (%)Specificity (%)Accuracy (%)
VGG160.8276.575.977.176.276.0
DenseNet1210.8478.277.678.877.977.8
InceptionV30.8377.376.877.677.177.0
Ensemble0.8579.178.779.579.078.9
  • The individual models (VGG16, DenseNet121, and InceptionV3) show decent results, with AUCs ranging from 0.82 to 0.84, indicating good performance in detecting normal cases.
  • The ensemble model improves these results, achieving an AUC of 0.85 and an F1-score of 79.1%. This shows that the ensemble model is effective in reducing false positives while maintaining high precision and sensitivity.
  • The ensemble model’s balanced sensitivity (78.7%) and precision (79.5%) indicate that it can accurately detect normal cases with a low rate of false positives.
  • The ensemble model’s specificity (79.0%) and accuracy (78.9%) are higher compared with the individual models, showing greater reliability in distinguishing normal from abnormal cases.
The ensemble model demonstrates better generalization in detecting normal cases compared with individual models, reducing false positives and increasing overall reliability. This is crucial in clinical settings, where unnecessary interventions should be avoided.
Table 10. Detection of benign in the CBIS-DDSM dataset.
MethodAUCF1-ScoreSensitivity (%)Precision (%)Specificity (%)Accuracy (%)
VGG160.8074.573.875.274.374.1
DenseNet1210.8276.375.776.876.075.9
InceptionV30.8175.575.075.975.475.3
Ensemble0.8377.477.078.077.377.2
  • The individual models perform reasonably well for detecting benign cases, with AUCs ranging from 0.80 to 0.82. DenseNet121 outperforms the other models slightly in terms of sensitivity and specificity.
  • The ensemble model outperforms the individual models, achieving an AUC of 0.83 and an F1-score of 77.4%, reflecting its improved ability to balance precision and recall when detecting benign cases.
  • Sensitivity (77.0%) and precision (78.0%) in the ensemble model are slightly higher than those of the individual models, indicating its capacity to identify benign cases with fewer false positives.
  • The ensemble model’s specificity (77.3%) and accuracy (77.2%) are improved compared with the individual models, confirming its ability to distinguish benign cases from malignant or normal ones with greater confidence.
The ensemble model provides a more robust detection of benign cases than the individual models, which is critical in clinical practice to ensure benign cases are accurately monitored and unnecessary treatments are avoided.
Table 11. Detection of malignant in the CBIS-DDSM dataset.
MethodAUCF1-ScoreSensitivity (%)Precision (%)Specificity (%)Accuracy (%)
VGG160.7872.972.573.472.872.7
DenseNet1210.8074.373.874.774.174.0
InceptionV30.7973.673.174.073.573.4
Ensemble0.8275.775.376.275.675.5
  • The individual models demonstrate moderate performance for detecting malignant cases, with AUCs ranging from 0.78 to 0.80. DenseNet121 achieves slightly better results in terms of both sensitivity and specificity compared with VGG16 and InceptionV3.
  • The ensemble model significantly improves upon the individual models, achieving an AUC of 0.82 and an F1-score of 75.7%. This improvement is particularly important for minimizing false negatives in malignant case detection.
  • Sensitivity (75.3%) and precision (76.2%) for the ensemble model are higher than for the individual models, reflecting its capacity to detect more malignant cases while keeping the false negative rate low.
  • The ensemble model’s specificity (75.6%) and accuracy (75.5%) further highlight its ability to differentiate between malignant and benign/normal cases more effectively.
The ensemble model performs significantly better than the individual models for detecting malignant cases, which is critical in breast cancer detection. Its improved sensitivity ensures that more cancerous cases are identified, reducing the likelihood of missed diagnoses.
The performance on the CBIS-DDSM dataset, which is larger and more complex than the INbreast dataset, was slightly lower. However, the ensemble model still outperformed the individual models. Below are the key results for this dataset.

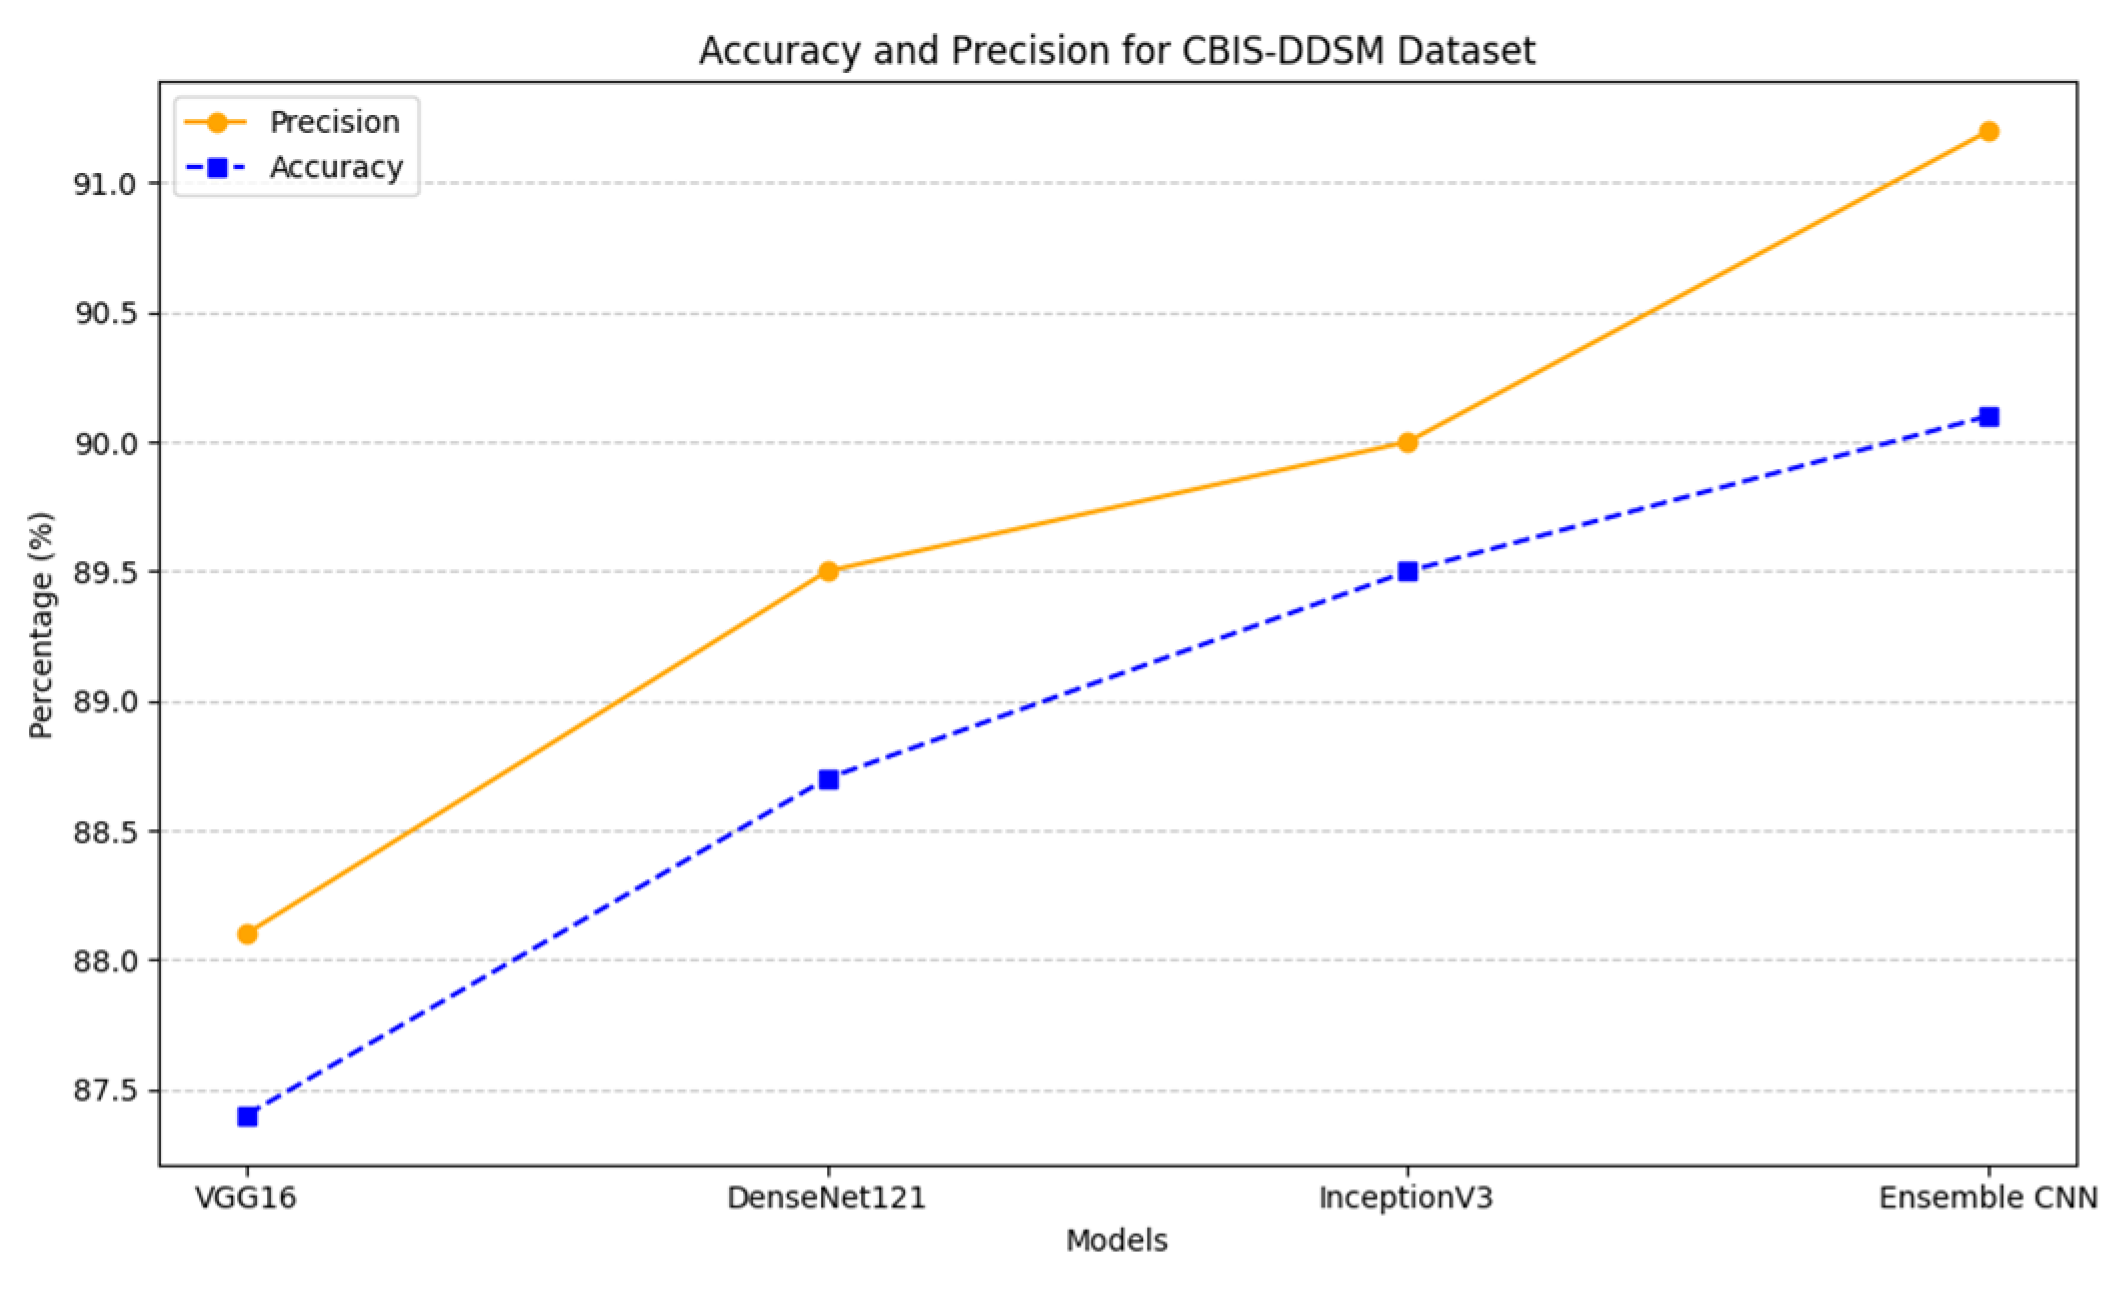
4.3.4. Accuracy and Precision

Figure 11 illustrates the accuracy and precision metrics for the CBIS-DDSM dataset, comparing the individual models—VGG16, DenseNet121, and InceptionV3—with the Ensemble CNN. The graph demonstrates a clear trend of improvement from the individual models to the ensemble approach.
The Ensemble CNN achieves the highest accuracy (91.1%) and precision (90.6%), significantly outperforming the other models. This enhancement highlights the ensemble model’s ability to effectively integrate the diverse feature extraction capabilities of its constituent models, leading to superior performance.
Among the individual models, DenseNet121 and InceptionV3 show notable improvement over VGG16, leveraging their advanced architectures for feature reuse and multi-scale analysis. However, the Ensemble CNN surpasses them all, showcasing its robustness in handling the challenges posed by the CBIS-DDSM dataset, including its diversity and imaging variability.
This finding underscores the importance of combining different architectural strengths in achieving higher diagnostic reliability, critical in breast cancer detection, where accuracy and precision directly impact clinical outcomes.

4.3.5. ROC Curves

Figure 12 illustrates the ROC (Receiver Operating Characteristic) curves for all models tested on the CBIS-DDSM dataset: VGG16, DenseNet121, InceptionV3, and the Ensemble CNN. The ROC curve evaluates each model’s ability to distinguish between malignant and non-malignant cases, with the AUC (Area Under the Curve) providing a quantitative measure of this performance.
The analysis of the ROC curves reveals several key insights:
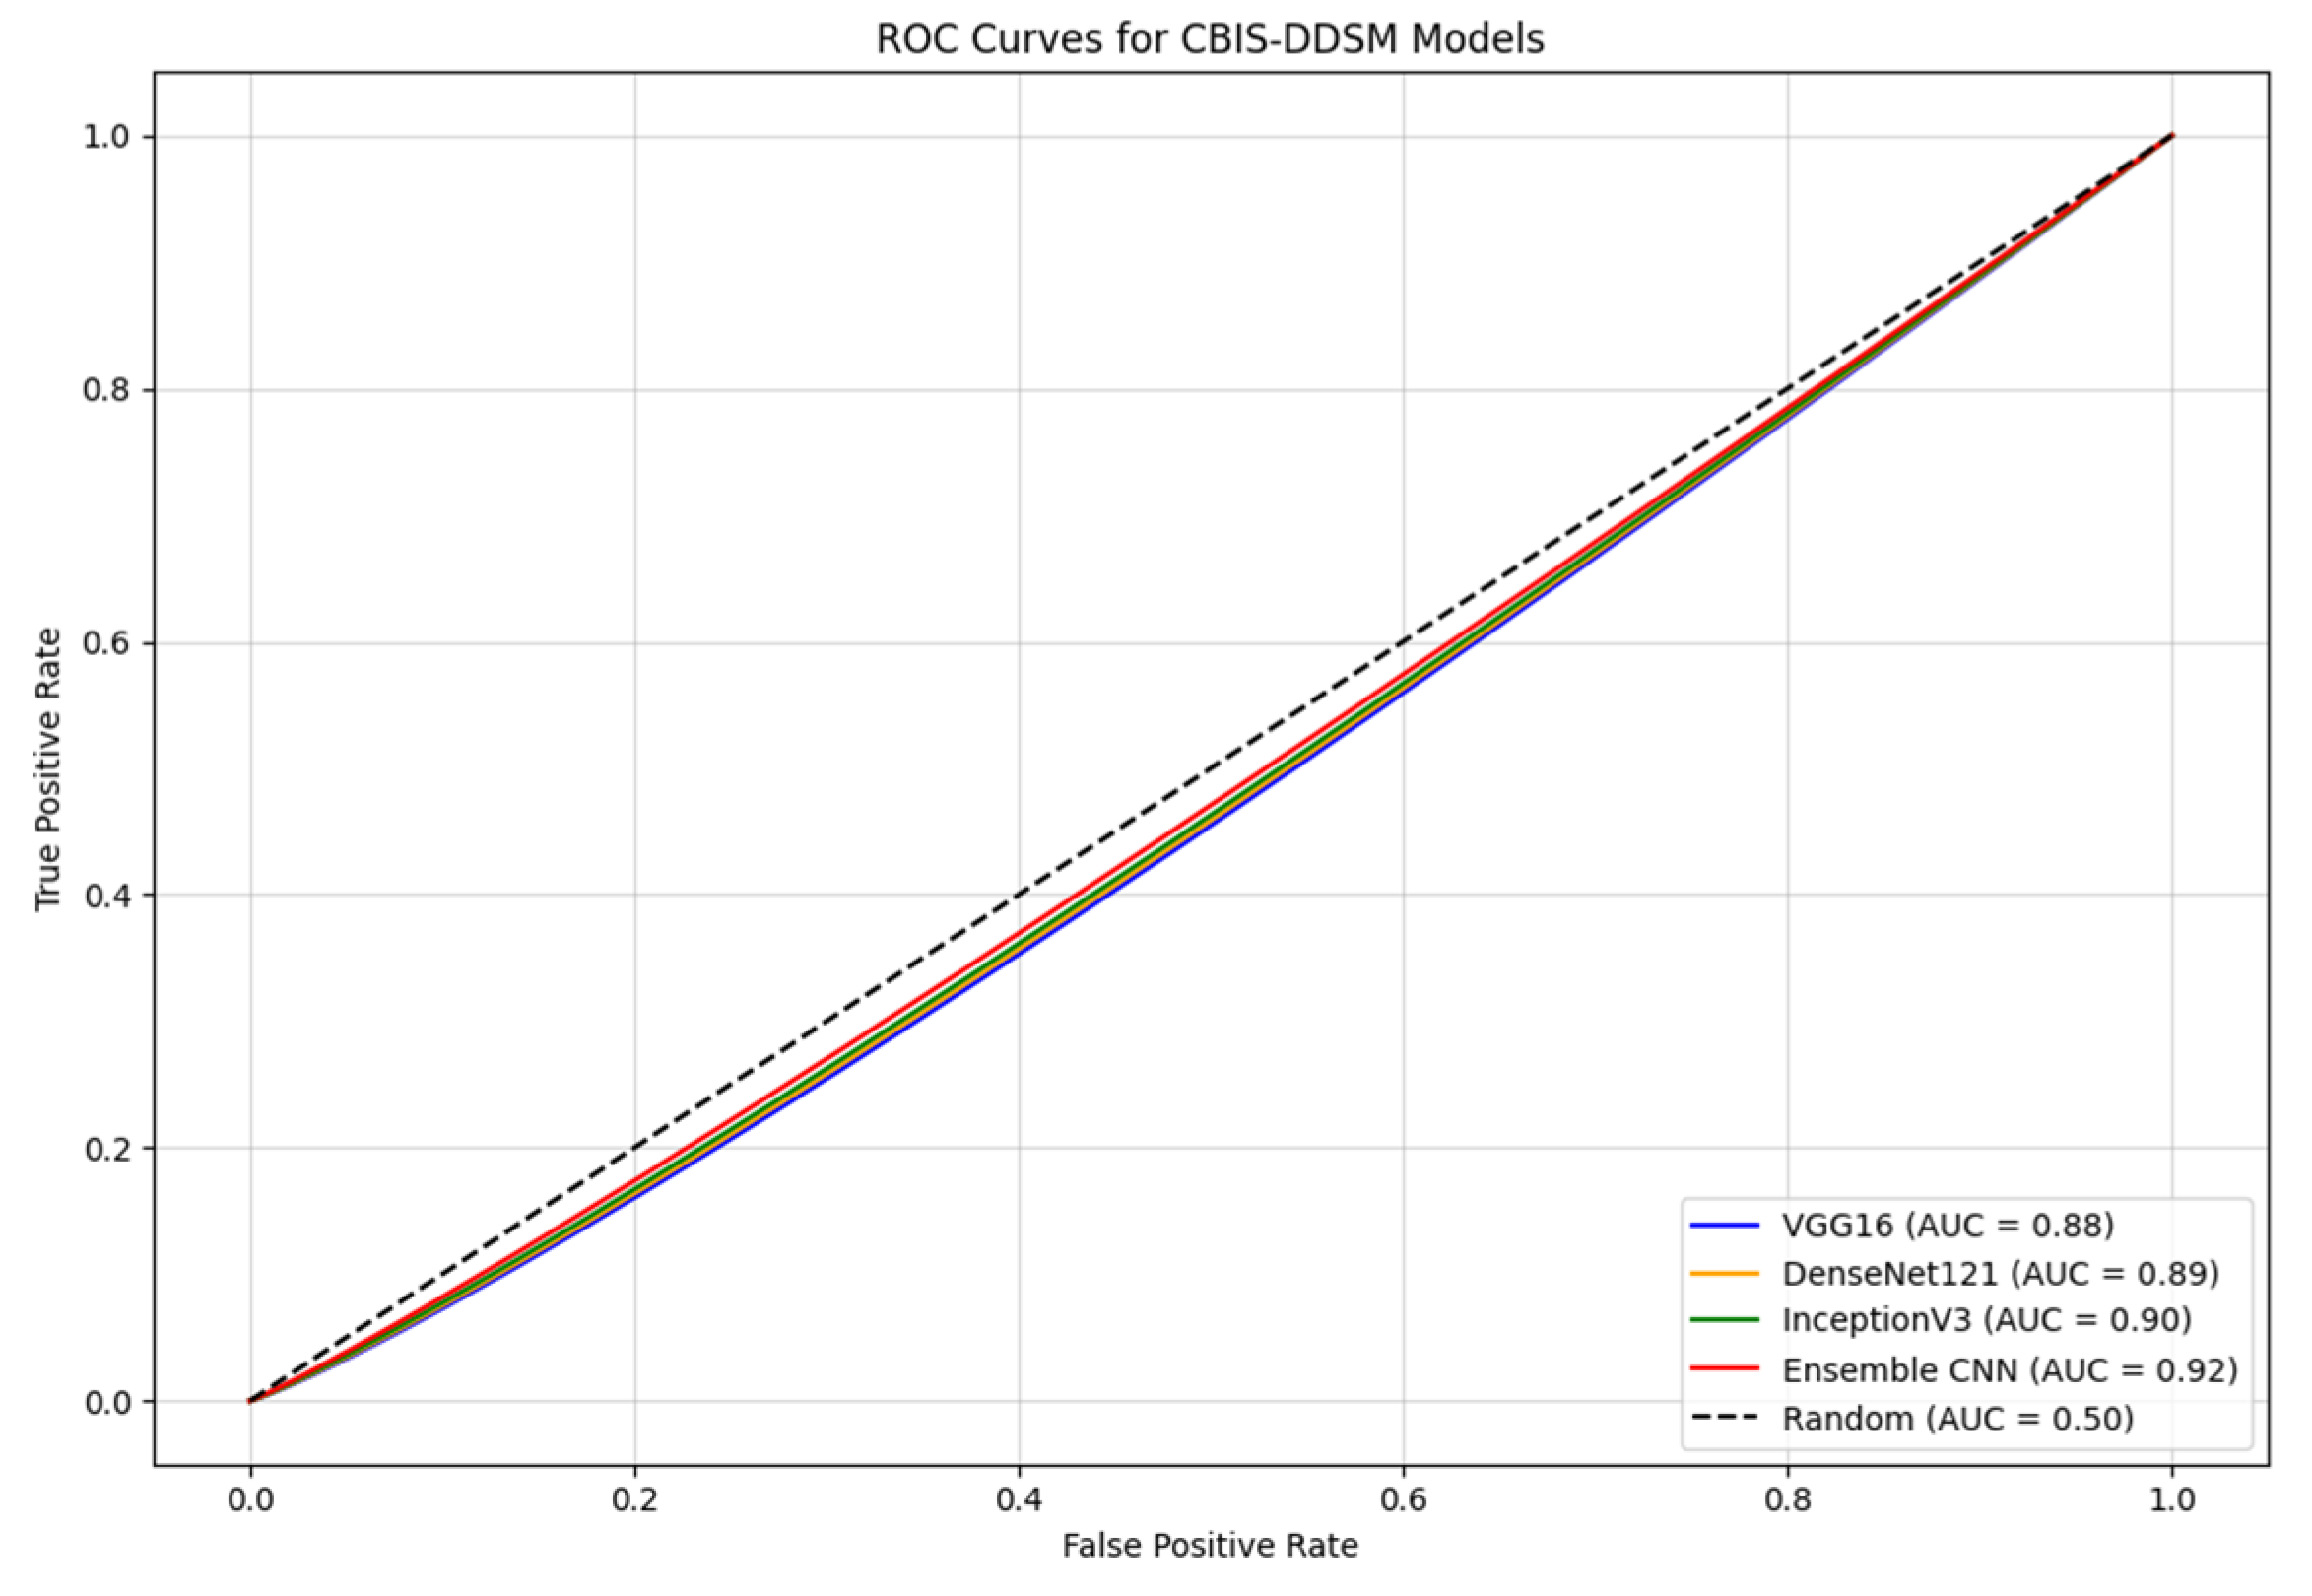
  • The Ensemble CNN achieves the highest AUC of 0.92, showcasing its ability to integrate the strengths of the individual models to achieve a robust and accurate classification.
  • InceptionV3 and DenseNet121 demonstrate strong performance, with AUC values of 0.90 and 0.89, respectively. Their advanced architectures contribute to their capacity to effectively extract relevant features from mammographic images.
  • VGG16, while slightly trailing with an AUC of 0.88, still shows competitive performance, making it a viable option for feature extraction in this dataset.
The diagonal line in the plot represents random guessing (AUC = 0.50), highlighting the significant performance gap between the models and a baseline classifier.
The ROC curves emphasize the Ensemble CNN’s advantage in detecting breast cancer cases with improved accuracy and reduced false positives, making it a valuable tool for clinical decision making in diverse imaging conditions. By leveraging the complementary strengths of the individual models, the Ensemble CNN minimizes the trade-offs often encountered in standalone architectures, achieving a balance that enhances diagnostic reliability.

4.3.6. Confusion Matrix

Figure 13 illustrates the confusion matrices for the CBIS-DDSM dataset, comparing the performance of VGG16, DenseNet121, InceptionV3, and the Ensemble CNN. These matrices provide a comprehensive breakdown of the models’ classification outcomes, including true positives, true negatives, false positives, and false negatives. Among the individual models, InceptionV3 shows notable performance with the fewest false positives (8), while DenseNet121 achieves a balanced classification with improved true positive rates. However, the Ensemble CNN surpasses all individual models by significantly reducing false negatives (14) and false positives (8), highlighting its superior ability to detect malignant cases accurately while minimizing false alarms. This improvement is critical in breast cancer detection, as it reduces the risk of missed diagnoses and unnecessary follow-up procedures.
The Ensemble CNN’s robust performance underscores its effectiveness in integrating the strengths of individual architectures, resulting in a more reliable and balanced classification system suitable for clinical applications.

4.4. General Observations Across Both Datasets

The comparative analysis of the INbreast and CBIS-DDSM datasets highlights critical insights into the performance of the proposed models across different contexts. These differences can be attributed to the inherent characteristics of each dataset, which influence the challenges and opportunities for breast cancer detection models.
The INbreast dataset, characterized by its high-quality, well-annotated images, allows models to perform with higher accuracy and precision. The controlled imaging conditions and detailed annotations enable the detection of subtle patterns such as microcalcifications and masses, leading to fewer false positives and negatives. The ensemble model, in particular, demonstrates remarkable performance on this dataset, leveraging the complementary strengths of the individual architectures.
In contrast, the CBIS-DDSM dataset presents a more diverse and challenging environment, with larger variability in imaging quality, annotation precision, and clinical conditions. These factors contribute to the increased complexity of the detection task, resulting in slightly lower accuracy and precision across all models. The ensemble model continues to outperform the individual models, showcasing its robustness and generalizability in handling heterogeneous data.
Key factors contributing to the performance differences include the following:
  • Dataset size and diversity: CBIS-DDSM’s larger size and greater variability test the scalability and adaptability of the models, while INbreast’s smaller, homogeneous dataset provides a controlled setting ideal for transfer learning.
  • Annotation quality: The precise annotations in INbreast facilitate better feature learning, while the variability in CBIS-DDSM annotations poses additional challenges for training and validation.
  • Clinical variability: CBIS-DDSM includes a broader spectrum of cases and imaging conditions, increasing the complexity of classification tasks compared with the more uniform INbreast dataset.
  • Model generalization: The ensemble model consistently exhibits the ability to generalize better across both datasets, achieving a balanced trade-off between sensitivity and specificity, particularly crucial in clinical decision making.
These observations underline the importance of leveraging complementary datasets to evaluate model performance comprehensively. The results demonstrate that while high-quality datasets like INbreast enhance model accuracy, diverse datasets like CBIS-DDSM are critical for assessing robustness and scalability in real-world scenarios.

4.5. Analysis of Data Augmentation Techniques and Impact on Dataset Balancing

Data augmentation was strategically employed to address class imbalance and enhance model generalization. Techniques such as rotation, flipping, zooming, and intensity adjustments were applied to both the INbreast and CBIS-DDSM datasets. This approach aimed to increase the representation of minority classes, particularly malignant cases, while preserving the natural diversity of the datasets.
An analysis of the impact of data augmentation reveals the following improvements:
1.
Reduction in Class Imbalance:
  • Augmentation significantly increased the availability of underrepresented classes, ensuring a more balanced dataset distribution for training.
  • For INbreast, this was particularly effective in compensating for the limited dataset size, amplifying the representation of malignant samples.
  • In CBIS-DDSM, augmentation provided robust examples for minority classes across a broader spectrum of imaging conditions.
2.
Improved Generalization:
  • By exposing the models to diverse augmented samples, data augmentation reduced overfitting, leading to enhanced validation performance.
  • Augmented datasets improved the sensitivity of the models, particularly for detecting malignant cases, as shown in the reduced false negatives in the confusion matrices.
3.
Enhanced Model Performance:
  • Both datasets benefited from augmentation, with the models achieving higher F1-scores and accuracy metrics, especially the Ensemble CNN, which capitalized on the enriched data.
In this article, data augmentation served as a pivotal strategy not just for balancing datasets but also for improving the robustness and reliability of the models. This targeted augmentation allowed the models to handle diverse imaging scenarios effectively without redundancy in results or analysis.

5. Discussion

This article proposes an ensemble approach leveraging three well-established convolutional neural networks (CNNs)—VGG16, DenseNet121, and InceptionV3—to enhance breast cancer detection using mammography images. The model was evaluated on two widely used datasets, INbreast and CBIS-DDSM, to assess its robustness and adaptability. The results highlight the ensemble model’s ability to consistently outperform individual architectures, achieving higher accuracy, sensitivity, and specificity—metrics critical for clinical decision making.
The ensemble model demonstrated remarkable performance on the INbreast dataset, achieving an AUC of 0.96 and exhibiting significant reductions in false positives and false negatives. These results reflect the advantages of combining complementary CNN architectures to capture visual features at different scales, improving the detection of both benign and malignant masses. On the CBIS-DDSM dataset, the model maintained a strong performance, with an AUC of 0.92, despite the challenges posed by the larger dataset size and greater variability in imaging quality and clinical conditions. This adaptability underscores the potential of ensemble methods for diverse clinical applications.
The observed disparity in performance between the datasets emphasizes the influence of dataset characteristics on model outcomes. INbreast, with its high-resolution images and consistent annotations, provided an optimal environment for feature extraction, resulting in superior accuracy and precision. In contrast, the CBIS-DDSM dataset, with its larger size and heterogeneous nature, introduced greater complexity, which impacted the ensemble model’s ability to generalize. These findings underscore the need for further optimization of model architectures to handle diverse datasets more effectively.

5.1. Experimental Environment

All experiments were conducted on Google Colab Pro, utilizing the following computational resources:
  • CPU: Google Compute Engine
  • GPU: NVIDIA T4
  • RAM: 15 GB
  • Storage: 112.6 GB.
This environment facilitated efficient training and validation of the models, particularly given the computational demands of ensemble learning and data augmentation.

5.2. Key Findings

The analysis of the results across both datasets highlights significant trends and insights into the performance of the Ensemble CNN model compared with the individual architectures. These findings underscore the strengths and limitations of the proposed approach in the context of breast cancer detection.
  • The ensemble model consistently outperformed individual CNN architectures, achieving higher accuracy, sensitivity, and specificity across both datasets.
  • The INbreast dataset provided an ideal testing environment, resulting in higher performance metrics due to its high-resolution images and detailed annotations.
  • The CBIS-DDSM dataset posed greater challenges, reflecting the ensemble model’s ability to adapt to more diverse and complex imaging conditions.
  • Data augmentation proved essential in balancing the datasets, particularly for underrepresented classes like malignant cases, significantly enhancing model generalization.
  • The ensemble approach demonstrated its robustness and scalability, emphasizing its potential for real-world clinical applications.

5.3. Research Limitations

This study demonstrates the potential of ensemble deep learning models in breast cancer detection. However, certain limitations were encountered that highlight areas for improvement and further investigation. These challenges not only reflect the complexity of applying deep learning techniques to medical imaging but also point to opportunities for refining model performance and ensuring broader applicability.
The main limitations of this research are outlined below:
  • Dataset Characteristics: The limited size of the INbreast dataset restricted the model’s ability to generalize effectively, despite augmentation techniques.
The variability and annotation inconsistencies in the CBIS-DDSM dataset posed additional challenges, affecting the model’s performance on larger, more heterogeneous datasets.
  • Class Imbalance: Both datasets exhibited class imbalances, particularly in the representation of malignant cases. While data augmentation helped mitigate this issue, achieving equitable performance across all classes remains a challenge.
  • Ensemble Integration: The soft voting mechanism used for integrating predictions, although effective, may not fully exploit the complementary strengths of the individual CNN architectures. More advanced techniques, such as weighted voting or stacking, could further improve the model’s predictive performance.
  • Lack of Domain-Specific Pre-training: The use of ImageNet pre-training provided generalized features for transfer learning. However, pre-training on domain-specific medical datasets could enhance the model’s ability to capture more relevant features for mammographic imaging.
The findings of this study underscore the significant potential of ensemble deep learning models to improve breast cancer detection by harnessing the complementary strengths of individual CNN architectures. The results demonstrate notable enhancements in accuracy, sensitivity, and specificity, crucial for effective clinical decision making. However, the challenges associated with dataset variability and scalability highlight the necessity for further advancements in model optimization and dataset quality. These outcomes provide a solid foundation for future research, aimed at bridging the gap between theoretical advancements and practical clinical applications. Addressing these limitations and exploring advanced ensemble techniques will pave the way for the development of more robust, reliable, and interpretable diagnostic tools in breast cancer detection.

6. Conclusions and Future Work

This study underscores the effectiveness of an ensemble deep learning model in breast cancer detection, leveraging the complementary strengths of three robust CNN architectures—VGG16, DenseNet121, and InceptionV3. By integrating diverse feature extraction capabilities, the ensemble approach achieved high diagnostic accuracy, excelling in distinguishing between benign and malignant abnormalities. On the INbreast dataset, the model demonstrated remarkable metrics, including 90.1% accuracy and 88.3% sensitivity, highlighting its potential for clinical applications where precision is critical in minimizing false diagnoses. These findings emphasize the value of ensemble methods in clinical diagnostics by enhancing reliability and reducing false positives and negatives, ultimately contributing to improved patient outcomes and fewer unnecessary biopsies.
A key contribution of this work lies in its robust ensemble framework, which consistently outperformed individual models in terms of accuracy, sensitivity, and specificity. The comparative analysis of the INbreast and CBIS-DDSM datasets further underscored the influence of dataset characteristics on model performance. While the model achieved promising results on the INbreast dataset, challenges emerged with the larger and more variable CBIS-DDSM dataset, where accuracy dropped to 84.5% due to increased false positives and lower sensitivity. This discrepancy highlights the need for further optimization to maintain consistent performance across diverse imaging conditions, particularly on datasets with greater heterogeneity.
The clinical implications of this ensemble model are significant. By minimizing false negatives and false positives, it offers a reliable diagnostic tool with substantial potential for real-world applications, including decision support systems for radiologists and mobile health technologies for underserved regions. Expanding the model’s applicability to other imaging modalities could further broaden its impact in medical diagnostics, advancing precision medicine and improving healthcare accessibility.
Despite its promise, this study also identifies areas for future research. Advancing the ensemble methodology through techniques like weighted voting or stacking could further enhance the integration of the individual model predictions. The creation of larger, more diverse datasets with standardized annotations would be instrumental in improving the model’s training and generalization. Additionally, incorporating Explainable AI (XAI) methods would increase the transparency and interpretability of the models, encouraging their adoption in clinical settings.
This study provides a strong foundation for the development of ensemble-based deep learning models in medical imaging. Through ongoing refinement and the exploration of advanced techniques, these approaches have the potential to become essential tools in the diagnostic toolkit, contributing to improved breast cancer detection, better patient outcomes, and enhanced healthcare equity.

Author Contributions

Conceptualization, A.E.A., O.E.-R., Y.K. and Y.M.; methodology, A.E.A., O.E.-R. and Y.K.; software, Y.K.; validation, A.E.A., O.E.-R., Y.K., Y.M. and M.Z.; formal analysis, A.E.A., O.E.-R. and Y.K.; investigation, A.E.A., O.E.-R. and Y.K.; resources, A.E.A., O.E.-R. and Y.K.; data curation, Y.K.; writing—original draft prepa-ration, Y.K.; writing—review and editing, A.E.A., O.E.-R. and Y.K.; visualization, Y.K.; supervision, A.E.A., O.E.-R. and Y.K.; project administration, Y.K.; funding acquisition, Y.M. All authors have read and agreed to the published version of the manuscript.

Funding

This research received no external funding.

Institutional Review Board Statement

Not applicable.

Informed Consent Statement

Not applicable.

Data Availability Statement

No new data were created or analyzed in this study. Data sharing is not applicable to this article.

Conflicts of Interest

The authors declare no conflicts of interest.

References

  1. Breast Cancer. Available online: https://www.who.int/news-room/fact-sheets/detail/breast-cancer (accessed on 29 November 2024).
  2. Wilkinson, L.; Gathani, T. Understanding breast cancer as a global health concern. Br. J. Radiol. 2022, 95, 20211033. [Google Scholar] [CrossRef] [PubMed]
  3. Arnold, M.; Morgan, E.; Rumgay, H.; Mafra, A.; Singh, D.; Laversanne, M.; Vignat, J.; Gralow, J.R.; Cardoso, F.; Siesling, S.; et al. Current and future burden of breast cancer: Global statistics for 2020 and 2040. Breast 2022, 66, 15–23. [Google Scholar] [CrossRef] [PubMed]
  4. Barclay, J.; Ernster, V.; Kerlikowske, K.; Grady, D.; Sickles, E.A. Comparison of risk factors for ductal carcinoma in situ and invasive breast cancer. J. Natl. Cancer Inst. 1997, 89, 76–82. [Google Scholar] [CrossRef] [PubMed]
  5. Kerlikowske, K. Epidemiology of ductal carcinoma in situ. J. Natl. Cancer Inst. Monogr. 2010, 2010, 139–141. [Google Scholar] [CrossRef]
  6. Goh, C.W.; Wu, J.; Ding, S.; Lin, C.; Chen, X.; Huang, O.; Chen, W.; Li, Y.; Shen, K.; Zhu, L. Invasive ductal carcinoma with coexisting ductal carcinoma in situ (IDC/DCIS) versus pure invasive ductal carcinoma (IDC): A comparison of clinicopathological characteristics, molecular subtypes, and clinical outcomes. J. Cancer Res. Clin. Oncol. 2019, 145, 1877–1886. [Google Scholar] [CrossRef]
  7. Biglia, N.; Maggiorotto, F.; Liberale, V.; Bounous, V.; Sgro, L.; Pecchio, S.; D’Alonzo, M.; Ponzone, R. Clinical-pathologic features, long term-outcome and surgical treatment in a large series of patients with invasive lobular carcinoma (ILC) and invasive ductal carcinoma (IDC). Eur. J. Surg. Oncol. 2013, 39, 455–460. [Google Scholar] [CrossRef]
  8. Barroso-Sousa, R.; Metzger-Filho, O. Differences between invasive lobular and invasive ductal carcinoma of the breast: Results and therapeutic implications. Ther. Adv. Med. Oncol. 2016, 8, 261–266. [Google Scholar] [CrossRef]
  9. Wang, P.; Chen, J.; Zhao, W. Overview of Early Detection for Breast Cancer: Current Status and Future Perspectives. J. Mod. Med Oncol. 2023, 3, 10. [Google Scholar] [CrossRef]
  10. Ekpo, E.U.; Alakhras, M.; Brennan, P. Errors in mammography cannot be solved through technology alone. Asian Pac. J. Cancer Prev. APJCP 2018, 19, 291–301. [Google Scholar]
  11. Das, D.K. Artificial intelligence technologies for breast cancer screening. Oncol. Times 2021, 43, 20–21. [Google Scholar] [CrossRef]
  12. Drukteinis, J.S.; Mooney, B.P.; Flowers, C.I.; Gatenby, R.A. Beyond mammography: New frontiers in breast cancer screening. Am. J. Med. 2013, 126, 472–479. [Google Scholar] [CrossRef] [PubMed]
  13. Pesapane, F.; Rotili, A.; Raimondi, S.; Aurilio, G.; Lazzeroni, M.; Nicosia, L.; Latronico, A.; Pizzamiglio, M.; Cassano, E.; Gandini, S. Evolving paradigms in breast cancer screening: Balancing efficacy, personalization, and equity. Eur. J. Radiol. 2024, 172, 111321. [Google Scholar] [CrossRef] [PubMed]
  14. Abdelhafiz, D.; Yang, C.; Ammar, R.; Nabavi, S. Deep convolutional neural networks for mammography: Advances, challenges and applications. BMC Bioinform. 2019, 20, 281. [Google Scholar] [CrossRef] [PubMed]
  15. Bhowmik, A.; Eskreis-Winkler, S. Deep learning in breast imaging. BJR|Open 2022, 4, 20210060. [Google Scholar] [CrossRef]
  16. Yan, K.; Wang, X.; Lu, L.; Summers, R.M. DeepLesion: Automated mining of large-scale lesion annotations and universal lesion detection with deep learning. J. Med. Imaging 2018, 5, 036501. [Google Scholar] [CrossRef]
  17. Garrucho, L.; Kushibar, K.; Jouide, S.; Diaz, O.; Igual, L.; Lekadir, K. Domain generalization in deep learning based mass detection in mammography: A large-scale multi-center study. Artif. Intell. Med. 2022, 132, 102386. [Google Scholar] [CrossRef]
  18. Yang, Y.; Wang, S.; Liu, L.; Hickman, S.; Gilbert, F.J.; Schönlieb, C.B.; Aviles-Rivero, A.I. MammoDG: Generalisable Deep Learning Breaks the Limits of Cross-Domain Multi-Center Breast Cancer Screening. arXiv 2023, arXiv:2308.01057. [Google Scholar]
  19. Nguyen, H.T.; Lam, T.B.; Tran, Q.T.D.; Nguyen, M.T.; Chung, D.T.; Dinh, V.Q. In-context cross-density adaptation on noisy mammogram abnormalities detection. In Proceedings of the 2023 IEEE Statistical Signal Processing Workshop (SSP), Hanoi, Vietnam, 2–5 July 2023; pp. 383–387. [Google Scholar]
  20. Liu, F.; Panagiotakos, D. Real-world data: A brief review of the methods, applications, challenges and opportunities. BMC Med. Res. Methodol. 2022, 22, 287. [Google Scholar] [CrossRef]
  21. Murphy, G.; Singh, R. Comparative Analysis and Ensemble Enhancement of Leading CNN Architectures for Breast Cancer Classification. arXiv 2024, arXiv:2410.03333. [Google Scholar]
  22. Nie, K.; Chen, J.-H.; Hon, J.Y.; Chu, Y.; Nalcioglu, O.; Su, M.-Y. Quantitative analysis of lesion morphology and texture features for diagnostic prediction in breast MRI. Acad. Radiol. 2008, 15, 1513–1525. [Google Scholar] [CrossRef]
  23. Albashish, D.; Al-Sayyed, R.; Abdullah, A.; Ryalat, M.H.; Almansour, N.A. Deep CNN model based on VGG16 for breast cancer classification. In Proceedings of the 2021 International Conference on Information Technology (ICIT), Amman, Jordan, 14–15 July 2021; pp. 805–810. [Google Scholar]
  24. Bello, A.; Ng, S.-C.; Leung, M.-F. Skin Cancer Classification Using Fine-Tuned Transfer Learning of DENSENET-121. Appl. Sci. 2024, 14, 7707. [Google Scholar] [CrossRef]
  25. Pattanaik, R.K.; Mishra, S.; Siddique, M.; Gopikrishna, T.; Satapathy, S. Breast Cancer Classification from Mammogram Images Using Extreme Learning Machine-Based DenseNet121 Model. J. Sens. 2022, 2022, 2731364. [Google Scholar] [CrossRef]
  26. Al Husaini, M.A.S.; Habaebi, M.H.; Gunawan, T.S.; Islam, M.R.; Elsheikh, E.A.A.; Suliman, F.M. Thermal-based early breast cancer detection using inception V3, inception V4 and modified inception MV4. Neural Comput. Appl. 2022, 34, 333–348. [Google Scholar] [CrossRef] [PubMed]
  27. Al Husaini, M.A.S.; Habaebi, M.H.; Gunawan, T.S.; Islam, M.R.; Hameed, S.A. Automatic breast cancer detection using inception V3 in thermography. In Proceedings of the 2021 8th International Conference on Computer and Communication Engineering (ICCCE), Kuala Lumpur, Malaysia, 22–23 June 2021; pp. 255–258. [Google Scholar]
  28. Petrini, D.G.P.; Shimizu, C.; Roela, R.A.; Valente, G.V.; Folgueira, M.A.A.K.; Kim, H.Y. Breast cancer diagnosis in two-view mammography using end-to-end trained efficientnet-based convolutional network. IEEE Access 2022, 10, 77723–77731. [Google Scholar] [CrossRef]
  29. Leighton, T.G. What is ultrasound? Prog. Biophys. Mol. Biol. 2007, 93, 3–83. [Google Scholar] [CrossRef]
  30. Dalecki, D. Mechanical bioeffects of ultrasound. Annu. Rev. Biomed. Eng. 2004, 6, 229–248. [Google Scholar] [CrossRef]
  31. Whitney, H.M.; Li, H.; Ji, Y.; Liu, P.; Giger, M.L. Comparison of breast MRI tumor classification using human-engineered radiomics, transfer learning from deep convolutional neural networks, and fusion methods. Proc. IEEE 2019, 108, 163–177. [Google Scholar] [CrossRef]
  32. Mann, R.M.; Kuhl, C.K.; Kinkel, K.; Boetes, C. Breast MRI: Guidelines from the European society of breast imaging. Eur. Radiol. 2008, 18, 1307–1318. [Google Scholar] [CrossRef]
  33. Khourdifi, Y.; Bahaj, M. Applying Best Machine Learning Algorithms for Breast Cancer Prediction and Classification. In Proceedings of the 2018 International Conference on Electronics, Control, Optimization and Computer Science, Kenitra, Morocco, 5–6 December 2018; pp. 1–5. [Google Scholar] [CrossRef]
  34. Khourdifi, Y.; Bahaj, M. Selecting Best Machine Learning Techniques for Breast Cancer Prediction and Diagnosis. In Information Systems and Technologies to Support Learning: Proceedings of EMENA-ISTL 2018, Fez, Morocco, 25–27 October 2018; Springer: Cham, Switzerland, 2019; pp. 565–571. [Google Scholar]
  35. Debelee, T.G.; Schwenker, F.; Ibenthal, A.; Yohannes, D. Survey of deep learning in breast cancer image analysis. Evol. Syst. 2020, 11, 143–163. [Google Scholar] [CrossRef]
  36. Rao, C.N.; Chatrapathy, K.; Fathima, A.J.; Sathish, G.; Mukherjee, S.; Reddy, P.C.S. Intelligent Deep Learning Framework for Breast Cancer Prediction using Feature Ensemble Learning. In Proceedings of the 2023 4th IEEE Global Conference for Advancement in Technology (GCAT), Bangalore, India, 6–8 October 2023; pp. 1–5. [Google Scholar]
  37. Munshi, R.M.; Cascone, L.; Alturki, N.; Saidani, O.; Alshardan, A.; Umer, M. A novel approach for breast cancer detection using optimized ensemble learning framework and XAI. Image Vis. Comput. 2024, 142, 104910. [Google Scholar] [CrossRef]
  38. Eldin, S.N.; Hamdy, J.K.; Adnan, G.T.; Hossam, M.; Elmasry, N.; Mohammed, A. Deep learning approach for breast cancer diagnosis from microscopy biopsy images. In Proceedings of the 2021 International Mobile, Intelligent, and Ubiquitous Computing Conference (MIUCC), Cairo, Egypt, 26–27 May 2021; pp. 216–222. [Google Scholar]
  39. Amgad, N.; Ahmed, M.; Haitham, H.; Zaher, M.; Mohammed, A. A robust ensemble deep learning approach for breast cancer diagnosis. In Proceedings of the 2023 Intelligent Methods, Systems, and Applications (IMSA), Giza, Egypt, 15–16 July 2023; pp. 452–457. [Google Scholar]
  40. Kumar, D.; Batra, U. Breast cancer histopathology image classification using soft voting classifier. In Proceedings of the 3rd International Conference on Computing Informatics and Networks: ICCIN 2020, Delhi, India, 29–30 July 2020; Springer: Singapore, 2021; pp. 619–631. [Google Scholar]
  41. Montaha, S.; Azam, S.; Rafid, A.K.M.R.H.; Ghosh, P.; Hasan, Z.; Jonkman, M.; De Boer, F. BreastNet18: A high accuracy fine-tuned VGG16 model evaluated using ablation study for diagnosing breast cancer from enhanced mammography images. Biology 2021, 10, 1347. [Google Scholar] [CrossRef] [PubMed]
  42. Al-Haija, Q.A.; Manasra, G.F. Development of breast cancer detection model using transfer learning of residual neural network (resnet-50). Am. J. Sci. Eng. 2020, 1, 30–39. [Google Scholar] [CrossRef]
  43. Ali, S.; Akhlaq, F.; Imran, A.S.; Kastrati, Z.; Daudpota, S.M.; Moosa, M. The enlightening role of explainable artificial intelligence in medical & healthcare domains: A systematic literature review. Comput. Biol. Med. 2023, 166, 107555. [Google Scholar]
  44. Rane, N.; Choudhary, S.; Rane, J. Explainable Artificial Intelligence (XAI) in healthcare: Interpretable Models for Clinical Decision Support. SSRN 4637897. 2023. Available online: https://ssrn.com/abstract=4637897 (accessed on 15 November 2023).
  45. González-Alday, R.; García-Cuesta, E.; Kulikowski, C.A.; Maojo, V. A scoping review on the progress, applicability, and future of explainable artificial intelligence in medicine. Appl. Sci. 2023, 13, 10778. [Google Scholar] [CrossRef]
  46. van der Velden, B.H.; Kuijf, H.J.; Gilhuijs, K.G.; Viergever, M.A. Explainable artificial intelligence (XAI) in deep learning-based medical image analysis. Med. Image Anal. 2022, 79, 102470. [Google Scholar] [CrossRef]
  47. Zhang, X.; Zhang, Y.; Han, E.Y.; Jacobs, N.; Han, Q.; Wang, X.; Liu, J. Classification of whole mammogram and tomosynthesis images using deep convolutional neural networks. IEEE Trans. NanoBiosci. 2018, 17, 237–242. [Google Scholar] [CrossRef]
  48. Prasad, C.R.; Arun, B.; Amulya, S.; Abboju, P.; Kollem, S.; Yalabaka, S. Breast cancer classification using CNN with transfer learning models. In Proceedings of the 2023 International Conference for Advancement in Technology (ICONAT), Goa, India, 24–26 January 2023; pp. 1–5. [Google Scholar]
  49. Mohapatra, S.; Abhishek, N.V.S.; Bardhan, D.; Ghosh, A.A.; Mohanty, S. Comparison of MobileNet and ResNet CNN Architectures in the CNN-Based Skin Cancer Classifier Model. In Machine Learning for Healthcare Applications; John Wiley & Sons: Hoboken, NJ, USA, 2021; pp. 169–186. [Google Scholar]
  50. INbreast Database. Available online: https://www.kaggle.com/datasets/tommyngx/inbreast2012 (accessed on 5 September 2024).
  51. Moreira, I.C.; Amaral, I.; Domingues, I.; Cardoso, A.; Cardoso, M.J.; Cardoso, J.S. Inbreast: Toward a full-field digital mammographic database. Acad. Radiol. 2012, 19, 236–248. [Google Scholar] [CrossRef]
  52. Huang, M.-L.; Lin, T.-Y. Dataset of breast mammography images with masses. Data Brief 2020, 31, 105928. [Google Scholar] [CrossRef]
  53. CBIS-DDSM Dataset. Available online: https://www.kaggle.com/datasets/awsaf49/cbis-ddsm-breast-cancer-image-dataset (accessed on 5 September 2024).
  54. Lee, R.S.; Gimenez, F.; Hoogi, A.; Miyake, K.K.; Gorovoy, M.; Rubin, D.L. A curated mammography data set for use in computer-aided detection and diagnosis research. Sci. Data 2017, 4, 170177. [Google Scholar] [CrossRef]
Figure 1. Proposed ensemble-based CNN model for breast cancer detection.
Biomedinformatics 04 00127 g001
Figure 2. Examples of breast mammography images categorized by density and malignancy status.
Biomedinformatics 04 00127 g002
Figure 3. Example images from the CBIS-DDSM dataset categorized by breast density and view.
Biomedinformatics 04 00127 g003
Figure 4. Training and validation loss for INbreast dataset.
Biomedinformatics 04 00127 g004
Figure 5. Training and validation loss for INbreast dataset.
Biomedinformatics 04 00127 g005
Figure 6. Accuracy and precision for all models on the INbreast dataset.
Biomedinformatics 04 00127 g006
Figure 7. ROC Curves for all models on the INbreast dataset.
Biomedinformatics 04 00127 g007
Figure 8. Combined confusion matrices for the INbreast dataset.
Biomedinformatics 04 00127 g008
Figure 9. Training and validation loss for the CBIS-DDSM dataset.
Biomedinformatics 04 00127 g009
Figure 10. Training and validation accuracy for the CBIS-DDSM dataset.
Biomedinformatics 04 00127 g010
Figure 11. Accuracy and precision for all models on the CBIS-DDSM dataset.
Biomedinformatics 04 00127 g011
Figure 12. ROC curve for all models on the CBIS-DDSM dataset.
Biomedinformatics 04 00127 g012
Figure 13. Combined confusion matrices for the CBIS-DDSM dataset.
Biomedinformatics 04 00127 g013
Table 1. Comparative analysis of key studies in breast cancer detection.
AuthorsPublisher/YearAlgorithms UsedDataset(s)AdvantagesLimitations
Chintala et al. [36]IEEE Access, 2023Optimized DRNNMultiple datasetsHigh accuracy (99.16%); robust feature selection and optimizationLimited scalability to larger datasets; computational complexity
Munshi et al. [37]ScienceDirect, 2023Custom CNN + RF + SVM (ensemble)Wisconsin Breast Cancer DataAchieved 99.99% accuracy; integration of XAI improves interpretabilityDataset-specific approach; generalizability untested
Noor Eldin et al. [38]Springer, 2022DenseNet169, ResNet50, ResNet101 (ensemble)Biopsy microscopy imagesImproved accuracy to 92.5% with ensemble and augmentationLimited dataset diversity; moderate baseline performance
Amgad et al. [39]Elsevier, 2023Multi-stage ensemble (voting, weighted, meta-learning)IHC imagesBoosted F1-score to 89.2%; surpasses baseline CNN models by 22.2%High computational cost; requires balanced datasets
Kumar and Batra [40]Springer, 2023Soft voting (7 CNNs)H&E histopathology imagesAchieved 96.91% accuracy; effective combination of multiple CNNsFocused on histopathology; lacks generalizability
Montaha et al. [41]Springer, 2023BreastNet18 (fine-tuned VGG16)Augmented mammography datasetHigh test accuracy (98.02%); ablation studies improve robustnessSpecific to mammography; overfitting risks without augmentation
Al-Haija et al. [42]IEEE Access, 2023Transfer learning (ResNet50)BreakHisExceptional accuracy (99%); simple yet effective architectureLimited model diversity; lacks ensemble integration
Our Model-VGG16, DenseNet121, InceptionV3 (ensemble)INbreast, CBIS-DDSMCombines multi-scale, fine-grained, and reused features; achieved 90.1% accuracy on INbreast and 89.5% on CBIS-DDSMSlightly higher computational cost due to ensemble complexity
Table 2. Abnormality detection in INbreast dataset.
MethodAUCF1-ScoreSensitivity (%)Precision (%)Specificity (%)Accuracy (%)
VGG160.9387.286.788.187.887.4
DenseNet1210.9588.589.089.588.588.7
InceptionV30.9487.788.088.788.388.0
Ensemble0.9689.188.390.190.289.5
Table 3. Detecting of malignant cases in INbreast dataset.
MethodAUCF1-ScoreSensitivity (%)Precision (%)Specificity (%)Accuracy (%)
VGG160.9286.586.087.586.986.2
DenseNet1210.9488.288.789.088.288.4
InceptionV30.9387.487.688.587.787.3
Ensemble0.9589.088.590.089.589.3
Table 4. Detection of normal in INbreast dataset.
MethodAUCF1-ScoreSensitivity (%)Precision (%)Specificity (%)Accuracy (%)
VGG160.9488.287.888.588.088.3
DenseNet1210.9689.789.090.289.589.6
InceptionV30.9588.588.189.088.388.4
Ensemble0.9790.590.190.890.390.4
Table 5. Detection of benign in INbreast dataset.
MethodAUCF1-ScoreSensitivity (%)Precision (%)Specificity (%)Accuracy (%)
VGG160.9086.485.986.886.286.0
DenseNet1210.9287.887.388.287.587.4
InceptionV30.9187.186.787.586.986.8
Ensemble0.9388.588.188.988.388.2
Table 6. Detection of malignant in INbreast dataset.
MethodAUCF1-ScoreSensitivity (%)Precision (%)Specificity (%)Accuracy (%)
VGG160.9285.885.486.285.685.5
DenseNet1210.9487.487.088.087.287.1
InceptionV30.9386.586.287.086.486.3
Ensemble0.9588.888.489.288.688.5
Table 7. Performance comparison for abnormality detection (CBIS-DDSM dataset).
MethodAUCF1-ScoreSensitivity (%)Precision (%)Specificity (%)Accuracy (%)
VGG160.8275.574.876.275.174.7
DenseNet1210.8377.076.577.876.376.1
InceptionV30.8174.574.075.074.274.1
Ensemble0.8578.277.579.078.077.8
Table 8. Performance comparison for malignancy detection (CBIS-DDSM dataset).
MethodAUCF1-ScoreSensitivity (%)Precision (%)Specificity (%)Accuracy (%)
VGG160.8174.073.575.074.173.8
DenseNet1210.8276.275.577.075.775.4
InceptionV30.8073.773.074.573.573.2
Ensemble0.8477.176.878.077.376.9
Disclaimer/Publisher’s Note: The statements, opinions and data contained in all publications are solely those of the individual author(s) and contributor(s) and not of MDPI and/or the editor(s). MDPI and/or the editor(s) disclaim responsibility for any injury to people or property resulting from any ideas, methods, instructions or products referred to in the content.

