


Reliability and Agreement of Free Web-Based 3D Software for Computing Facial Area and Volume Measurements

 ,
,  ,
,
Abstract

1. Introduction
2. Related Concepts and Research
2.1. Reliability
2.2. Intraclass Correlation Coefficient (ICC)
2.3. Agreement
- Do the instruments produce similar results when measuring the same item? This involves looking at the differences in the measurements from the two instruments for the same subject or sample.
- Is there a consistent bias? If one instrument consistently measures higher or lower than the other, this is referred to as a bias. The Bland–Altman analysis, for example, helps identify and quantify this bias.
- How much do the measurements vary? This refers to the variability in the differences between the two instruments.
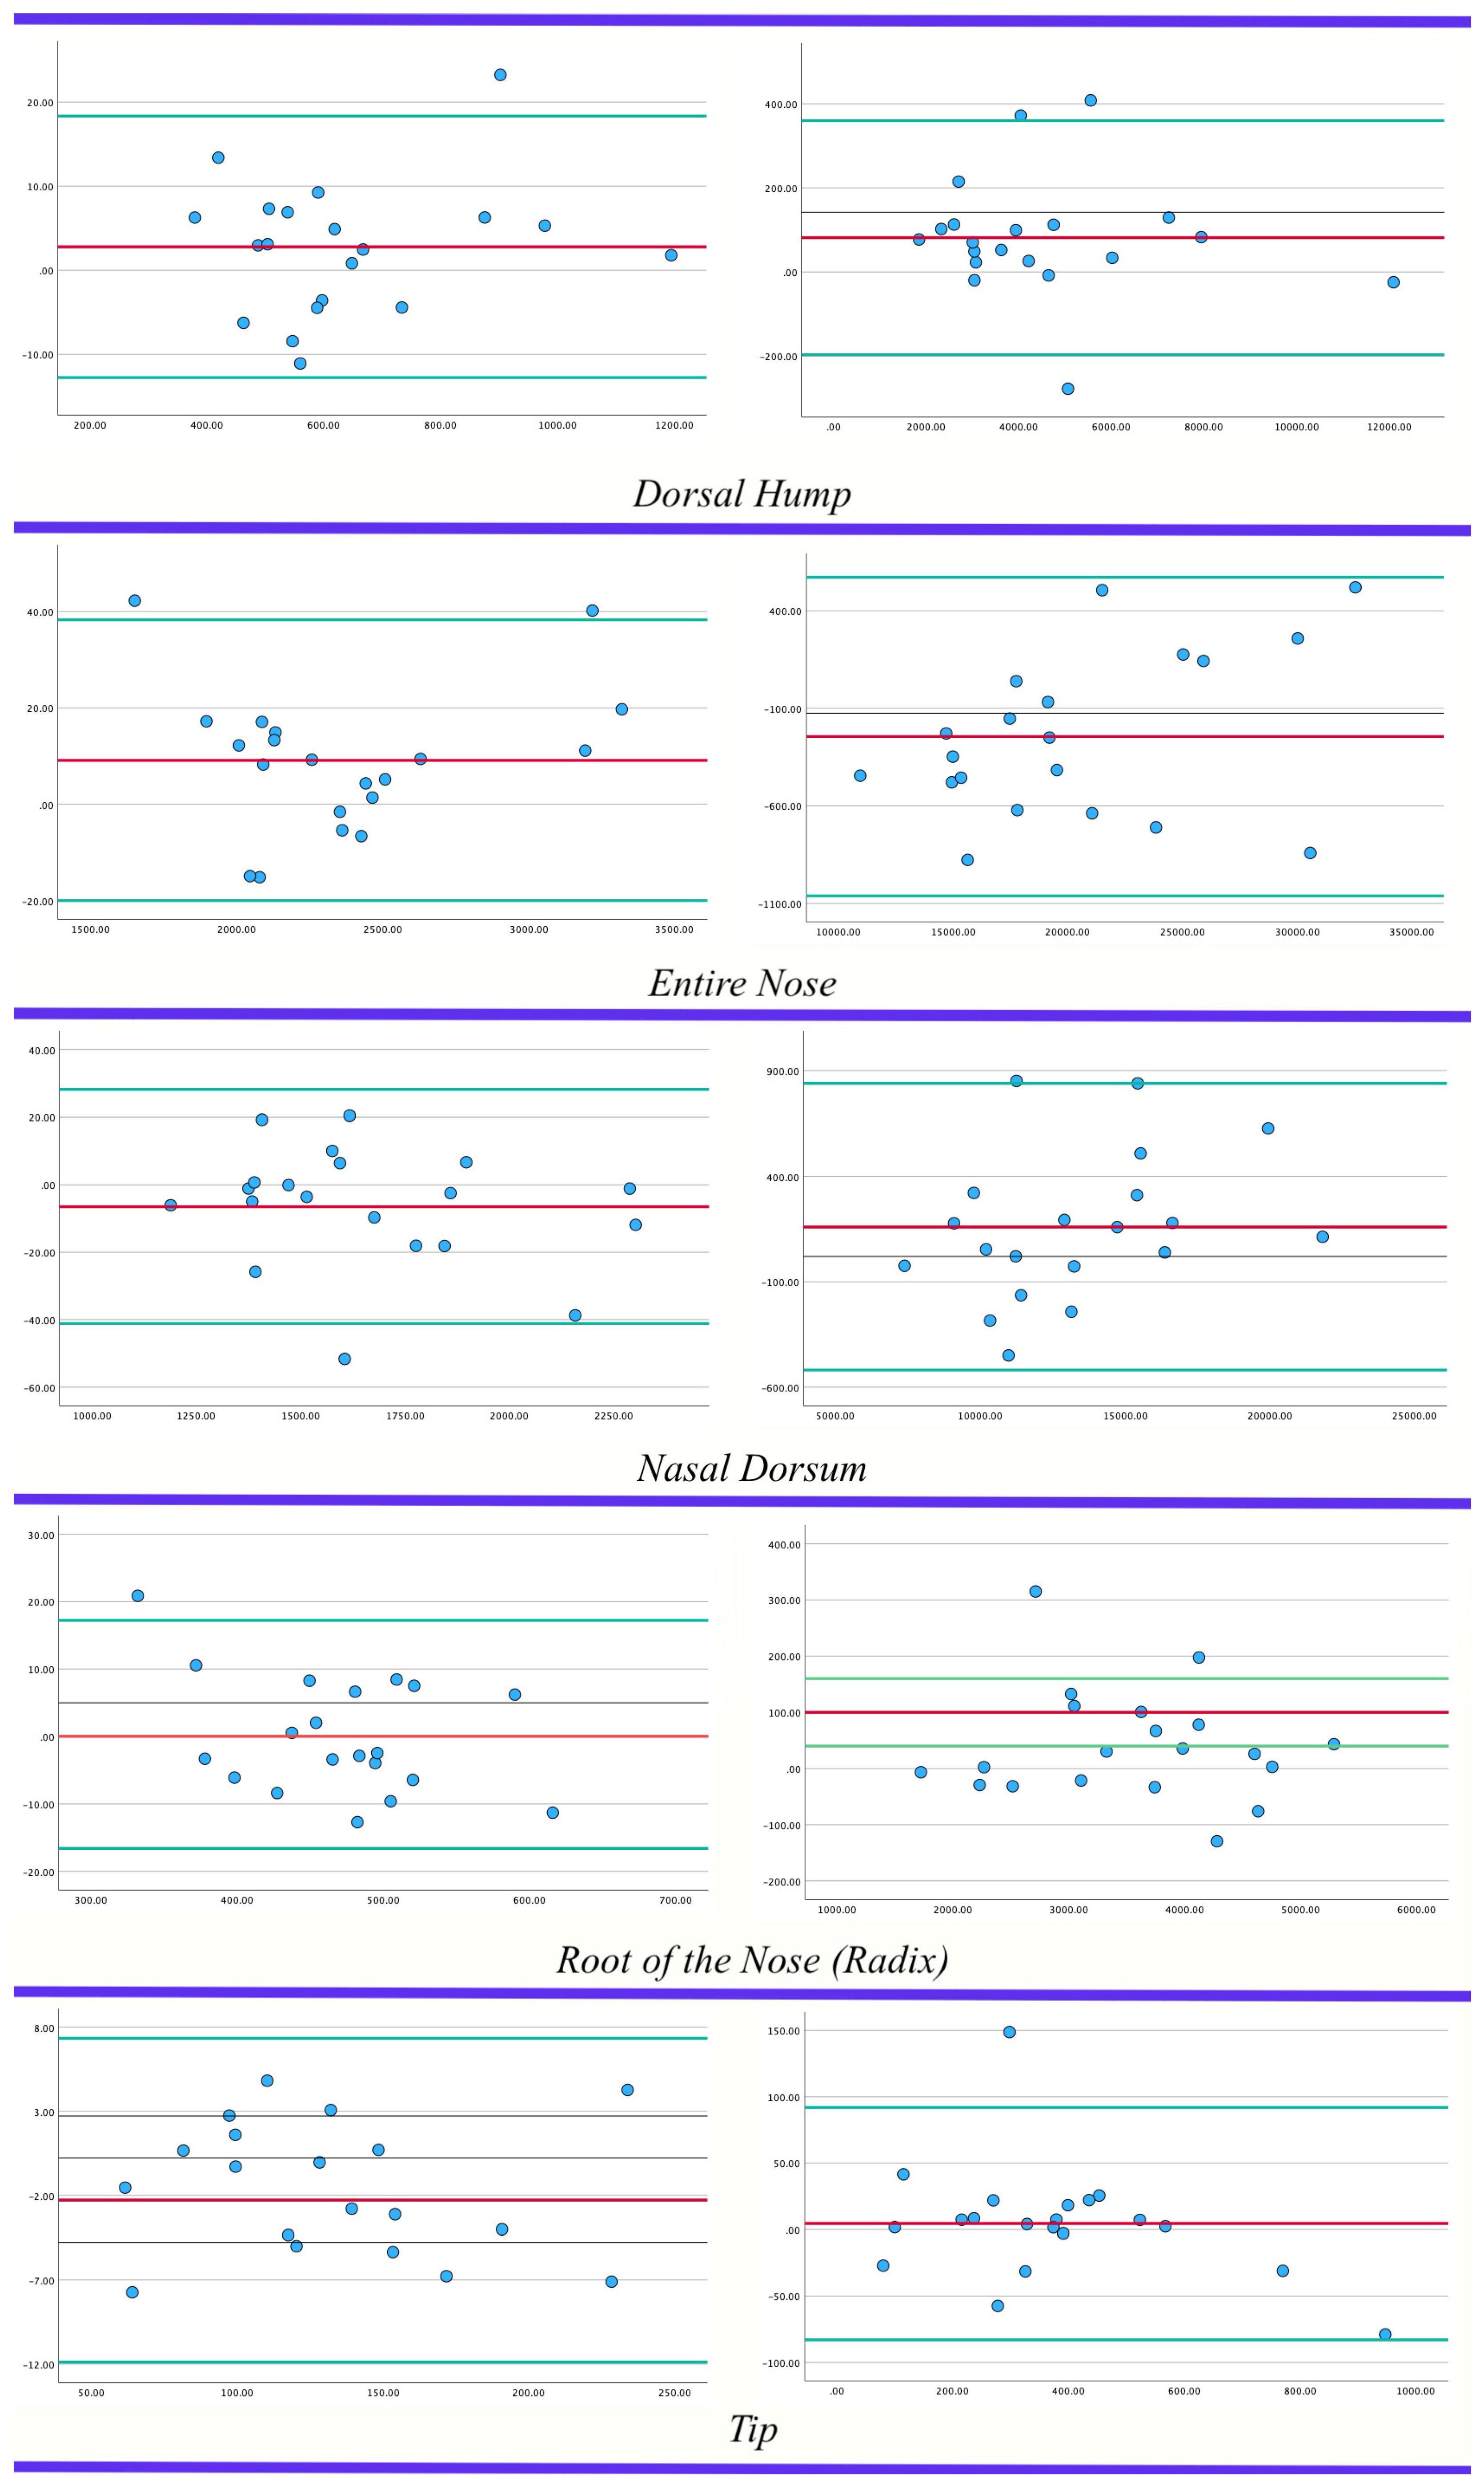
2.4. Bland–Altman Plot
- Collect Data: Two sets of measurements, taken on the same subjects or samples using two different methods, are needed.
- Calculate the Mean and Difference: For each pair of measurements, calculate the mean (average) and the difference (typically, Method 1–Method 2). Plot the mean on the x-axis and the difference on the y-axis.
- Plot the Points: On a graph, plot each pair of means and differences as a single point. The x-coordinate of the point is the mean of the two measurements, and the y-coordinate is the difference between the two measurements.
- Calculate and Plot the Average Difference (Bias): Compute the average of all of the differences. This represents the systematic bias between the two methods. Draw a horizontal line at this value on the plot.
- Calculate and Plot the Limits of Agreement: The limits of agreement are calculated as the average difference ± 1.96 times the standard deviation of the differences. These limits estimate the range in which most differences between the two measurement methods will fall. Draw two more horizontal lines on the plot: one at the upper limit of agreement and another at the lower limit.
- Analyze the Plot: The plot can now be used to assess the agreement. Points that lie within the limits of agreement suggest that the differences between the methods are not clinically significant. The distribution of points can also indicate patterns, such as increasing differences at higher measurement values. A regression analysis may also need to be performed on the differences vs. means to check if there is a proportional bias.
3. Methods and Materials
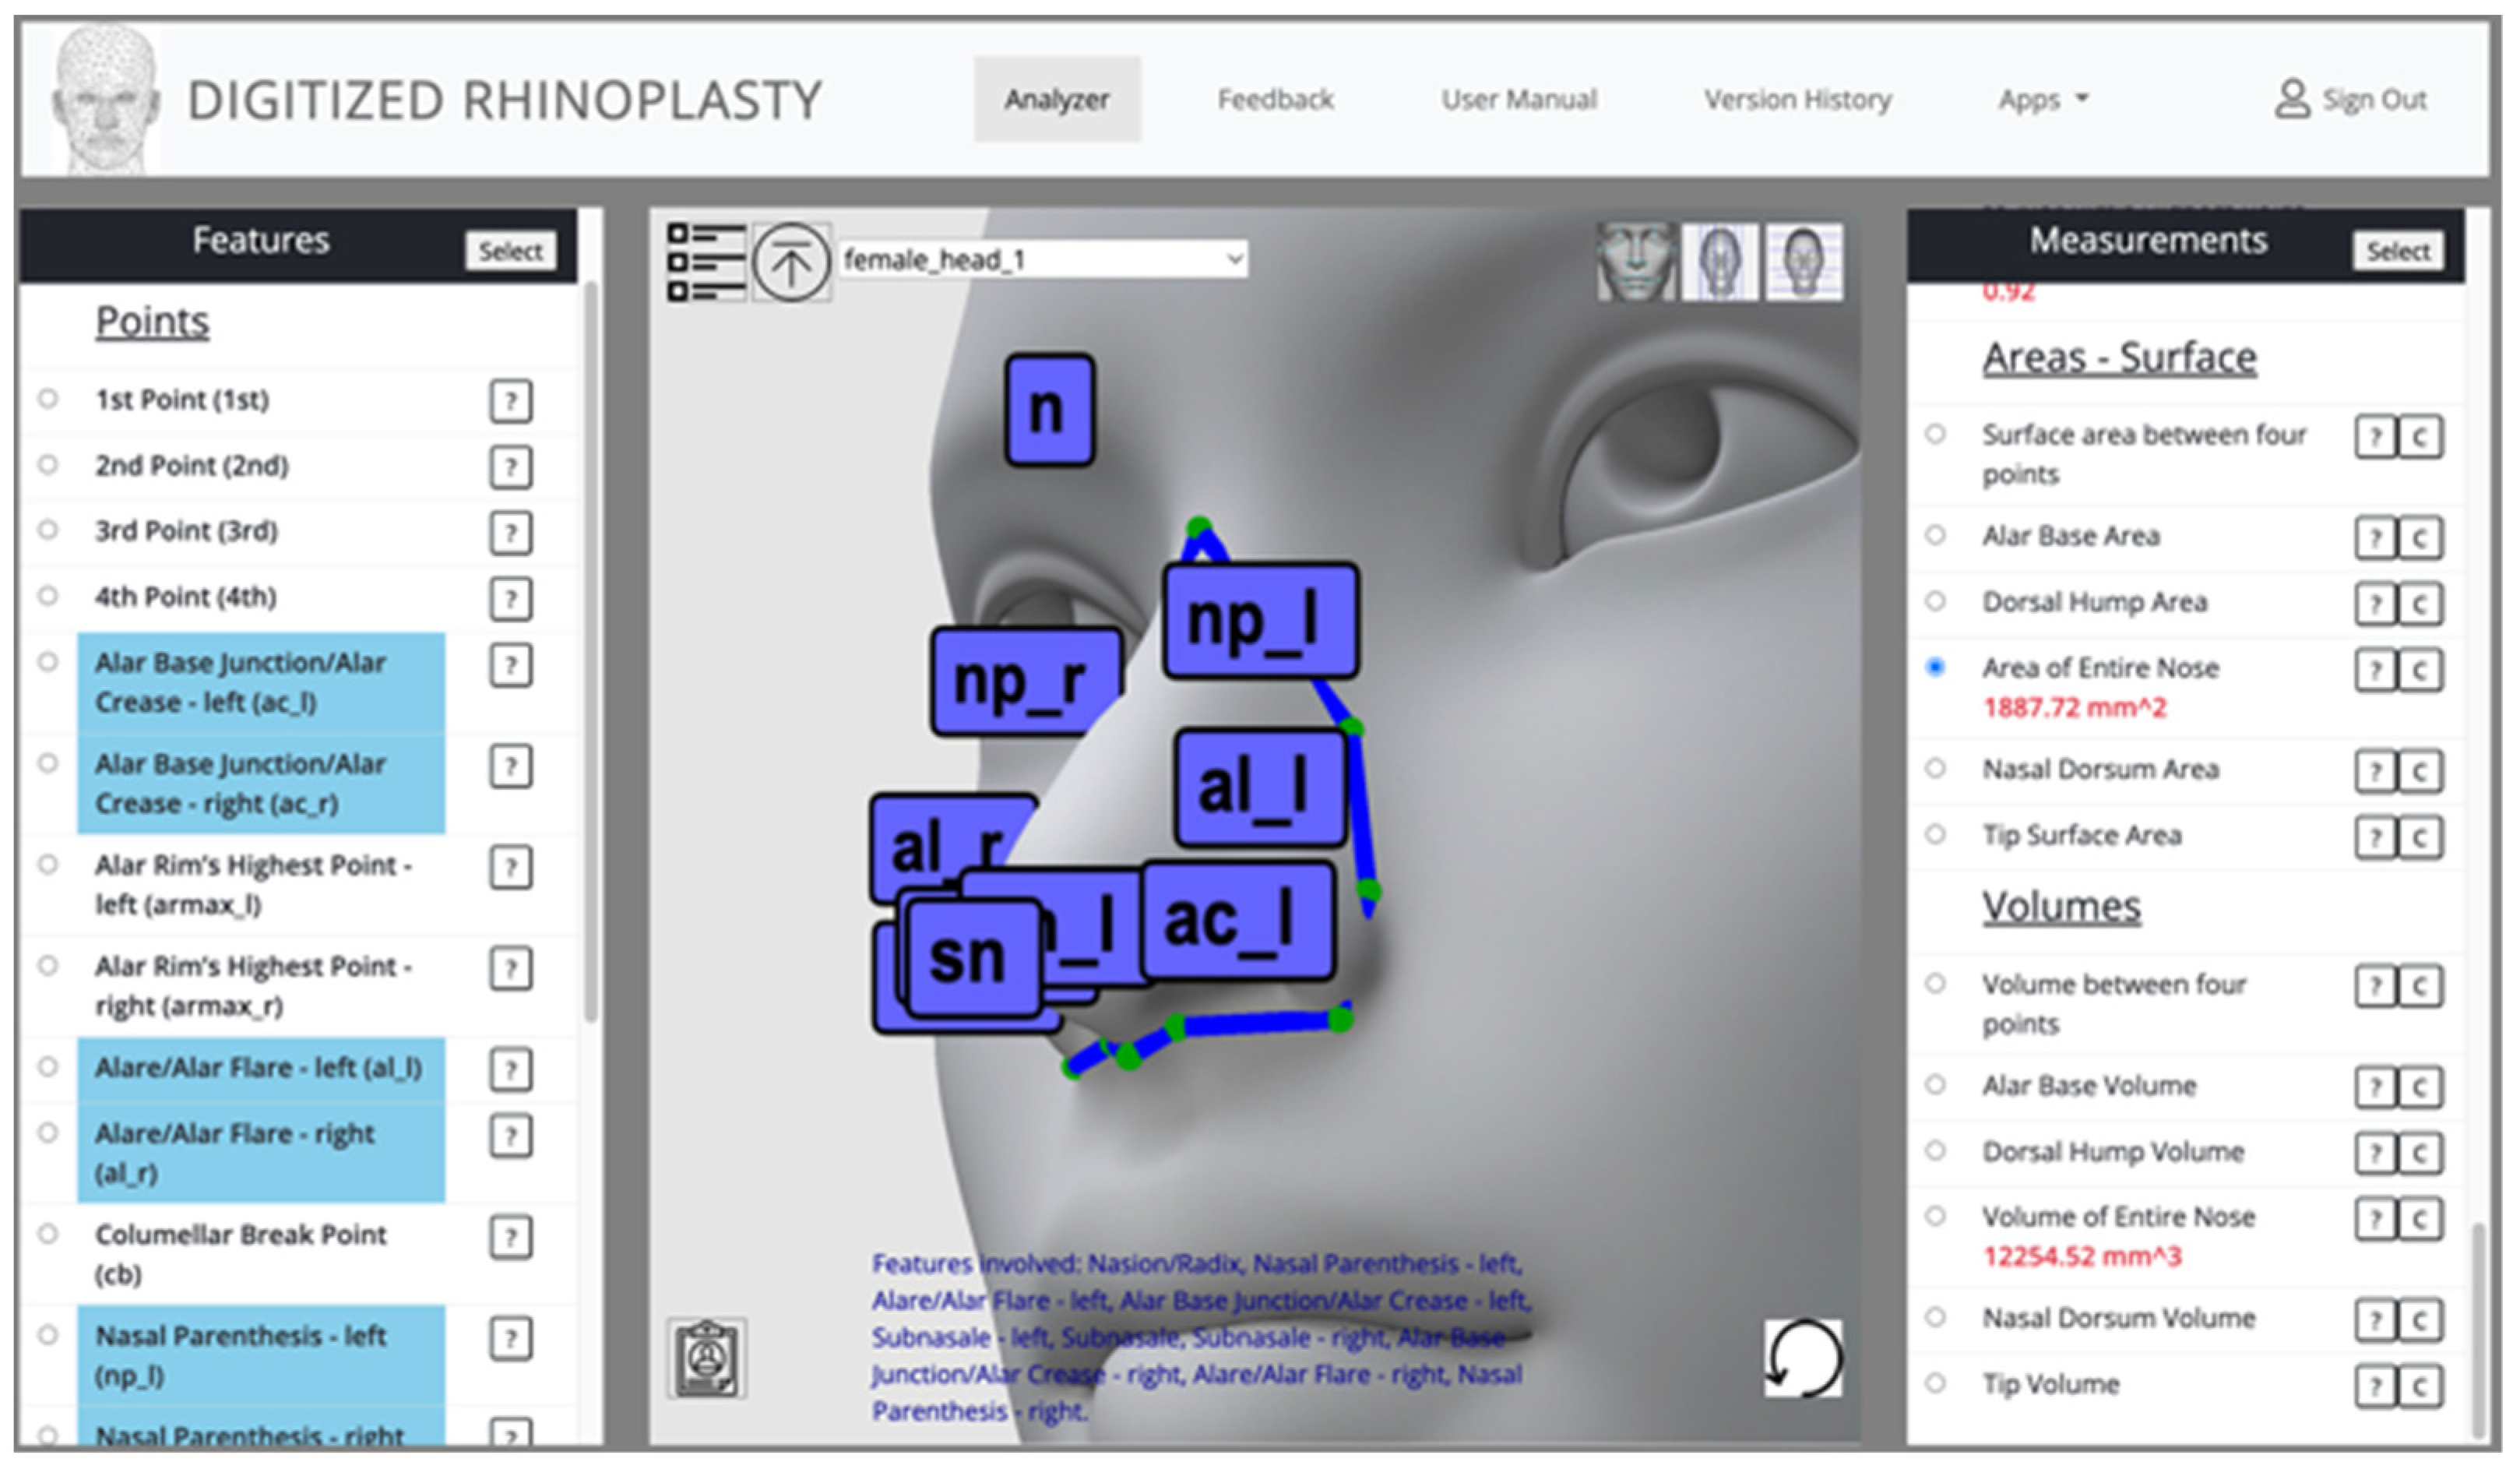
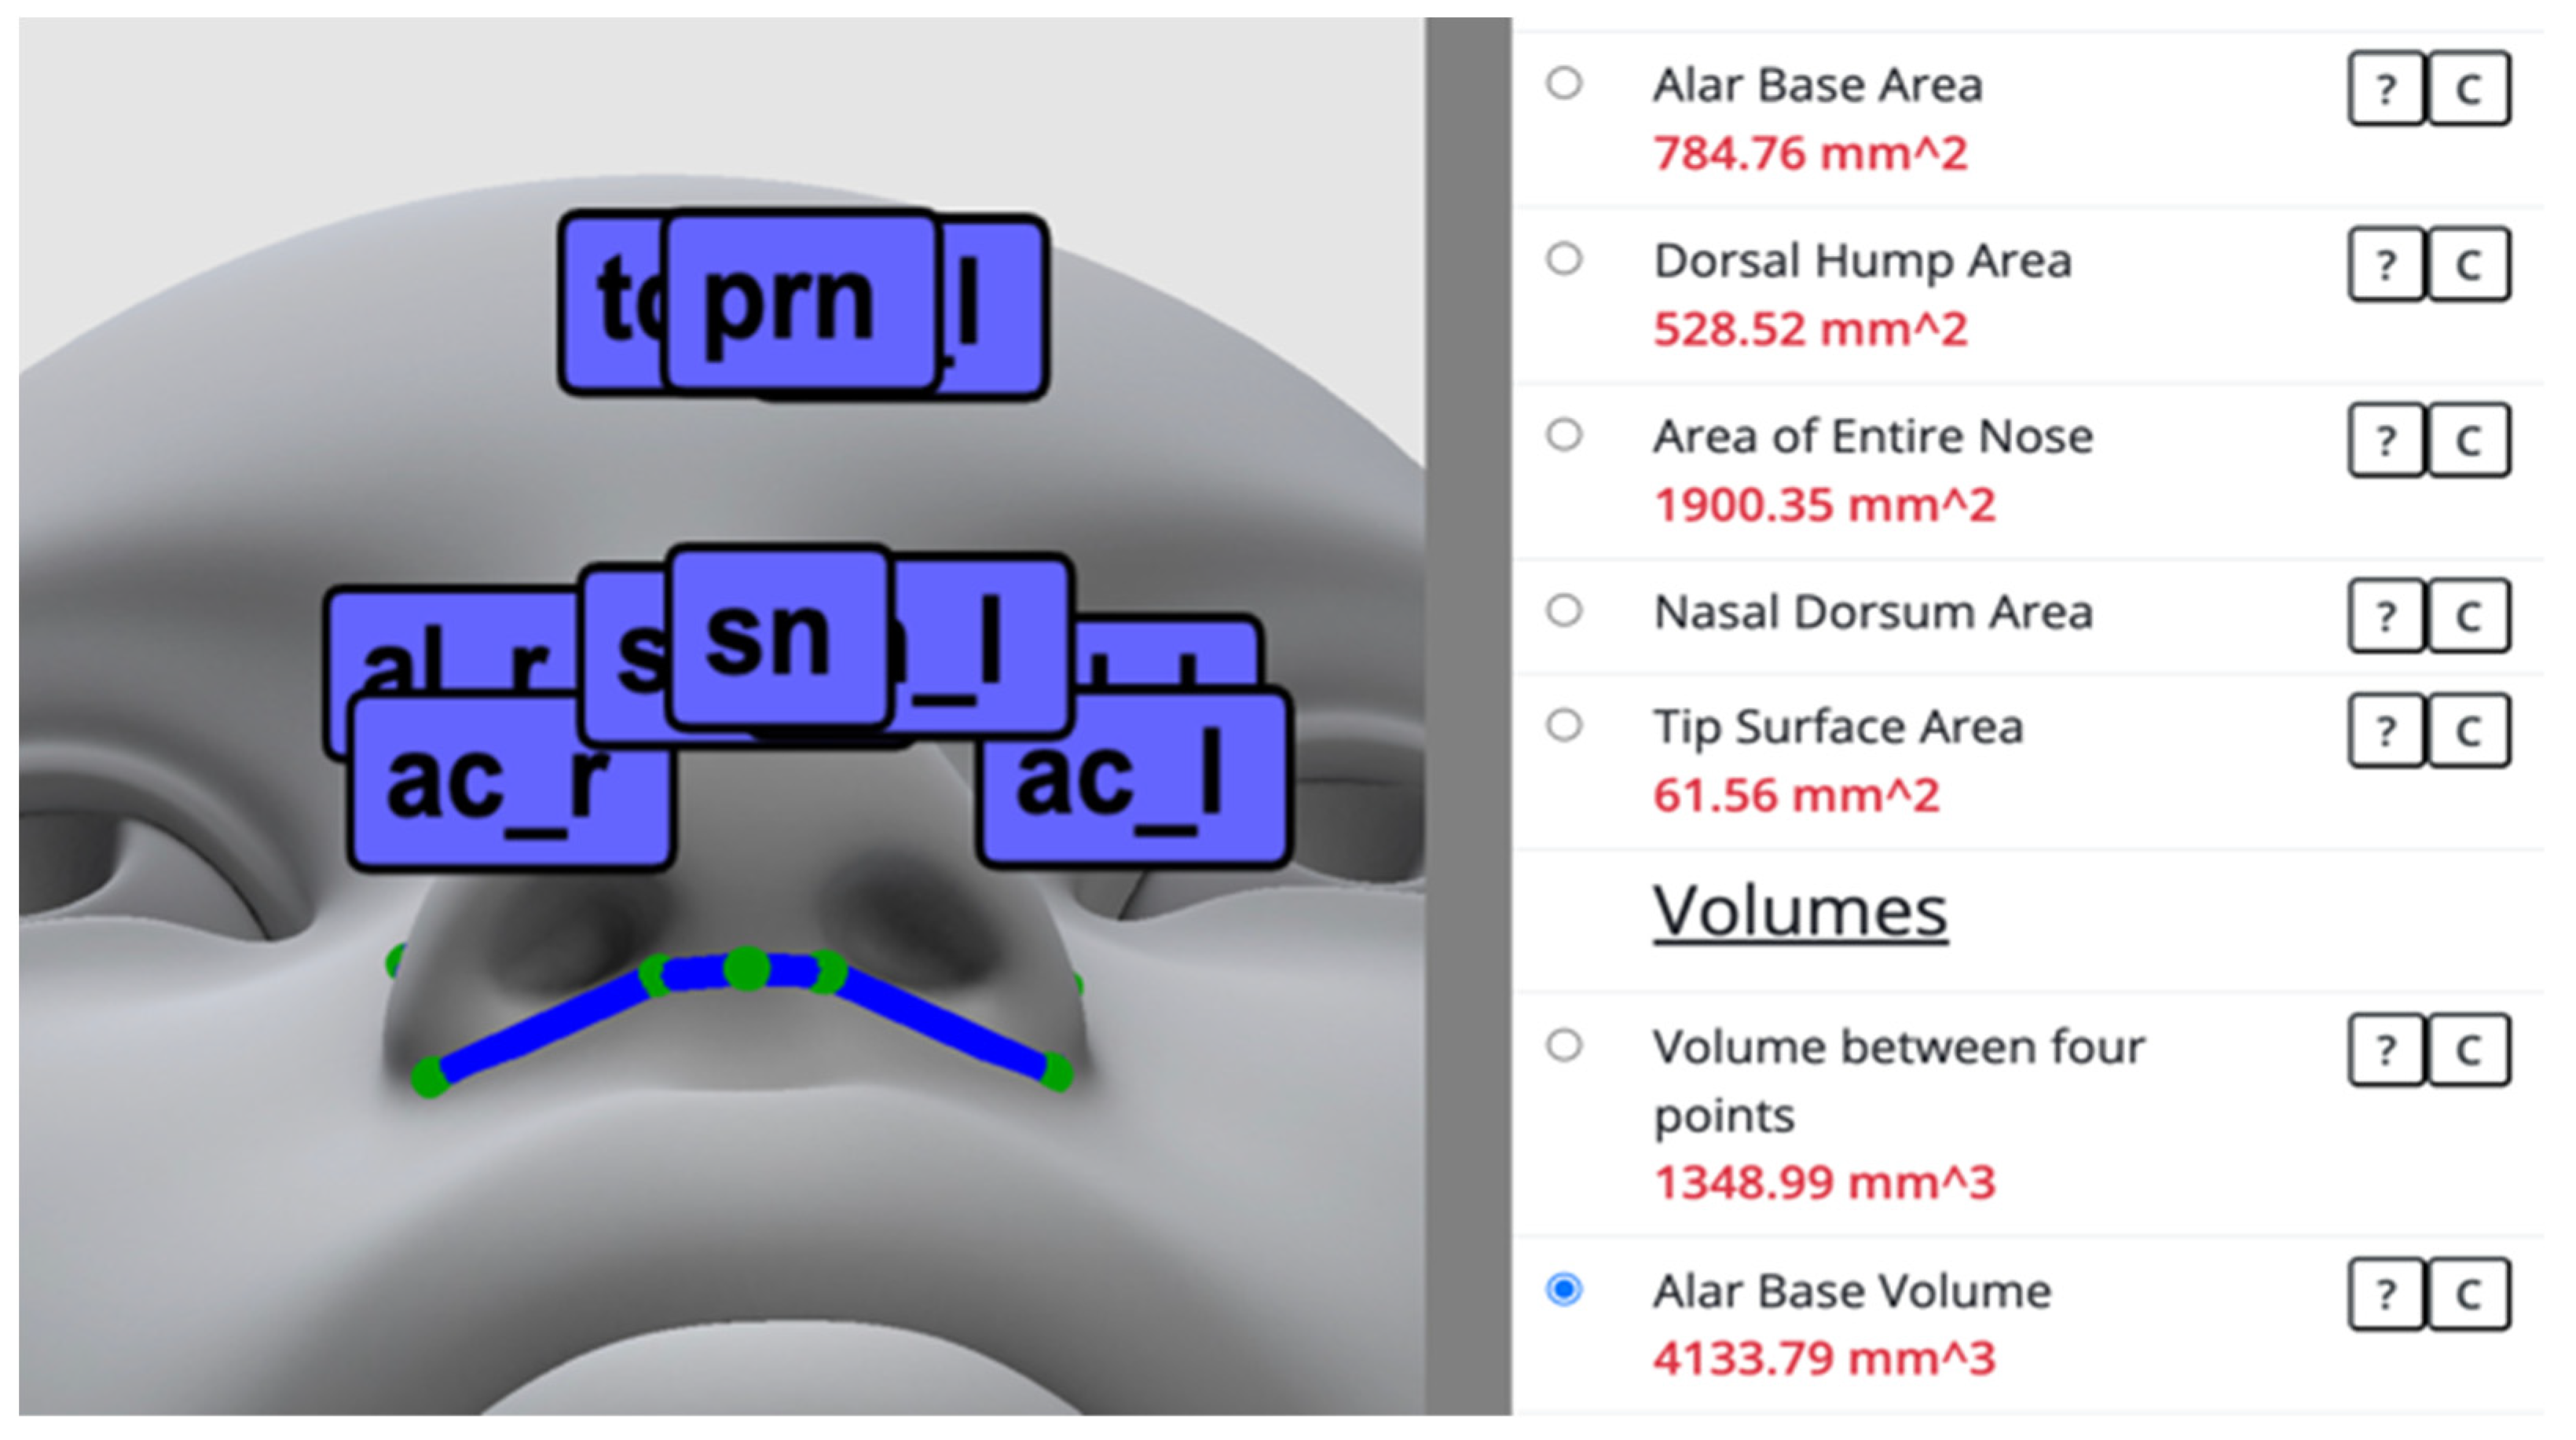
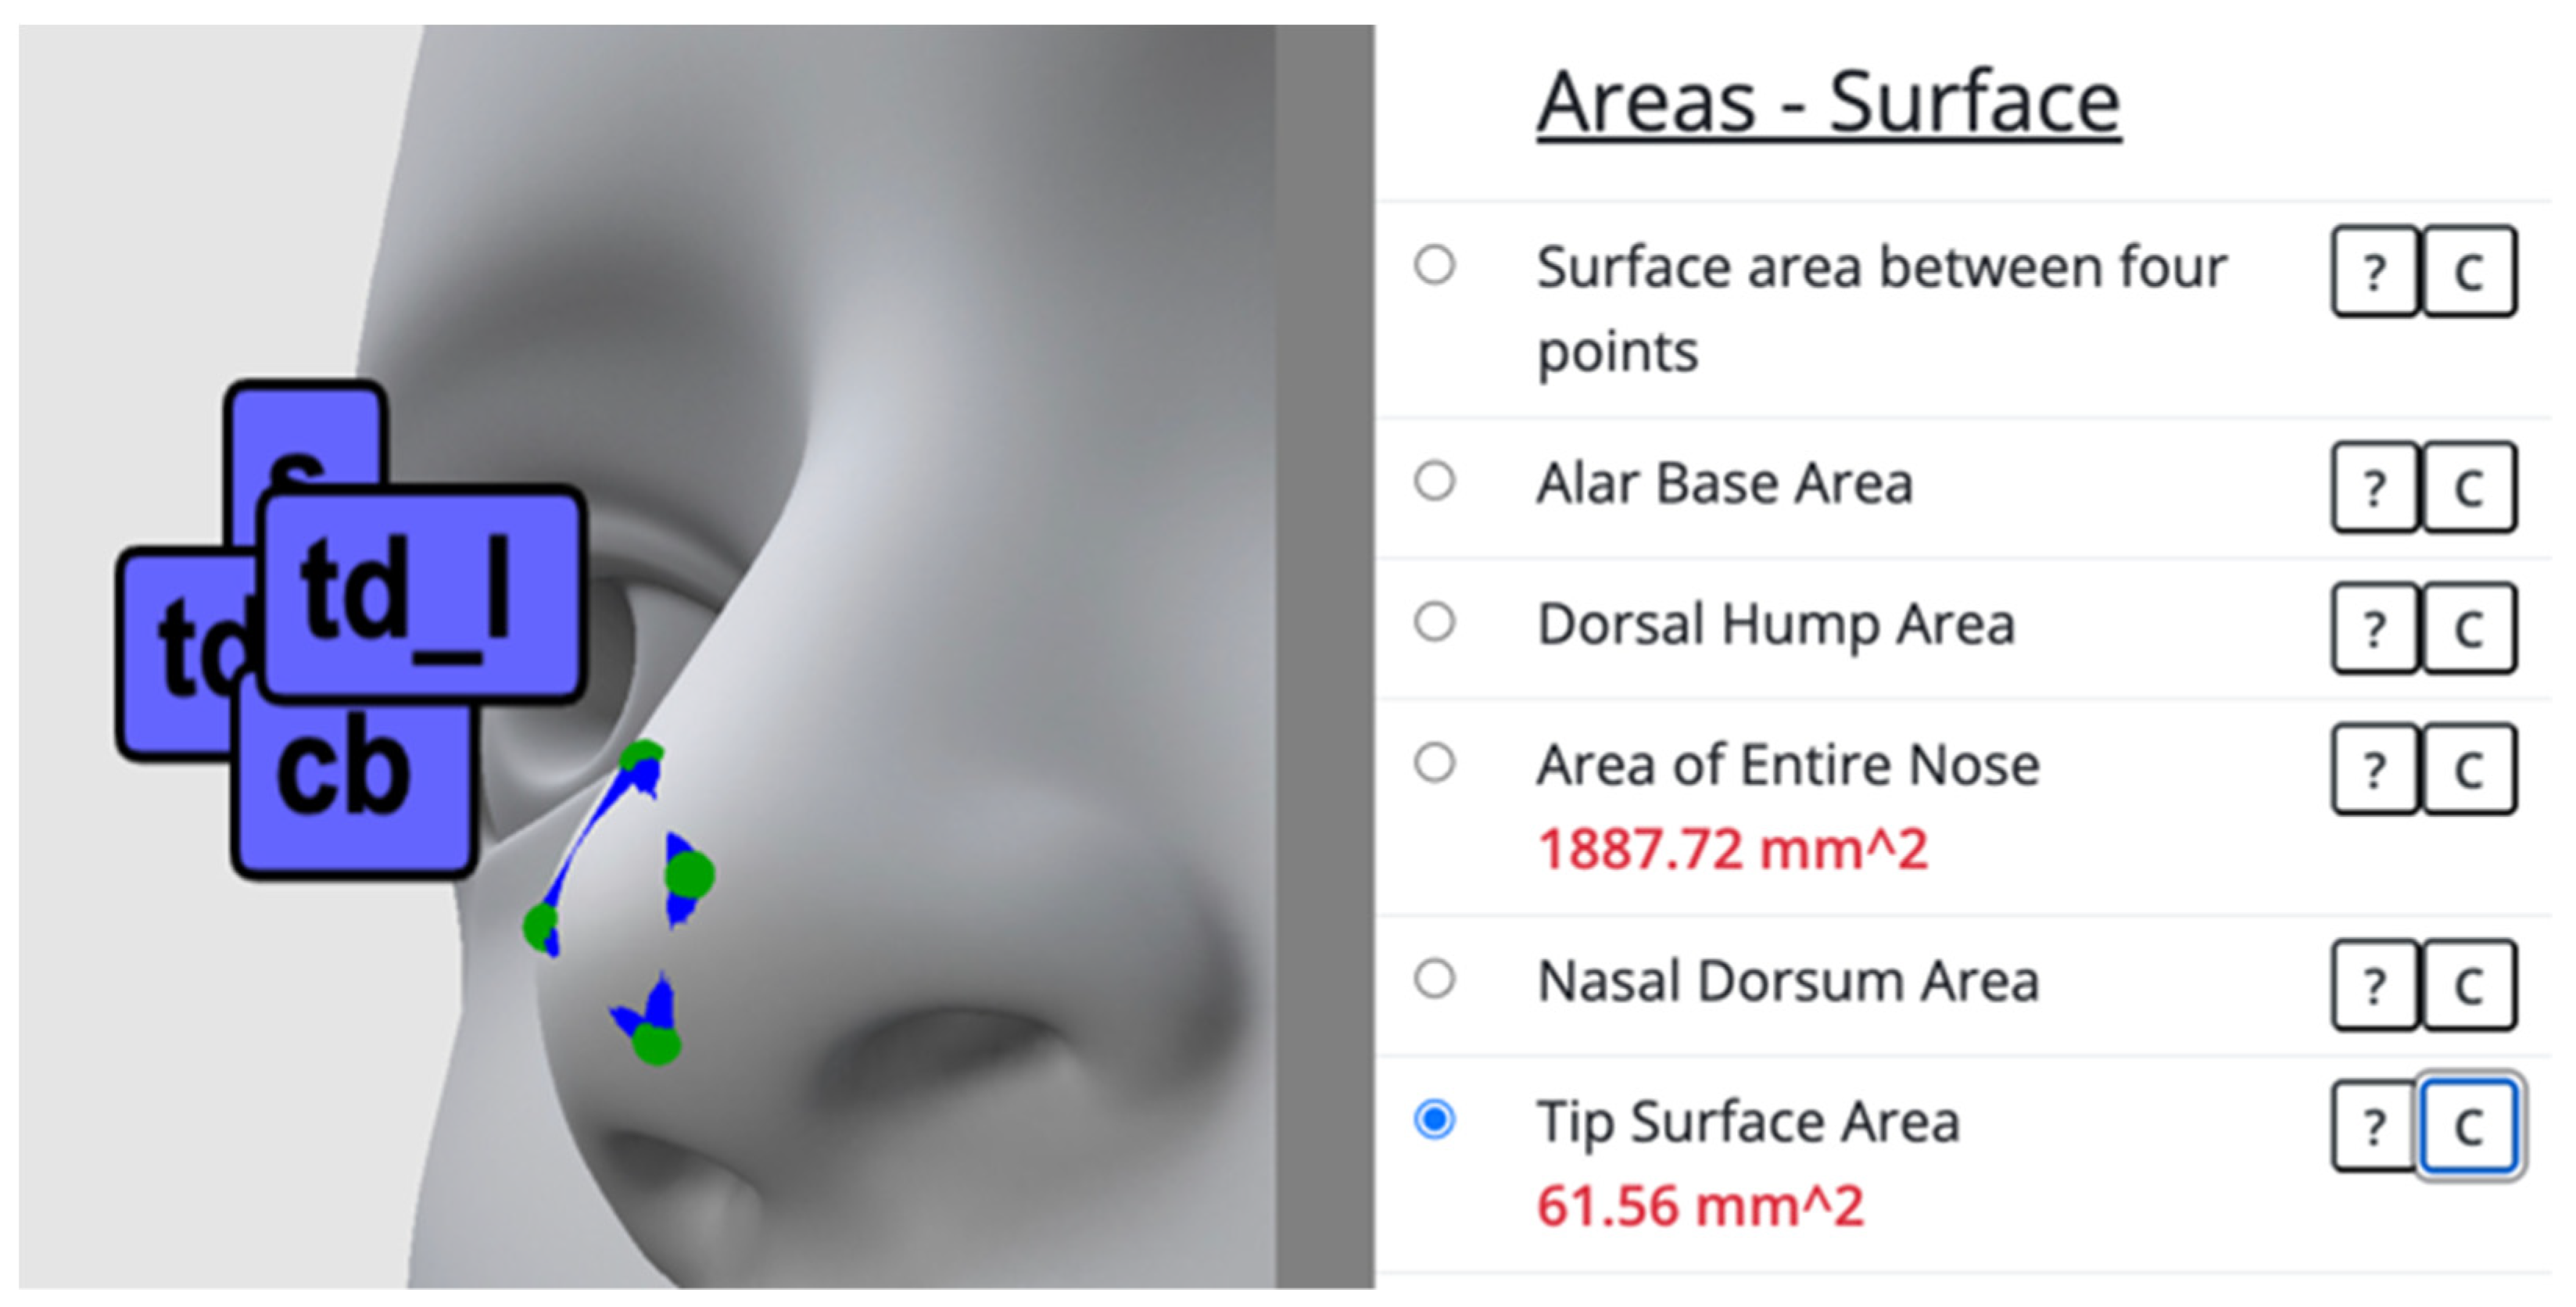
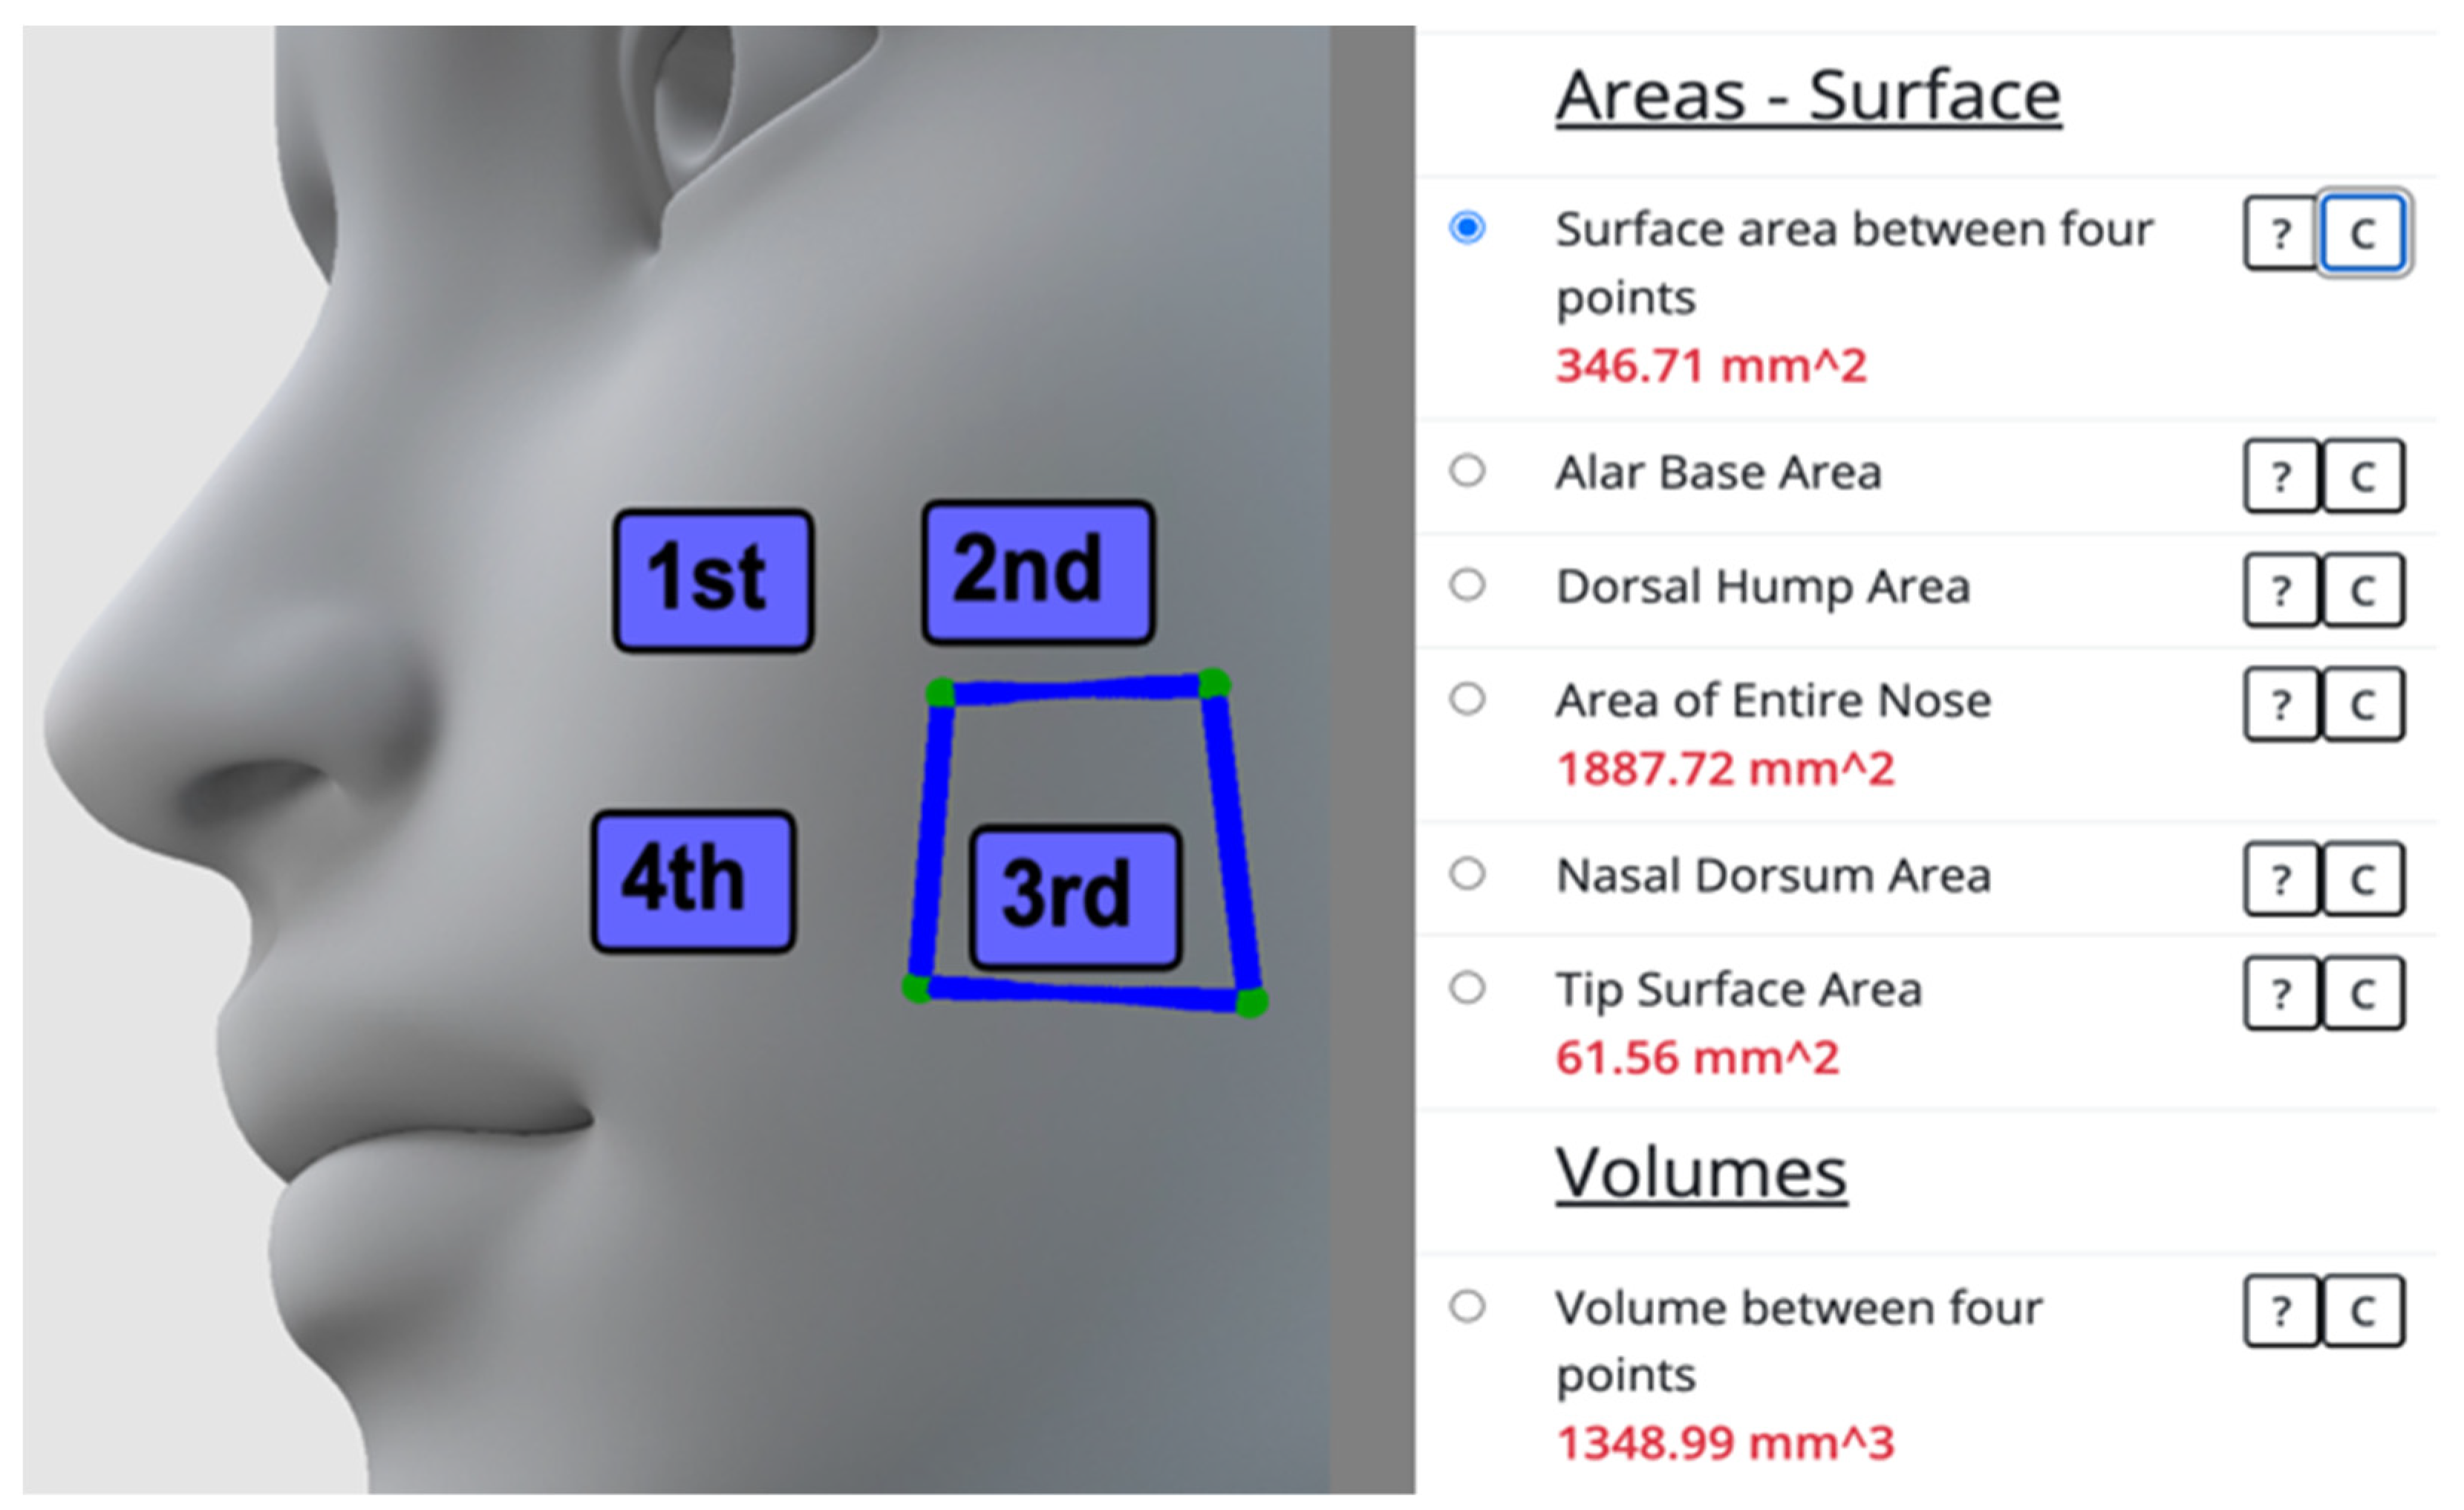
3.1. Web-Based Software to Measure Area and Volume on 3D Facial Models
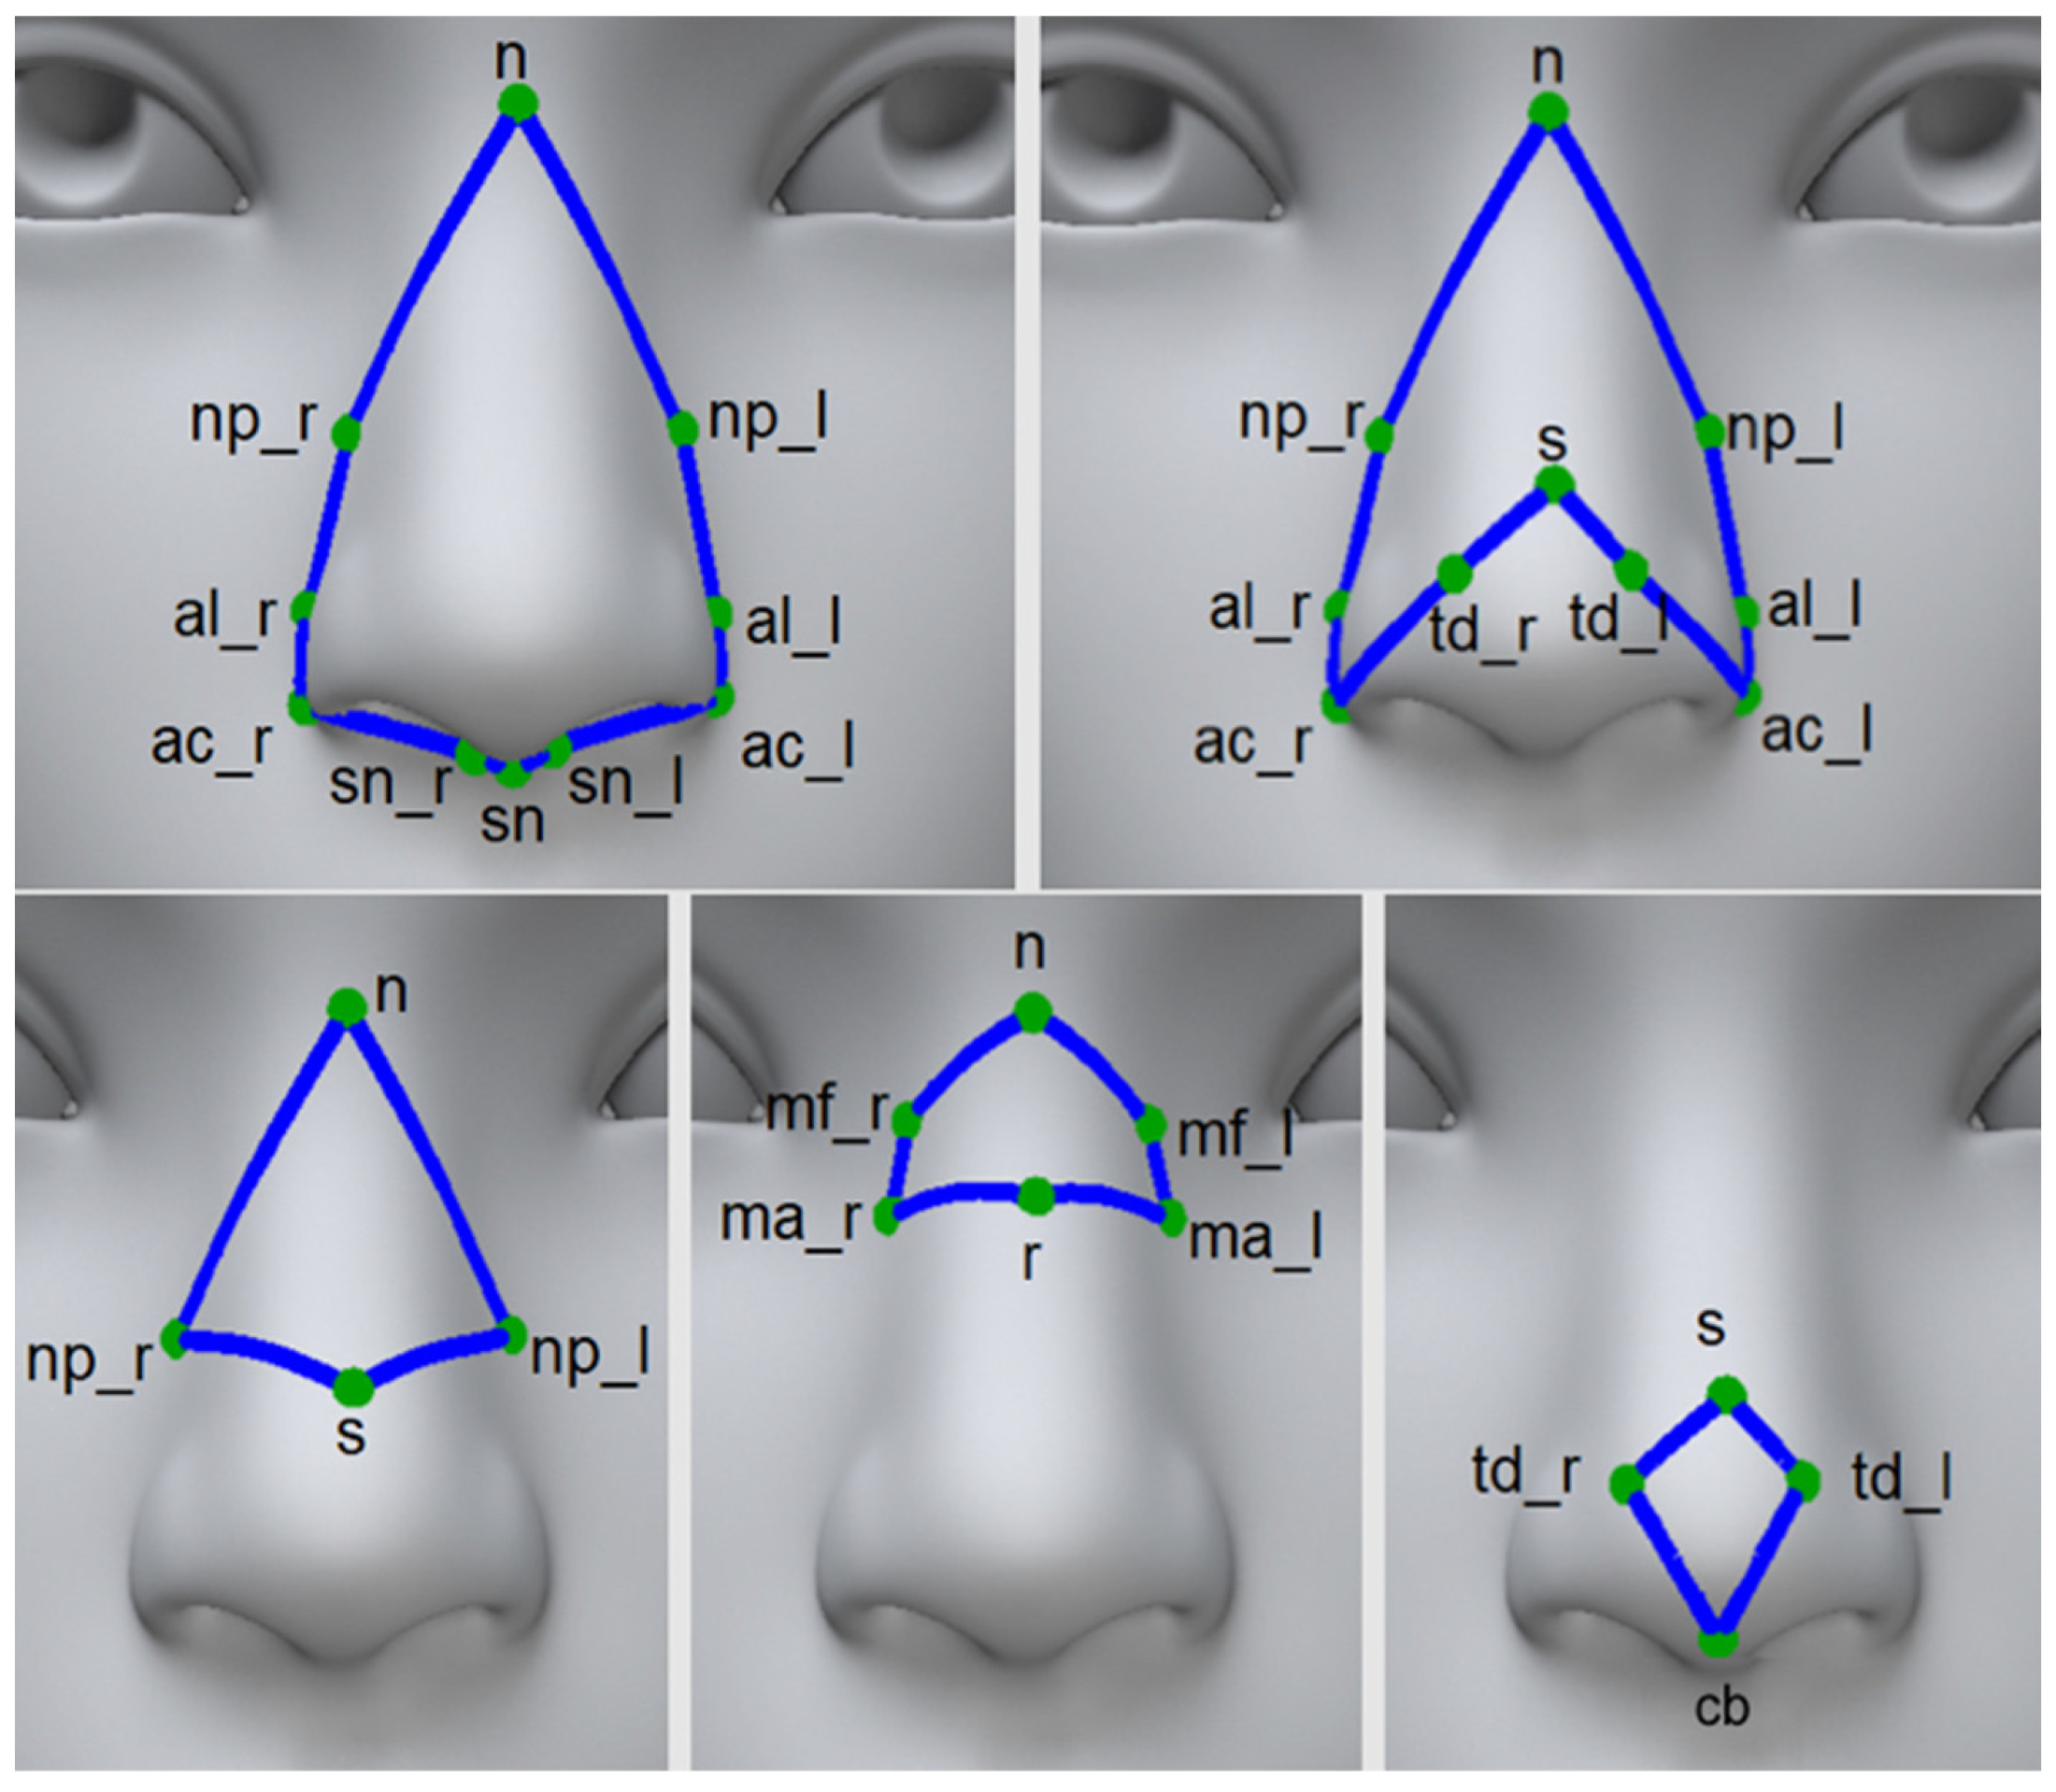
3.2. Area and Volume Measurements
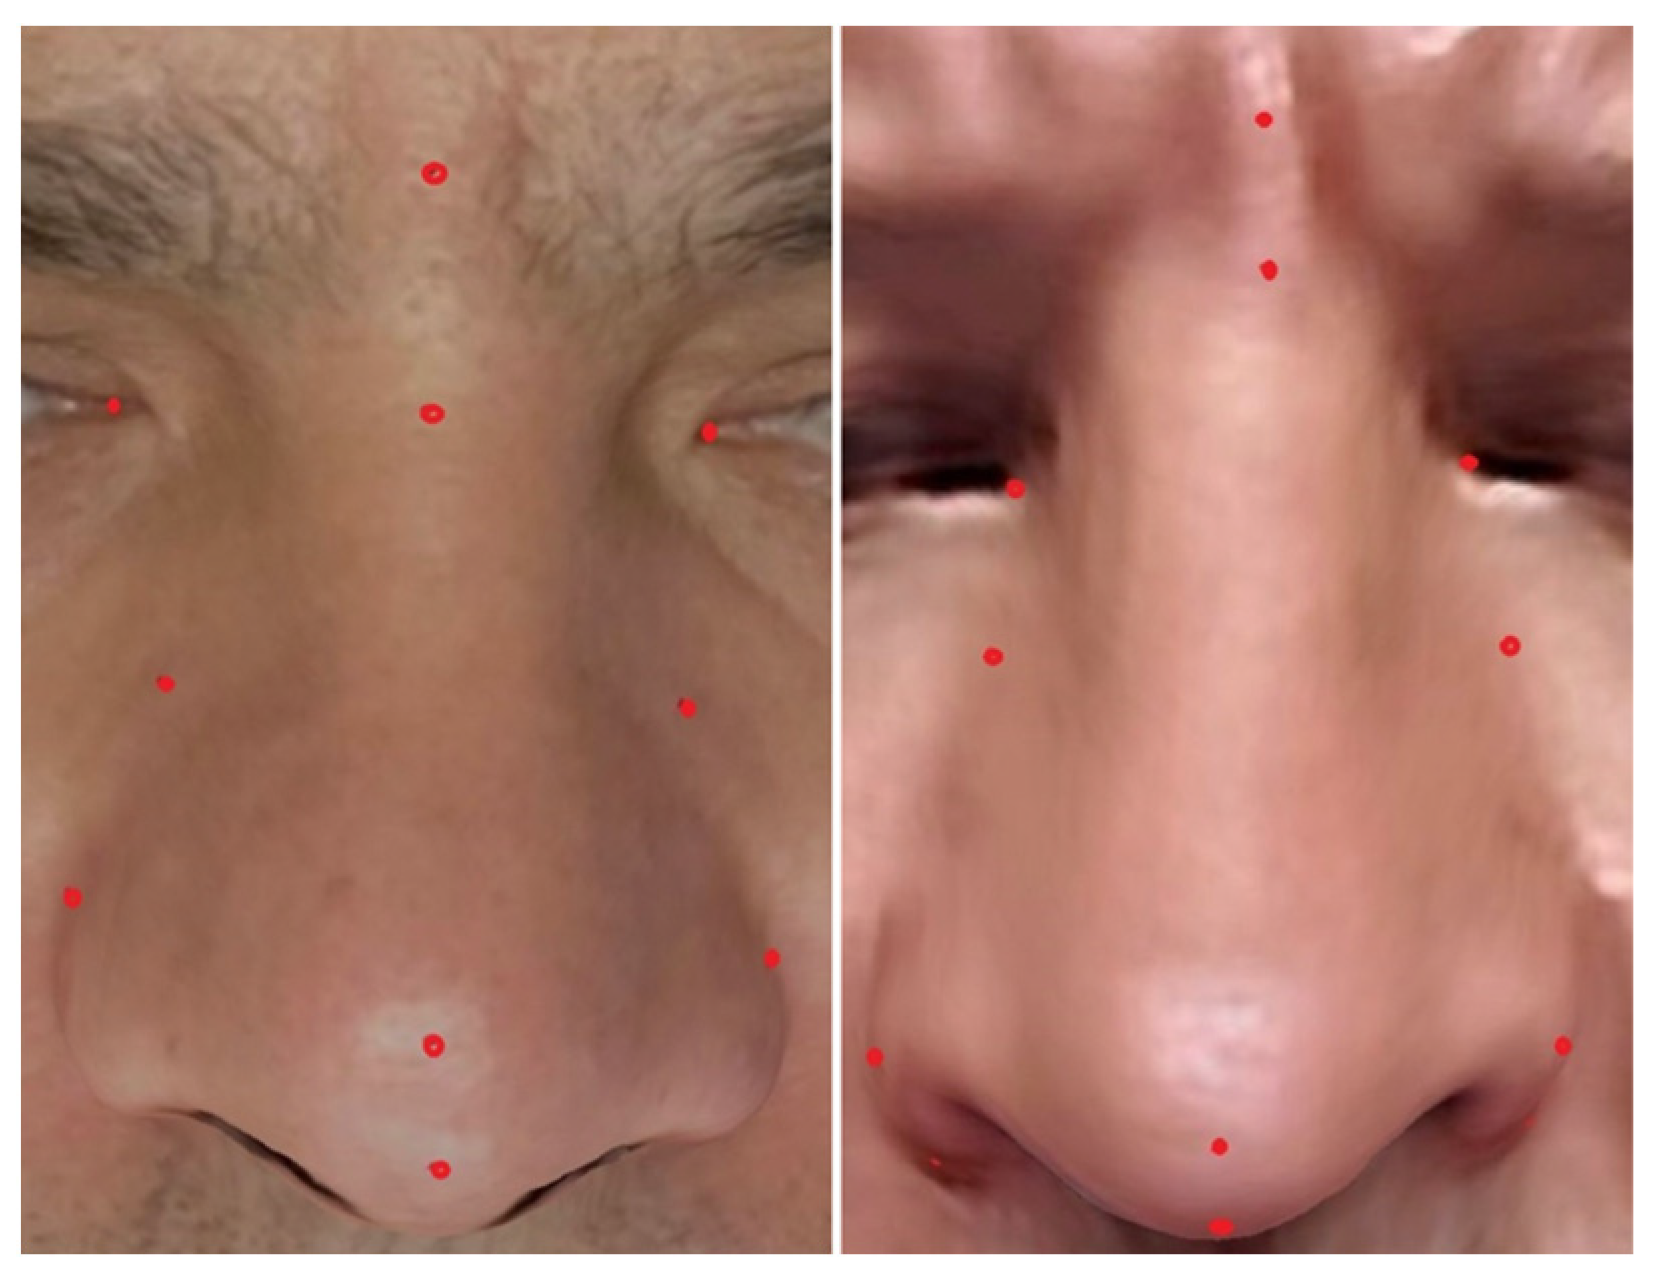
3.3. Test Dataset
3.4. Intra- and Inter-Reliability Analysis
3.5. Agreement Analysis
4. Results
4.1. Statistical Analysis of Intra- and Inter-Reliability
4.2. Statistical Analysis of Agreement
5. Discussion
6. Conclusions
Author Contributions
Funding
Institutional Review Board Statement
Informed Consent Statement
Data Availability Statement
Acknowledgments
Conflicts of Interest
References
- Topsakal, O.; Akbas, M.I.; Smith, B.S.; Perez, M.F.; Guden, E.C.; Celikoyar, M.M. Evaluating the Agreement and Reliability of a Web-Based Facial Analysis Tool for Rhinoplasty. Int. J. Comput. Assist. Radiol. Surg. 2021, 16, 1381–1391. [Google Scholar] [CrossRef]
- Lekakis, G.; Hens, G.; Claes, P.; Hellings, P.W. Three-Dimensional Morphing and Its Added Value in the Rhinoplasty Consult. Plast. Reconstr. Surg. Glob. Open 2019, 7, e2063. [Google Scholar] [CrossRef]
- van Stralen, K.J.; Dekker, F.W.; Zoccali, C.; Jager, K.J. Measuring Agreement, More Complicated Than It Seems. Nephron Clin. Pract. 2012, 120, c162–c167. [Google Scholar] [CrossRef]
- Claes, P.; Hamilton, G.; Hellings, P.; Lekakis, G. Evolution of Preoperative Rhinoplasty Consult by Computer Imaging. Facial Plast. Surg. 2016, 32, 80–87. [Google Scholar] [CrossRef]
- Persing, S.; Timberlake, A.T.; Madari, S.; Steinbacher, D.M. Three-Dimensional Imaging in Rhinoplasty: A Comparison of the Simulated versus Actual Result. Aesthet. Plast. Surg. 2018, 42, 1331–1335. [Google Scholar] [CrossRef]
- Willaert, R.; Opdenakker, Y.; Sun, Y.; Politis, C.; Vermeersch, H. New Technologies in Rhinoplasty. Plast. Reconstr. Surg. Glob. Open 2019, 7, e2121. [Google Scholar] [CrossRef]
- 3dMDface Software. 3dMD LLC. 2022. Available online: https://3dmd.com/3dmdface/ (accessed on 16 November 2023).
- Lifeviz Software. QuantifiCare. 2022. Available online: https://www.quantificare.com/3d-photography-systems_old/lifeviz-infinity/ (accessed on 16 November 2023).
- Vectra System. Canfield Corp. 2022. Available online: https://www.canfieldsci.com/imaging-systems/ (accessed on 16 November 2023).
- Topsakal, O.; Akbaş, M.İ.; Demirel, D.; Nunez, R.; Smith, B.S.; Perez, M.F.; Celikoyar, M.M. Digitizing Rhinoplasty: A Web Application with Three-Dimensional Preoperative Evaluation to Assist Rhinoplasty Surgeons with Surgical Planning. Int. J. CARS 2020, 15, 1941–1950. [Google Scholar] [CrossRef]
- Toriumi, D.M.; Dixon, T.K. Assessment of Rhinoplasty Techniques by Overlay of Before-and-After 3D Images. Facial Plast. Surg. Clin. N. Am. 2011, 19, 711–723. [Google Scholar] [CrossRef] [PubMed]
- Celikoyar, M.M.; Topsakal, O.; Sawyer, P. Three-Dimensional (3D) Area and Volume Measurements for Rhinoplasty. J. Plast. Reconstr. Aesthet. Surg. 2023, 83, 189–197. [Google Scholar] [CrossRef] [PubMed]
- Topsakal, O.; Sawyer, P.; Akinci, T.C.; Celikoyar, M.M. Algorithms to Measure Area and Volume on 3D Face Models for Facial Surgeries. IEEE Access 2023, 11, 39577–39585. [Google Scholar] [CrossRef]
- Face Analyzer. Facial Analysis Web-based Software Including Area and Volume Measurements. 2023. Available online: http://digitized-rhinoplasty.com/app-aws/analyzer.html (accessed on 23 January 2024).
- García-Luna, M.A.; Jimenez-Olmedo, J.M.; Pueo, B.; Manchado, C.; Cortell-Tormo, J.M. Concurrent Validity of the Ergotex Device for Measuring Low Back Posture. Bioengineering 2024, 11, 98. [Google Scholar] [CrossRef] [PubMed]
- Wang, S.V.; Sreedhara, S.K.; Schneeweiss, S. Reproducibility of Real-World Evidence Studies Using Clinical Practice Data to Inform Regulatory and Coverage Decisions. Nat. Commun. 2022, 13, 5126. [Google Scholar] [CrossRef] [PubMed]
- Bland, J.M.; Altman, D.G. Statistical Methods for Assessing Agreement between Two Methods of Clinical Measurement. Lancet 1986, 327, 307–310. [Google Scholar] [CrossRef]
- Kazimierczak, N.; Kazimierczak, W.; Serafin, Z.; Nowicki, P.; Lemanowicz, A.; Nadolska, K.; Janiszewska-Olszowska, J. Correlation Analysis of Nasal Septum Deviation and Results of AI-Driven Automated 3D Cephalometric Analysis. J. Clin. Med. 2023, 12, 6621. [Google Scholar] [CrossRef] [PubMed]
- Walker, H.; Ghani, S.; Kuemmerli, C.; Nebiker, C.; Müller, B.; Raptis, D.; Staubli, S. Reliability of Medical Information Provided by ChatGPT: Assessment Against Clinical Guidelines and Patient Information Quality Instrument. J. Med. Internet Res. 2023, 25, e47479. [Google Scholar] [CrossRef] [PubMed]
- Cudejko, T.; Button, K.; Al-Amri, M. Validity and Reliability of Accelerations and Orientations Measured Using Wearable Sensors During Functional Activities. Sci. Rep. 2022, 12, 14619. [Google Scholar] [CrossRef]
- Kotuła, J.; Kuc, A.; Szeląg, E.; Babczyńska, A.; Lis, J.; Matys, J.; Kawala, B.; Sarul, M. Comparison of Diagnostic Validity of Cephalometric Analyses of the ANB Angle and Tau Angle for Assessment of the Sagittal Relationship of Jaw and Mandible. J. Clin. Med. 2023, 12, 6333. [Google Scholar] [CrossRef]
- Monson, K.L.; Smith, E.D.; Peters, E.M. Repeatability and Reproducibility of Comparison Decisions by Firearms Examiners. J. Forensic Sci. 2023, 68, 1721–1740. [Google Scholar] [CrossRef]
- Garcia Valencia, O.A.; Suppadungsuk, S.; Thongprayoon, C.; Miao, J.; Tangpanithandee, S.; Craici, I.M.; Cheungpasitporn, W. Ethical Implications of Chatbot Utilization in Nephrology. J. Pers. Med. 2023, 13, 1363. [Google Scholar] [CrossRef]
- Pirri, C.; Pirri, N.; Porzionato, A.; Boscolo-Berto, R.; De Caro, R.; Stecco, C. Inter- and Intra-Rater Reliability of Ultrasound Measurements of Superficial and Deep Fasciae Thickness in Upper Limb. Diagnostics 2022, 12, 2195. [Google Scholar] [CrossRef]
- Song, S.Y.; Seo, M.S.; Kim, C.W.; Kim, Y.H.; Yoo, B.C.; Choi, H.J.; Seo, S.H.; Kang, S.W.; Song, M.G.; Nam, D.C.; et al. AI-Driven Segmentation and Automated Analysis of the Whole Sagittal Spine from X-ray Images for Spinopelvic Parameter Evaluation. Bioengineering 2023, 10, 1229. [Google Scholar] [CrossRef]
- Pepera, G.; Karanasiou, E.; Blioumpa, C.; Antoniou, V.; Kalatzis, K.; Lanaras, L.; Batalik, L. Tele-Assessment of Functional Capacity through the Six-Minute Walk Test in Patients with Diabetes Mellitus Type 2: Validity and Reliability of Repeated Measurements. Sensors 2023, 23, 1354. [Google Scholar] [CrossRef]
- Paraskevopoulos, E.; Pamboris, G.M.; Plakoutsis, G.; Papandreou, M. Reliability and Measurement Error of Tests Used for the Assessment of Throwing Performance in Overhead Athletes: A Systematic Review. J. Bodyw. Mov. Ther. 2023, 35, 284–297. [Google Scholar] [CrossRef] [PubMed]
- Harte, D.; Nevill, A.M.; Ramsey, L.; Martin, S. Validity, Reliability, and Responsiveness of a Goniometer Watch to Measure Pure Forearm Rotation. Hand Ther. 2023. [Google Scholar] [CrossRef]
- Guinot-Barona, C.; Alonso Pérez-Barquero, J.; Galán López, L.; Barmak, A.B.; Att, W.; Kois, J.C.; Revilla-León, M. Cephalometric analysis performance discrepancy between orthodontists and an artificial intelligence model using lateral cephalometric radiographs. J. Esthet. Restor. Dent. 2023. [Google Scholar] [CrossRef] [PubMed]
- Koo, T.K.; Li, M.Y. A Guideline of Selecting and Reporting Intraclass Correlation Coefficients for Reliability Research. J. Chiropr. Med. 2016, 15, 155–163. [Google Scholar] [CrossRef] [PubMed]
- Sonnad, S.; Sathe, M.; Basha, D.K.; Bansal, V.; Singh, R.; Singh, D.P. The Integration of Connectivity and System Integrity Approaches using Internet of Things (IoT) for Enhancing Network Security. In Proceedings of the 2022 5th International Conference on Contemporary Computing and Informatics (IC3I), Uttar Pradesh, India, 14–16 December 2022; pp. 362–366. [Google Scholar] [CrossRef]
- Cejas, O.A.; Azeem, M.I.; Abualhaija, S.; Briand, L.C. NLP-Based Automated Compliance Checking of Data Processing Agreements Against GDPR. IEEE Trans. Softw. Eng. 2023, 49, 4282–4303. [Google Scholar] [CrossRef]
- Conceição, F.; Lewis, M.; Lopes, H.; Fonseca, E.M.M. An Evaluation of the Accuracy and Precision of Jump Height Measurements Using Different Technologies and Analytical Methods. Appl. Sci. 2022, 12, 511. [Google Scholar] [CrossRef]
- Datatab. Bland-Altman Plot Tutorial. Available online: https://datatab.net/tutorial/bland-altman-plot (accessed on 2 November 2023).
- Tsikas, D. Mass Spectrometry-Based Evaluation of the Bland-Altman Approach: Review, Discussion, and Proposal. Molecules 2023, 28, 4905. [Google Scholar] [CrossRef]
- Chatfield, M.D.; Cole, T.J.; de Vet, H.C.; Marquart-Wilson, L.; Farewell, D.M. blandaltman: A Command to Create Variants of Bland-Altman Plots. Stata J. 2023, 23, 851–874. [Google Scholar] [CrossRef]
- Taffé, P.; Zuppinger, C.; Burger, G.; Gonseth Nusslé, S. The Bland-Altman Method Should Not Be Used When One of the Two Measurement Methods Has Negligible Measurement Errors. PLoS ONE 2022, 17, e0278915. [Google Scholar] [CrossRef]
- Giavarina, D. Understanding Bland Altman Analysis. Biochem. Med. 2015, 25, 141–151. [Google Scholar] [CrossRef]
- Gilliam, J.R.; Song, A.; Sahu, P.K.; Silfies, S.P. Test-Retest Reliability and Construct Validity of Trunk Extensor Muscle Force Modulation Accuracy. PLoS ONE 2023, 18, e0289531. [Google Scholar] [CrossRef]
- Bobak, C.A.; Barr, P.J.; O’Malley, A.J. Estimation of an Inter-Rater Intra-Class Correlation Coefficient That Overcomes Common Assumption Violations in the Assessment of Health Measurement Scales. BMC Med. Res. Methodol. 2018, 18, 93. [Google Scholar] [CrossRef]
- Mokkink, L.B.; de Vet, H.; Diemeer, S.; Eekhout, I. Sample Size Recommendations for Studies on Reliability and Measurement Error: An Online Application Based on Simulation Studies. Health Serv. Outcomes Res. Methodol. 2023, 23, 241–265. [Google Scholar] [CrossRef]
- Nike, E.; Radzins, O.; Pirttiniemi, P.; Vuollo, V.; Slaidina, A.; Abeltins, A. Evaluation of Facial Soft Tissue Asymmetric Changes in Class III Patients After Orthognathic Surgery Using Three-Dimensional Stereophotogrammetry. Int. J. Oral Maxillofac. Surg. 2022, 52, 361–370. [Google Scholar] [CrossRef]
- Wang, D.; Firth, F.; Bennani, F.; Farella, M.; Mei, L. Immediate Effect of Clear Aligners and Fixed Appliances on Perioral Soft Tissues and Speech. Orthod. Craniofac. Res. 2022, 26, 425–432. [Google Scholar] [CrossRef]
- Singh, P.; Hsung, T.C.; Ajmera, D.H.; Leung, Y.Y.; McGrath, C.; Gu, M. Can Smartphones Be Used for Routine Dental Clinical Application? A Validation Study for Using Smartphone-Generated 3D Facial Images. J. Dent. 2023, 139, 104775. [Google Scholar] [CrossRef] [PubMed]
- Gašparović, B.; Morelato, L.; Lenac, K.; Mauča, G.; Zhurov, A.; Katić, V. Comparing Direct Measurements and Three-Dimensional (3D) Scans for Evaluating Facial Soft Tissue. Sensors 2023, 23, 2412. [Google Scholar] [CrossRef] [PubMed]
- Abbas, L.F.; Joseph, A.K.; Day, J.; Cole, N.A.; Hallac, R.; Derderian, C.; Jacobe, H.T. Measuring Asymmetry in Facial Morphea via 3-Dimensional Stereophotogrammetry. J. Am. Acad. Dermatol. 2023, 88, 101–108. [Google Scholar] [CrossRef]
- Celikoyar, M.M.; Perez, M.F.; Akbas, M.I.; Topsakal, O. Facial Surface Anthropometric Features and Measurements with an Emphasis on Rhinoplasty. Aesthetic Surg. J. 2021, 42, 133–148. [Google Scholar] [CrossRef]
- Topsakal, O.; Glinton, J.; Akbas, M.I.; Celikoyar, M.M. Open-Source 3D Morphing Software for Facial Plastic Surgery and Facial Landmark Detection Research and Open Access Face Data Set Based on Deep Learning (Artificial Intelligence) Generated Synthetic 3D Models. Facial Plast. Surg. Aesthet. Med. 2023. [Google Scholar] [CrossRef]
- Dogan, N. Bland-Altman Analysis: A Paradigm to Understand Correlation and Agreement. Turk. J. Emerg. Med. 2018, 18, 139–141. [Google Scholar] [CrossRef]
- Bertoud, M.D.Q.; Bertold, C.; Ezzedine, K.; Pandya, A.G.; Cherel, M.; Martinez, A.C.; Seguy, M.A.; Abdallah, M.; Bae, J.M.; Böhm, M.; et al. Reliability and Agreement Testing of a New Automated Measurement Method to Determine Facial Vitiligo Extent Using Standardized Ultraviolet Images and a Dedicated Algorithm. Br. J. Dermatol. 2023, 190, 62–69. [Google Scholar] [CrossRef]
- Piedra-Cascon, W.; Meyer, M.J.; Methani, M.M.; Revilla-León, M. Accuracy (Trueness and Precision) of a Dual-Structured Light Facial Scanner and Interexaminer Reliability. J. Prosthet. Dent. 2020, 124, 567–574. [Google Scholar] [CrossRef] [PubMed]
- Tomasik, J.; Zsoldos, M.; Oravcova, L.; Lifkova, M.; Pavleova, G.; Strunga, M.; Thurzo, A. AI and Face-Driven Orthodontics: A Scoping Review of Digital Advances in Diagnosis and Treatment Planning. AI 2024, 5, 158–176. [Google Scholar] [CrossRef]
- Topsakal, O.; Akbas, M.I.; Storts, S.; Feyzullayeva, L.; Celikoyar, M.M. Textured Three Dimensional Facial Scan Data Set: Amassing a Large Data Set through a Mobile iOS Application. Facial Plast. Surg. Aesthetic Med. 2023; ahead of print. [Google Scholar] [CrossRef]
- Landers, R. Computing Intraclass Correlations (ICC) as Estimates of Interrater Reliability in SPSS. Authorea Prepr. 2015. [Google Scholar] [CrossRef]
- Blender 3D. A 3D Modelling and Rendering Package. 2021. Available online: http://www.blender.org (accessed on 16 November 2023).
- Arifin, W.N. Sample Size Calculator (Web). 2024. Available online: https://wnarifin.github.io/ssc/ssicc.html (accessed on 24 January 2024).
- Borg, D.N.; Bach, A.J.E.; O’Brien, J.L.; Sainani, K.L. Calculating Sample Size for Reliability Studies. PM&R 2022, 14, 1018–1025. [Google Scholar] [CrossRef]
- Hair, J.F.; Black, W.C.; Babin, B.J. Multivariate Data Analysis; Cengage Learning Emea: Hampshire, UK, 2010. [Google Scholar]
- George, D.; Mallery, P. SPSS for Windows Step by Step: A Simple Guide and Reference, 17.0 Update; Allyn & Bacon: Boston, MA, USA, 2010. [Google Scholar]
- Urban, R.; Haluzová, S.; Strunga, M.; Surovková, J.; Lifková, M.; Tomášik, J.; Thurzo, A. AI-Assisted CBCT Data Management in Modern Dental Practice: Benefits, Limitations and Innovations. Electronics 2023, 12, 1710. [Google Scholar] [CrossRef]
- Plooij, J.M.; Swennen, G.R.J.; Rangel, F.A.; Maal, T.J.J.; Schutyser, F.A.C.; Bronkhorst, E.M.; Kuijpers–Jagtman, A.M.; Bergé, S.J. Evaluation of Reproducibility and Reliability of 3D Soft Tissue Analysis Using 3D Stereophotogrammetry. Int. J. Oral Maxillofac. Surg. 2009, 38, 267–273. [Google Scholar] [CrossRef] [PubMed]
- Ceinos, R.; Tardivo, D.; Bertrand, M.-F.; Lupi-Pegurier, L. Inter- and Intra-Operator Reliability of Facial and Dental Measurements Using 3D-Stereophotogrammetry. J. Esthet. Restor. Dent. 2016, 28, 178–189. [Google Scholar] [CrossRef]
- Lobato, R.C.; Camargo, C.P.; Buelvas Bustillo, A.M.; Ishida, L.C.; Gemperli, R. Volumetric Comparison Between CT Scans and Smartphone-Based Photogrammetry in Patients Undergoing Chin Augmentation with Autologous Fat Graft. Aesthetic Surg. J. 2022, 43, NP310–NP321. [Google Scholar] [CrossRef]
- Aponte, J.D.; Bannister, J.J.; Hoskens, H.; Matthews, H.; Katsura, K.; Da Silva, C.; Cruz, T.; Pilz, J.H.M.; Spritz, R.A.; Forkert, N.D.; et al. An Interactive Atlas of Three-Dimensional Syndromic Facial Morphology. Am. J. Hum. Genet. 2024, 111, 39–47. [Google Scholar] [CrossRef]
- Quispe-Enriquez, O.C.; Valero-Lanzuela, J.J.; Lerma, J.L. Craniofacial 3D Morphometric Analysis with Smartphone-Based Photogrammetry. Sensors 2024, 24, 230. [Google Scholar] [CrossRef] [PubMed]
- Kazimierczak, N.; Kazimierczak, W.; Serafin, Z.; Nowicki, P.; Nożewski, J.; Janiszewska-Olszowska, J. AI in Orthodontics: Revolutionizing Diagnostics and Treatment Planning—A Comprehensive Review. J. Clin. Med. 2024, 13, 344. [Google Scholar] [CrossRef] [PubMed]
- Häner, S.T.; Kanavakis, G.; Matthey, F.; Gkantidis, N. Valid 3D Surface Superimposition References to Assess Facial Changes During Growth. Sci. Rep. 2021, 11, 16456. [Google Scholar] [CrossRef]
- Wampfler, J.J.; Gkantidis, N. Superimposition of Serial 3-Dimensional Facial Photographs to Assess Changes Over Time: A Systematic Review. Am. J. Orthod. Dentofacial Orthop. 2022, 161, 182–197. [Google Scholar] [CrossRef]
- Elmaraghy, A.; Ayman, G.; Khaled, M.; Tarek, S.; Sayed, M.; Hassan, M.A.; Kamel, M.H. Face Analyzer 3D: Automatic Facial Profile Detection and Occlusion Classification for Dental Purposes. In Proceedings of the 2022 2nd International Mobile, Intelligent, and Ubiquitous Computing Conference (MIUCC), Cairo, Egypt, 8–9 May 2022; pp. 110–117. [Google Scholar] [CrossRef]
- Cai, Y.; Zhang, X.; Cao, J.; Grzybowski, A.; Ye, J.; Lou, L. Application of Artificial Intelligence in Oculoplastics: A Review. Clin. Dermatol. 2024. [Google Scholar] [CrossRef]

| Mean | Std | Lower | Upper | Shapiro–Wilk Significance | Linear Regression Significance | |
|---|---|---|---|---|---|---|
| Area—Tip | −2.28 | 4.91 | −11.89 | 7.34 | 0.05 | 0.68 |
| Area—Nasal Dorsum | −6.50 | 17.68 | −41.15 | 28.15 | 0.12 | 0.34 |
| Area—Entire Nose | 9.11 | 14.90 | −20.09 | 38.31 | 0.07 | 0.56 |
| Area—Dorsal Hump | 2.79 | 7.93 | −12.76 | 18.33 | 0.13 | 0.45 |
| Area—Root of Nose | 0.34 | 8.62 | −16.57 | 17.24 | 0.99 | 0.11 |
| Volume—Tip | 4.48 | 44.61 | −82.96 | 91.92 | 0.66 | 0.11 |
| Volume—Nasal Dorsum | 160.00 | 346.60 | −519.34 | 839.34 | 0.05 | 0.15 |
| Volume—Entire Nose | −244.36 | 416.56 | −1060.82 | 572.10 | 0.17 | 0.81 |
| Volume—Dorsal Hump | 81.75 | 142.00 | −196.57 | 360.07 | 0.02 | 0.15 |
| Volume—Root of Nose | 40.74 | 99.10 | −153.50 | 234.98 | 0.82 | 0.67 |
| Measurement Type | Levene—Signif. | No. | Shapiro–Wilk—Signif. | Skewness | Kurtosis |
|---|---|---|---|---|---|
| Area—tip | 0.997 | 1 | 0.34 | 0.67 | 0.01 |
| 2 | 0.26 | 0.68 | −0.06 | ||
| 3 | 0.28 | 0.70 | −0.02 | ||
| Area—nasal dorsum | 0.999 | 1 | 0.14 | 0.75 | −0.12 |
| 2 | 0.10 | 0.80 | −0.04 | ||
| 3 | 0.14 | 0.75 | −0.12 | ||
| Area—entire nose | 1 | 1 | 0.04 | 0.94 | 0.51 |
| 2 | 0.04 | 0.92 | 0.51 | ||
| 3 | 0.04 | 0.93 | 0.50 | ||
| Area—dorsal hump | 0.998 | 1 | 0.02 | 1.30 | 1.54 |
| 2 | 0.02 | 1.33 | 1.66 | ||
| 3 | 0.02 | 1.29 | 1.37 | ||
| Area—root of nose | 0.947 | 1 | 0.85 | 0.00 | 0.15 |
| 2 | 0.86 | −0.04 | 0.52 | ||
| 3 | 0.42 | 0.09 | 1.44 | ||
| Volume—tip | 0.987 | 1 | 0.15 | 1.02 | 1.43 |
| 2 | 0.31 | 1.28 | 2.25 | ||
| 3 | 0.12 | 1.03 | 1.37 | ||
| Volume—nasal dorsum | 0.994 | 1 | 0.51 | 0.64 | 0.14 |
| 2 | 0.53 | 0.68 | 0.33 | ||
| 3 | 0.45 | 0.66 | 0.21 | ||
| Volume—entire nose | 0.995 | 1 | 0.17 | 0.69 | −0.34 |
| 2 | 0.18 | 0.68 | −0.31 | ||
| 3 | 0.17 | 0.73 | −0.17 | ||
| Volume—dorsal hump | 0.995 | 1 | 0.03 | 1.86 | 4.31 |
| 2 | 0.03 | 1.86 | 4.34 | ||
| 3 | 0.03 | 1.77 | 3.82 | ||
| Volume—root of nose | 0.959 | 1 | 0.96 | −0.09 | −0.63 |
| 2 | 0.92 | −0.08 | −0.81 | ||
| 3 | 0.85 | 0.29 | −0.22 |
| Measurement | Intra-Reliability | Inter-Reliability |
|---|---|---|
| Area—Dorsal Hump | 1.0 (0.999–1.0) | 1.0 (0.999–1.0) |
| Area—Entire Nose | 1.0 (0.999–1.0) | 1.0 (1.0–1.0) |
| Area—Nasal Dorsum | 0.999 (0.999–1.0) | 0.999 (0.999–1.0) |
| Area—Root of Nose | 0.996 (0.991–0.999) | 0.820 (0.553–0.928) |
| Area—Tip | 0.998 (0.995–0.999) | 0.999 (0.997–1.0) |
| Volume—Dorsal Hump | 1.0 (0.999–1.0) | 0.999 (0.999–1.0) |
| Volume—Entire Nose | 0.999 (0.998–1.0) | 0.999 (0.997–1.0) |
| Volume—Root of Nose | 0.998 (0.984–0.999) | 0.899 (0.741–0.960) |
| Volume—Nasal Dorsum | 0.999 (0.998–1.0) | 0.998 (0.996–0.999) |
| Volume—Tip | 0.994 (0.984–0.997) | 0.995 (0.987–0.998) |
Disclaimer/Publisher’s Note: The statements, opinions and data contained in all publications are solely those of the individual author(s) and contributor(s) and not of MDPI and/or the editor(s). MDPI and/or the editor(s) disclaim responsibility for any injury to people or property resulting from any ideas, methods, instructions or products referred to in the content. |
© 2024 by the authors. Licensee MDPI, Basel, Switzerland. This article is an open access article distributed under the terms and conditions of the Creative Commons Attribution (CC BY) license (https://creativecommons.org/licenses/by/4.0/).
Share and Cite
Topsakal, O.; Sawyer, P.; Akinci, T.C.; Topsakal, E.; Celikoyar, M.M. Reliability and Agreement of Free Web-Based 3D Software for Computing Facial Area and Volume Measurements. BioMedInformatics 2024, 4, 690-708. https://doi.org/10.3390/biomedinformatics4010038
Topsakal O, Sawyer P, Akinci TC, Topsakal E, Celikoyar MM. Reliability and Agreement of Free Web-Based 3D Software for Computing Facial Area and Volume Measurements. BioMedInformatics. 2024; 4(1):690-708. https://doi.org/10.3390/biomedinformatics4010038
Chicago/Turabian StyleTopsakal, Oguzhan, Philip Sawyer, Tahir Cetin Akinci, Elif Topsakal, and M. Mazhar Celikoyar. 2024. "Reliability and Agreement of Free Web-Based 3D Software for Computing Facial Area and Volume Measurements" BioMedInformatics 4, no. 1: 690-708. https://doi.org/10.3390/biomedinformatics4010038
APA StyleTopsakal, O., Sawyer, P., Akinci, T. C., Topsakal, E., & Celikoyar, M. M. (2024). Reliability and Agreement of Free Web-Based 3D Software for Computing Facial Area and Volume Measurements. BioMedInformatics, 4(1), 690-708. https://doi.org/10.3390/biomedinformatics4010038