Article

Assessment of Voice Disorders Using Machine Learning and Vocal Analysis of Voice Samples Recorded through Smartphones

by
Michele Giuseppe Di Cesare
,
David Perpetuini
*,
Daniela Cardone
and
Arcangelo Merla
Department of Engineering and Geology, University G. D’Annunzio of Chieti-Pescara, 65127 Pescara, Italy
*
Author to whom correspondence should be addressed.
BioMedInformatics 2024, 4(1), 549-565; https://doi.org/10.3390/biomedinformatics4010031
Submission received: 10 January 2024 / Revised: 9 February 2024 / Accepted: 17 February 2024 / Published: 19 February 2024

Abstract

:
Background: The integration of edge computing into smart healthcare systems requires the development of computationally efficient models and methodologies for monitoring and detecting patients’ healthcare statuses. In this context, mobile devices, such as smartphones, are increasingly employed for the purpose of aiding diagnosis, treatment, and monitoring. Notably, smartphones are widely pervasive and readily accessible to a significant portion of the population. These devices empower individuals to conveniently record and submit voice samples, thereby potentially facilitating the early detection of vocal irregularities or changes. This research focuses on the creation of diverse machine learning frameworks based on vocal samples captured by smartphones to distinguish between pathological and healthy voices. Methods: The investigation leverages the publicly available VOICED dataset, comprising 58 healthy voice samples and 150 samples from voices exhibiting pathological conditions, and machine learning techniques for the classification of healthy and diseased patients through the employment of Mel-frequency cepstral coefficients. Results: Through cross-validated two-class classification, the fine k-nearest neighbor exhibited the highest performance, achieving an accuracy rate of 98.3% in identifying healthy and pathological voices. Conclusions: This study holds promise for enabling smartphones to effectively identify vocal disorders, offering a multitude of advantages for both individuals and healthcare systems, encompassing heightened accessibility, early detection, and continuous monitoring.

Graphical Abstract

1. Introduction

The integration of edge computing into smart healthcare systems represents a pivotal advancement in the realm of modern healthcare. This evolution hinges on the creation of computationally efficient models and methodologies tailored specifically for monitoring and detecting patients’ healthcare statuses. In an era where data are paramount, especially in healthcare, edge computing emerges as a solution that promises to revolutionize the industry by bringing the power of computation closer to the source of data generation [1]. In this context, one of the remarkable developments is the utilization of mobile devices, particularly smartphones, as indispensable tools for aiding in the diagnosis, treatment, and continuous monitoring of individuals’ health [2,3]. The rationale behind this choice is multifaceted. Firstly, smartphones have achieved an unprecedented level of penetration and adoption globally. Their ubiquity ensures that a significant portion of the population has access to these powerful pocket-sized computers, making them an ideal platform for delivering healthcare services. Moreover, smartphones are equipped with an array of sensors and features that can be harnessed for healthcare purposes. These devices can capture data on a multitude of physiological parameters, such as heart rate, sleep patterns, physical activity, and even environmental factors like air quality. Furthermore, smartphones can easily connect to wearable devices and sensors, creating a seamless ecosystem for continuous data collection [3,4].
The usage of smartphones or, more generally, portable devices has found widespread applications in the field of healthcare assessment [5,6]. In fact, smartphones are equipped with several sensors that could be useful for diagnostic purposes. For instance, the visual camera could provide pictures or videos able to detect the affective state of individuals, but it could also provide information regarding skin diseases and heart rate through algorithms for remote photoplethysmography (PPG) [7]. Moreover, the effectiveness of the continuous monitoring of the health condition of a subject can be improved by coupling the smartphone with wearable devices such as smartwatches, which can record several physiological signals based on PPG and accelerometry [2,8,9,10,11].
One of the most intriguing applications of said devices, which has not been thoroughly explored yet, is their potential to enable the early detection of health issues through voice analysis. Said potential is attributed to their optimal microphones, which have been meticulously assessed for fidelity and accuracy in acoustic measurements of voice, as highlighted in previous studies [12,13,14]. Indeed, research has demonstrated that smartphone microphones are proficient in capturing voice recordings, even amidst ambient noise [15]. Furthermore, Lee et al. showed that although there are variations in acoustic measurements based on the device used, there was no difference in the diagnostic capability across the devices tested, including smartphones [16]. From this perspective, recent studies have demonstrated the consistency between the voice features derived from smartphones and professional microphone recordings [17,18]. Notably, the human voice carries a wealth of information, and subtle changes or irregularities in speech patterns can sometimes be indicative of underlying health conditions [19,20]. Specifically, voice analysis has been used for emotion recognition in order to improve the human–machine interaction and to monitor the affective state of individuals [21,22,23], for the discrimination of younger and older adults [24], as well as for the early diagnosis of vocal apparatus diseases [25,26,27,28]. For instance, Jothilakshmi developed a system based on Mel-frequency cepstral coefficients and linear prediction cepstral coefficients and used a Gaussian mixture model and hidden Markov model classifiers, reaching 94.44% efficiency in classifying normal and pathological voices [29]. Panek et al. evaluated the automatic detection of voice pathologies using an auto-associative neural network (NLPCA) for four types of vocal pathologies (i.e., hyperfunctional dysphonia, functional dysphonia, laryngitis, and vocal cord paralysis). The methods provided results with an efficiency level above 85% [30]. Vizza et al. proposed two methods of vocal signal analysis to detect dysarthria in Parkinson’s disease (PD) and multiple sclerosis patients with respect to healthy controls. The results showed significant differences in the features of pathological and healthy voices [31]. Kowalska-Taczanowska et al. found significant differences in the distribution of acoustic parameters between PD patients and atypical parkinsonian syndromes. Atypical parkinsonism patients had a mixed type of dysarthria with hypokinetic, spastic, and atactic features. Patients with multiple system atrophy had ataxic components of dysarthria. Atypical parkinsonism patients had pure hypokinetic dysarthria, fostering the employment of some parameters for PD diagnosis [32].
Notably, most of the studies proposed so far focused on serious vocal diseases, often related to other pathologies, and used studio microphones to record the voice. The advantages of using mobile apps or built-in features relies on the possibility that individuals can conveniently and easily record and submit voice samples for analysis. These voice data can then be processed using advanced machine learning (ML) and artificial intelligence (AI) algorithms, which are optimized for edge computing. ML is a field within computer science that employs efficient iterative algorithms in order to facilitate the learning process. It involves the use of significant characteristics and particular observations from provided data, with the aim of circumventing the need for computationally demanding programming experiments [33]. In recent times, there has been a notable utilization of ML algorithms in the field of health applications. This has garnered significant interest owing to their capacity to effectively execute sophisticated decision-making solutions [34,35,36]. The benefit of integrating ML and smartphone sensors into the healthcare ecosystem is that it puts the power of early detection and monitoring directly into the hands of individuals. They become active participants in their own healthcare, with the ability to regularly assess and track their well-being. Furthermore, healthcare providers can remotely access these data, allowing for proactive interventions and personalized treatment plans in a telemedicine context [37].
The objective of this study is to propose an ML-based analysis of voice recordings acquired using an old-generation smartphone from both healthy individuals and subjects with minor diseases of the vocal apparatus: reflux laryngitis, hypokinetic dysphonia, and hyperkinetic dysphonia. Through a variety of ML techniques, this study demonstrates how insightful information about the speaker’s health status can be extracted from a simple voice recording. The significance of the success of this study lies in its execution with a concise and easily extractable set of features. By focusing on data recorded with outdated devices, this work showcases the quality of helpful information that has always been at hand but never extracted, lending strong support to the necessity of moving from standard diagnosis to aided diagnosis. Finally, this work holds significance in pioneering applications for immediate health assessment and making inroads into the realms of translational and personalized medicine. This breakthrough could empower individuals to comprehend their health status through analyses performed using commonly used, everyday devices such as smartphones.

2. Materials and Methods

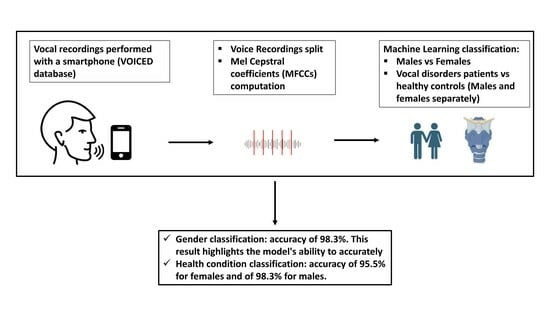
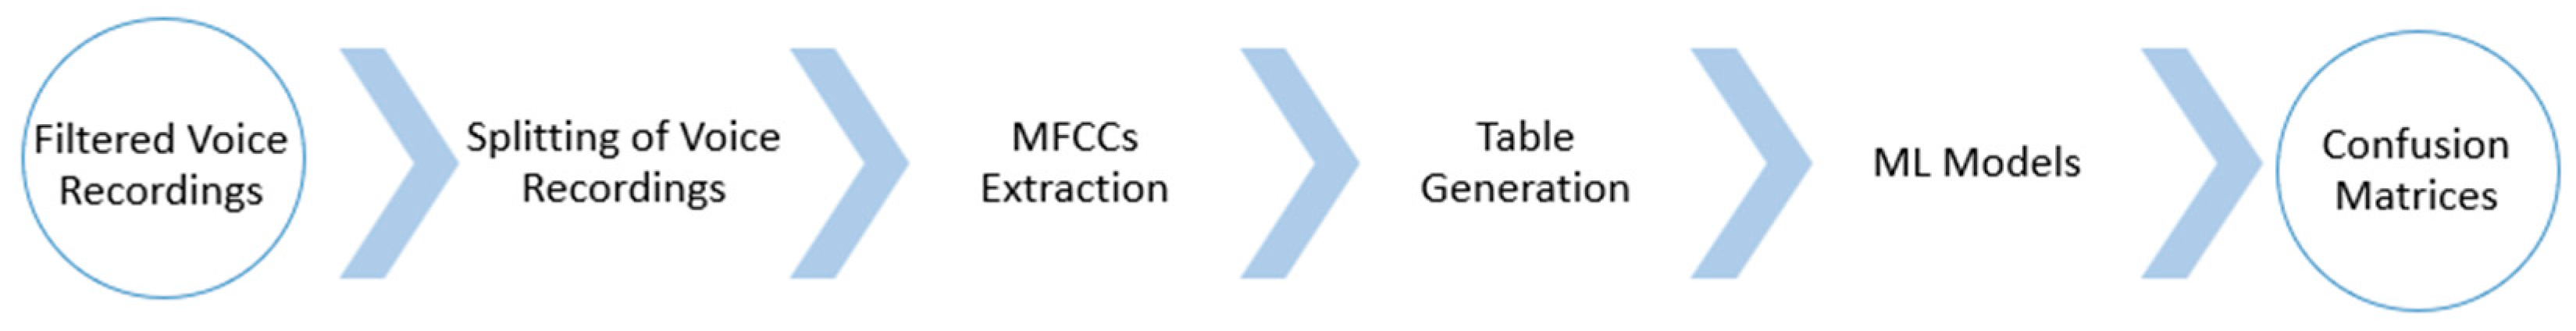
2.1. Dataset and Classification Procedure

This study was conducted using the freely available VOICED database [38,39], which comprises a total of 208 voice samples. These samples were obtained through the mobile health system [40] called Vox4Health, an implemented application that allows voice recordings using smartphone microphones. The device used for the acquisition was a Samsung Galaxy S4 running on Android 5.0.1, positioned at an angle of 45 degrees and held approximately 20 cm away from the patient. To ensure consistent results, the subjects were instructed to maintain a constant voice intensity similar to that of a regular conversation. The recording consisted of the repetition of the vowel \a\ for approximately 5 s; if necessary, a couple of training tests were conducted to ensure correct speaking performance. Subsequently, all the recordings, sampled at 8000 Hz with a 32-bit resolution, underwent preprocessing using optimal filters to eliminate any background noise. It should be noted that the vocal recordings included in the dataset were already preprocessed, thus they did not present any noise components. To complete the database, additional personal information about the subjects, such as gender, age, alcohol consumption, and smoking habits, was included. Notably, the dataset consisted of 72 voice samples from male subjects and 136 samples from female subjects, resulting in an imbalance in gender representation. Furthermore, within the dataset, 150 voice samples exhibited pathological characteristics: 70 subjects, 47 females and 23 males, suffered from hyperkinetic dysphonia; 41 subjects, 9 females and 32 males, suffered from hypokinetic dysphonia; and 39 subjects, 19 females and 20 males, suffered from reflux laryngitis. By contrast, 58 voice samples were from healthy individuals, highlighting another imbalance in the distribution of healthy and diseased patients. It is noteworthy that the assessment of both healthy voices and the presence of voice disorders was conducted by medical experts who were actively engaged in the project. The observed imbalances in gender and health conditions are important considerations, with healthy male voice samples making up only 10% of the database, leading the study to expand the number of available samples by splitting the vocal recordings into segments of 30 s. With this approach, a larger dataset of 3928 samples was available. The generalization capabilities of the models were tested through a 10-fold cross-validation, and 10% of the study sample was used as a test set [41,42,43,44,45]. Importantly, in order to avoid overfitting effects due to the split of the available voice recordings, the vocal segments obtained from a recording were put in the same fold, avoiding the training and validation pools having samples from the same vocal recording. Furthermore, it should be considered that balanced classes were considered for each classification task. The numerosity of the classes used for the classification was set accordingly to the smaller class, and the samples of the larger class were selected randomly and in an iterative manner (10,000 iterations) in order to consider all the possible combinations of the available samples. In this study, several ML approaches have been employed for both the classification tasks: Linear Discriminant [46], Linear SMV, Quadratic SMV, Cubic SMV [47], Fine KNN [48], Narrow Neural Network, Medium Neural Network, Wide Neural Network, Bilayerd Neural Network, and Trilayered Neural Network [49]. Particularly, for the SMV models, the strategy for the multiclass classification was set on ‘One-vs-one’ [50], while the Fine KNN model was set on one neighbor and Euclidean distance as metrics for the classification task. Furthermore, the neural networks had a layer size of 10, 25 and 100 for the narrow, medium, and wide models, respectively, while the multilayered models had a uniform layer size of 10 each. The selection of the referenced models was made following a comprehensive review of the literature on the topic, with the goal of identifying the most effective and commonly employed ML model in the field of speech classification [51,52]. Further details on the structure of the database are reported in Table 1.
Building an ML model involves the critical task of selecting a suitable set of attributes or features to effectively train and test the classifier using samples. When considering speech samples, it becomes apparent that three primary categories of features can be extracted:
  • Prosodic features: these encompass the rhythm and intonation of the speaker. Due to their inherently subjective and controllable nature, their extraction presents challenges [53].
  • Frequency features: these features offer insights into the distribution of frequencies within the audio signal [54,55].
  • Voice quality features: this category provides information directly related to the overall quality of the speech sample [56,57].
In this investigation, acknowledgement of the unconventional nature of the speech samples was to be taken into consideration: the subjects were tasked with the repetition of the vowel/a/, which is not a properly conventional speech scenario. Given this distinct task, the standard features reported—prosodic features, frequency features, and voice quality features—were deemed inadequate for the analysis. Thus, our focus shifted toward advanced methodologies implied in speech and voice assessments, and more in general, into audio analysis. Our analysis centers on Mel-frequency cepstral coefficients (MFCCs) and the harmonic ratio as distinctive features, since attributes focused especially on frequency characteristics would hold little to no significance given the constant sound participants were required to make.
MFCCs are evaluated by obtaining the power spectrum through the fast Fourier transform (FFT) and subsequently mapping it onto the Mel scale, which is a perceptual scale of pitches that approximates the non-linear human auditory system response to different frequencies. Said mapping is achieved by passing the power spectrum through a series of triangular filters evenly spaced along the defined scale. Once the Mel-filtered energies are obtained, the logarithm of the powers at each Mel frequency is taken. This logarithmic operation helps to mimic the human ear’s sensitivity to changes in loudness at different frequencies. Next, a discrete cosine transform is applied to the logarithmic powers. The application of the DCT is aimed at decorrelating the values and emphasizing the most important features. The resulting coefficients represent the cepstral domain, which holds the essential characteristics of the signal. The utilization of 13 MFCCs aligns with established standards in audio processing, strategically balancing the need for a comprehensive representation of the spectral envelope while mitigating redundancy, thus overcoming the constancy of the sound. This way, the MFCCs collectively provide a nuanced snapshot of the vocal output during the prescribed task, working on a nonlinear frequency scale and thus providing an important description of the perceptual features of the human voice. In the cepstral domain, information about the rate changes in different spectrum bands is summarized owing to the computation of cepstral features through the Fourier transform of the warped logarithmic spectrum. This unique characteristic of cepstral features proves advantageous, as it facilitates the separation of the impact of the source (vocal cords) and filter (vocal tract) in a speech signal.
In detail, positive cepstral coefficients denote sonorant sounds, concentrating spectral energy in low-frequency regions, while negative coefficients signify fricative sounds, with predominant spectral energies at high frequencies. Furthermore, lower-order cepstral coefficients offer insights into the overall spectral shape of the source–filter transfer function, as, in fact, the zero-order coefficient indicates the average power of the input signal and the first-order coefficient represents the distribution of spectral energy between low and high frequencies. Although higher-order coefficients provide increasing levels of spectral details, optimal voice analysis typically involves selecting 12 to 20 cepstral coefficients.
It should be noted that, although the sound made by the subjects is rather simple and can thus easily be described by a small number of MFCCs, the choice of 13 coefficients has been deemed correct as it aligns with the majority of audio analyses that involve this type of processing [58] and so as to avoid underestimating the effect dysphonia can have on vocal characteristics.
Complementing the MFCC analysis, the harmonic ratio augments our exploration by providing insights into the degree of harmonicity in the voice. The features described were then normalized with a zero-score normalization technique. In summary, the ML classifier worked on 13 MFCCs and the harmonic ratio.
Separate tables, to be utilized in said ML applications, were prepared: one for each gender. These tables included the subjects’ IDs and gender—defined as 1 for males and 0 for females—indications of the health status—defined as 1 for diseased and 0 for healthy—and the 14 described attributes. Once the ML models were applied, the performance was evaluated through a measure of accuracy, as defined in Equation (1).
A c c u r a c y = N u m b e r   o f   C o r r e c t   P r e d i c t i o n s T o t a l   N u m b e r   o f   P r e d i c t i o n s
Concerning the accuracy associated with the training phase, it was obtained by averaging the accuracies delivered for each iteration performed, as described in Section 2.1. Moreover, in the binary classification task in this study, the outcomes were categorized into two actual classes (i.e., male and female, healthy and diseases) and two predicted classes, yielding four possible types of predictions. This led to four potential prediction types: True Positives (TPs) refer to the cases correctly identified as positive, True Negatives (TNs) refer to the cases correctly identified as negative, False Positives (FPs) refer to the cases incorrectly labeled as positive, and False Negatives (FNs) refer to the cases incorrectly labeled as negative. In order to assess the effectiveness of the model, a confusion matrix was employed, which is a 2 × 2 table that represents the actual and predicted classes in rows and columns, respectively. The matrix was filled with the frequencies of the TP, FP, FN, and TN outcomes, positioned in the top-left, top-right, bottom-left, and bottom-right cells, respectively.
Notably, the splitting of the vocal recordings, preparations of train and test tables, and ML models were performed through MATLAB 2022b©, particularly, in the case of the latter, with the aid of the Classification Learner tool, which encompasses a variety of models ready for implementation and presents output confusion matrices, enabling a quick assessment of performances. Notably, the number of predictors is significantly lower than the number of samples, hence allowing reduction of a possible overfitting effect.

2.2. Gender Classification

To assess the feasibility of implementing ML models for speech classification, an initial investigation aimed at distinguishing between genders was conducted. Tables for training and testing were built, consisting of 1000 and 400 samples, respectively. Notably, both tables contained an even number of male and female samples, selected randomly, with the purpose of avoiding biases such as overfitting, as described in Section 2.1. A wide spectrum of ML models was harnessed, spanning the range from linear discriminant and support vector machine to K-nearest neighbors and neural networks. Most of the models varied in complexity, encompassing coarse, medium, and narrow extensions. The selection of more than one model is explained by the will to understand which one is better suited for speech analysis and classification. Moreover, the classification process for each ML model underwent multiple iterations, generating tables anew each time. This approach facilitated the assessment of the average accuracy during both training and testing phases, offering insights into the stability of the models. In conclusion, the goals of this preliminary part of the study can be summarized as follows:
  • Understanding the feasibility of employing ML techniques in speech analysis for gender discrimination.
  • Defining the best models for the purpose.

2.3. Health Status Classification

In similarity with the previous task, a random selection process was conducted, following the same procedure described in the gender classification but this time acquiring samples exclusively from a single table and ensuring a balance between the number of pathological and healthy voice samples. In the end, the training pools consisted of 800 samples for the females and 480 samples for the males, while the test ones consisting of 200 and 100 samples, respectively.
The classification process pipeline is described in Figure 1.
Furthermore, a MANCOVA was performed for each MFCC to examine the effect of the independent variables (diagnosis–-healthy or diseased) on multiple dependent variables (the MFCCs), while controlling for covariates (age, gender, smoking habits, and alcohol consumption). This analysis helps in understanding if the differences in the MFCCs are significantly associated with the health status after accounting for the covariates.

3. Results

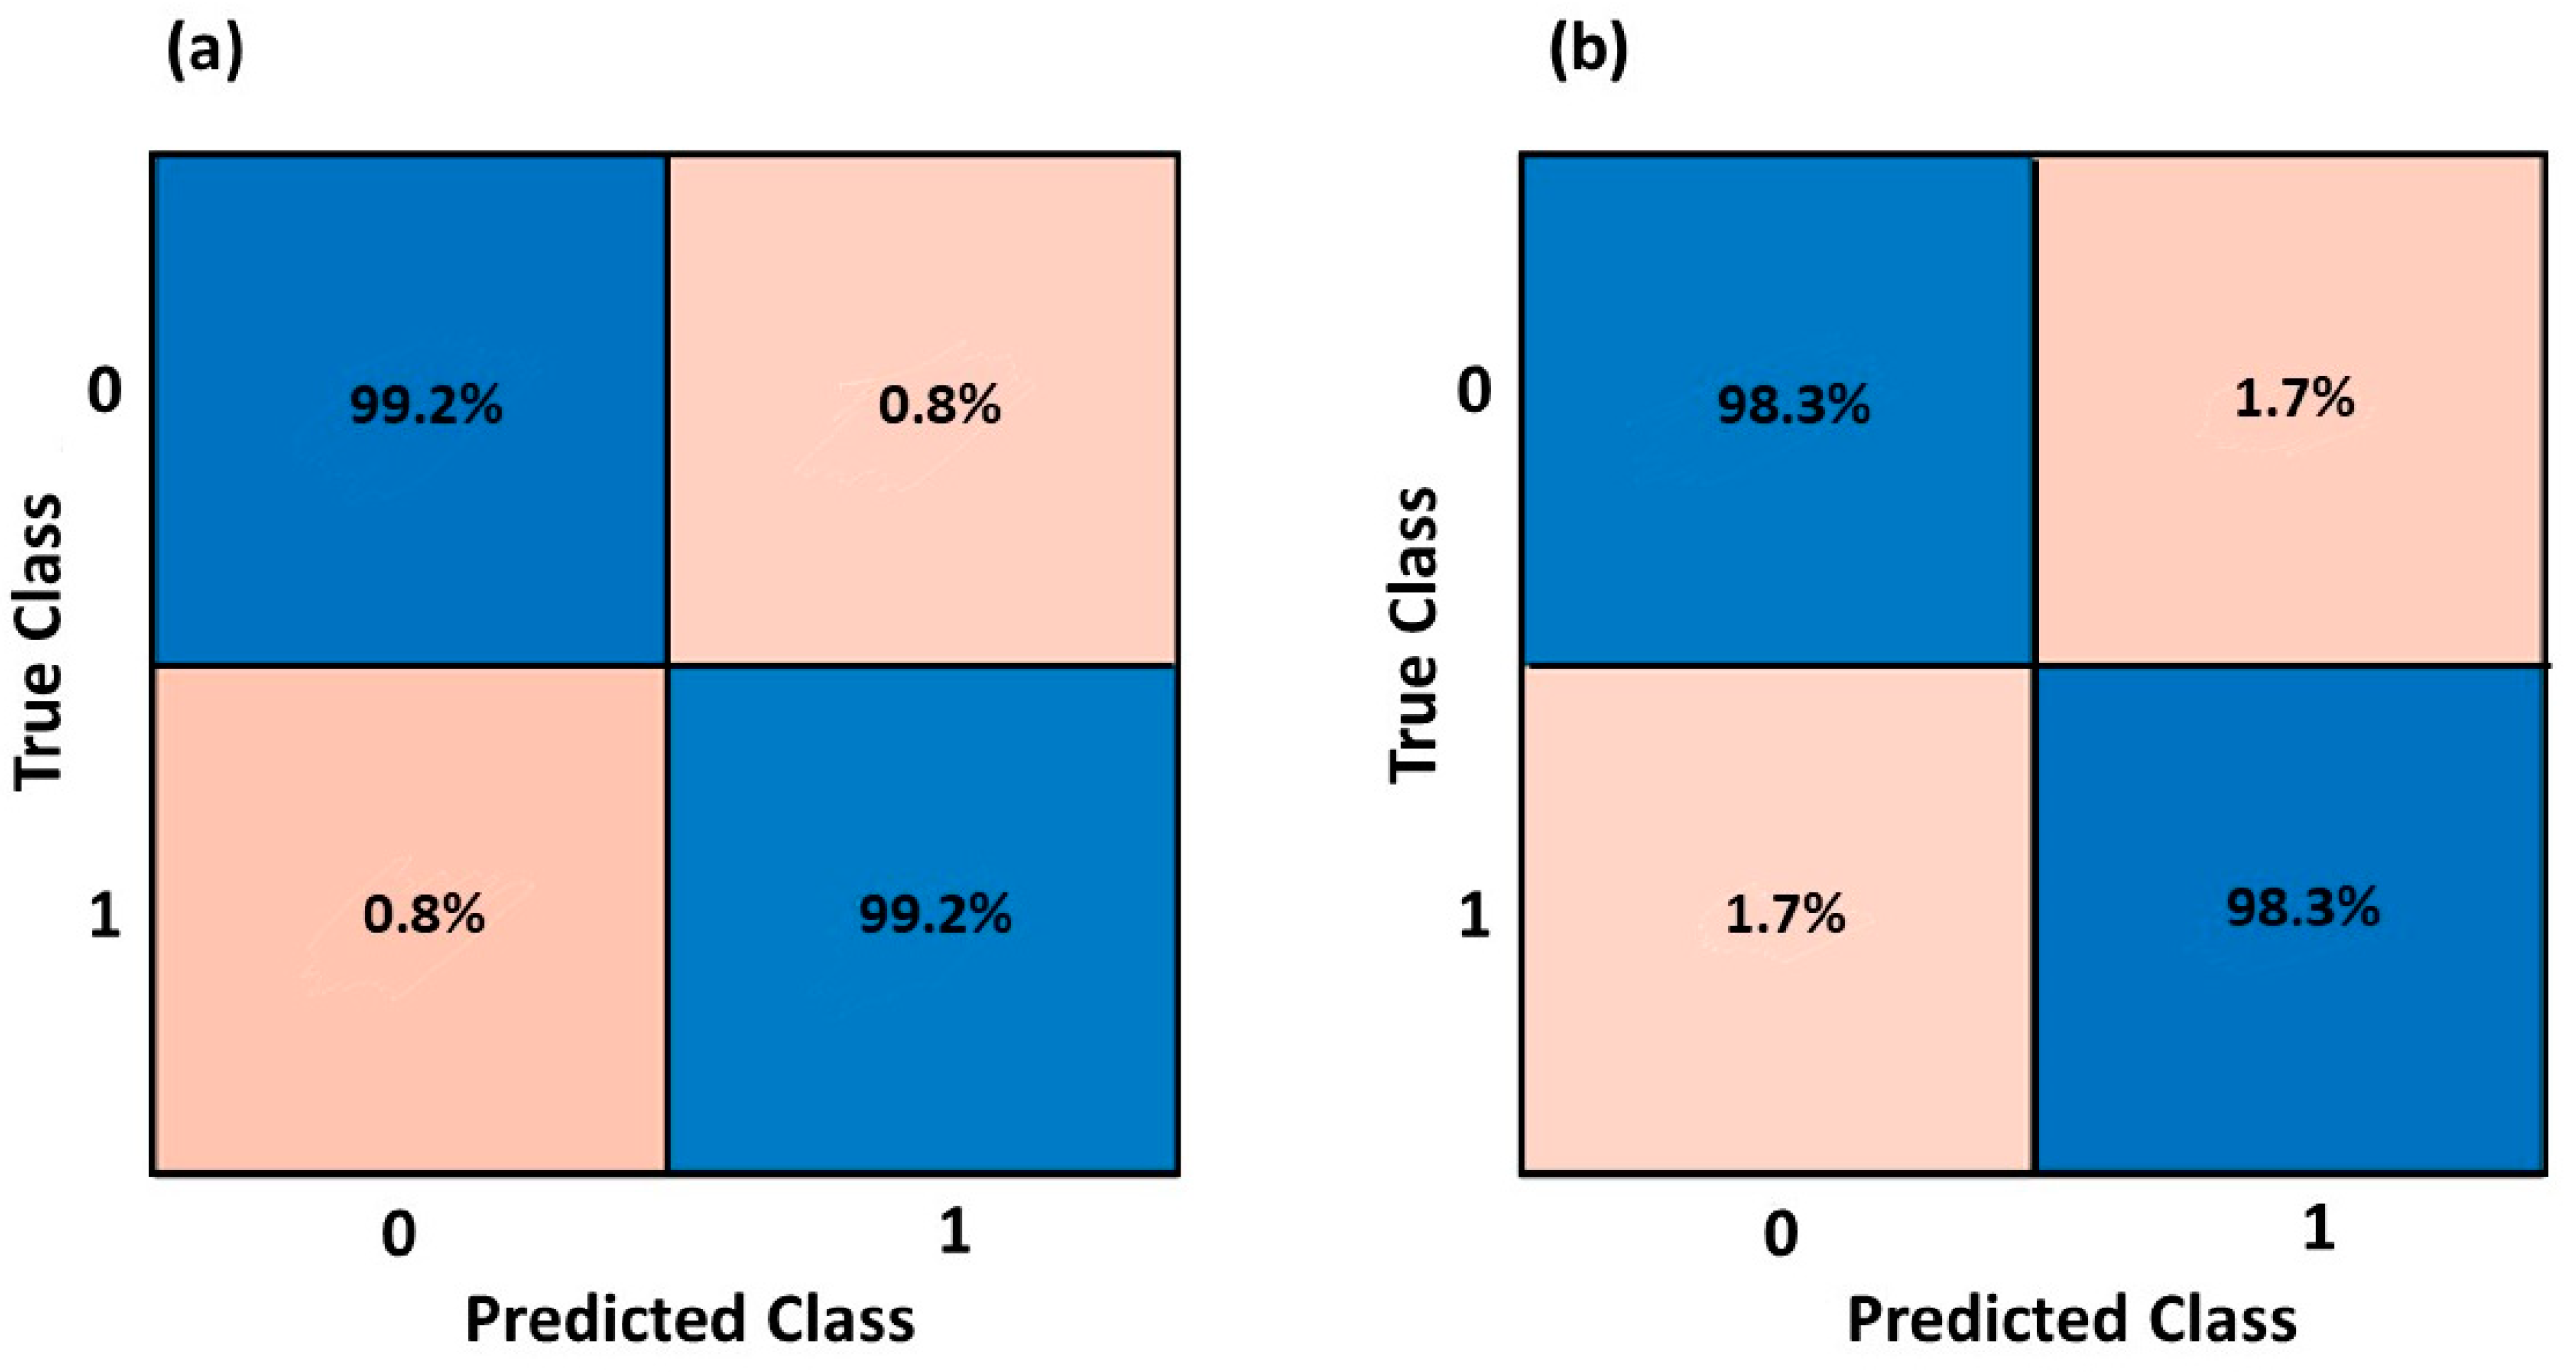
3.1. Gender Classification

Detailed results concerning the average performances in the training and testing phase of the various models are documented in Table 2 Notably, the training and testing phases were conducted on 1000 and 400 samples, respectively.
Of the multiple trials, the confusion matrices reporting the average results of the best performing model for the training and testing performances is shown in Figure 2.

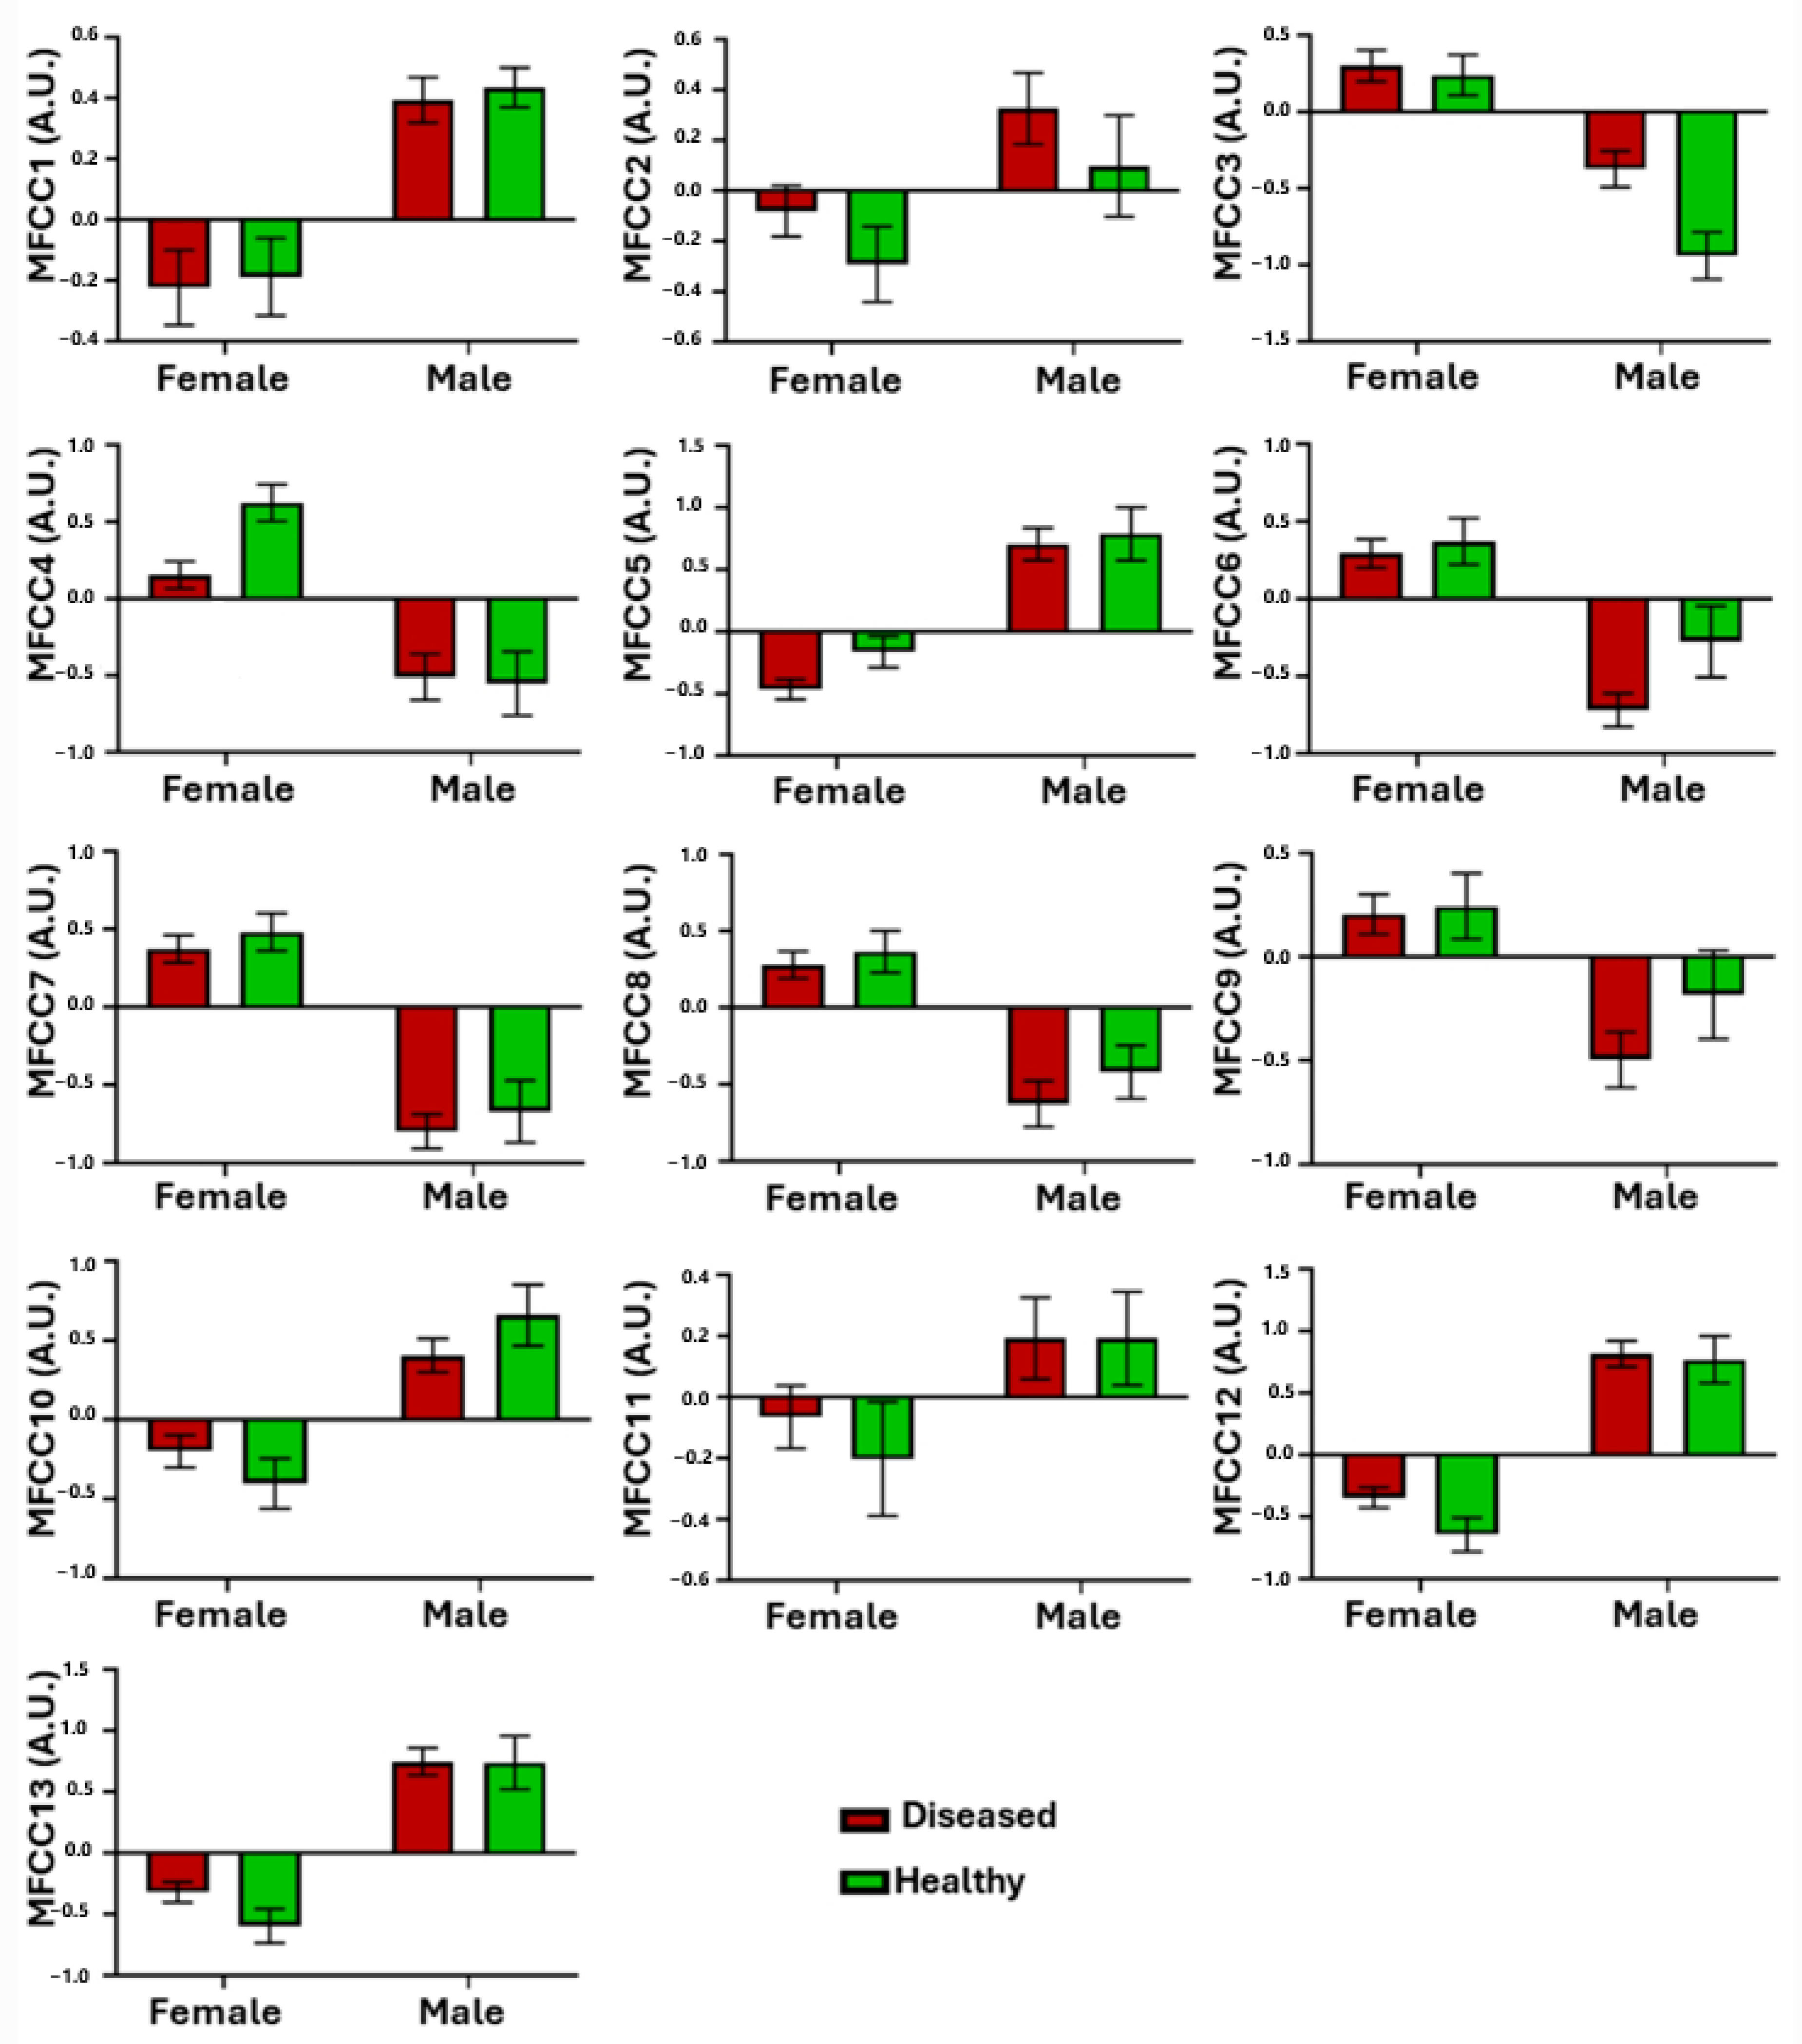
3.2. Health Status Classification

Detailed results concerning the average performances in the training and testing phase of the three models are documented in Table 3 and Table 4, respectively. Of the multiple trials, the confusion matrices reporting the average results for the training and testing health status classification performances, for both the male and female voices, are shown in Figure 3 and Figure 4, respectively. Notably, in the classification of the female voice recordings, the training and testing phases involved 800 and 480 instances, respectively. Meanwhile, for the classification of the male voice recordings, the training and testing phases included 200 and 100 instances, respectively.
The MANCOVA analysis showed a not significant difference between the MFCCs of the healthy and diseased groups (p = 0.0802). Importantly, the gender and the age exhibited significant differences between the two groups (p~0 and p = 0.0291, respectively), but only the interaction between the gender and the group was statistically significant (p = 0.0466).
In Figure 5, the distribution of the MFCCs categorized for gender and health status is displayed.

4. Discussion

This work constitutes a novel approach in the field of vocal health evaluation, with a specific emphasis on harnessing the capabilities of ML to identify and diagnose minor ailments of the vocal apparatus with the support of outdated devices. The primary methodology employed involves the analysis of vocal recordings obtained via smartphone technology. The main aim of this study was to examine the viability of employing this method, especially in cases involving vocal recordings of poorer quality. The study focused on two primary areas of investigation: the categorization of gender and the identification of vocal apparatus disorders. The ML algorithms were fed using the MFCCs, which are crucial to vocal analysis, especially for speech recognition and audio signal processing. The MFCCs simplify complex audio signals into a manageable set of coefficients, enabling advanced data analysis techniques such as ML approaches. In this study, the employment of MFCCs allows for a significant reduction in the dimensionality of the features. In fact, by encapsulating the most relevant aspects of the sound spectrum into a compact set of coefficients, they mitigate computational intensity and enhance the efficiency of ML models. Moreover, the representation of audio signals through MFCCs focuses on characteristics critical to speech comprehension, such as timbre and tone. This targeted representation contributes to the improved accuracy and effectiveness of the ML algorithms proposed in this study, as it allows the models to concentrate on pertinent features while disregarding extraneous noise and data.
In the gender classification task, the application of a Fine kNN model demonstrated exceptional performance, achieving a cross-validated accuracy of 98.3%. This outcome underscores the model’s capability to accurately distinguish between male and female voices. Notably, when compared to other machine learning models, comparable results were observed, with the lowest-performing model being Linear Regression, achieving an accuracy of 90.5%, and the second and third best-performing models being the Cubic SMV and the Medium Neural Network, achieving accuracies of 94.6% and 94.5%, respectively. The consistency of these results further emphasizes the robustness and reliability of the presented research.
Subsequently, the research shifted its emphasis toward the principal objective of detecting diseases within the voice apparatus. Once more, the majority of models produced promising results, notably the Fine kNN model, which exhibited an average accuracy of 95.5% for female classifications and 98.3% for male classifications. Additionally, the other models consistently yielded comparable outcomes, with the Cubic SMV emerging as the second-best model, achieving accuracies of 93.8% and 96.7% for female and male samples, respectively. This accomplishment showcases the model’s capacity to detect potential health concerns in the voice apparatus, even under less-than-ideal recording circumstances, and leverages a set of attributes for easy extraction.
It is worth mentioning that in trials involving the classification of health status, the average accuracy of the tests seemed to exceed the accuracy of the training phase, which may seem illogical at first glance. The observed discrepancy can be ascribed to the quantitative and stochastic characteristics of the criteria employed to partition the training and test datasets in each iteration, as elucidated in previous scholarly works [42].
The model that performed better in the classification task was the Fine kNN. Specifically, the model provided by MATLAB extends the principles of the kNN classification method, a non-parametric technique used for classification tasks. Operating on the basis of the k-closest training examples within the feature space, this model determines class membership through a plurality vote among its k-nearest neighbors, commonly a small positive integer. In essence, it assigns an object to the class most prevalent among its neighbors—with k = 1 resulting in direct classification based on the single element. Fine kNN, akin to traditional kNN, embodies instance-based learning, deferring computation until function evaluation and allowing local approximation of said function. Through MATLAB’s implementation, weighting schemes for the neighbors’ contributions can be applied, augmenting the algorithm’s adaptability and accuracy; though, for the study presented, default values have been employed. Particularly, k was set to 1, while the distance metric and weight were respectively set to Euclidean and Equal. Notably, Fine kNN, similar to kNN, exhibits sensitivity to the local data structure, contributing to its simplicity, versatility in handling various class numbers, and ease in addressing multi-class problems. Nevertheless, the model encounters challenges with computational intensity, particularly evident with large datasets, susceptibility to irrelevant or redundant features leading to diminished performance, and suboptimal performance with high-dimensional datasets. Despite these limitations, kNN remains popular in machine learning due to its simplicity and intuitive classification methodology for unknown instances.
While previous research has indeed demonstrated similar classification accuracies by utilizing different ML models and employing more intricate data preprocessing and feature extraction techniques on the same dataset [58,59], the main objective of this study was to demonstrate how a wide variety of models can perform well with simpler processing of the data, focusing solely on feature extraction, laying the foundations for future applications for early detection of more complex and severe diseases. Importantly, simpler models are usually computationally less intensive than complex ones, and they can run on less powerful hardware and require fewer resources, making them more accessible and cost-effective, especially in resource-constrained environments. Moreover, when a limited dataset is available, a simple model may generalize better and be less prone to overfitting, which can be a concern with more complex models. This methodology showcases a novel strategy for examining speech samples, presenting possibilities for future improvements.
The capability to detect vocal disorders through MFCCs is also confirmed by the MANCOVA analysis, showing significant differences between the two groups, as shown in Figure 5. It is worth highlighting that in the mentioned figure, the mean value and standard deviation of the MFCCs are reported, since they are sufficient to highlight the differences between the two groups. However, the complex features of statistics in the real-world could be considered. In detail, they span a wide range of areas, reflecting the intricate and multifaceted nature of data analysis and interpretation across different domains. These features often involve sophisticated statistical models, methods for handling large and diverse datasets, and techniques for making sense of uncertain or incomplete information [60,61].
The limitations of this study include the forced sampling of the original data, given the scarce number of healthy male samples. Indeed, this data augmentation procedure allowed us also to perform a classification of the healthy and pathological male voices. Importantly, despite the relatively limited sample size, the research was carried out using a nested cross-validation process (specifically, a 10-fold approach), which inherently assesses the performance of the model on unseen data [41,62]. Therefore, the findings obtained possess generalizability. Expanding the sample size has the potential to enhance performance by mitigating the risk of in-sample overfitting exhibited by the classifier. An additional crucial factor to take into consideration is that the dataset utilized for this study included a diverse range of voice disorders among the unhealthy subjects. These disorders may exhibit a wide range of variations and can manifest distinct acoustic properties. Therefore, during the data analysis process, this study examined a diverse range of vocal problems, each characterized by distinct attributes and difficulties. Therefore, given that the primary objective of vocal analysis, particularly in the context of diagnosing voice disorders, is to effectively categorize and distinguish distinct illnesses, additional measurements are certainly required. Increasing the size of the dataset will facilitate the attainment of accurate classification for a particular disease.
It is crucial to recognize that, in a realistic situation, participants would probably utilize various devices to carry out the vocal recordings. These devices may exhibit substantial variations in their specifications and operating conditions. Moreover, the angle at which the recordings are made, which can significantly impact the quality and attributes of the recorded audio, would also differ among different users. The presence of different types of devices and recording angles adds further intricacies that are crucial for the practical relevance of these findings. Nevertheless, the dataset lacked the comprehensive variety of devices and recording conditions that would typically be encountered in a real-life environment. In addition, the presence of ambient noise and the use of different recording settings can have a substantial effect on the quality of vocal recordings, which may obscure signs of vocal disorders or introduce distortions that could result in inaccurate results. Smartphone-based recordings lack standardization in terms of the distance from the microphone, volume, and speaking style, unlike controlled clinical environments. The absence of standardization can have an impact on the dependability of the recordings. The efficacy of the study may be impacted by the user’s proficiency in accurately adhering to the instructions for documenting their vocalizations. Moreover, the adherence of users to consistently documenting and transmitting voice samples can represent a restricting element. Consequently, additional research is required to examine the influence of these factors on the effectiveness of speech analysis algorithms in identifying vocal disorders. To conduct such research, it would be necessary to gather and analyze data from a larger and more diverse sample of devices, while also documenting the conditions under which the recordings were made. This approach would offer valuable insights into the resilience and applicability of the proposed methods across various recording environments. Comprehending these variables is essential for the creation of a diagnostic tool that can be universally applied and consistently perform under the diverse conditions encountered in regular use. It is noteworthy to state that supplementary experiments, which are not encompassed within the scope of this study, have investigated the discriminatory capacity of the aforementioned ML model in distinguishing between voice samples obtained from individuals who smoke and those who do not. The exploration of this captivating research area has encouraged the contemplation of assessing and harnessing the vocal modifications that manifest in individuals who initiate smoking for medicinal reasons. What is more, the weight of this study lies in the versatility of a good ML approach, with sights set on assessing how a pathology, the smoking or the alcohol consumption, could make the voice samples of two subjects alike and if specific frequency features are carried by different vocal disorders. Finally, it should be noted that the severity of the pathological conditions included in the database used in this study is not available, thus preventing the possibility of providing a more nuanced understanding of voice disorders and aiding in the development of more tailored and effective diagnostic models. This point highlights the necessity of further investigation on this topic.
The use of smartphones in medical research for voice diseases detection has gained significant attention. Studies have explored the development of artificial intelligence tools for predicting vocal cord pathology in primary care settings [63]. Additionally, the application of convolutional neural network ensembles and deep learning methods has been investigated for the detection of Parkinson’s disease from voice recordings, demonstrating the potential of smartphone-based voice analysis in disease detection [64,65]. Furthermore, research has shown the association of noninvasive vocal biomarkers with severe acute respiratory syndrome coronavirus 2 (SARS-CoV-2) infection [66], highlighting the potential of smartphone-based voice analysis in infectious disease detection [67].
These findings could be highly useful for society. In fact, the utilization of smartphones for voice problem identification has the potential to enhance the earliest identification of voice problems, which might result in prompt intervention and therapy. This intervention has the potential to enhance the therapeutic efficacy and mitigate the extent of voice abnormalities, hence leading to an enhanced quality of life for individuals affected by such conditions. In addition, smartphone-based screening can be cost-effective compared to traditional clinical assessments. Moreover, smartphones enable continuous monitoring of vocal health. Individuals with diagnosed conditions or those recovering from vocal disorders can use their devices to regularly monitor their condition, helping track progress or identify any deterioration in their condition. The use of telemedicine mitigates the necessity for regular face-to-face appointments, which could be costly and time-intensive for both patients and healthcare practitioners. In fact, healthcare practitioners have the ability to include smartphone-based vocal evaluations into telemedicine services, therefore facilitating remote consultations and enabling the monitoring of patients with voice abnormalities. This is particularly advantageous for people who have restricted mobility or who reside in physically remote regions. Individuals have the ability to actively participate in the monitoring of their voice health. This facilitates the active involvement of patients in their healthcare and promotes their inclination to seek appropriate medical intervention. Importantly, addressing privacy issues and ensuring the protection of individuals’ health data are imperative considerations when utilizing smartphone applications for the identification of voice disorders. From this perspective, the implementation of robust data security and privacy protocols is crucial in order to foster a sense of confidence among users. Furthermore, the widespread use of smartphones for vocal disorder detection can lead to the collection of a large amount of data, which can be invaluable for research. These data can help in understanding patterns in vocal disorders, contributing to better diagnostic tools, treatment methods, and overall knowledge in the field of otolaryngology. Finally, these findings could be useful for professional voice users, such as singers, teachers, and public speakers, who can use this technology for regular monitoring of their vocal health, which is crucial for their careers.
The distinctive contributions of this study lie in its innovative use of smartphone technology, the development of accurate and reliable diagnostic models, and the application of a simple ML framework. Together, these elements signify a considerable leap forward in making voice disorder screening more accessible, efficient, and inclusive, thereby having a profound impact on early detection and treatment strategies. Further studies, including a dataset encompassing a broad spectrum of voice disorders and collecting data from a wide demographic, including varied age groups, genders, and linguistic backgrounds, could ensure the robustness and generalizability of the diagnostic model.
Lastly, further investigations exploring novel algorithmic approaches and employing state-of-the-art data analysis techniques could push the boundaries of voice disorder screening procedures. In conclusion, this work has presented a complete approach for categorizing voice samples collected from both individuals without vocal disorders and those with vocal pathologies. The acquired results continuously demonstrate promise, indicating that as the database expands with additional speech samples, further enhancements are expected. This innovative methodology also establishes a fundamental basis for future investigations, potentially employing analogous patterns and models to evaluate a diverse array of medical ailments via speech analysis. This work provides insight into the promising possibilities of ML in the domain of vocal health evaluation, as it encompasses how consistent results can be achieved with an ML model working off a set of attributes for easy extraction, leaving wide room for improvements and developments when those features are implemented and demonstrating how essential tasks, as the health classification through vocal analysis, can be performed at low computational expenses and complexity, thus being accessible to everyone.

5. Conclusions

This study introduces an innovative methodology for classifying voice recordings obtained from an older-generation smartphone, with the potential for enhanced results as the utilized database expands. The significance of this work lies in the effectiveness of MFCCs as optimal features for classification tasks across various machine learning models. This suggests that vocal recordings acquired through smartphone microphones could be adequate for conducting at-home assessments of one’s health status. This paves the way for the development of simple yet innovative technologies, taking a step forward in the realm of personalized medicine. However, further studies are indeed necessary to improve the robustness of the findings.

Author Contributions

Conceptualization, M.G.D.C., D.P., D.C. and A.M.; methodology, M.G.D.C. and D.P.; software, M.G.D.C.; validation, M.G.D.C., D.P. and D.C.; formal analysis, M.G.D.C.; data curation, M.G.D.C. and D.P.; writing—original draft preparation, M.G.D.C. and D.P.; writing—review and editing, M.G.D.C., D.P., D.C. and A.M.; visualization, M.G.D.C. and D.P.; supervision, A.M.; project administration, A.M. All authors have read and agreed to the published version of the manuscript.

Funding

This research received no external funding.

Institutional Review Board Statement

Not applicable.

Informed Consent Statement

Not applicable.

Data Availability Statement

https://physionet.org/content/voiced/1.0.0/ (accessed on 12 April 2023).

Conflicts of Interest

The authors declare no conflicts of interest.

References

  1. Kumhar, M.; Bhatia, J.B. Edge Computing in SDN-Enabled IoT-Based Healthcare Frameworks: Challenges and Future Research Directions. Int. J. Reliab. Qual. E-Healthc. IJRQEH 2022, 11, 1–15. [Google Scholar] [CrossRef]
  2. Majumder, S.; Deen, M.J. Smartphone Sensors for Health Monitoring and Diagnosis. Sensors 2019, 19, 2164. [Google Scholar] [CrossRef]
  3. Beduk, T.; Beduk, D.; Hasan, M.R.; Guler Celik, E.; Kosel, J.; Narang, J.; Salama, K.N.; Timur, S. Smartphone-Based Multiplexed Biosensing Tools for Health Monitoring. Biosensors 2022, 12, 583. [Google Scholar] [CrossRef]
  4. Mei, Q.; Gül, M. A Crowdsourcing-Based Methodology Using Smartphones for Bridge Health Monitoring. Struct. Health Monit. 2019, 18, 1602–1619. [Google Scholar] [CrossRef]
  5. Durán-Vega, L.A.; Santana-Mancilla, P.C.; Buenrostro-Mariscal, R.; Contreras-Castillo, J.; Anido-Rifón, L.E.; García-Ruiz, M.A.; Montesinos-López, O.A.; Estrada-González, F. An IoT System for Remote Health Monitoring in Elderly Adults through a Wearable Device and Mobile Application. Geriatrics 2019, 4, 34. [Google Scholar] [CrossRef]
  6. Baig, M.M.; GholamHosseini, H.; Connolly, M.J. Mobile Healthcare Applications: System Design Review, Critical Issues and Challenges. Australas. Phys. Eng. Sci. Med. 2015, 38, 23–38. [Google Scholar] [CrossRef]
  7. Boccignone, G.; D’Amelio, A.; Ghezzi, O.; Grossi, G.; Lanzarotti, R. An Evaluation of Non-Contact Photoplethysmography-Based Methods for Remote Respiratory Rate Estimation. Sensors 2023, 23, 3387. [Google Scholar] [CrossRef]
  8. Isakadze, N.; Martin, S.S. How Useful Is the Smartwatch ECG? Trends Cardiovasc. Med. 2020, 30, 442–448. [Google Scholar] [CrossRef]
  9. Hekler, E.B.; Buman, M.P.; Grieco, L.; Rosenberger, M.; Winter, S.J.; Haskell, W.; King, A.C. Validation of Physical Activity Tracking via Android Smartphones Compared to ActiGraph Accelerometer: Laboratory-Based and Free-Living Validation Studies. JMIR mHealth uHealth 2015, 3, e3505. [Google Scholar] [CrossRef]
  10. Di Credico, A.; Petri, C.; Cataldi, S.; Greco, G.; Suarez-Arrones, L.; Izzicupo, P. Heart Rate Variability, Recovery and Stress Analysis of an Elite Rally Driver and Co-Driver during a Competition Period. Sci. Prog. 2024, 107, 00368504231223034. [Google Scholar] [CrossRef]
  11. Di Credico, A.; Perpetuini, D.; Chiacchiaretta, P.; Cardone, D.; Filippini, C.; Gaggi, G.; Merla, A.; Ghinassi, B.; Di Baldassarre, A.; Izzicupo, P. The Prediction of Running Velocity during the 30–15 Intermittent Fitness Test Using Accelerometry-Derived Metrics and Physiological Parameters: A Machine Learning Approach. Int. J. Environ. Res. Public. Health 2021, 18, 10854. [Google Scholar] [CrossRef]
  12. Uloza, V.; Padervinskis, E.; Vegiene, A.; Pribuisiene, R.; Saferis, V.; Vaiciukynas, E.; Gelzinis, A.; Verikas, A. Exploring the Feasibility of Smart Phone Microphone for Measurement of Acoustic Voice Parameters and Voice Pathology Screening. Eur. Arch. Otorhinolaryngol. 2015, 272, 3391–3399. [Google Scholar] [CrossRef]
  13. Jannetts, S.; Schaeffler, F.; Beck, J.; Cowen, S. Assessing Voice Health Using Smartphones: Bias and Random Error of Acoustic Voice Parameters Captured by Different Smartphone Types. Int. J. Lang. Commun. Disord. 2019, 54, 292–305. [Google Scholar] [CrossRef]
  14. Lee, Y.; Kim, G.; Kwon, S. The Usefulness of Auditory Perceptual Assessment and Acoustic Analysis for Classifying the Voice Severity. J. Voice 2020, 34, 884–893. [Google Scholar] [CrossRef]
  15. Van der Woerd, B.; Wu, M.; Parsa, V.; Doyle, P.C.; Fung, K. Evaluation of Acoustic Analyses of Voice in Nonoptimized Conditions. J. Speech Lang. Hear. Res. 2020, 63, 3991–3999. [Google Scholar] [CrossRef]
  16. Lee, S.J.; Lee, K.Y.; Choi, H.-S. Clinical Usefulness of Voice Recordings Using a Smartphone as a Screening Tool for Voice Disorders. Commun. Sci. Disord. 2018, 23, 1065–1077. [Google Scholar] [CrossRef]
  17. Awan, S.N.; Shaikh, M.A.; Awan, J.A.; Abdalla, I.; Lim, K.O.; Misono, S. Smartphone Recordings Are Comparable to “Gold Standard” Recordings for Acoustic Measurements of Voice. J. Voice 2023, in press. [Google Scholar] [CrossRef]
  18. Fahed, V.S.; Doheny, E.P.; Busse, M.; Hoblyn, J.; Lowery, M.M. Comparison of Acoustic Voice Features Derived from Mobile Devices and Studio Microphone Recordings. J. Voice 2022, in press. [Google Scholar] [CrossRef]
  19. Amato, F.; Saggio, G.; Cesarini, V.; Olmo, G.; Costantini, G. Machine Learning-and Statistical-Based Voice Analysis of Parkinson’s Disease Patients: A Survey. Expert Syst. Appl. 2023, 219, 119651. [Google Scholar] [CrossRef]
  20. da Silva, G.d.A.P.; Feltrin, T.D.; dos Santos Pichini, F.; Cielo, C.A.; Pasqualoto, A.S. Quality of Life Predictors in Voice of Individuals with Chronic Obstructive Pulmonary Disease. J. Voice 2022, in press. [Google Scholar] [CrossRef]
  21. Ruiz, R.; Legros, C.; Guell, A. Voice Analysis to Predict the Psychological or Physical State of a Speaker. Aviat. Space Environ. Med. 1990, 61, 266–271. [Google Scholar]
  22. Alonso-Martin, F.; Malfaz, M.; Sequeira, J.; Gorostiza, J.F.; Salichs, M.A. A Multimodal Emotion Detection System during Human–Robot Interaction. Sensors 2013, 13, 15549–15581. [Google Scholar] [CrossRef]
  23. Chamishka, S.; Madhavi, I.; Nawaratne, R.; Alahakoon, D.; De Silva, D.; Chilamkurti, N.; Nanayakkara, V. A Voice-Based Real-Time Emotion Detection Technique Using Recurrent Neural Network Empowered Feature Modelling. Multimed. Tools Appl. 2022, 81, 35173–35194. [Google Scholar] [CrossRef]
  24. Asci, F.; Costantini, G.; Di Leo, P.; Zampogna, A.; Ruoppolo, G.; Berardelli, A.; Saggio, G.; Suppa, A. Machine-Learning Analysis of Voice Samples Recorded through Smartphones: The Combined Effect of Ageing and Gender. Sensors 2020, 20, 5022. [Google Scholar] [CrossRef]
  25. Saloni; Sharma, R.K.; Gupta, A.K. Disease Detection Using Voice Analysis: A Review. Int. J. Med. Eng. Inform. 2014, 6, 189–209. [Google Scholar] [CrossRef]
  26. Baker, J.; Ben-Tovim, D.I.; Butcher, A.; Esterman, A.; McLaughlin, K. Development of a Modified Diagnostic Classification System for Voice Disorders with Inter-Rater Reliability Study. Logop. Phoniatr. Vocol. 2007, 32, 99–112. [Google Scholar] [CrossRef]
  27. Shrivas, A.; Deshpande, S.; Gidaye, G.; Nirmal, J.; Ezzine, K.; Frikha, M.; Desai, K.; Shinde, S.; Oza, A.D.; Burduhos-Nergis, D.D. Employing Energy and Statistical Features for Automatic Diagnosis of Voice Disorders. Diagnostics 2022, 12, 2758. [Google Scholar] [CrossRef]
  28. Roy, N.; Barkmeier-Kraemer, J.; Eadie, T.; Sivasankar, M.P.; Mehta, D.; Paul, D.; Hillman, R. Evidence-Based Clinical Voice Assessment: A Systematic Review. Am. J. Speech-Lang. Pathol. 2013, 22, 212–226. [Google Scholar] [CrossRef]
  29. Jothilakshmi, S. Automatic System to Detect the Type of Voice Pathology. Appl. Soft Comput. 2014, 21, 244–249. [Google Scholar] [CrossRef]
  30. Panek, D.; Skalski, A.; Gajda, J.; Tadeusiewicz, R. Acoustic Analysis Assessment in Speech Pathology Detection. Int. J. Appl. Math. Comput. Sci. 2015, 25, 631–643. [Google Scholar] [CrossRef]
  31. Vizza, P.; Tradigo, G.; Mirarchi, D.; Bossio, R.B.; Lombardo, N.; Arabia, G.; Quattrone, A.; Veltri, P. Methodologies of Speech Analysis for Neurodegenerative Diseases Evaluation. Int. J. Med. Inf. 2019, 122, 45–54. [Google Scholar] [CrossRef]
  32. Kowalska-Taczanowska, R.; Friedman, A.; Koziorowski, D. Parkinson’s Disease or Atypical Parkinsonism? The Importance of Acoustic Voice Analysis in Differential Diagnosis of Speech Disorders. Brain Behav. 2020, 10, e01700. [Google Scholar] [CrossRef]
  33. Khanzode, K.C.A.; Sarode, R.D. Advantages and Disadvantages of Artificial Intelligence and Machine Learning: A Literature Review. Int. J. Libr. Inf. Sci. IJLIS 2020, 9, 3. [Google Scholar]
  34. Kindle, R.D.; Badawi, O.; Celi, L.A.; Sturland, S. Intensive Care Unit Telemedicine in the Era of Big Data, Artificial Intelligence, and Computer Clinical Decision Support Systems. Crit. Care Clin. 2019, 35, 483–495. [Google Scholar] [CrossRef]
  35. Aazam, M.; Zeadally, S.; Flushing, E.F. Task Offloading in Edge Computing for Machine Learning-Based Smart Healthcare. Comput. Netw. 2021, 191, 108019. [Google Scholar] [CrossRef]
  36. Salman, O.H.; Taha, Z.; Alsabah, M.Q.; Hussein, Y.S.; Mohammed, A.S.; Aal-Nouman, M. A Review on Utilizing Machine Learning Technology in the Fields of Electronic Emergency Triage and Patient Priority Systems in Telemedicine: Coherent Taxonomy, Motivations, Open Research Challenges and Recommendations for Intelligent Future Work. Comput. Methods Programs Biomed. 2021, 209, 106357. [Google Scholar] [CrossRef] [PubMed]
  37. Hjelm, N.M. Benefits and Drawbacks of Telemedicine. In Introduction to Telemedicine, 2nd ed.; CRC Press: Boca Raton, FL, USA, 2017; pp. 134–149. [Google Scholar]
  38. Cesari, U.; De Pietro, G.; Marciano, E.; Niri, C.; Sannino, G.; Verde, L. A New Database of Healthy and Pathological Voices. Comput. Electr. Eng. 2018, 68, 310–321. [Google Scholar] [CrossRef]
  39. Goldberger, A.L.; Amaral, L.A.; Glass, L.; Hausdorff, J.M.; Ivanov, P.C.; Mark, R.G.; Mietus, J.E.; Moody, G.B.; Peng, C.-K.; Stanley, H.E. PhysioBank, PhysioToolkit, and PhysioNet: Components of a New Research Resource for Complex Physiologic Signals. Circulation 2000, 101, e215–e220. [Google Scholar] [CrossRef]
  40. Verde, L.; De Pietro, G.; Veltri, P.; Sannino, G. An M-Health System for the Estimation of Voice Disorders. In Proceedings of the 2015 IEEE International Conference on Multimedia & Expo Workshops (ICMEW), Turin, Italy, 29 June–3 July 2015; pp. 1–6. [Google Scholar]
  41. Kohavi, R. A Study of Cross-Validation and Bootstrap for Accuracy Estimation and Model Selection. In Proceedings of the 14th International Joint Conference on Artificial Intelligence—Volume 2; Morgan Kaufmann Publishers Inc.: San Francisco, CA, USA, 1995; pp. 1137–1143. [Google Scholar]
  42. Yoon, H. Finding Unexpected Test Accuracy by Cross Validation in Machine Learning. Int. J. Comput. Sci. Netw. Secur. 2021, 21, 549–555. [Google Scholar]
  43. Di Credico, A.; Perpetuini, D.; Izzicupo, P.; Gaggi, G.; Cardone, D.; Filippini, C.; Merla, A.; Ghinassi, B.; Di Baldassarre, A. Estimation of Heart Rate Variability Parameters by Machine Learning Approaches Applied to Facial Infrared Thermal Imaging. Front. Cardiovasc. Med. 2022, 9, 893374. [Google Scholar] [CrossRef]
  44. Chiarelli, A.M.; Perpetuini, D.; Croce, P.; Filippini, C.; Cardone, D.; Rotunno, L.; Anzoletti, N.; Zito, M.; Zappasodi, F.; Merla, A. Evidence of Neurovascular Un-Coupling in Mild Alzheimer’s Disease through Multimodal EEG-fNIRS and Multivariate Analysis of Resting-State Data. Biomedicines 2021, 9, 337. [Google Scholar] [CrossRef]
  45. Perpetuini, D.; Di Credico, A.; Filippini, C.; Izzicupo, P.; Cardone, D.; Chiacchiaretta, P.; Ghinassi, B.; Di Baldassarre, A.; Merla, A. Is It Possible to Estimate Average Heart Rate from Facial Thermal Imaging? Eng. Proc. 2021, 8, 10. [Google Scholar]
  46. Tharwat, A.; Gaber, T.; Ibrahim, A.; Hassanien, A.E. Linear Discriminant Analysis: A Detailed Tutorial. Ai Commun. 2017, 30, 169–190. [Google Scholar] [CrossRef]
  47. Evgeniou, T.; Pontil, M. Support Vector Machines: Theory and Applications; Springer Science & Business Media: New York, NY, USA, 2001; Volume 2049, pp. 249–257. [Google Scholar]
  48. Zhang, Z. Introduction to Machine Learning: K-Nearest Neighbors. Ann. Transl. Med. 2016, 4, 218. [Google Scholar] [CrossRef]
  49. Vapnik, V.N. An Overview of Statistical Learning Theory. IEEE Trans. Neural Netw. 1999, 10, 988–999. [Google Scholar] [CrossRef]
  50. Hsu, C.-W.; Lin, C.-J. A Comparison of Methods for Multiclass Support Vector Machines. IEEE Trans. Neural Netw. 2002, 13, 415–425. [Google Scholar] [CrossRef]
  51. Lu, L.; Zhang, H.-J.; Li, S.Z. Content-Based Audio Classification and Segmentation by Using Support Vector Machines. Multimed. Syst. 2003, 8, 482–492. [Google Scholar] [CrossRef]
  52. Kostyuchenko, E.; Rakhmanenko, I.; Balatskaya, L. Assessment of Speech Quality During Speech Rehabilitation Based on the Solution of the Classification Problem. In Proceedings of the Speech and Computer; Prasanna, S.R.M., Karpov, A., Samudravijaya, K., Agrawal, S.S., Eds.; Springer International Publishing: Cham, Switzerland, 2022; pp. 382–390. [Google Scholar]
  53. Mary, L.; Yegnanarayana, B. Extraction and Representation of Prosodic Features for Language and Speaker Recognition. Speech Commun. 2008, 50, 782–796. [Google Scholar] [CrossRef]
  54. Mukherjee, H.; Obaidullah, S.M.; Santosh, K.C.; Phadikar, S.; Roy, K. Line Spectral Frequency-Based Features and Extreme Learning Machine for Voice Activity Detection from Audio Signal. Int. J. Speech Technol. 2018, 21, 753–760. [Google Scholar] [CrossRef]
  55. Karan, B.; Sahu, S.S.; Orozco-Arroyave, J.R.; Mahto, K. Non-Negative Matrix Factorization-Based Time-Frequency Feature Extraction of Voice Signal for Parkinson’s Disease Prediction. Comput. Speech Lang. 2021, 69, 101216. [Google Scholar] [CrossRef]
  56. Lugger, M.; Yang, B. The Relevance of Voice Quality Features in Speaker Independent Emotion Recognition. In Proceedings of the 2007 IEEE International Conference on Acoustics, Speech and Signal Processing-ICASSP’07, Honolulu, HI, USA, 15–20 April 2007; Volume 4, pp. IV-17–IV-20. [Google Scholar]
  57. Keller, E. The Analysis of Voice Quality in Speech Processing. In International School on Neural Networks, Initiated by IIASS and EMFCSC; Springer: Berlin/Heidelberg, Germany, 2004; pp. 54–73. [Google Scholar]
  58. Chen, L.; Wang, C.; Chen, J.; Xiang, Z.; Hu, X. Voice Disorder Identification by Using Hilbert-Huang Transform (HHT) and K Nearest Neighbor (KNN). J. Voice 2021, 35, 932.e1–932.e11. [Google Scholar] [CrossRef] [PubMed]
  59. Chen, L.; Chen, J. Deep Neural Network for Automatic Classification of Pathological Voice Signals. J. Voice 2022, 36, 288.e15–288.e24. [Google Scholar] [CrossRef]
  60. Zhang, X.; Ding, Y.; Zhao, H.; Yi, L.; Guo, T.; Li, A.; Zou, Y. Mixed Skewness Probability Modeling and Extreme Value Predicting for Physical System Input–Output Based on Full Bayesian Generalized Maximum-Likelihood Estimation. IEEE Trans. Instrum. Meas. 2024, 73, 2504516. [Google Scholar] [CrossRef]
  61. Filippini, C.; Di Crosta, A.; Palumbo, R.; Perpetuini, D.; Cardone, D.; Ceccato, I.; Di Domenico, A.; Merla, A. Automated Affective Computing Based on Bio-Signals Analysis and Deep Learning Approach. Sensors 2022, 22, 1789. [Google Scholar] [CrossRef]
  62. Schaffer, C. Selecting a Classification Method by Cross-Validation. Mach. Learn. 1993, 13, 135–143. [Google Scholar] [CrossRef]
  63. Compton, E.C.; Cruz, T.; Andreassen, M.; Beveridge, S.; Bosch, D.; Randall, D.R.; Livingstone, D. Developing an Artificial Intelligence Tool to Predict Vocal Cord Pathology in Primary Care Settings. Laryngoscope 2023, 133, 1952–1960. [Google Scholar] [CrossRef]
  64. Hireš, M.; Gazda, M.; Drotar, P.; Pah, N.D.; Motin, M.A.; Kumar, D.K. Convolutional Neural Network Ensemble for Parkinson’s Disease Detection from Voice Recordings. Comput. Biol. Med. 2022, 141, 105021. [Google Scholar] [CrossRef]
  65. Mahmood, A.; Mehroz Khan, M.; Imran, M.; Alhajlah, O.; Dhahri, H.; Karamat, T. End-to-End Deep Learning Method for Detection of Invasive Parkinson’s Disease. Diagnostics 2023, 13, 1088. [Google Scholar] [CrossRef]
  66. Perpetuini, D.; Filippini, C.; Cardone, D.; Merla, A. An Overview of Thermal Infrared Imaging-Based Screenings during Pandemic Emergencies. Int. J. Environ. Res. Public. Health 2021, 18, 3286. [Google Scholar] [CrossRef]
  67. Maor, E.; Tsur, N.; Barkai, G.; Meister, I.; Makmel, S.; Friedman, E.; Aronovich, D.; Mevorach, D.; Lerman, A.; Zimlichman, E. Noninvasive Vocal Biomarker Is Associated with Severe Acute Respiratory Syndrome Coronavirus 2 Infection. Mayo Clin. Proc. Innov. Qual. Outcomes 2021, 5, 654–662. [Google Scholar] [CrossRef]
Figure 1. Classification process pipeline: the voice recordings have been split into windows of 30 s. Then, informative features have been extracted and used as input for the ML framework.
Biomedinformatics 04 00031 g001
Figure 2. (a) Confusion matrix showing the average training performance of a fine k-nearest neighbor model for gender classification. Accuracy: 97.9%, Sensitivity: 98.6%, Specificity: 97.2%. (b) Confusion matrix showing the average testing performance of a fine k-nearest neighbor model for gender classification. Accuracy: 98.0%, Sensitivity: 98.4%, Specificity: 97.5%.
Biomedinformatics 04 00031 g002
Figure 3. (a) Confusion matrix showing the average training performance of a fine k-nearest neighbor model applied to the female samples. Accuracy: 97.0%, Sensitivity: 95.6%, Specificity: 98.4%. (b) Confusion matrix showing the average testing performance of fine k-nearest neighbor model applied to the female samples. Accuracy: 95.5%, Sensitivity: 94.2%, Specificity: 96.9%.
Biomedinformatics 04 00031 g003
Figure 4. (a) Confusion matrix showing the average training performance of a fine k-nearest neighbor model, applied to the male samples. Accuracy: 99.2%, Sensitivity: 99.2%, Specificity: 99.2%. (b) Confusion matrix showing the average testing performance of fine k-nearest neighbor model applied to the male samples. Accuracy: 98.3% Sensitivity: 98.3%, Specificity: 98.3%.
Biomedinformatics 04 00031 g004
Figure 5. Bar graph reporting the MFCCs categorized for gender and health status. The results are shown as the mean and standard error.
Biomedinformatics 04 00031 g005
Table 1. Detailed contents of the subjects’ information.
SectionOptionsValues (Number of Subjects)
General InformationAge
Gender
Diagnosis
Occupational status
Healthy (58), reflux laryngitis (39), hypokinetic dysphonia (41), hyperkinetic dysphonia (70)
Medical QuestionnairesVoice Handicap Index (VHI)
Reflux Symptom Index (RSI)
0–120
0–45
Smoking HabitsSmoker
Number of cigarettes smoked per day
No, casual smoker, habitual
Drinking habitsAlcohol consumption
Number of glasses containing alcoholic beverage drunk in a day
Amount of water’s liters drunk every day
No, casual drinker, habitual drinker
Table 2. Detailed performances for the gender classification. The best accuracy for both the training and test sets is reported in bold.
ModelTrain: Average AccuracyTest: Average AccuracySensitivitySpecificity
Linear Discriminant90.6%90.5%89.2%91.8%
Linear SMV91.2%91.5%92.7%90.3%
Quadratic SMV95.1%95.7%94.4%97.0%
Cubic SMV95.7%96.4%98.4%94.4%
Fine KNN98.0%98.3%98.3%98.3%
Narrow Neural Network94.6%95.4%94.2%96.6%
Medium Neural Network95.3%96.5%97.7%95.3%
Wide Neural Network95.7%95.4%94.2%96.6%
Bilayerd Neural Network95.0%94.0%92.0%96.0%
Trilayered Neural Network94.7%94.9%94.1%95.7%
Table 3. Detailed performances for the health status classification for females. The best accuracy for both the training and test sets is reported in bold.
ModelTrain: Average AccuracyTest: Average AccuracySensitivitySpecificity
Linear Discriminant70.1%75.5%71.8%80.7%
Linear SMV71.4%74.5%75.8%73.2%
Quadratic SMV86.5%85.5%91.5%79.5%
Cubic SMV92.5%93.8%94.0%93.6%
Fine KNN96.3%95.5%95.0%96.0%
Narrow Neural Network89.1%88.7%90.9%86.5%
Medium Neural Network90.8%90.5%90.0%91.0%
Wide Neural Network92.9%92.2%91.6%92.9%
Bilayerd Neural Network89.9%89.7%92.9%86.5%
Trilayered Neural Network89.2%89.8%93.0%86.6%
Table 4. Detailed performances for the health status classification of the male divided samples. The best accuracy for both the training and test sets is reported in bold.
ModelTrain: Average AccuracyTest: Average AccuracySensitivitySpecificity
Linear Discriminant66.7%66.7%69.9%63.5%
Linear SMV60.5%67.3%66.9%67.7%
Quadratic SMV67.1%80.0%79.5%80.5%
Cubic SMV76.9%96.7%95.9%97.5%
Fine KNN98.3%98.3%97.9%98.4%
Narrow Neural Network98.5%90.5%90.0%91.0%
Medium Neural Network92.3%92.5%92.1%92.9%
Wide Neural Network92.4%93.9%92.7%94.1%
Bilayerd Neural Network90.6%93.0%92.5%93.5%
Trilayered Neural Network90.3%89.7%92.9%86.5%
Disclaimer/Publisher’s Note: The statements, opinions and data contained in all publications are solely those of the individual author(s) and contributor(s) and not of MDPI and/or the editor(s). MDPI and/or the editor(s) disclaim responsibility for any injury to people or property resulting from any ideas, methods, instructions or products referred to in the content.

