Projection of High-Dimensional Genome-Wide Expression on SOM Transcriptome Landscapes
Abstract
:1. Introduction
2. Materials and Methods
2.1. General Workflow
2.2. Self-Organizing Map (SOM) Training and Downstream Functional Analysis
2.3. Extension SOM Training (exSOM)
- Training profile selection: A gene profile (i.e., a vector of expression values for all samples) is selected, usually by sequential order.
- Determination of best-matching meta-gene: The meta-gene profile, which is the most similar to the training profile, is determined using the Euclidean distance metric. Importantly, only data points corresponding to the original samples contribute to the similarity metric; data points of the extension samples are not considered in this step. This ensures that gene to meta-gene assignment is not altered by adding the extension samples when compared to the primary SOM training.
- Meta-gene adaptation: The expression values of the meta-genes are adapted according to the Hebbian learning rule according to the original SOM training algorithm [16]. It combines the difference between the training and the meta-gene profiles with a learning rate and a neighborhood factor, both incrementally decreasing as the training proceeds. In this step, samples from the original and the extension set are considered, resulting in iteratively optimized meta-gene expression values for all samples.
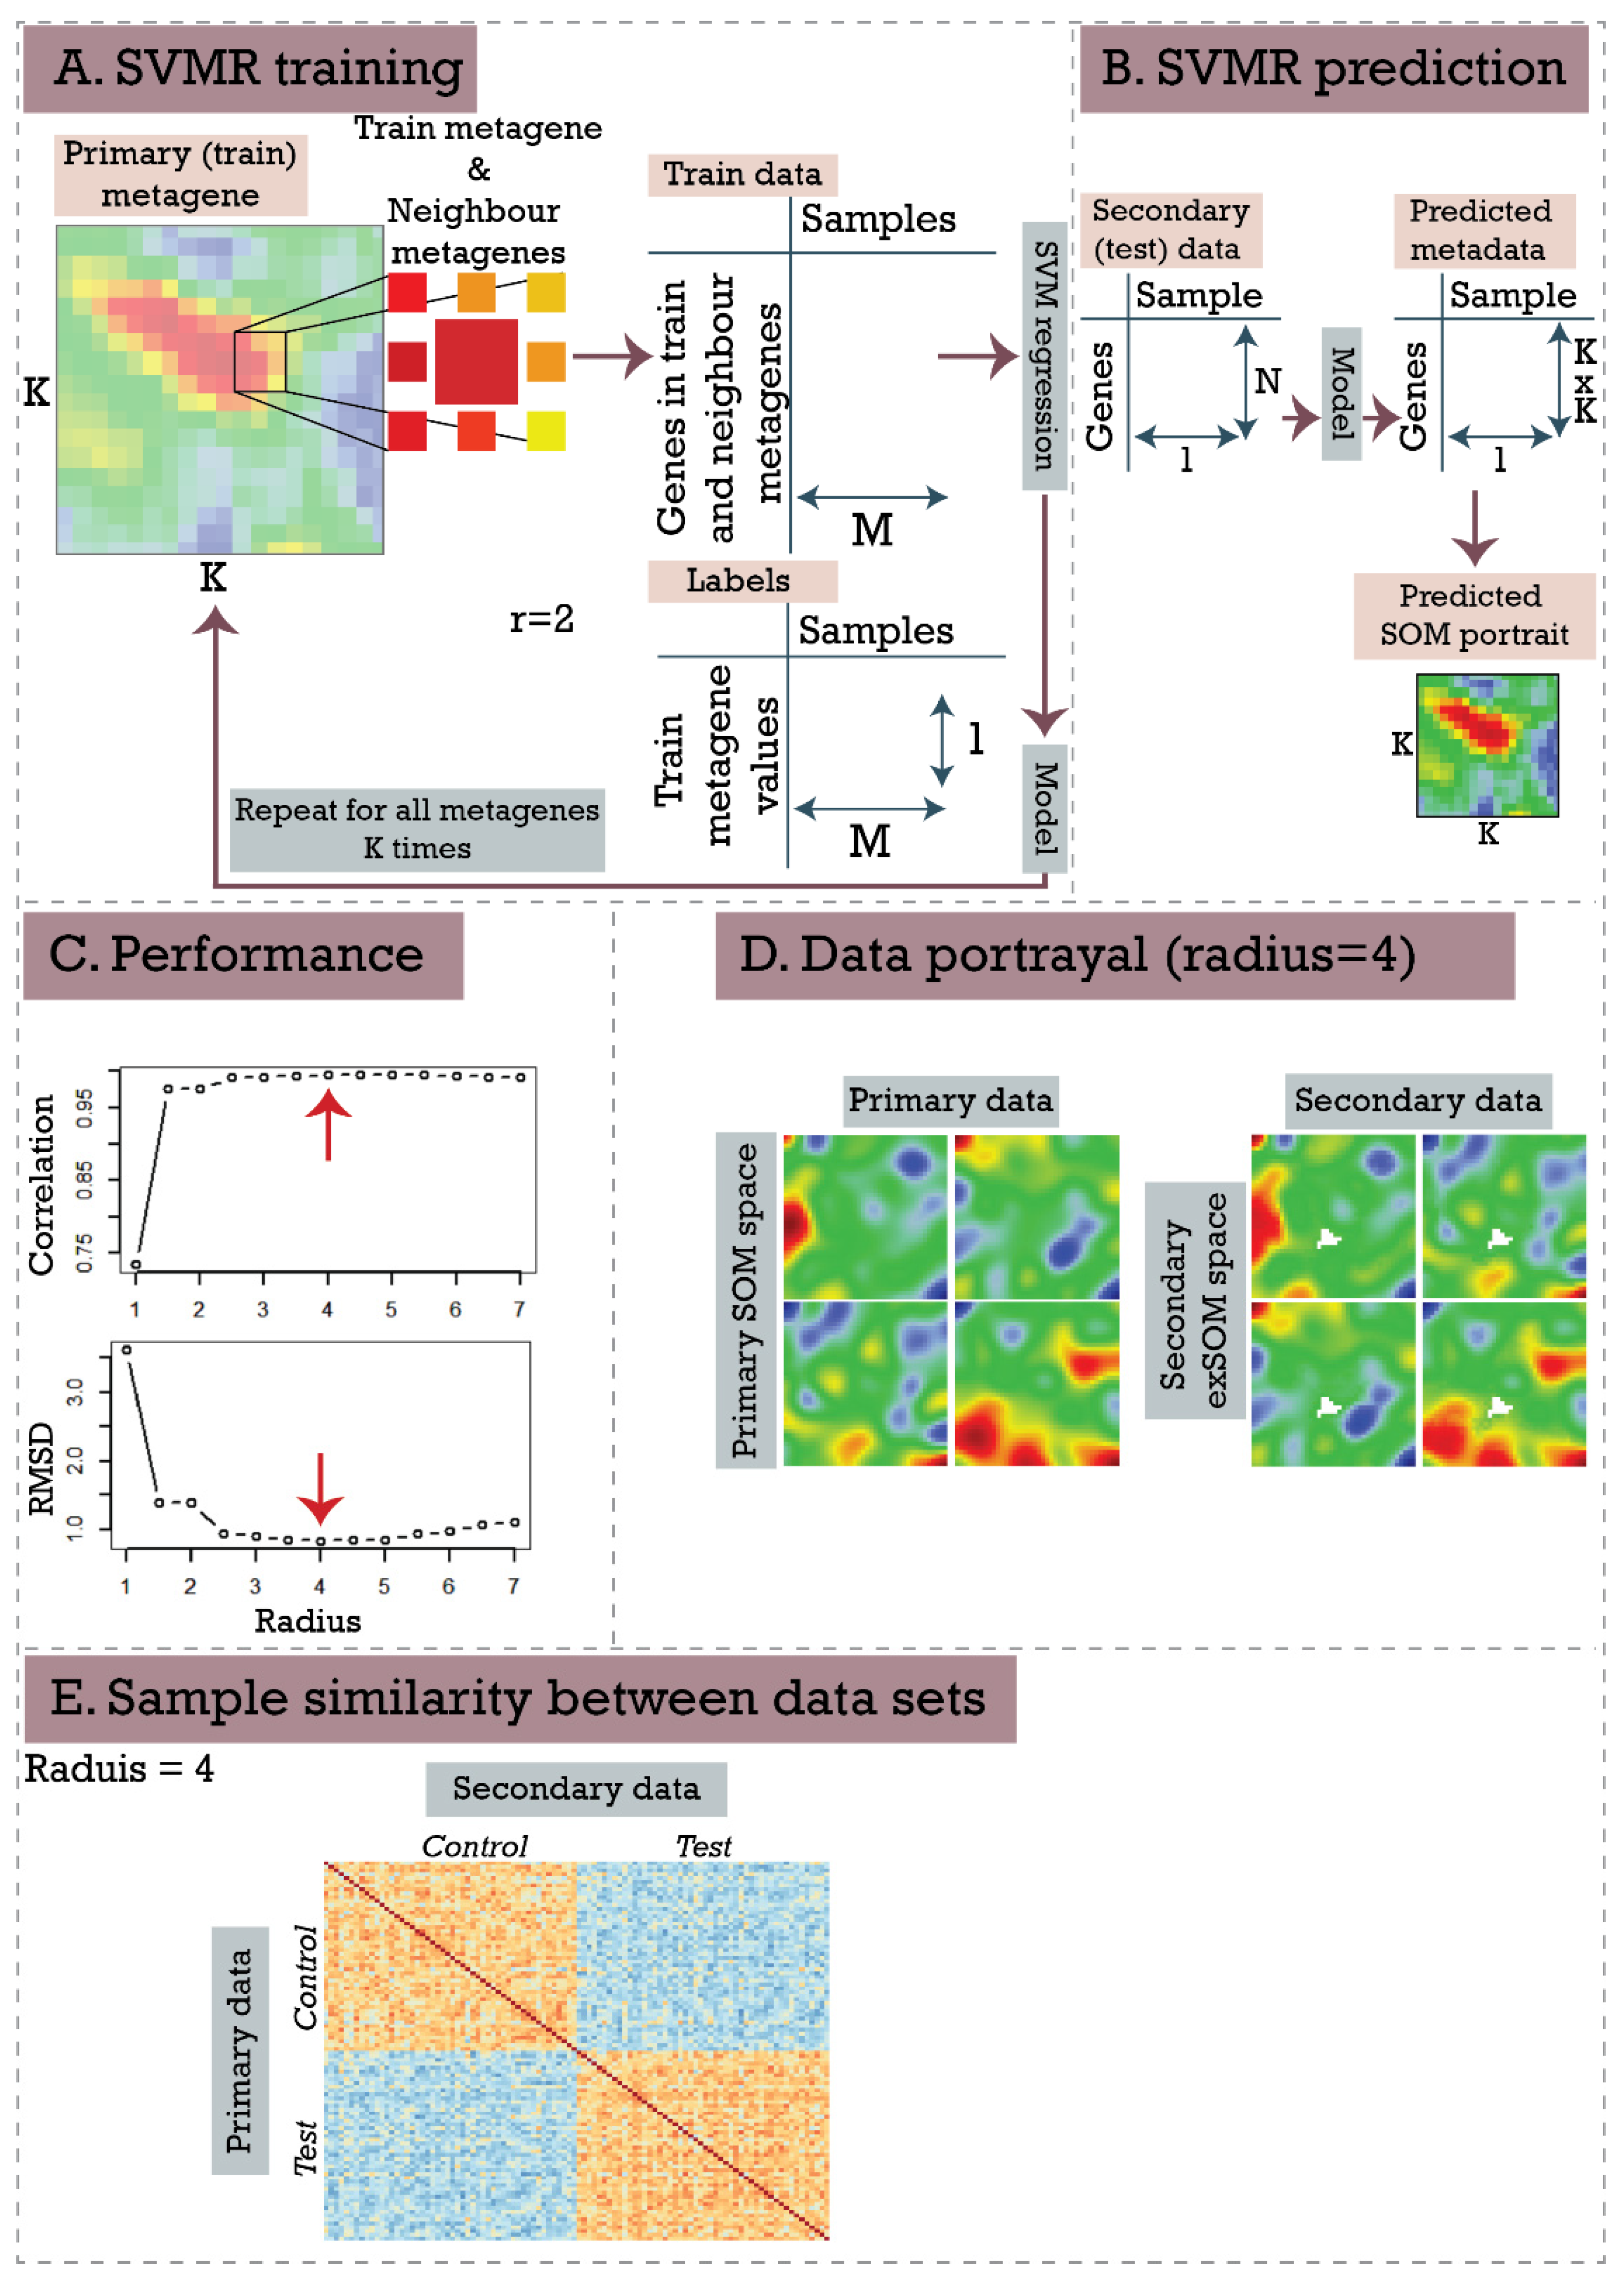
2.4. Supervised SOM Portrayal (supSOM)
2.5. Performance Assessment with Simulated Datasets
2.6. Use-Case Datasets
2.7. Data Availability
3. Results and Discussion
3.1. Simulated Data
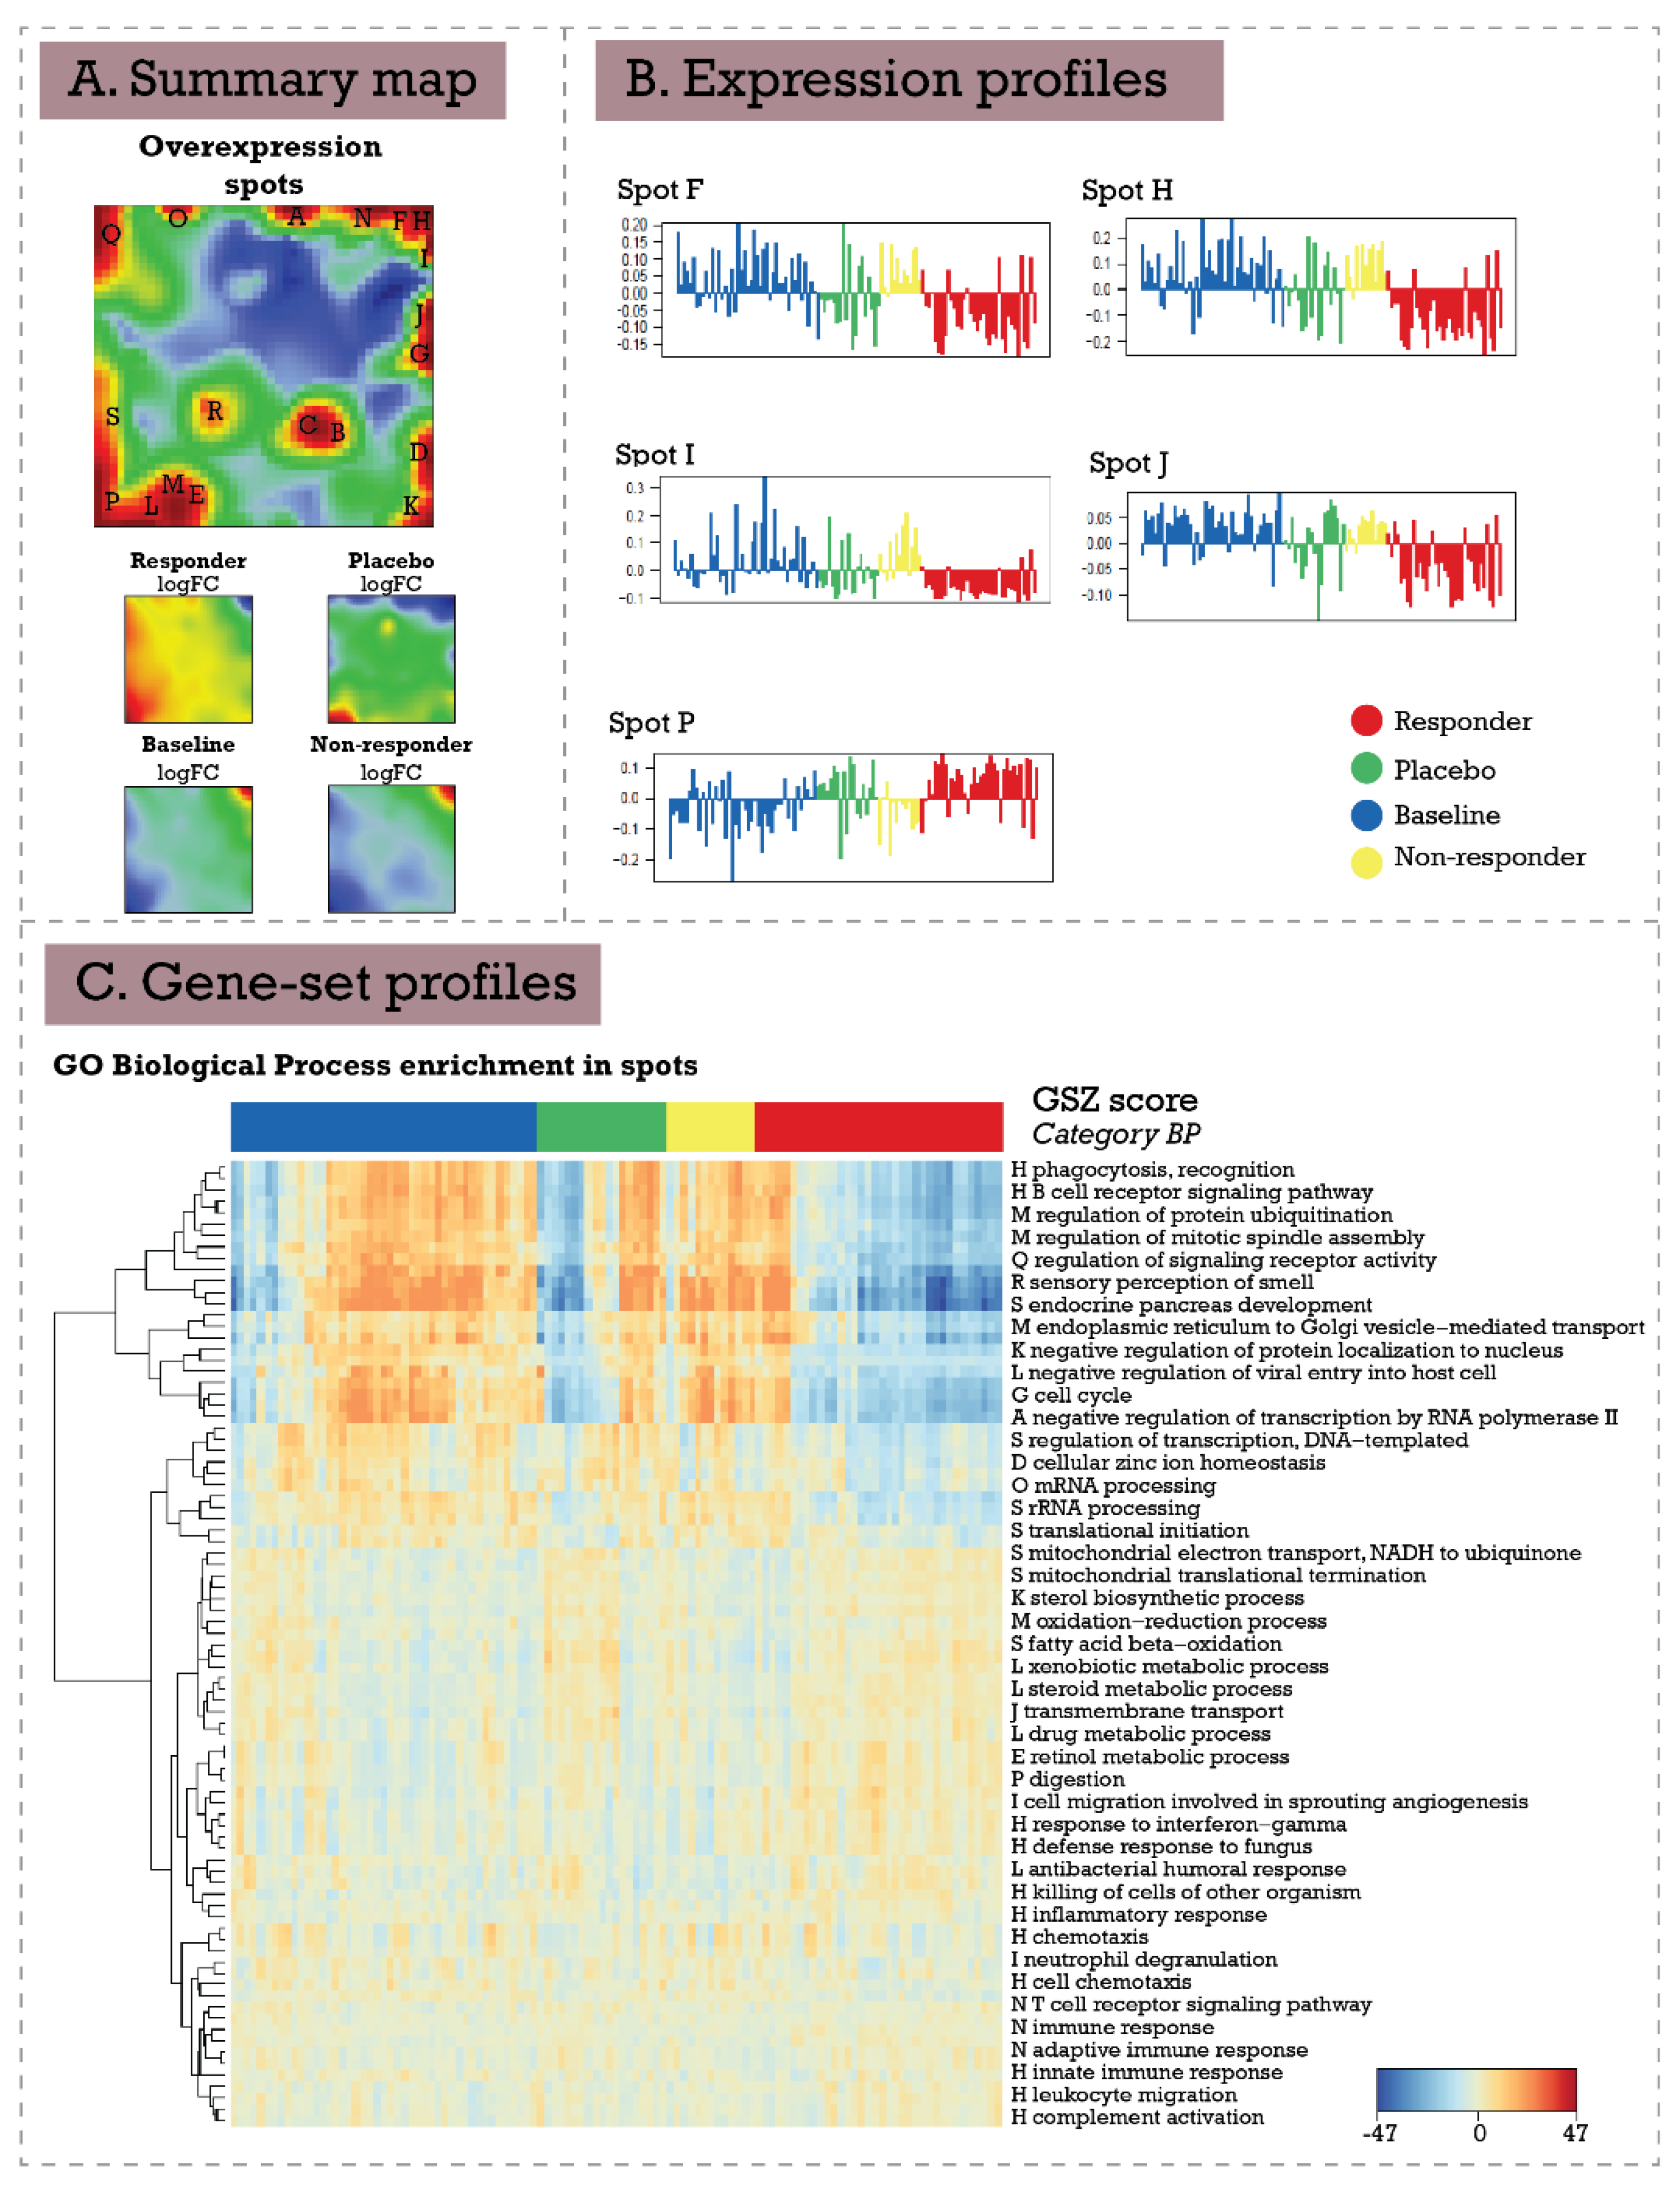
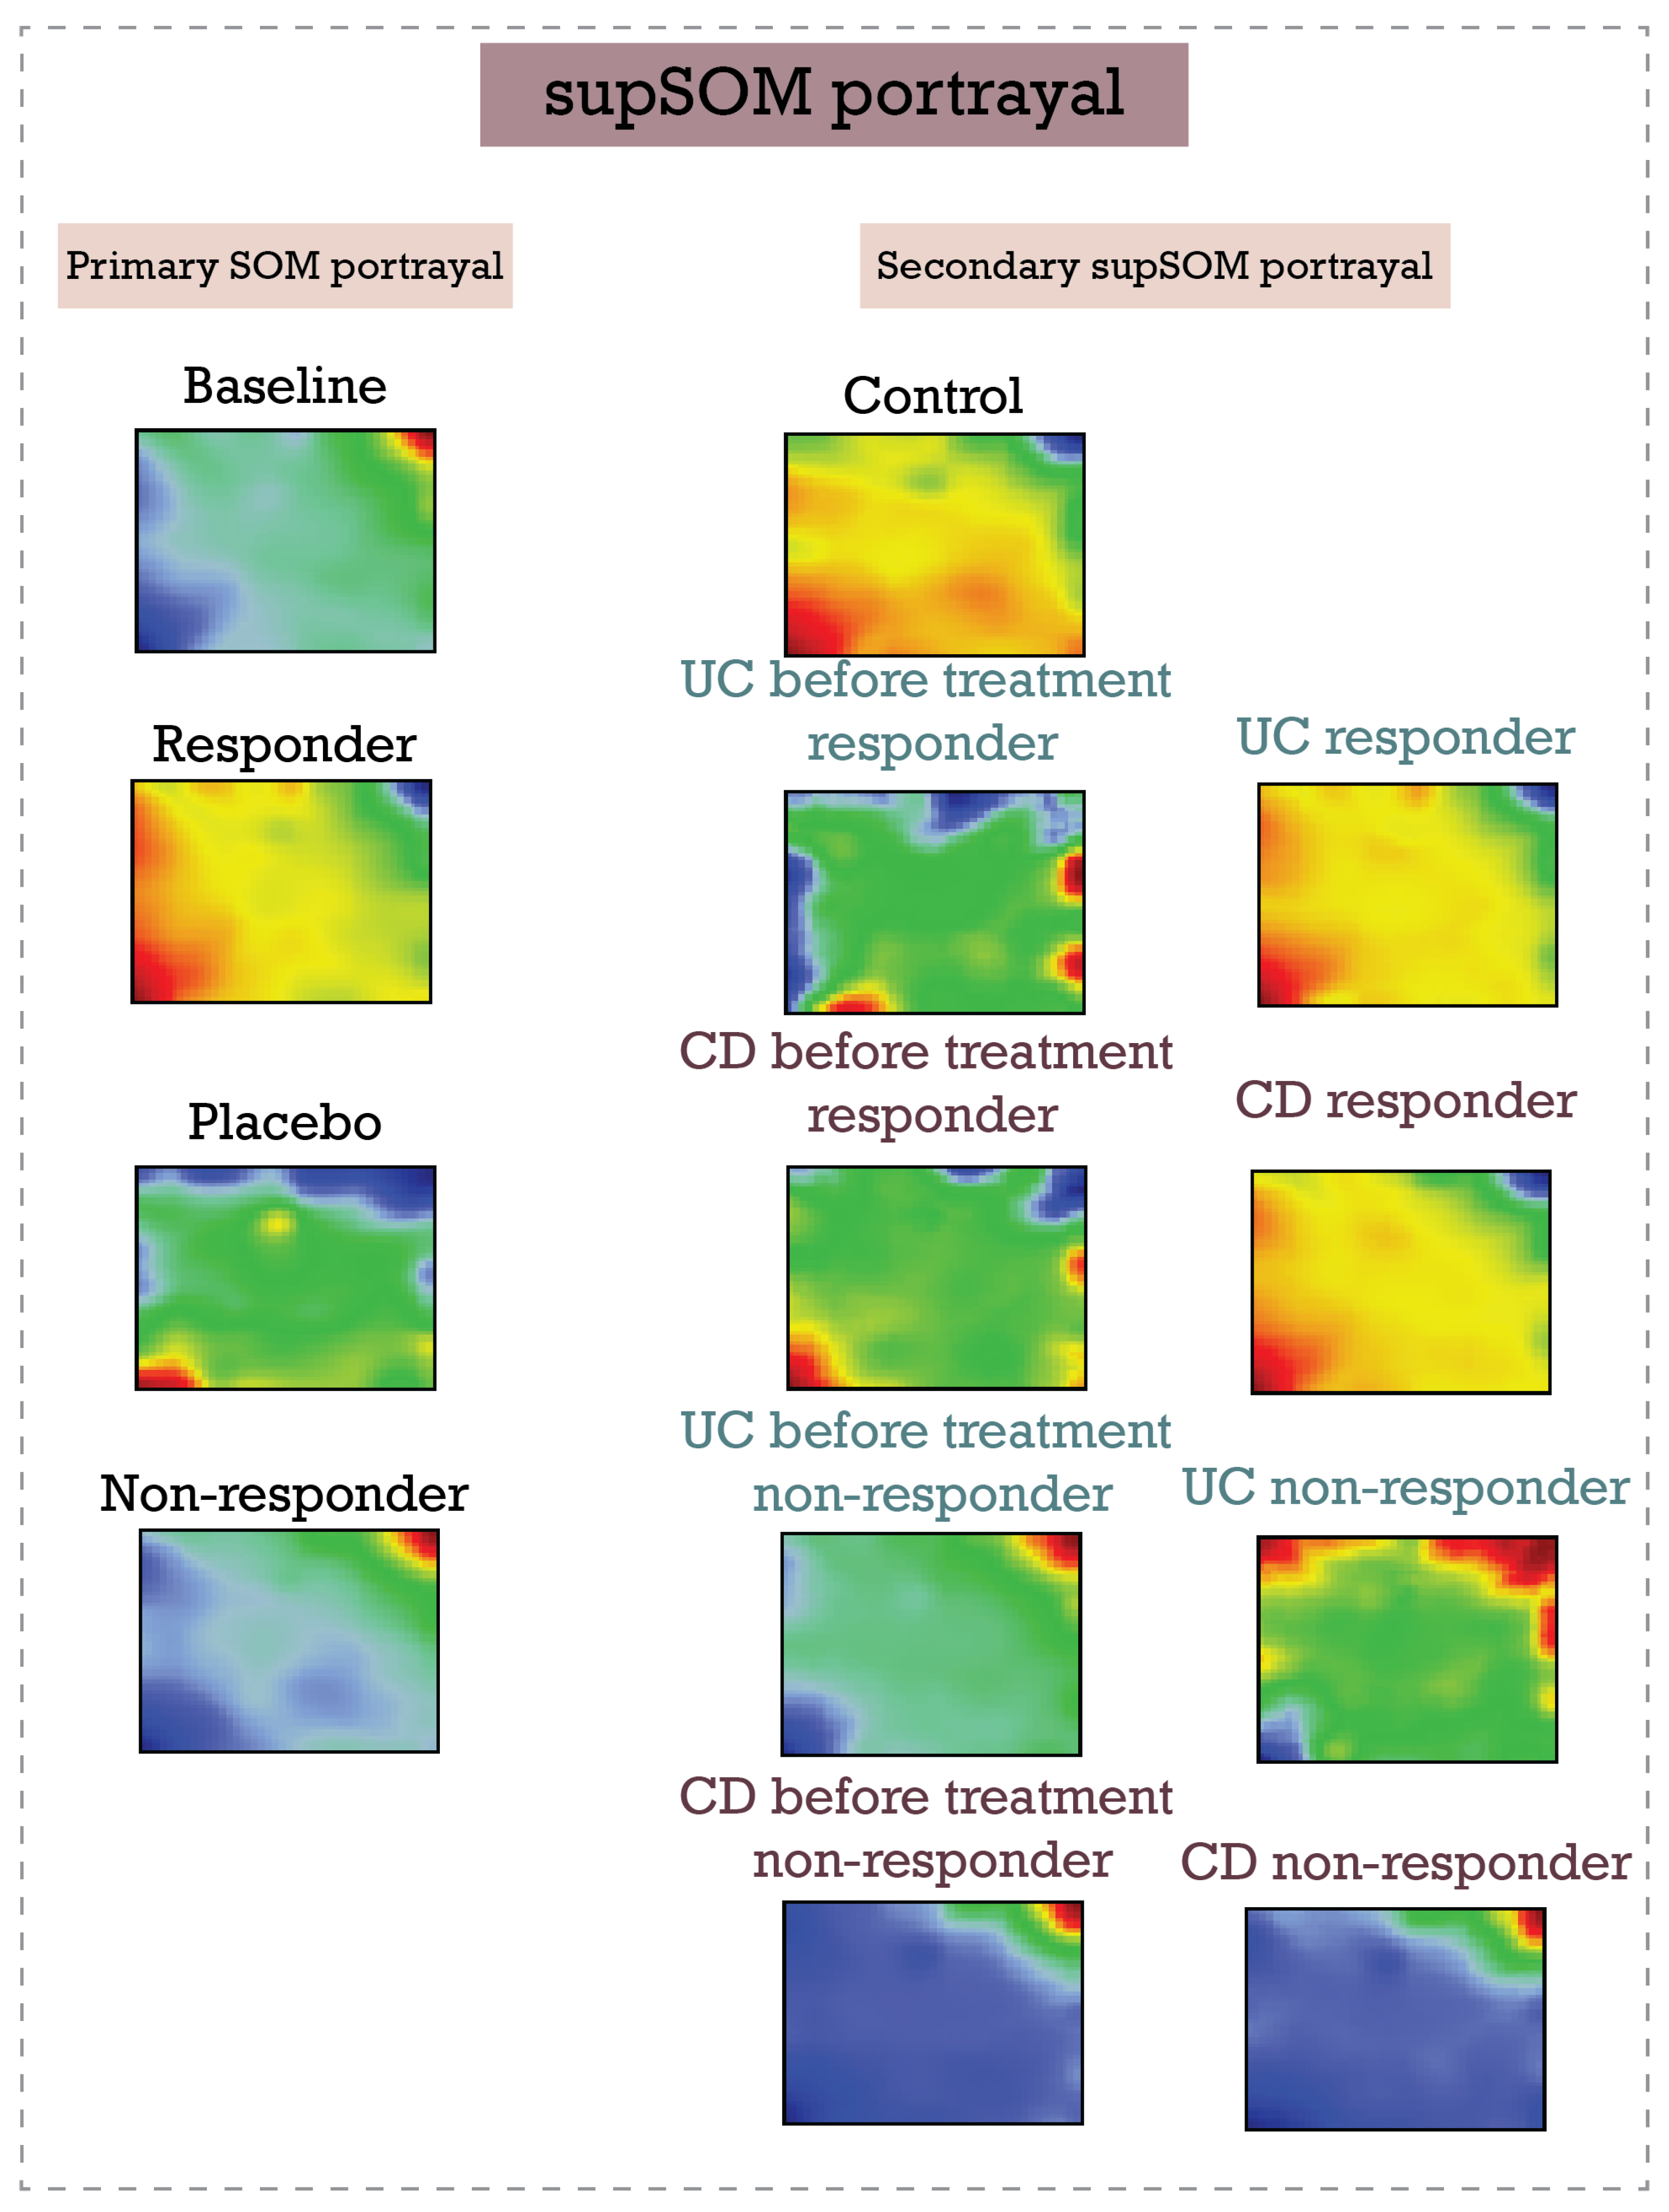
3.2. Inflammatory Bowel Disease (Ulcerative Colitis and Crohn’s Disease) Response to Infliximab—supSOM (Transferring Treatment Data to Disease Landscapes)
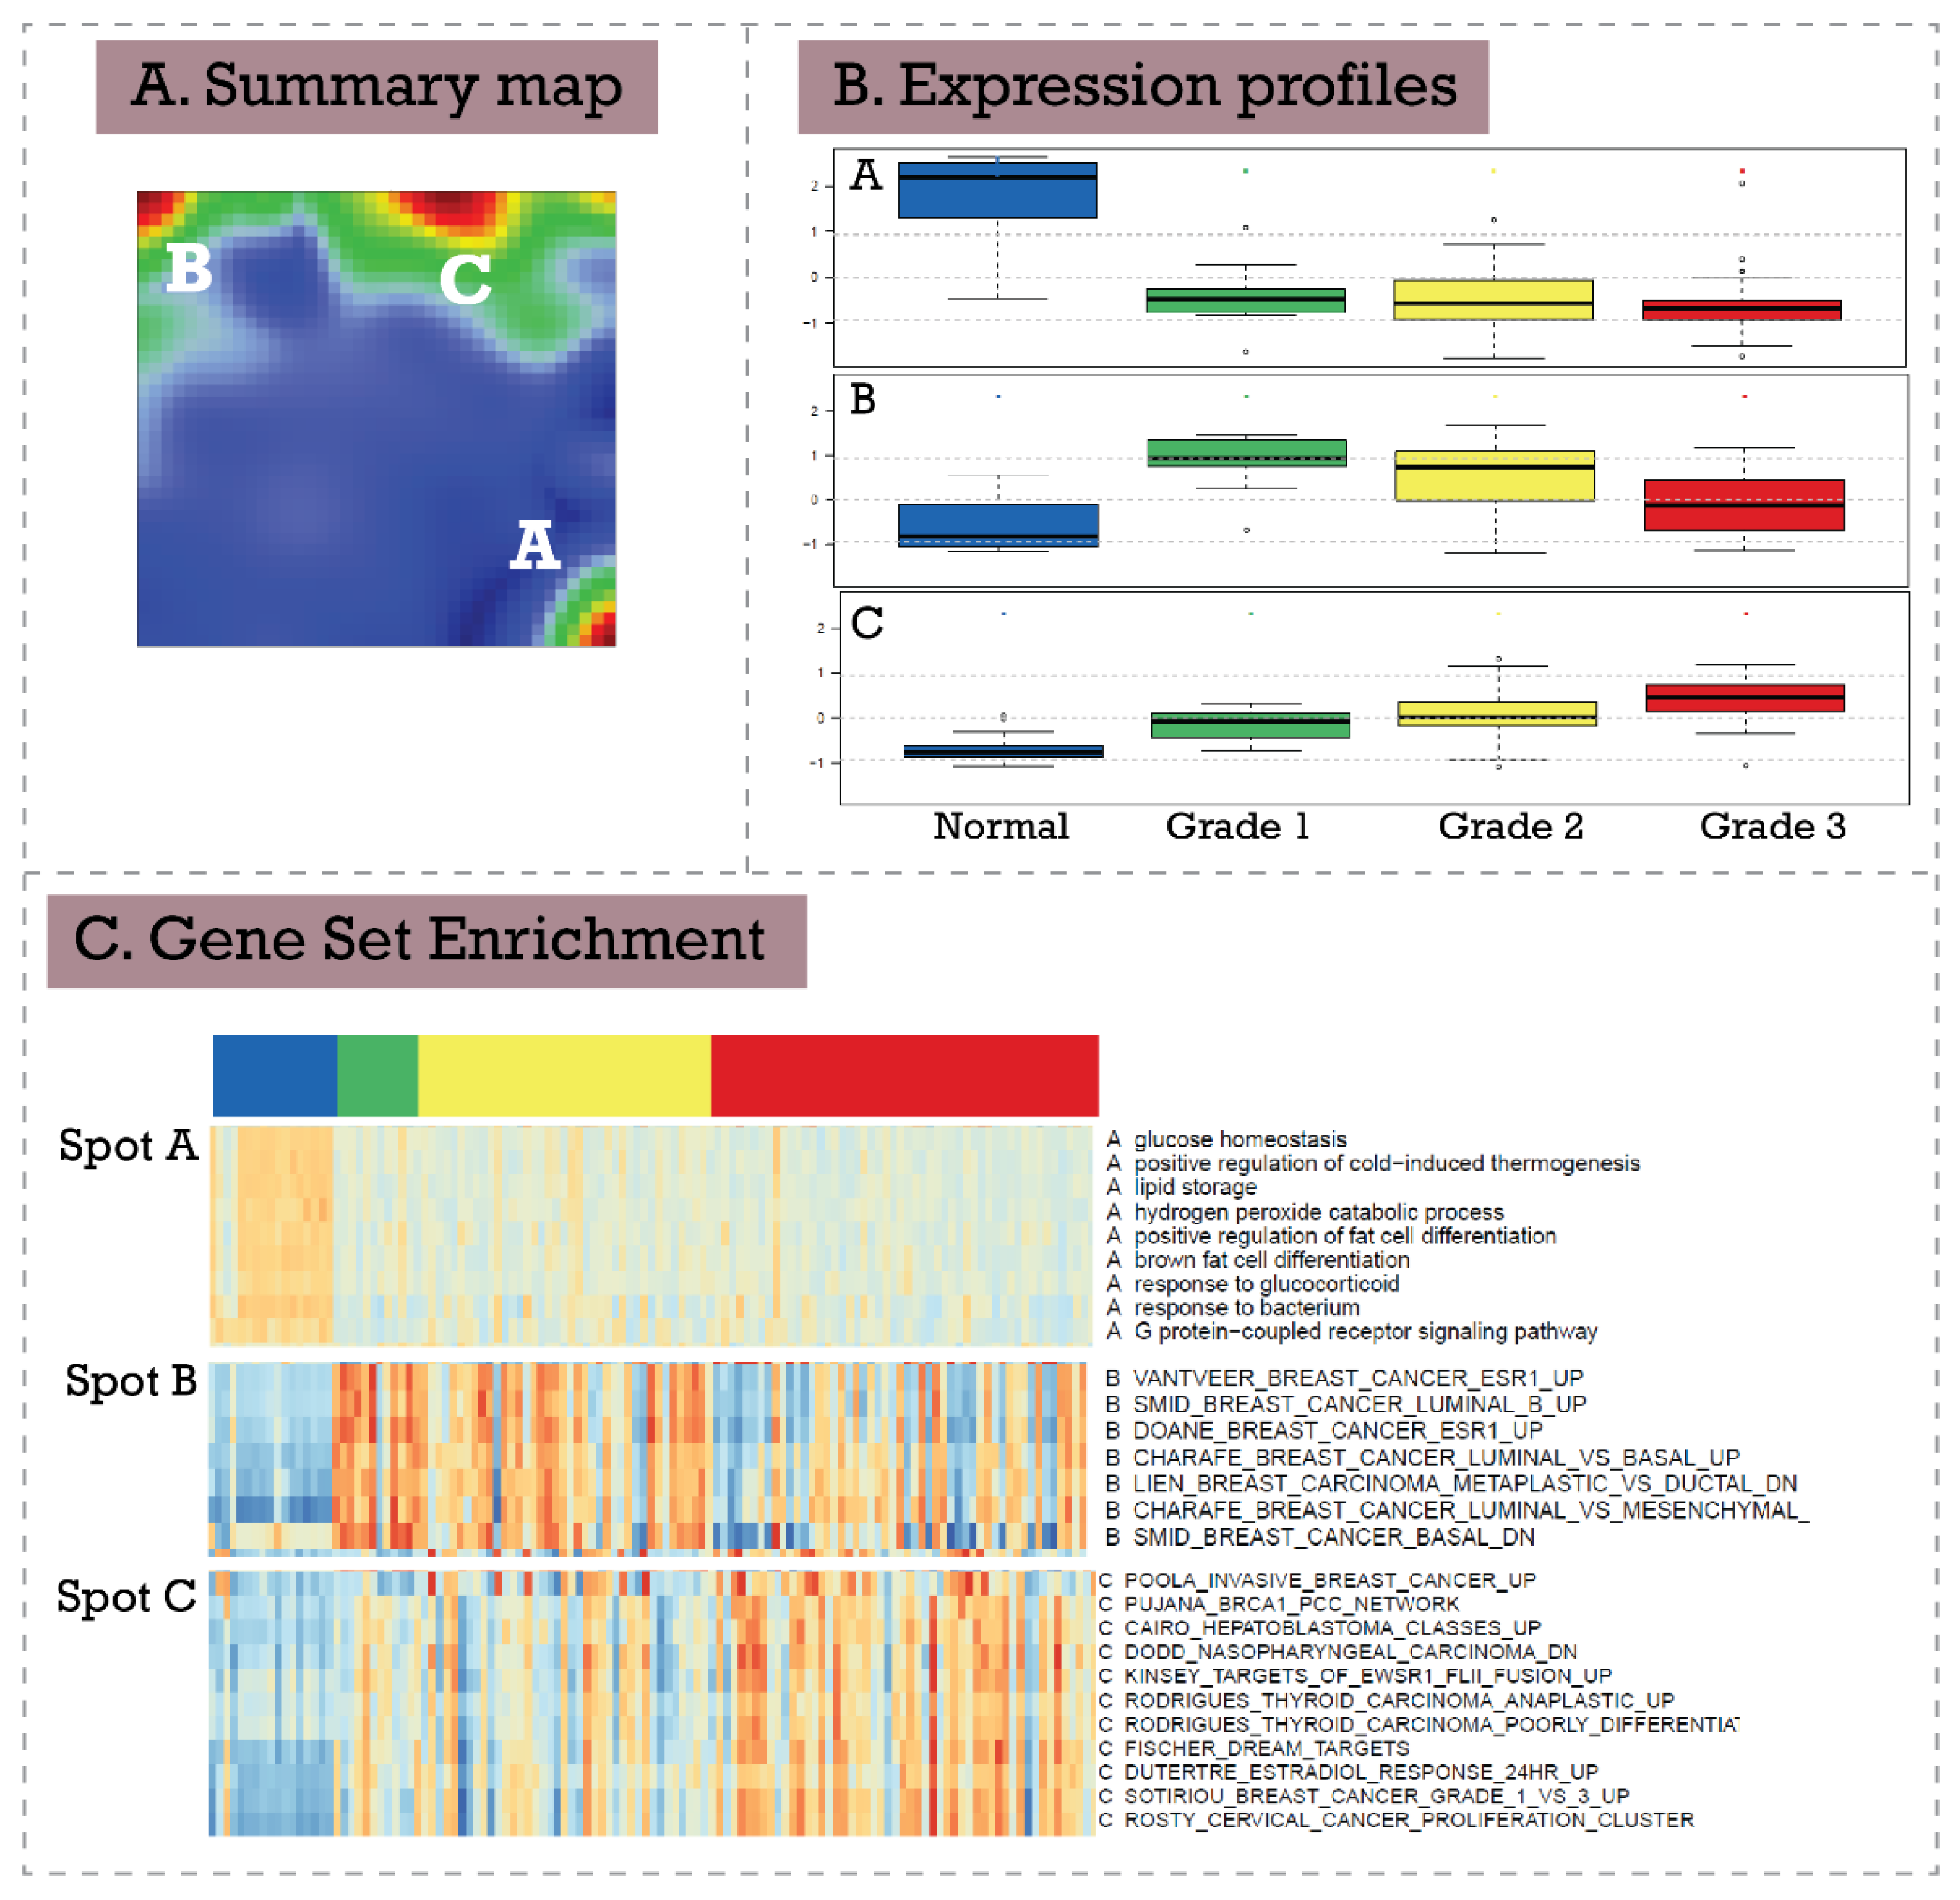
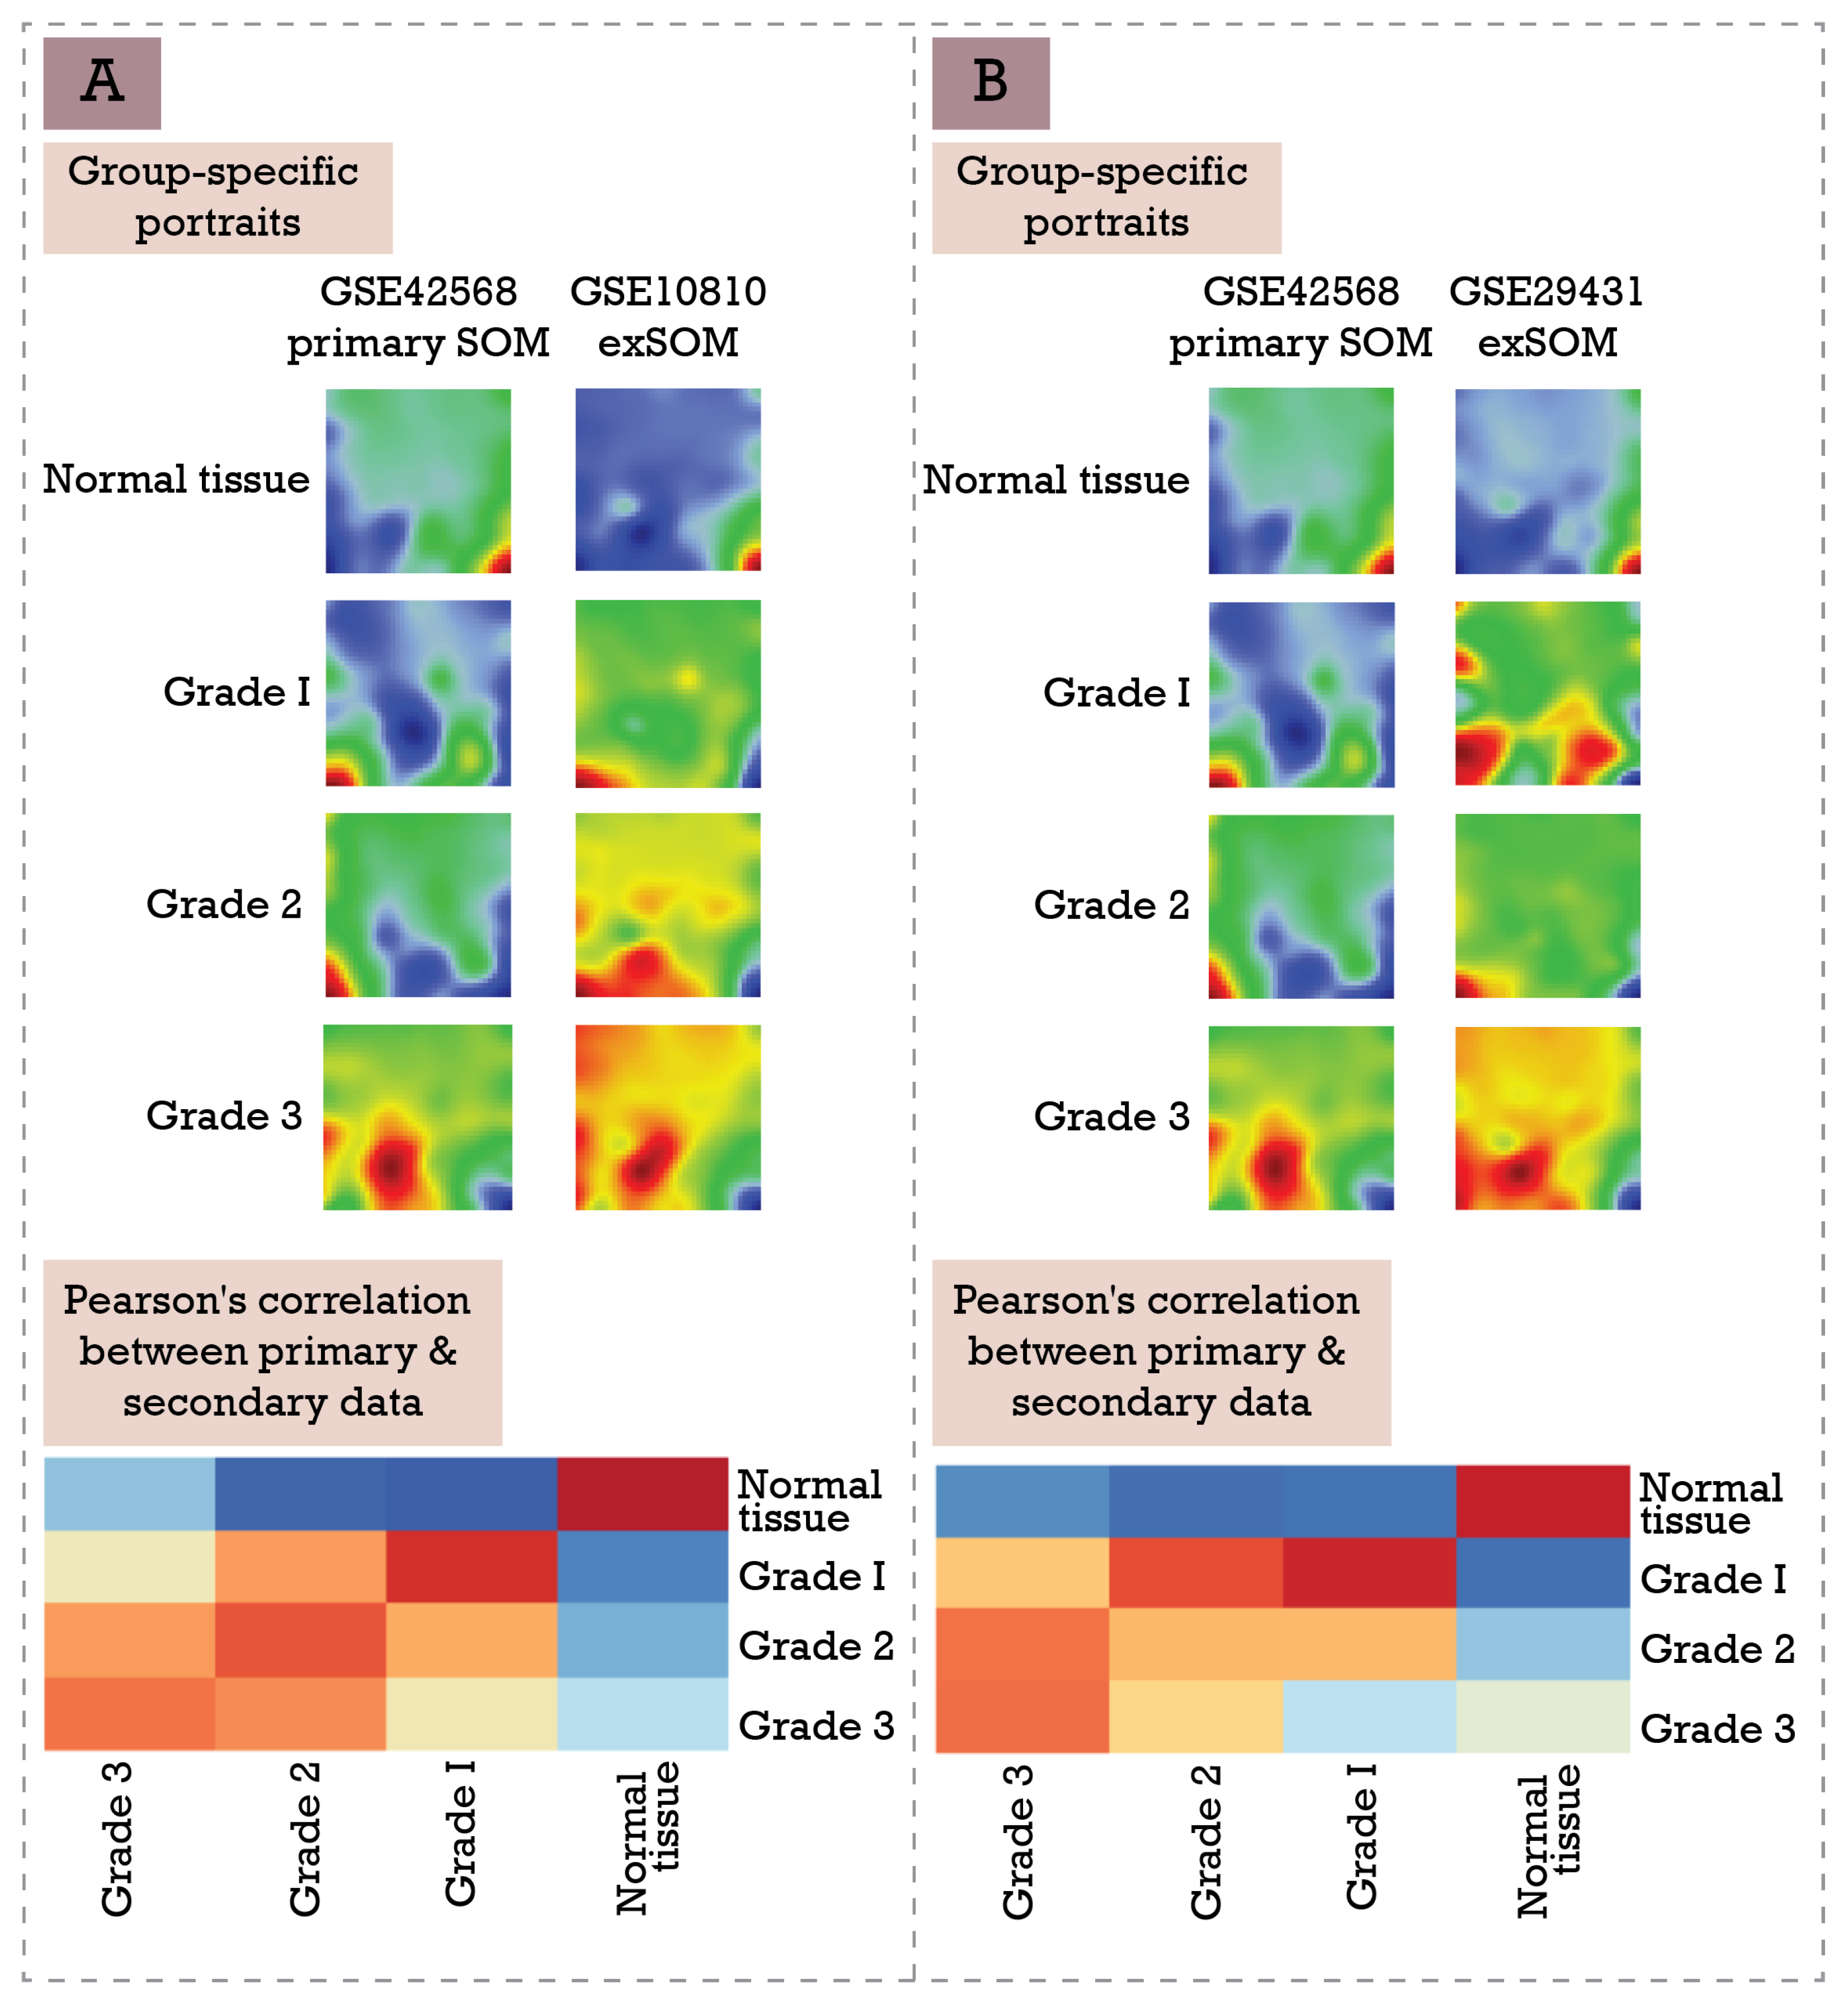
3.3. Extending Breast Cancer Transcriptome Landscapes—exSOM
4. Conclusions
Supplementary Materials
Author Contributions
Funding
Institutional Review Board Statement
Informed Consent Statement
Data Availability Statement
Conflicts of Interest
References
- Löffler-Wirth, H.; Kalcher, M.; Binder, H. oposSOM: R-package for high-dimensional portraying of genome-wide expression landscapes on bioconductor. Bioinformatics 2015, 31, 3225–3227. [Google Scholar] [CrossRef]
- Gomes, L.L.; Moreira, F.C.; Hamoy, I.G.; Santos, S.; Assumpção, P.; Santana, Á.L.; Santos, Â. Identification of miRNAs Expression Profile in Gastric Cancer Using Self-Organizing Maps (SOM). Bioinformation 2014, 10, 246–250. [Google Scholar] [CrossRef] [PubMed] [Green Version]
- Borkowska, E.M.; Kruk, A.; Jedrzejczyk, A.; Rozniecki, M.; Jablonowski, Z.; Traczyk, M.; Constantinou, M.; Banaszkiewicz, M.; Pietrusinski, M.; Sosnowski, M.; et al. Molecular subtyping of bladder cancer using Kohonen self-organizing maps. Cancer Med. 2014, 3, 1225–1234. [Google Scholar] [CrossRef] [PubMed]
- Schmidt, M.; Hopp, L.; Arakelyan, A.; Kirsten, H.; Engel, C.; Wirkner, K.; Krohn, K.; Burkhardt, R.; Thiery, J.; Loeffler, M.; et al. The Human Blood Transcriptome in a Large Population Cohort and Its Relation to Aging and Health. Front. Big Data 2020, 3, 36. [Google Scholar] [CrossRef] [PubMed]
- Jansen, C.; Ramirez, R.N.; El-Ali, N.C.; Gomez-Cabrero, D.; Tegner, J.; Merkenschlager, M.; Conesa, A.; Mortazavi, A. Building gene regulatory networks from scATAC-seq and scRNA-seq using Linked Self Organizing Maps. PLoS Comput. Biol. 2019, 15, e1006555. [Google Scholar] [CrossRef] [PubMed] [Green Version]
- Binder, H.; Wirth, H. Analysis of large-scale omic data using self organizing maps. In Encyclopedia of Information Science and Technology, 3rd ed.; IGI Global: Pennsylvania, PA, USA, 2014; pp. 1642–1653. [Google Scholar]
- Delgado, S.; Morán, F.; Mora, A.; Merelo, J.J.; Briones, C. A novel representation of genomic sequences for taxonomic clustering and visualization by means of self-organizing maps. Bioinformatics 2014, 31, 736–744. [Google Scholar] [CrossRef] [Green Version]
- Steiner, L.; Hopp, L.; Wirth, H.; Galle, J.; Binder, H.; Prohaska, S.J.; Rohlf, T. A Global Genome Segmentation Method for Exploration of Epigenetic Patterns. PLoS ONE 2012, 7, e46811. [Google Scholar] [CrossRef] [Green Version]
- Peng, T.; Nie, Q. SOMSC: Self-Organization-Map for High-Dimensional Single-Cell Data of Cellular States and Their Transitions. bioRxiv 2017, 124693. [Google Scholar] [CrossRef] [Green Version]
- Rallo, R.; France, B.; Liu, R.; Nair, S.; George, S.; Damoiseaux, R.; Giralt, F.; Nel, A.; Bradley, K.; Cohen, Y. Self-organizing map analysis of toxicity-related cell signaling pathways for metal and metal oxide nanoparticles. Environ. Sci. Technol. 2011, 45, 1695–1702. [Google Scholar] [CrossRef] [Green Version]
- Zhang, J.; Fang, H. Using Self-Organizing Maps to Visualize, Filter and Cluster Multidimensional Bio-Omics Data. In Applications of Self-Organizing Maps; IntechOpen Limited: London, UK, 2012; pp. 181–204. [Google Scholar]
- Kunz, M.; Löffler-Wirth, H.; Dannemann, M.; Willscher, E.; Doose, G.; Kelso, J.; Kottek, T.; Nickel, B.; Hopp, L.; Landsberg, J.; et al. RNA-seq analysis identifies different transcriptomic types and developmental trajectories of primary melanomas. Oncogene 2018, 37, 6136–6151. [Google Scholar] [CrossRef]
- Binder, H.; Willscher, E.; Loeffler-Wirth, H.; Hopp, L.; Jones, D.T.W.; Pfister, S.M.; Kreuz, M.; Gramatzki, D.; Fortenbacher, E.; Hentschel, B.; et al. DNA methylation, transcriptome and genetic copy number signatures of diffuse cerebral WHO grade II/III gliomas resolve cancer heterogeneity and development. Acta Neuropathol. Commun. 2019, 7, 59. [Google Scholar] [CrossRef] [Green Version]
- Wirth, H.; Von Bergen, M.; Binder, H. Mining SOM expression portraits: Feature selection and integrating concepts of molecular function. BioData Min. 2012, 5, 18. [Google Scholar] [CrossRef] [PubMed] [Green Version]
- Wirth, H.; Löffler, M.; von Bergen, M.; Binder, H. Expression cartography of human tissues using self organizing maps. BMC Bioinformatics 2011, 12, 306. [Google Scholar] [CrossRef] [Green Version]
- Koutník, J.; Šnorek, M. Temporal Hebbian self-organizing map for sequences. In Proceedings of the Lecture Notes in Computer Science (Including Subseries Lecture Notes in Artificial Intelligence and Lecture Notes in Bioinformatics), Torun, Poland, 25–29 August 2008. [Google Scholar]
- Dembélé, D. A Flexible Microarray Data Simulation Model. Microarrays 2013, 2, 115–130. [Google Scholar] [CrossRef] [PubMed] [Green Version]
- Edgar, R.; Lash, A. The Gene Expression Omnibus (GEO): A Gene Expression and Hybridization Repository. Nucleic Acids Res. 2002, 6, 1–17. [Google Scholar] [CrossRef] [Green Version]
- Nikoghosyan, M.; Loeffler-Wirth, H.; Davitavyan, S.; Binder, H.; Arakelyan, A. Projection of High-Dimensional Genome-Wide Expression on SOM Transcriptome Landscapes: Supplementary Datasets. Zenodo 2021. [Google Scholar] [CrossRef]
- Braga-Neto, U.; Dougherty, E. Bolstered error estimation. Pattern Recognit. 2004, 37, 1267–1281. [Google Scholar] [CrossRef]
- Christophi, G.P.; Rong, R.; Holtzapple, P.G.; Massa, P.T.; Landas, S.K. Immune Markers and Differential Signaling Networks in Ulcerative Colitis and Crohn’s Disease. Inflamm. Bowel Dis. 2012, 18, 2342–2356. [Google Scholar] [CrossRef] [PubMed] [Green Version]
- Wilhelm, S.M.; McKenney, K.A.; Rivait, K.N.; Kale-Pradhan, P.B. A review of infliximab use in ulcerative colitis. Clin. Ther. 2008, 30, 223–230. [Google Scholar] [CrossRef]
- Arijs, I.; De Hertogh, G.; Lemaire, K.; Quintens, R.; Van Lommel, L.; Van Steen, K.; Leemans, P.; Cleynen, I.; Van Assche, G.; Vermeire, S.; et al. Mucosal gene expression of antimicrobial peptides in inflammatory bowel disease before and after first infliximab treatment. PLoS ONE 2009, 4, e7984. [Google Scholar] [CrossRef]
- Wong, U.; Cross, R.K. Primary and secondary nonresponse to infliximab: Mechanisms and countermeasures. Expert Opin. Drug Metab. Toxicol. 2017, 13, 1039–1046. [Google Scholar] [CrossRef] [PubMed]
- Clarke, C.; Madden, S.F.; Doolan, P.; Aherne, S.T.; Joyce, H.; O’Driscoll, L.; Gallagher, W.M.; Hennessy, B.T.; Moriarty, M.; Crown, J.; et al. Correlating transcriptional networks to breast cancer survival: A large-scale coexpression analysis. Carcinogenesis 2013, 34, 2300–2308. [Google Scholar] [CrossRef] [PubMed]
- Sotiriou, C.; Wirapati, P.; Loi, S.; Harris, A.; Fox, S.; Smeds, J.; Nordgren, H.; Farmer, P.; Praz, V.; Haibe-Kains, B.; et al. Gene expression profiling in breast cancer: Understanding the molecular basis of histologic grade to improve prognosis. J. Natl. Cancer Inst. 2006, 98, 262–272. [Google Scholar] [CrossRef] [PubMed]
- Ignatiadis, M.; Sotiriou, C. Understanding the molecular basis of histologic grade. Pathobiology 2008, 75, 104–111. [Google Scholar] [CrossRef]
- Lu, X.; Lu, X.; Wang, Z.C.; Iglehart, J.D.; Zhang, X.; Richardson, A.L. Predicting features of breast cancer with gene expression patterns. Breast Cancer Res. Treat. 2008, 108, 191–201. [Google Scholar] [CrossRef] [PubMed]


| n = 10,000 Genes | n = 30,000 Genes | ||
|---|---|---|---|
| Sample Size (Control/Case) | Training Time | Sample Size (Control/Case) | Training Time |
| 50/50 | 3 min | 50/50 | 8 min |
| 100/100 | 8 min | 100/100 | 16 min |
| 200/200 | 14 min | 200/200 | 37 min |
| 500/500 | 43 min | 500/500 | 116 min |
| 1000/1000 | 85 min | 1000/1000 | 228 min |
| Data—200 Samples in Each Class with 30,000 Genes | Time |
|---|---|
| exSOM | 23 min |
| SOM training (50/50 samples) | 8 min |
| extSOM (150/150 samples) | 15 min |
| supSOM | 14 min |
| SOM training 50/50 samples | 8 min |
| SVMR model training (50/50 samples) | 4 min |
| SVMR portrait prediction (150/150 samples) | 2 min |
Publisher’s Note: MDPI stays neutral with regard to jurisdictional claims in published maps and institutional affiliations. |
© 2021 by the authors. Licensee MDPI, Basel, Switzerland. This article is an open access article distributed under the terms and conditions of the Creative Commons Attribution (CC BY) license (https://creativecommons.org/licenses/by/4.0/).
Share and Cite
Nikoghosyan, M.; Loeffler-Wirth, H.; Davidavyan, S.; Binder, H.; Arakelyan, A. Projection of High-Dimensional Genome-Wide Expression on SOM Transcriptome Landscapes. BioMedInformatics 2022, 2, 62-76. https://doi.org/10.3390/biomedinformatics2010004
Nikoghosyan M, Loeffler-Wirth H, Davidavyan S, Binder H, Arakelyan A. Projection of High-Dimensional Genome-Wide Expression on SOM Transcriptome Landscapes. BioMedInformatics. 2022; 2(1):62-76. https://doi.org/10.3390/biomedinformatics2010004
Chicago/Turabian StyleNikoghosyan, Maria, Henry Loeffler-Wirth, Suren Davidavyan, Hans Binder, and Arsen Arakelyan. 2022. "Projection of High-Dimensional Genome-Wide Expression on SOM Transcriptome Landscapes" BioMedInformatics 2, no. 1: 62-76. https://doi.org/10.3390/biomedinformatics2010004
APA StyleNikoghosyan, M., Loeffler-Wirth, H., Davidavyan, S., Binder, H., & Arakelyan, A. (2022). Projection of High-Dimensional Genome-Wide Expression on SOM Transcriptome Landscapes. BioMedInformatics, 2(1), 62-76. https://doi.org/10.3390/biomedinformatics2010004


