Article

Detecting Patient Health Trajectories Using a Full-Body Burn Physiology Model

1
Applied Research Associates, Advanced Modeling Simulation and Systems Directorate, Raleigh, NC 27615, USA
2
Army Research Laboratory, 12423 Research Pkwy, Orlando, FL 32826, USA
3
USARMY Institute of Surgical Research, 3698 Chambers Pass Ste B JBSA ft. Sam Houston, San Antonio, TX 728234-7767, USA
*
Author to whom correspondence should be addressed.
BioMedInformatics 2021, 1(3), 127-137; https://doi.org/10.3390/biomedinformatics1030009
Submission received: 10 August 2021 / Revised: 15 October 2021 / Accepted: 25 October 2021 / Published: 2 November 2021

Abstract

:
A whole-body physiology model of inflammatory burn injury was used to train an algorithm to correctly detect patients’ states. The physiology model of a thermal injury takes the surface area of patient skin burned as an input to the model and responds to common treatments. This model is leveraged to build a database of patient physiology as a function of total body surface area burn, without treatment, over a 48-h window. Using this database, we train a model to determine patient injury status as a function of the available physiology data. The algorithm can group virtual patients into three distinct categories, corresponding to long term patient health. The results show that, given an initial virtual patient and injury, the algorithm can correctly determine the placement of that patient into the corresponding category, effectively classifying long term patient outcomes.

1. Introduction

Burn and related injuries in the United States account for approximately 40,000 hospitalizations each year [1,2]. The patient inflammatory reaction due to large total body surface area burns (TBSA) create complex physiological patient responses. Generally, the larger the surface area covering of the burn, the more complex the treatment protocols become [3]. Current clinical best practice guidelines note that burns exceeding 20% require changes in the patient care provided. These treatment changes account for fluid shifts into the interstitial spaces of the tissue due to inflammatory mediators that the body releases in response to the injury [4]. Inflammation is the body’s physiological response to thermal injury and is directly impacted by the size of the burn [5].
The increasing complexity of patient treatment requires advances in detecting long term patient health. These advances may increase triage services and provide information to care providers not trained in burn-specific injury treatments [5]. Additionally, not all patients have ready access to quality burn-centric treatment facilities [6]. Military combatants, for instance, who suffer severe thermal injury usually receive initial treatment on-site prior to evacuation to a burn center. The importance of proper care, as a function of initial patient injury TBSA, cannot be overstated, as early fluid resuscitation has crucial implications for long-term recovery [7].
Machine learning has been leveraged in a variety of ways in hopes of improving patient care. Some of the most successful examples include using convolutional neural networks (CNNs) for classification, localization, segmentation, and registration in image analysis [8]. These algorithms are employed to detect abnormalities in the medical image and may one day be used in a clinical pipeline to improve patient outcomes. In addition, ML models have been studied to detect patient physiological decompensation when in the ICU. Most applications are trained on sepsis data in order to detect the onset of sepsis and septic shock earlier than tradition clinical analysis [9,10]. Indeed, these methods have shown some promise, reducing patient hospital stay and mortality when deployed in a clinical setting [11]. Burn injury and patient physiology detection has not been as robustly studied in a research setting. Much of the current research employs ML algorithms to determine kidney injury [12] and to classify the TBSA sustained by the patient [13,14]. The lack of large temporal clinical data sets of patient physiology is a barrier for training robust ML models that can determine patient outcomes.
Detecting patient health as a function of initial patient injury requires a large amount of physiology data with TBSA as an input parameter. Though burn physiology data do exist in electronic health records, there are issues with the amount and types of data recorded. To avoid these issues, we leverage a whole-body physiology model of the burn pathophysiology to generate sufficient data to train our statistical learning model. The BioGears model of patient burn injury allows us to select specific, physiologically relevant data, as an output and lets us generate patient states, which encompass all available data provided by the engine. For this research the model is used to generate 79 data sets corresponding to a 24-h simulation of a patient with an initial burn injury. The initial model conditions increment the burn TBSA by one percent up to 40 percent TBSA. This data set is provided to the machine learning community as an open access database (see the data availability statement). For each patient, output data, in comma separated format, as well as each BioGears patient state, recorded each hour over the 24-h period is provided. A BioGears patient state records all the relevant data needed to begin a simulation and collects around 36,000 data entries.
While we can assign a BioGears patient a TBSA, we do not know how a patient’s health evolves over time and consequently we do not know when and what interventions are appropriate for a given patient. The model is trained to classify longer term patient health by training in patient physiology data generated through a BioGears computational model. Hourly BioGears burn patient states are used as an input to a clustering algorithm. Three clusters are used when configuring the K-means clustering algorithm. The number of clusters is a function of subject matter expert feedback on general patient trends and trajectories present in the constructed BioGears model. Second, we predict a patient’s current category given their physiological state from BioGears. Using the same patient physiology data, a nearest neighbor classifier is trained that accurately predicts a burn patient’s category given their physiological state. These two contributions demonstrate preliminary results that an integrated BioGears-machine learning model could be an effective method to preemptively evaluate patient health trajectories. This model may also be able to predict treatment protocols that a caretaker may chose, based upon an initial patient injury and will be an area of future investigation.

2. Materials and Methods

The physiological model is developed by simulating the patient’s acute inflammatory response (AIR) as a function of the burn TBSA suffered by the patient. Clinical data shows that the TBSA of the patient plays a large role in the inflammatory response of the patient [15,16] This model is based upon the Diverse Shock States model of Chow [17] as it accounts for the major inflammatory mediators implicated in patient response to a thermal injury. This includes tumor necrosis factor (TNF), interleukin-6 (IL-6), interleukin-10 (IL-10), and nitric oxide (NO). The model simulates downstream tissue damage incurred by the AIR that if the inflammation is left unchecked. This contributes to volume shifts into the interstitium, late-stage hypoperfusion and associated death. The model connects the inflammation to tissue damage, effectively simulating the whole-body physiological changes induced by large thermal injury [18].
The model of the patient TBSA response in the BioGears physiology engine allows for dynamic runtime simulation of the patient state which allows us to design treatment scenarios in response to the patient injury [19]. In addition, we may leverage existing models of the cardiopulmonary and nervous systems to generate other downstream interactions with the thermal AIR model. The state equation for tissue integrity (T) is modeled after the approach of Reynolds [20]. The equations are adapted to provide a functional relationship for T to be constrained between 1.0 (healthy) and 0.0 (irreversible damage), which greatly simplifies downstream integration with BioGears.
d T d t = k D ( 1 T ) T ( k D 6 I L 6 4 x D 6 4 + I L 6 6 + k D T R T r ) ( 1 x D N O 2 + N O 2 )
Equation (1) describes the evolution of T as a function of cytokine concentrations. IL-6 and NO, and the insult stemming from thermal trauma (Tr). The constants kD6 and kDTR describe the rate of tissue health depletion due to IL6 and trauma, respectively, while kD captures the rate of tissue healing. Likewise, xD6 and xDNO represent half-max values for IL-6 and NO effects. Though mediators such as TNF and IL-10 are not explicitly included in (1), they affect the IL-6 population, indirectly impacting the calculation for T.
Vascular compartments in the BioGears cardiovascular system maintain a pathway to an interstitial compartment, representing the tissue, Figure 1. Tissue paths consist of three elements: a resistor that may describe vascular permeability (kP) and two pressure sources capturing vascular and interstitial colloid osmotic pressure (COP). We calculate COP from the total plasma protein concentration (CPP) via the Landis-Pappenheimer approximation [21]:
C O P = 2.1 C P P + 0.18 C P P 2 + 0.009 C P P 3
The majority of the blood protein represented in the BioGears vasculature is Albumin, thus we assume a linear relationship between albumin concentration (CA) and CPP such that CPP = 1.6 ∗ CA. We update CA each at iteration by calculating local albumin flux (JA) from the plasma (p) to the interstitium (i) via the Patlak equation [22,23].
J A = J V ( 1 σ ) ( C A , P C A , j exp ( J v 1 σ P S ) 1 exp ( J v 1 σ P S ) )
According to (3), we non-linearly couple the albumin flux across the vascular endothelium to the volumetric flux (JV) which is precomputed by BioGears lumped circuit model. We buffer this transport by the reflection coefficient (σ), representing the degree to which a membrane maintains an osmotic gradient, and by the endothelial permeability to albumin (PS).
Under normal physiological conditions, σ is approximately 1.0 and thus transport of albumin from the vasculature is approximately zero. The lymphatic transport re-circulates the small amount that does cross this member under healthy conditions, Figure 1. We tune the resistance across each vascular-tissue pathway (kp) to match the rates of filtered and transported albumin in circulation during steady-state.
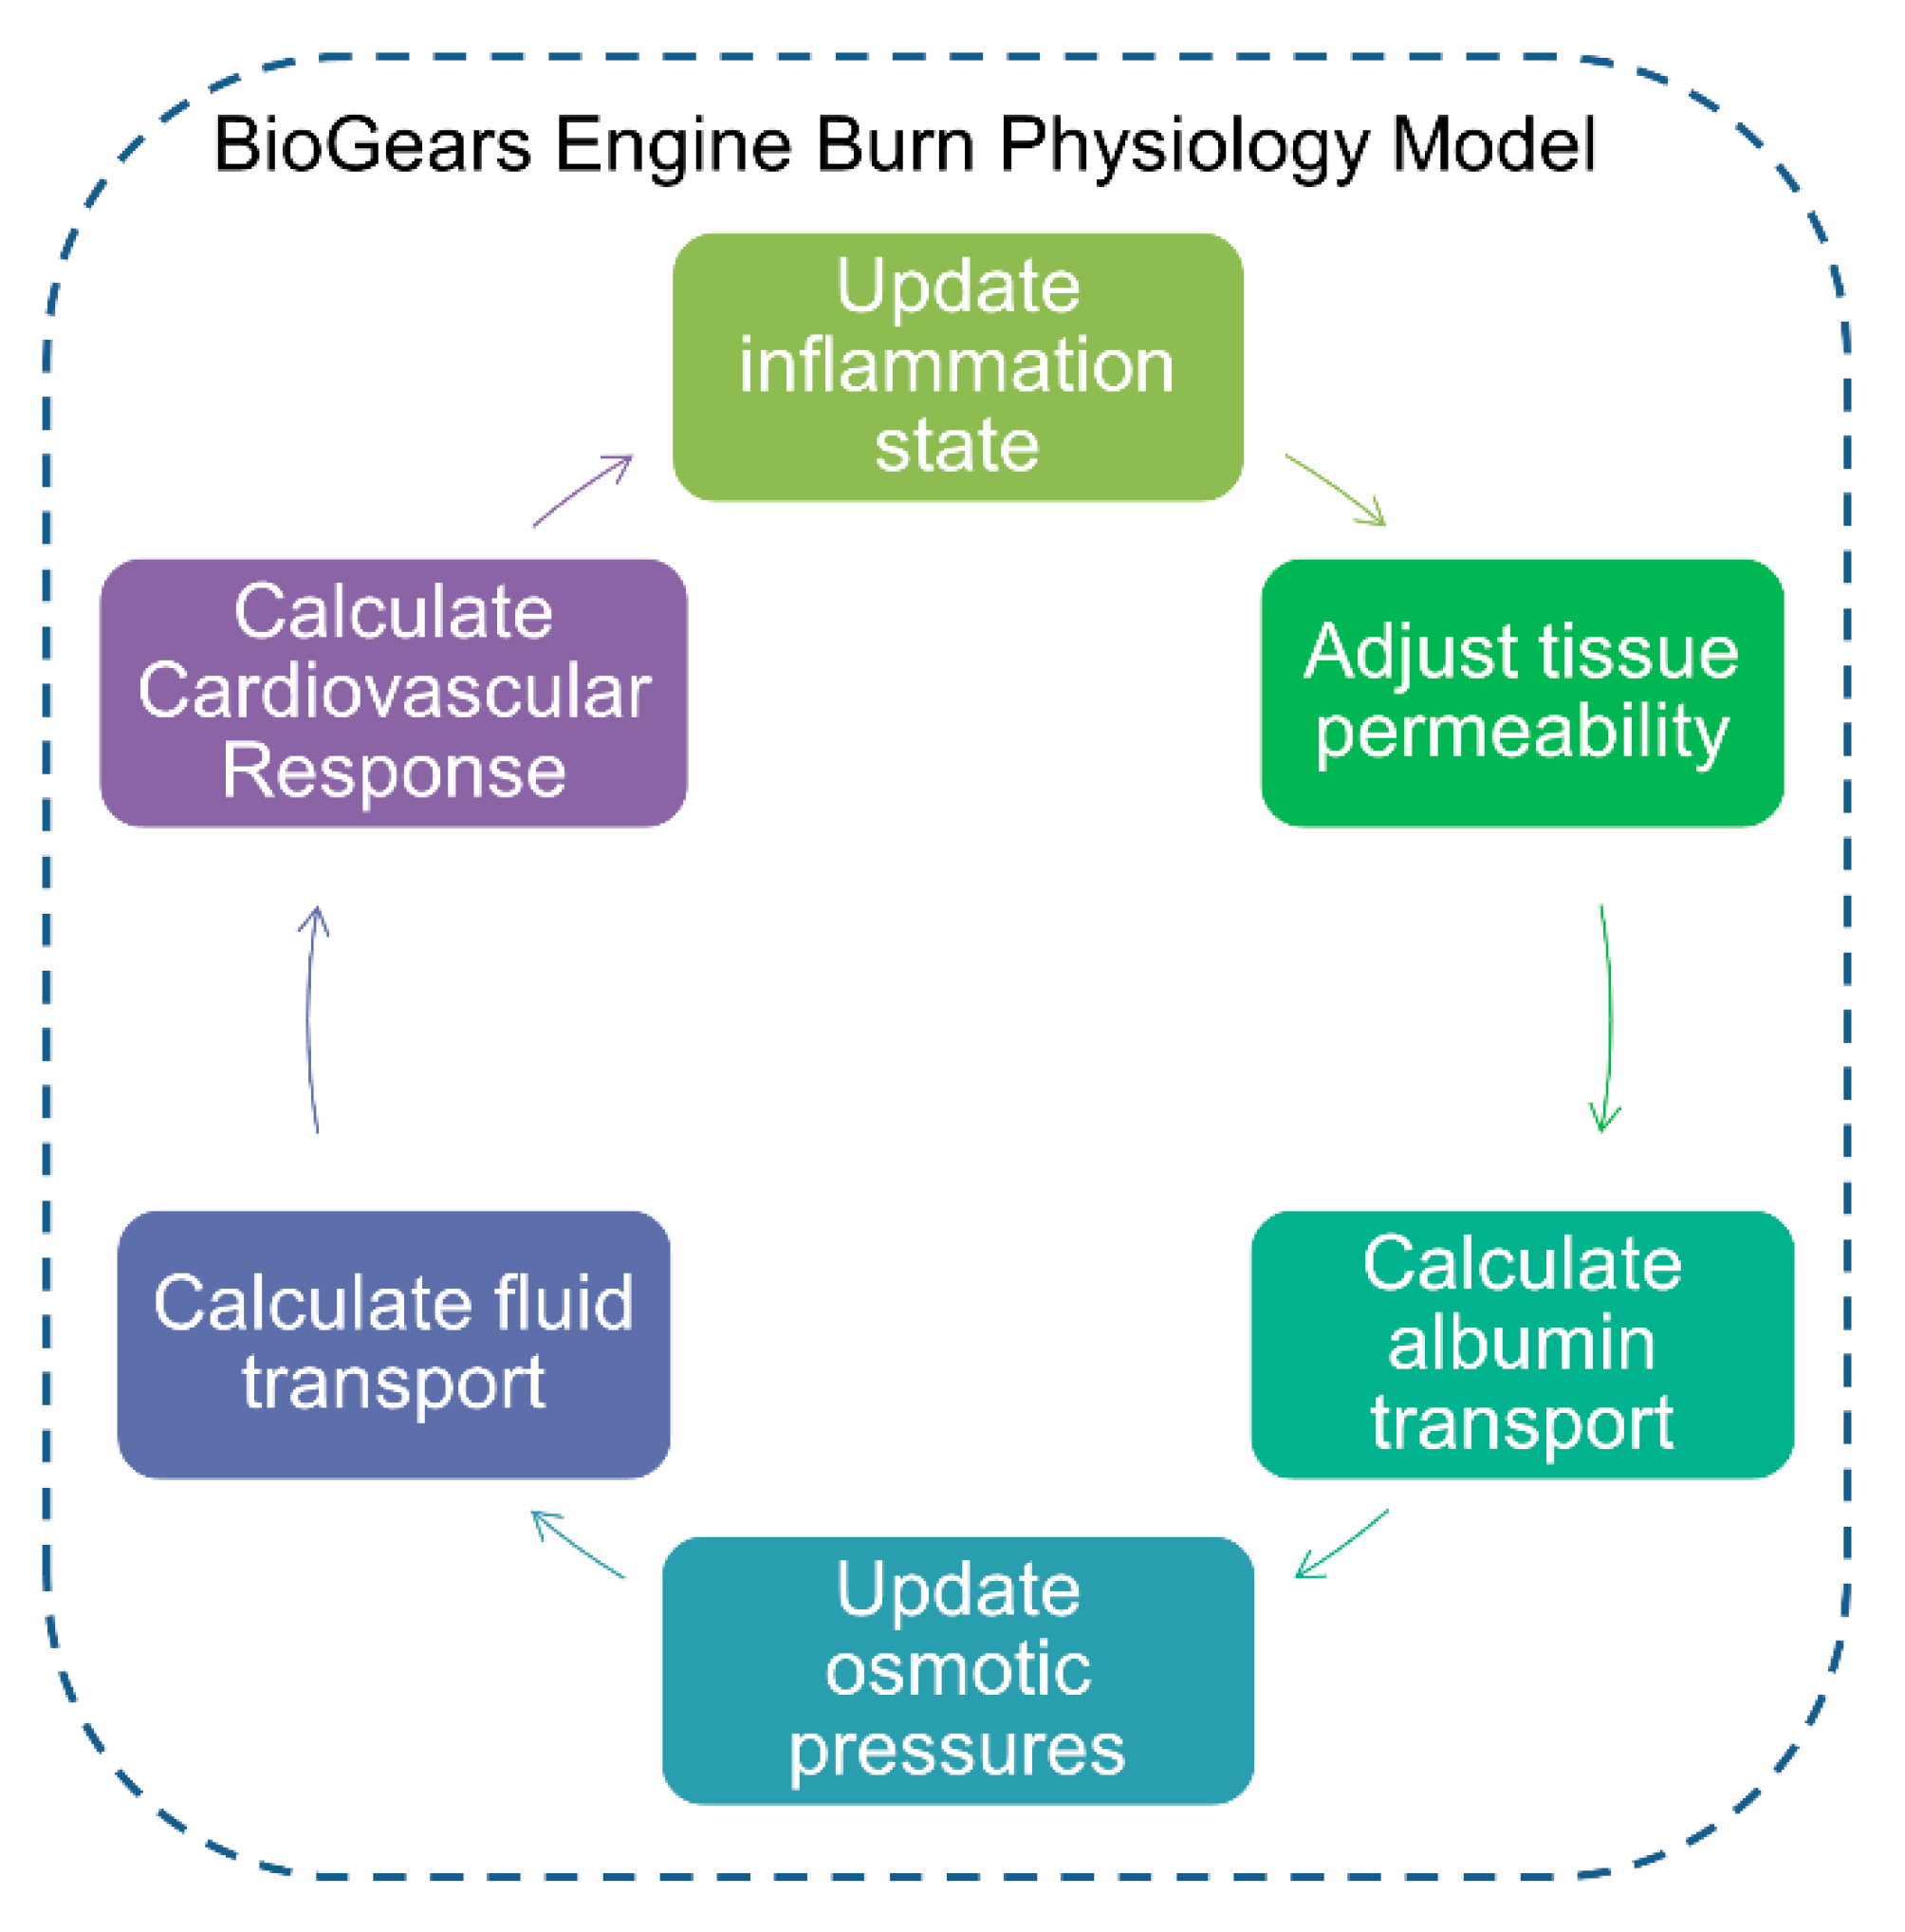
In response to hyper inflammation, the nervous system drives much of the physiological markers generated by the BioGears model, Figure 2 [24]. As the inflammation model reduces vascular volume, blood pressure and oxygen carrying capacity both decrease. A model of the central nervous system includes aortic, carotid, chemoreceptors, cardiopulmonary receptors, and pulmonary stretch receptors properly models the autoregulatory feedback due to hypovolemia. Each of these receptor contributions are gathered in the form of an efferent, sympathetic efferent, and an efferent vagal (parasympathetic) signal that update the existing cardiopulmonary BioGears model. We define the three signals as the sum of their respective receptor contributions:
f E S , H = f e s , + ( f e s , 0 f e s , ) exp ( k e s ( ( w i f i ) i = 1 4 θ S H ) ) f E S , P = f e s , + ( f e s , 0 f e s , ) exp ( k e s ( ( w ˜ i f ˜ i ) i = 1 4 θ S H ) ) f E V = ( f e v , 0 + f e v , exp ( f A B f A B , 0 k e v ) 1 + exp ( f A B f A B , 0 k e v ) ) + ( w ˜ i f ˜ i ) i = 1 4 θ S H
where fES,H is the sympathetic heart fiber signal, fES,p is the sympathetic peripheral fiber signal, and fEV is the vagal heart signal. Other parameters define the weights, wi associated with each receptor response, fi, the steady and minimum firing rate fes,0,∞, the slope parameter of the computed response, kes, and the signal threshold for a given response, ƟSH. We omit the equations determining the response to hypoxia for brevity but note that they are calculated to produce a functional relationship between the partial pressure of oxygen and the sympathetic firing rate.
Once we have computed each of these signals, the cardiopulmonary model is updated using effector equations to vary the resistance and compliance of the lumped circuit elements that control the BioGears fluid circulation model. These updates effectively connect pressure and oxygen partial pressures to the heart rate, respiration rate, and other major physiological markers. This ensures that the inflammatory response that results as a function of TBSA influences the overall physiology of the patient.
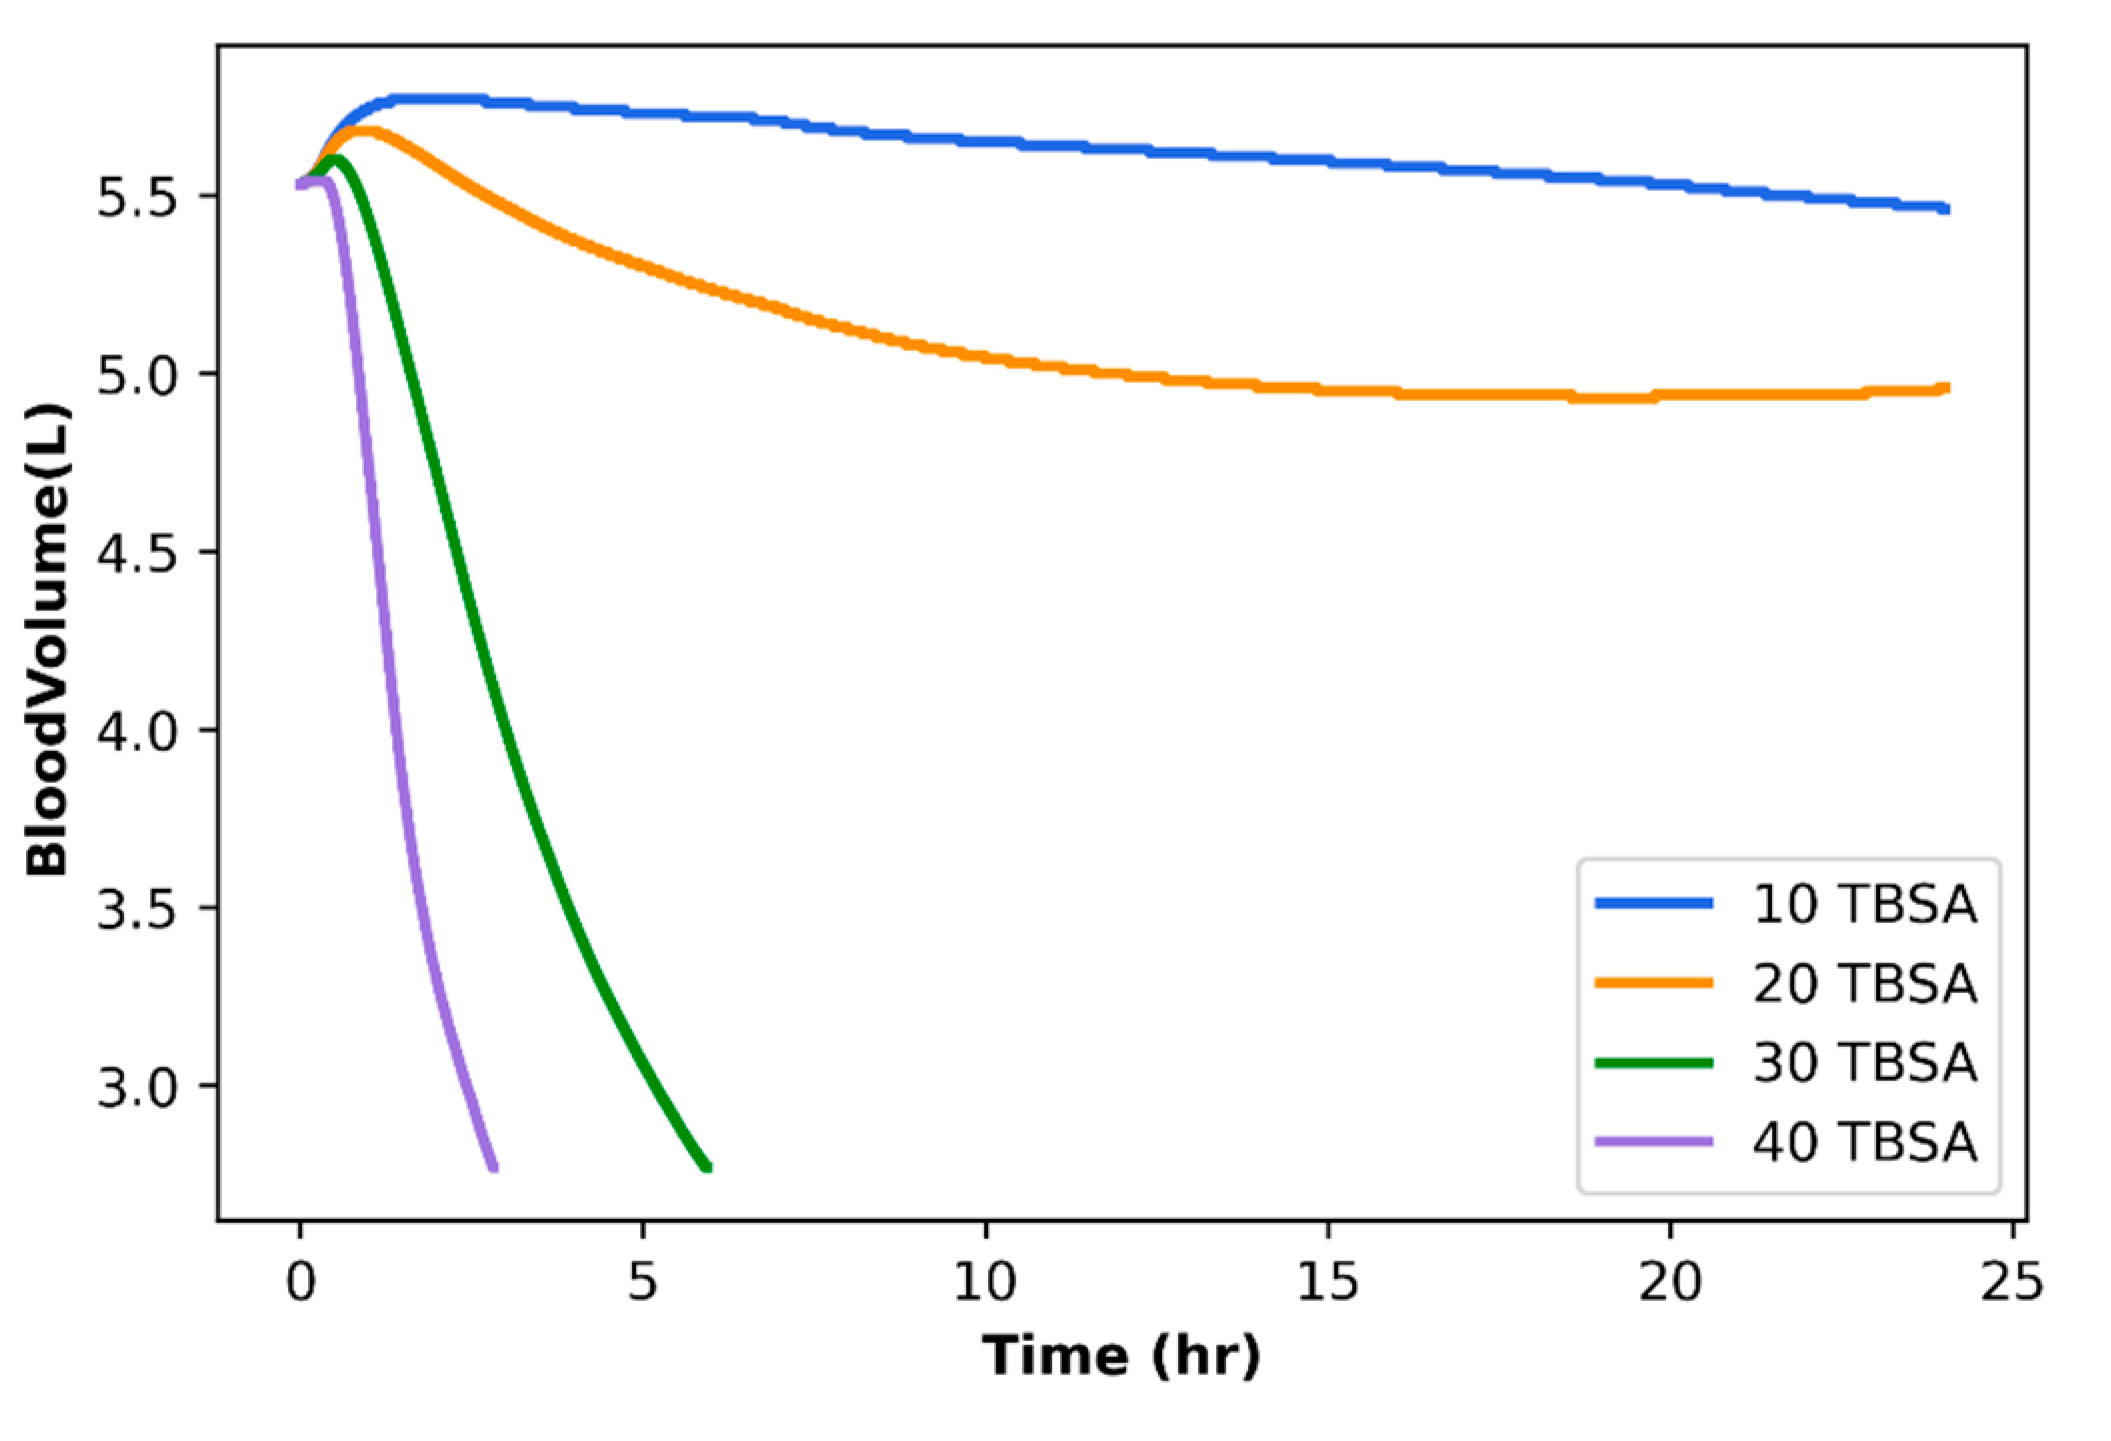
In the computational design, the burn action in BioGears is configured according to the severity of the wound as measured by the TBSA of the patient. The model takes, as an input, the TBSA and maps it to a value, Tr, which initiates the inflammatory cascade model. As time progresses, tissue integrity declines which proportionately decreases kP and σ (3). These changes increase both JV and, JA. The concentration gradient generated by albumin crossing the endothelium decreases vascular COP, thus increasing interstitial COP (2). The transport of albumin increases fluid shifts from the vasculature and further promotes albumin leak, causing a negative feedback loop that results in the increasing plasma volume depletion, Figure 3.
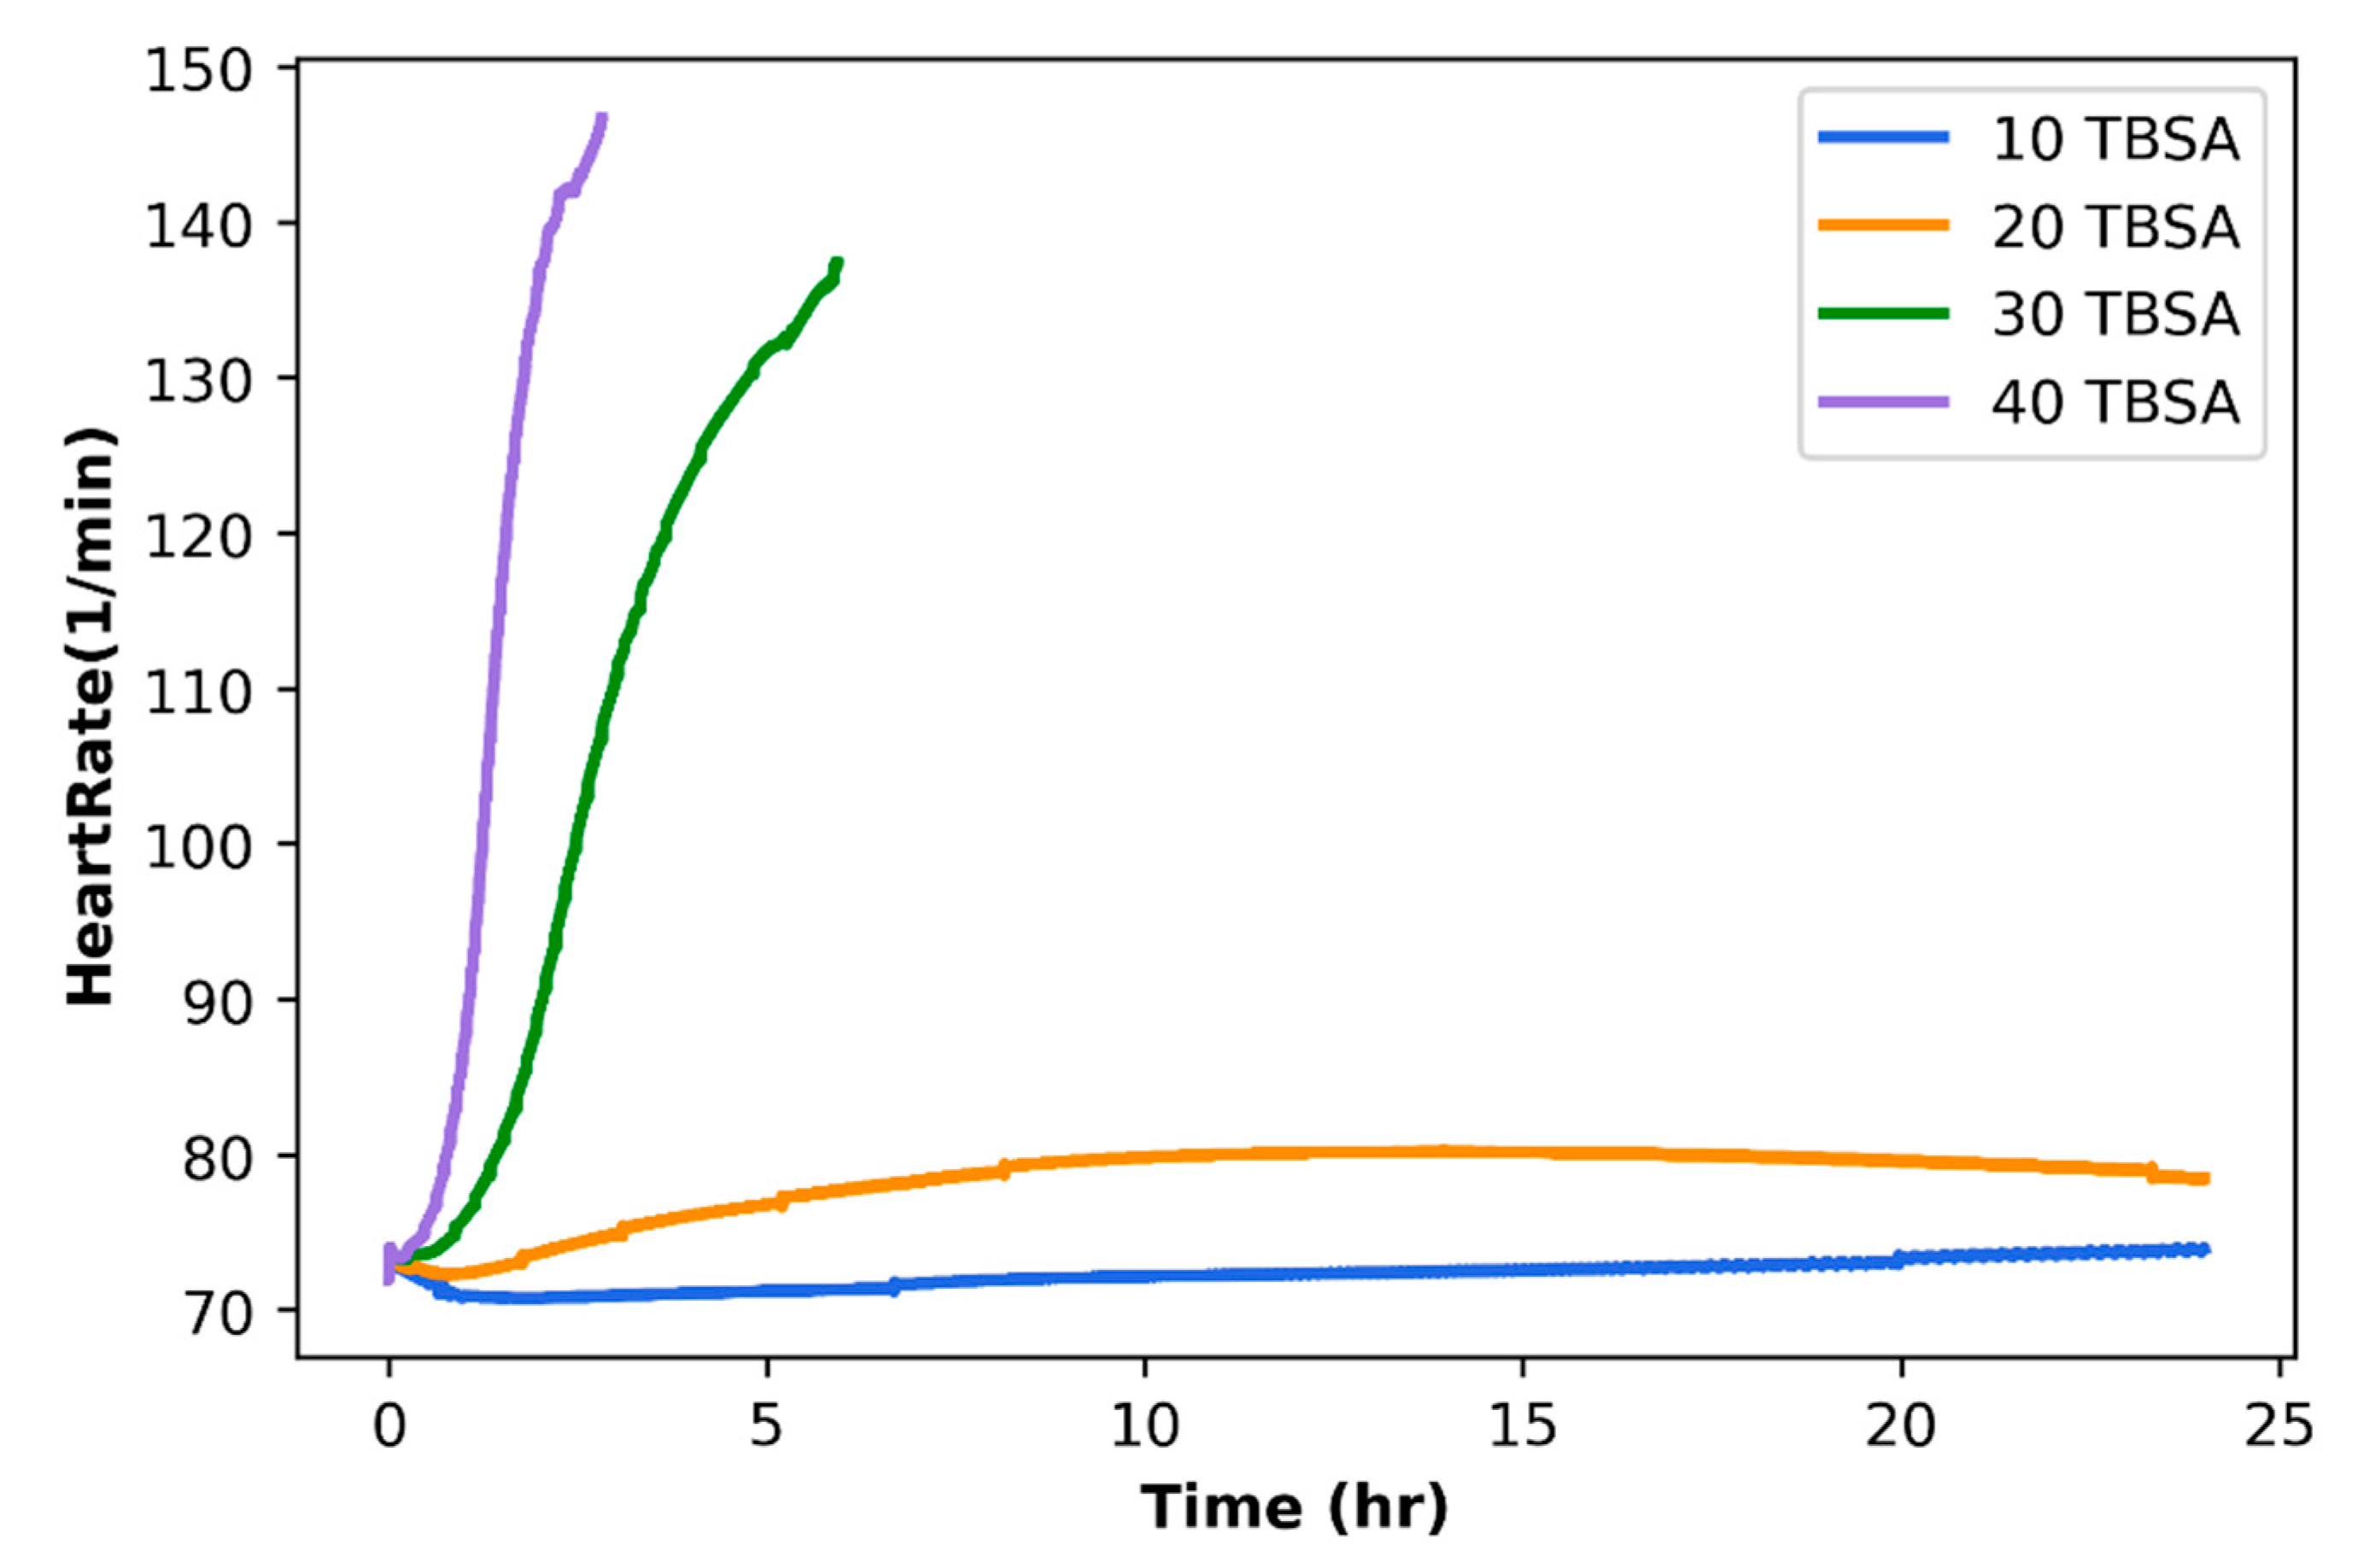
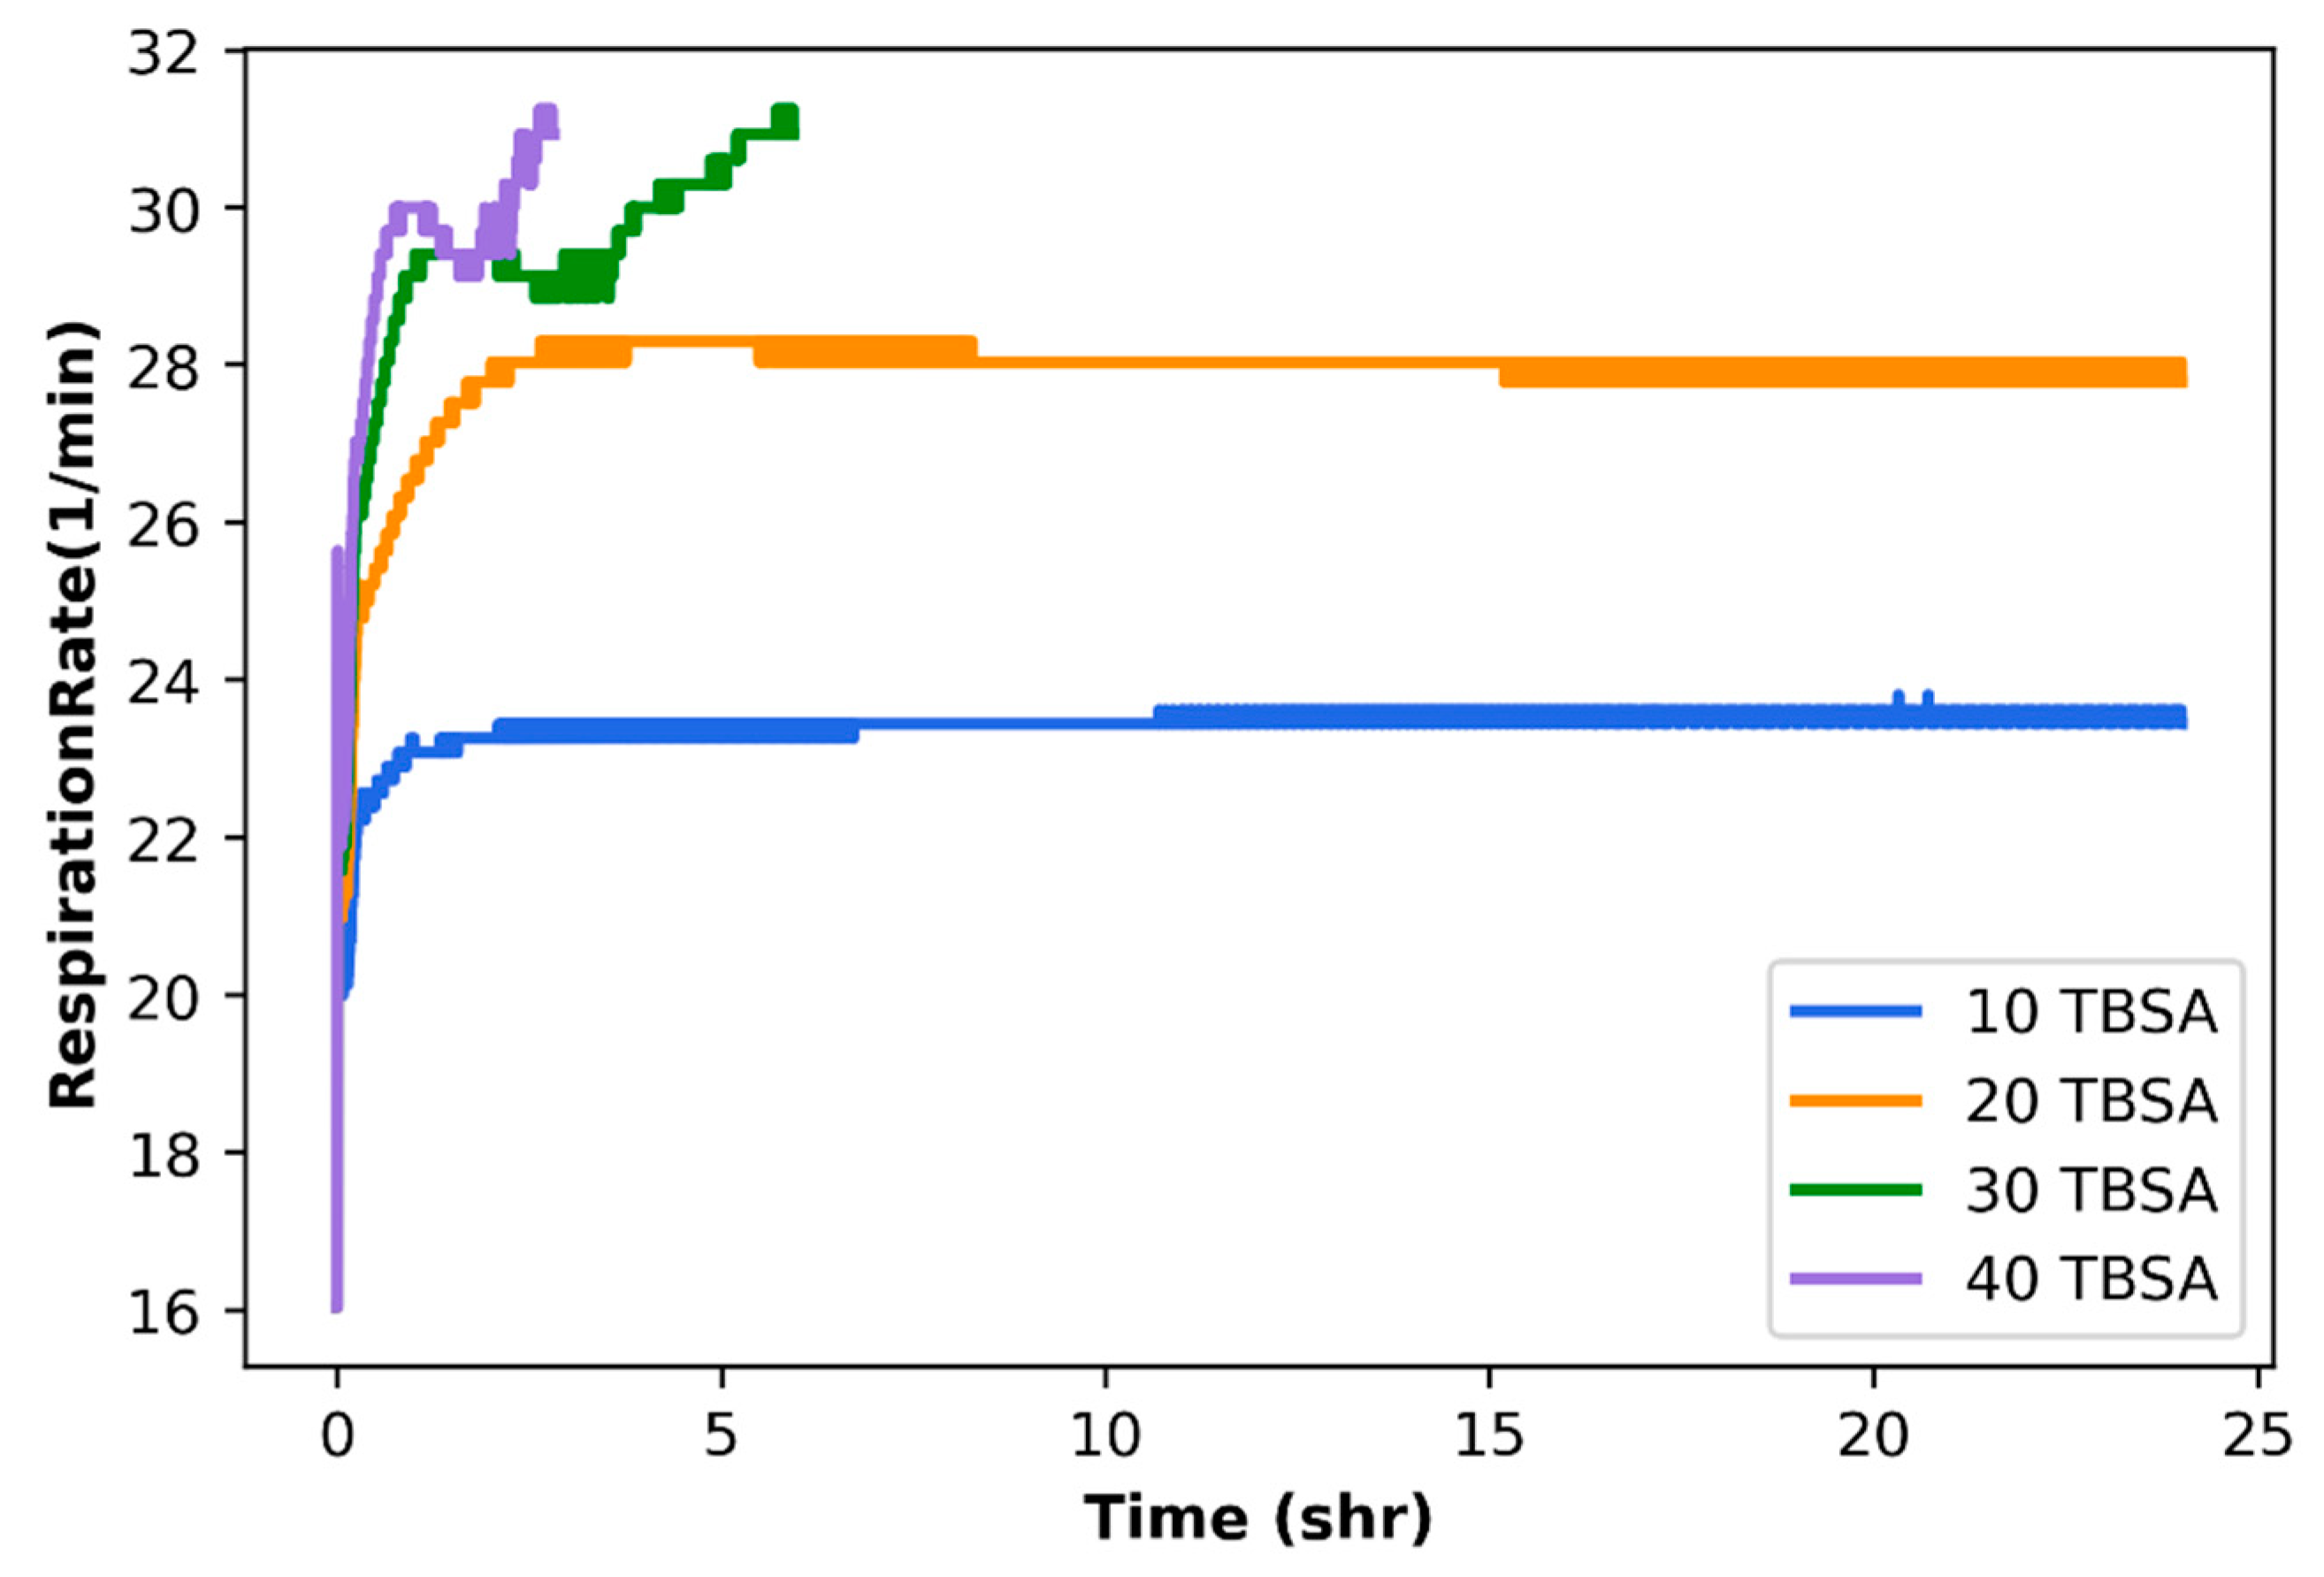
Volume depletion initiates a nervous system response in BioGears, simulating the patient physiology in response to large TBSA, Figure 4. In addition, we note that burn wounds are generally coupled by a severe pain response in the patient [25,26]. The pain response is modeled by simulating the pharmacological effects of epinephrine released in the blood as a response to the pain suffered by the patient. This model drives further sympathetic outflow via the BioGears drug system—and increases respiration rate (RR), Figure 5.
Detecting patient trajectories is formulated as a supervised learning problem: “Given an hourly state file, what trajectory does a patient belong to?”. Our solution to this problem consists of four steps. First, we extract features from BioGears hourly patient state files. BioGears is a high-fidelity simulator making it difficult to isolate a small number of key values. As a result, we extract 20,397 numerical values from each state file that represent the feature space of a patient trajectory. Our second step creates a patient embedding by reducing the dimensionality of the feature space using UMAP [27,28]. Reducing the dimensionality supports both learning from a small number of samples (there are only 79 total state files) and density-based clustering methods that use Euclidean distances (i.e., K-means). In our third step, we seek data-driven evidence that burn categories can be separated using physiological data. We note that observing the physiological response as a function of TBSA leads us to believe that there exist 3 distinct patient groupings. We use an unsupervised learning method (K-means clustering [29,30] to cluster patient states into three desired trajectories (K = 3). Our final step is a 4-fold cross validation that splits our 79 patient states into train and test groups. The test is kept separate and is used to validate the trained model. A patient’s current state is predicted using a nearest neighbor classifier trained on the UMAP patient state embeddings with ground truth labels from K-means and report on typical performance metrics.

3. Results

The model is demonstrated by simulating burns of 10%, 20%, 30%, and 40% TBSA, Figure 3, Figure 4 and Figure 5. These simulations show the progression of a patient without any intervention following the burn incidence. The results show the physiology appropriately responding to increases in TBSA. Note that for each graph in Figure 6, the lines for 30% TBSA and 40% TBSA stop early due to the patient not surviving the full 24-h simulation without treatment. The data demonstrate how a greater severity burn decreases tissue integrity which can affect circulatory flow through the affected compartments and increase the heart rate and respiration rate. Additionally, blood volume decreases at a greater rate with more severe burns, contributing to the death of the simulated patients with 30% and 40% TBSA.
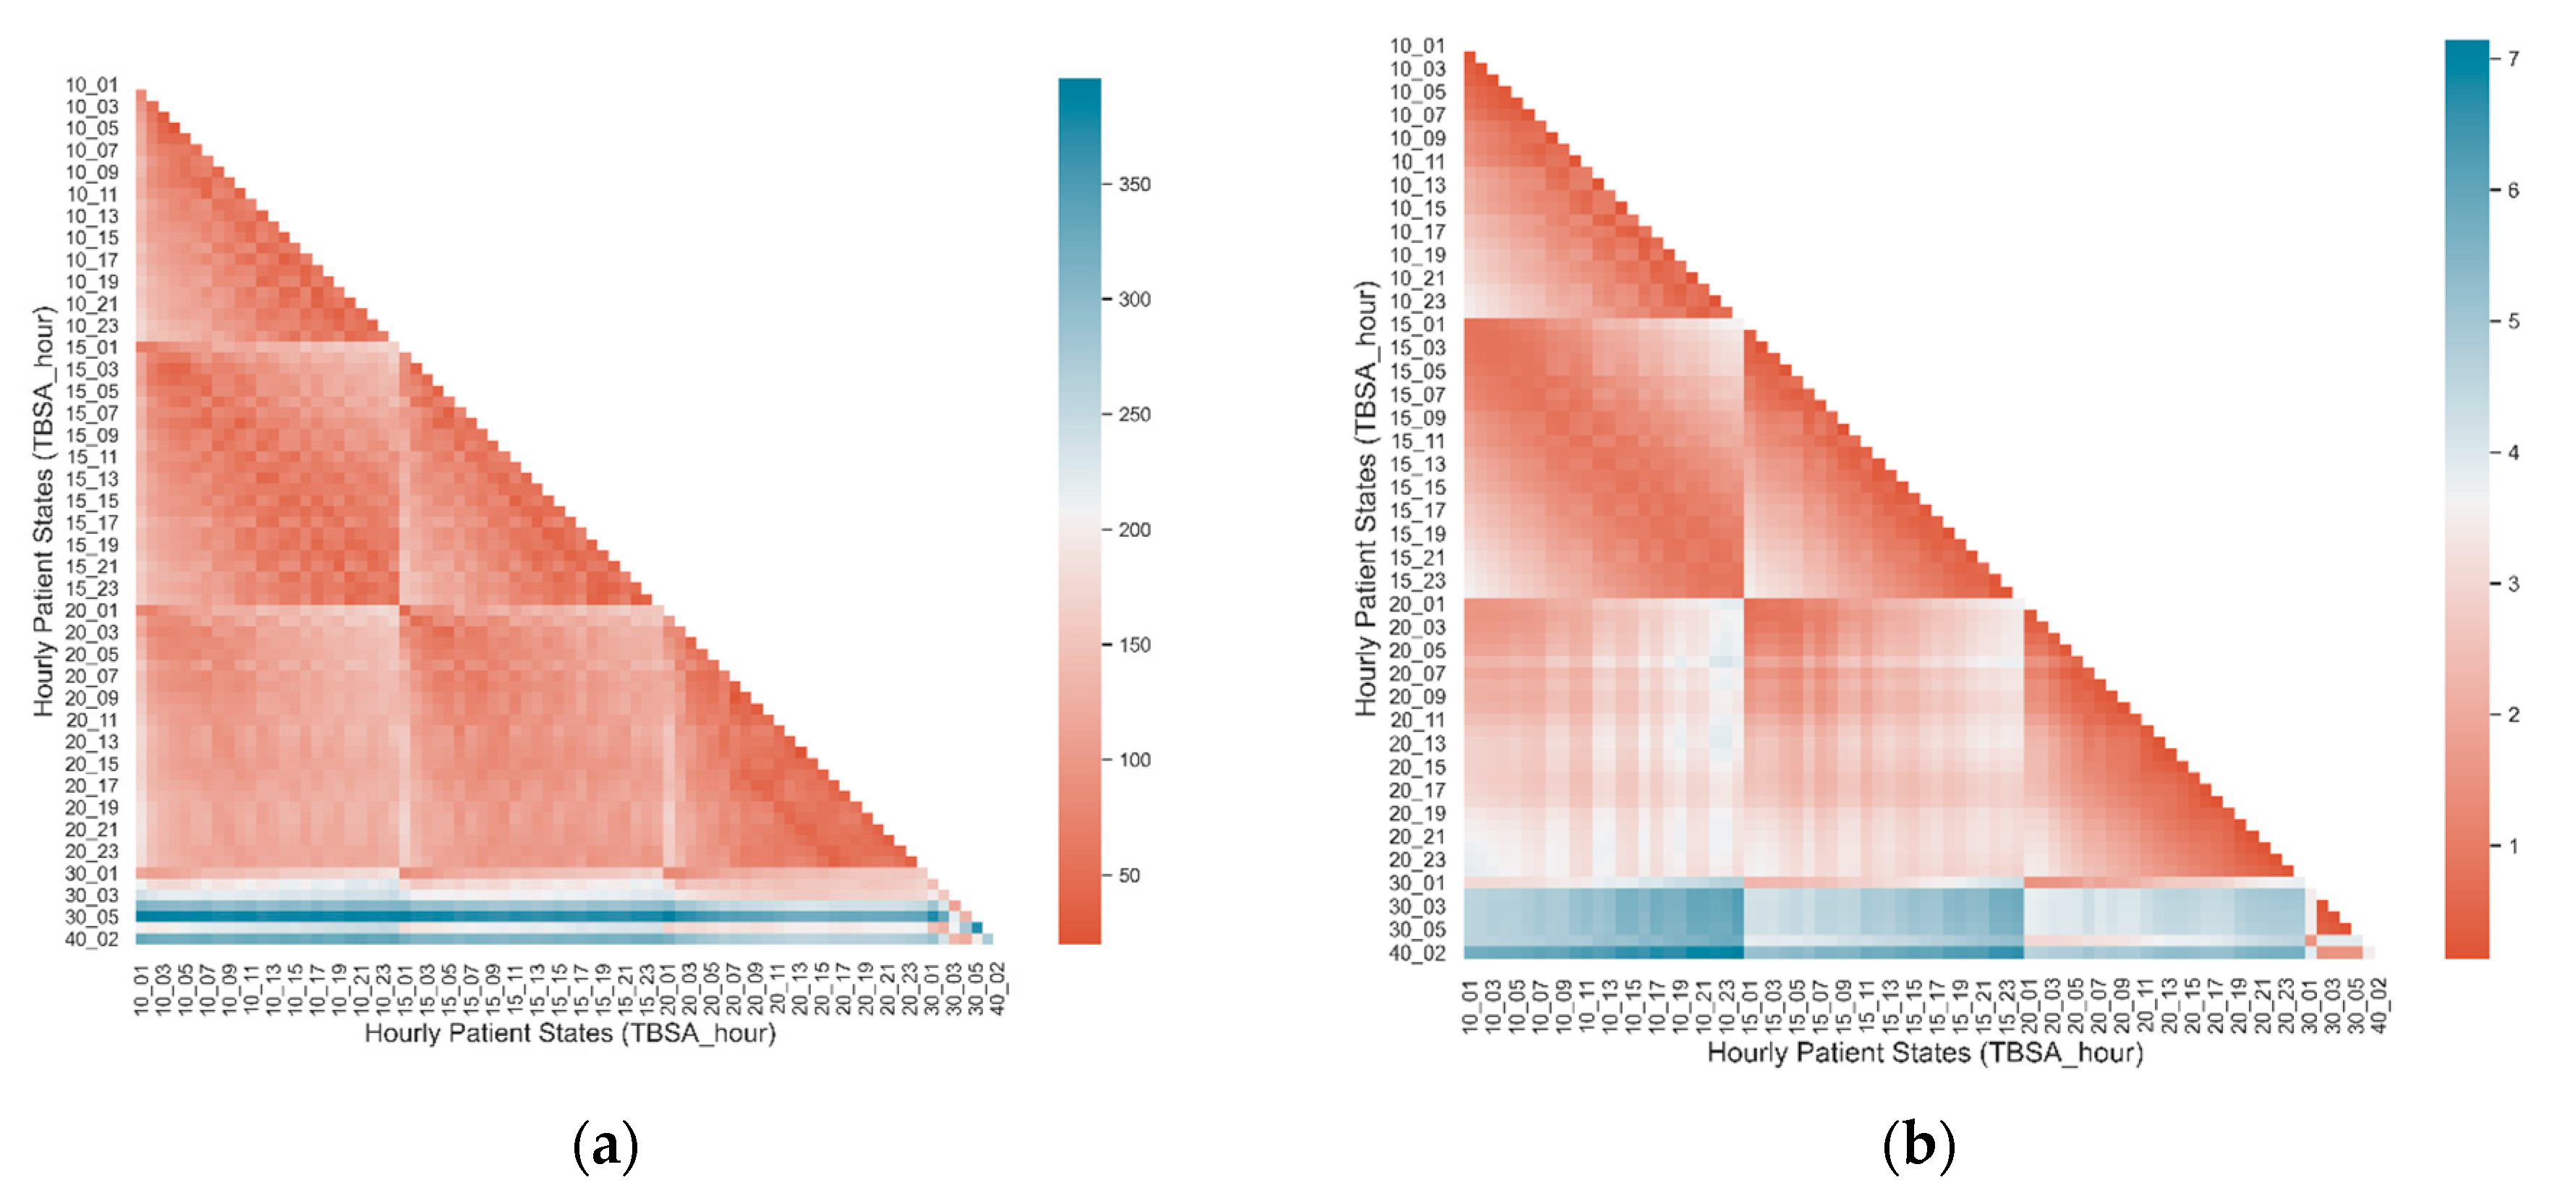
For the 79 patient physiological data sets, 20,397 values are extracted to create an initial feature space. Figure 7a represents the pairwise Euclidean distance between the standardized, scaled feature space. The small changes in shading indicate that there is little difference within and between different TBSA patients. Figure 7b contains the Euclidean distance between embedded patient states where the dimensionality is reduced from 20,397 to 15 features. The overall scale in the color bar indicates more confidence in the Euclidean distance metric. Additionally, changes in shading within each TBSA patient occur over the course of time, indicating overall physiological changes. Between each TBSA patient we can see that 10 and 15% TBSA are similar by darker red shading. The 20% TBSA patient comparisons to 10/15% TBSA are white and light red and light blue when compared to 30/40% indicating that 20% is its own burn category. The 30/40% hours are shaded blue when compared to other patients and light red to one another indicating that they are their own category. Overall, the UMAP dimension reduction highlights differences between TBSA patients that are difficult to identify when using the full feature space. This is likely due to removing unnecessary features from our coarse-grained extraction of physiological data from BioGears patient state files.
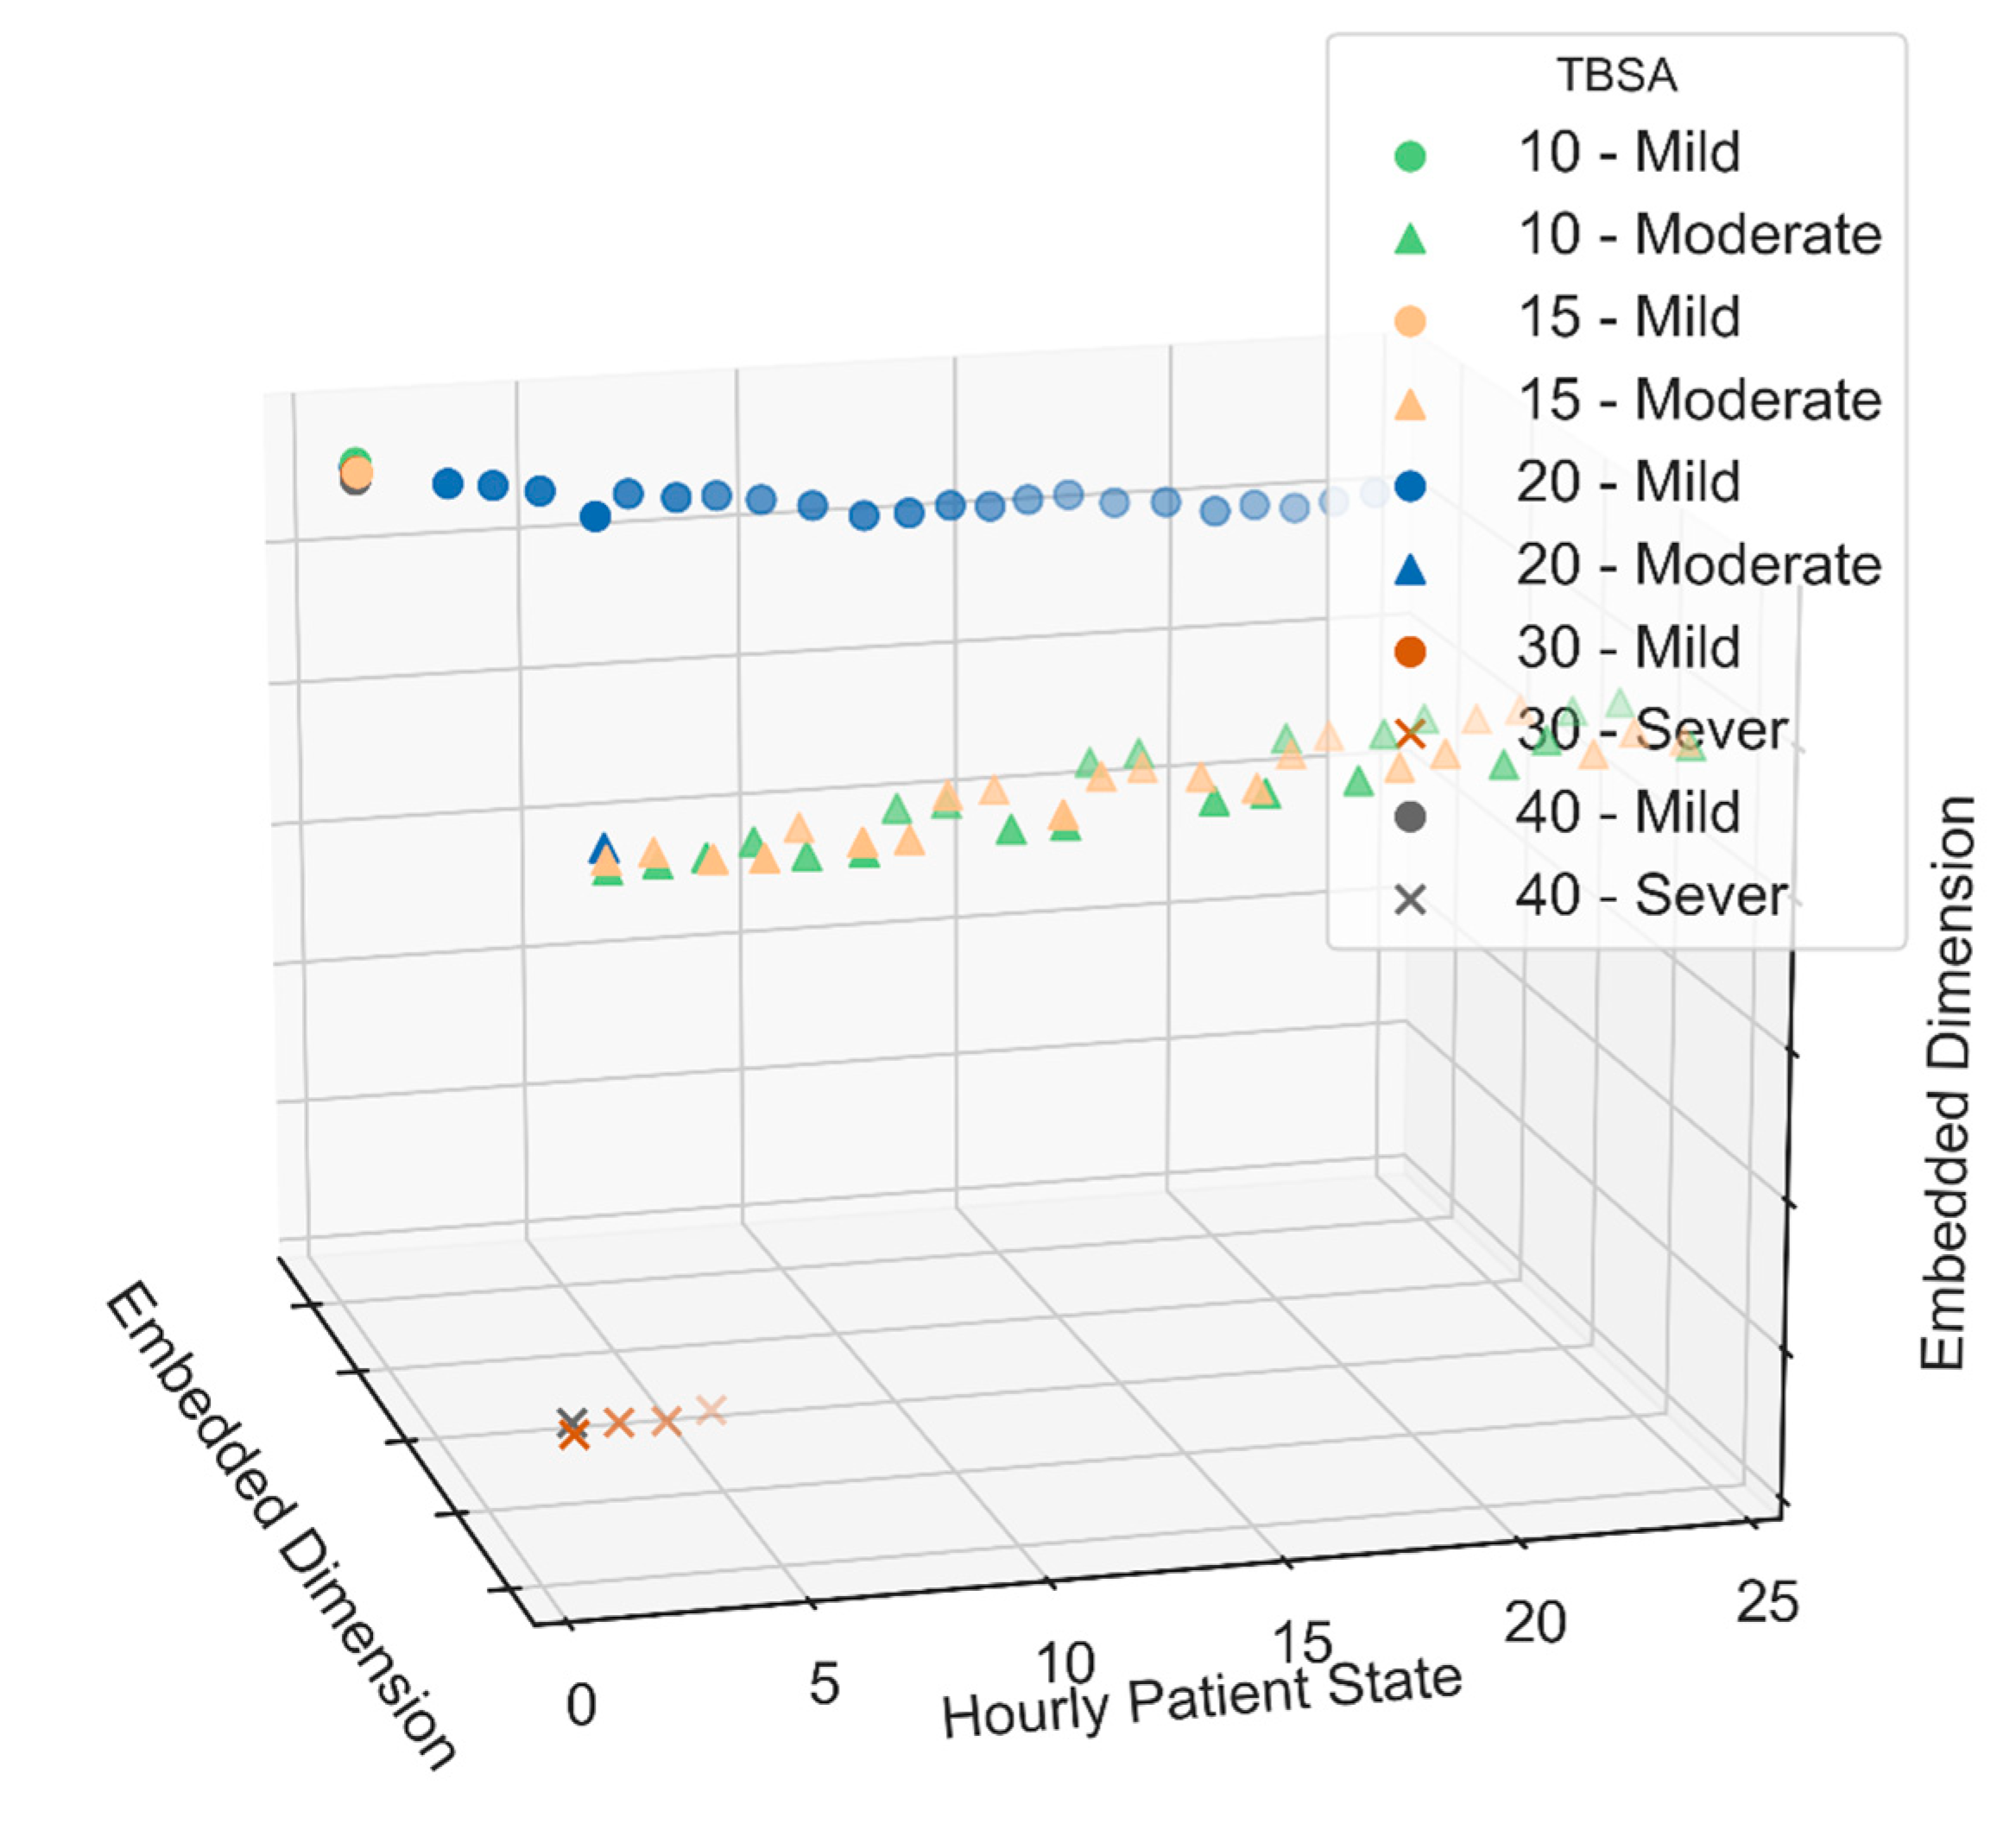
After the UMAP dimensionality reduction, 79 patient states were clustered using K-means clustering (with K = 3). We use three clusters as it is consistent with the US Army’s use of rounding to the nearest 10% TBSA and considering a TBSA over 20% as severe (categories are 10%, 20%, >20%) [31]. Figure 6 shows two UMAP dimensions over time along with the resulting clusters. There are three distinctive clusters, 10/15 TBSA, 20% TBSA and 30/40% TBSA that correspond to trajectories of mild, moderate, and severe burns, respectively. Given the large initial feature space and small number of samples, this in an encouraging result and is supported by the US Army’s burn care heuristics. The only point of ambiguity is the initial first hour of all patients are together in the top left corner. It may be that during the first hour post burn it is difficult to identify the severity category on physiology alone. Should this observation hold with a greater number of samples, it would be acceptable since a trainee will also have the ability to visually inspect a patient.
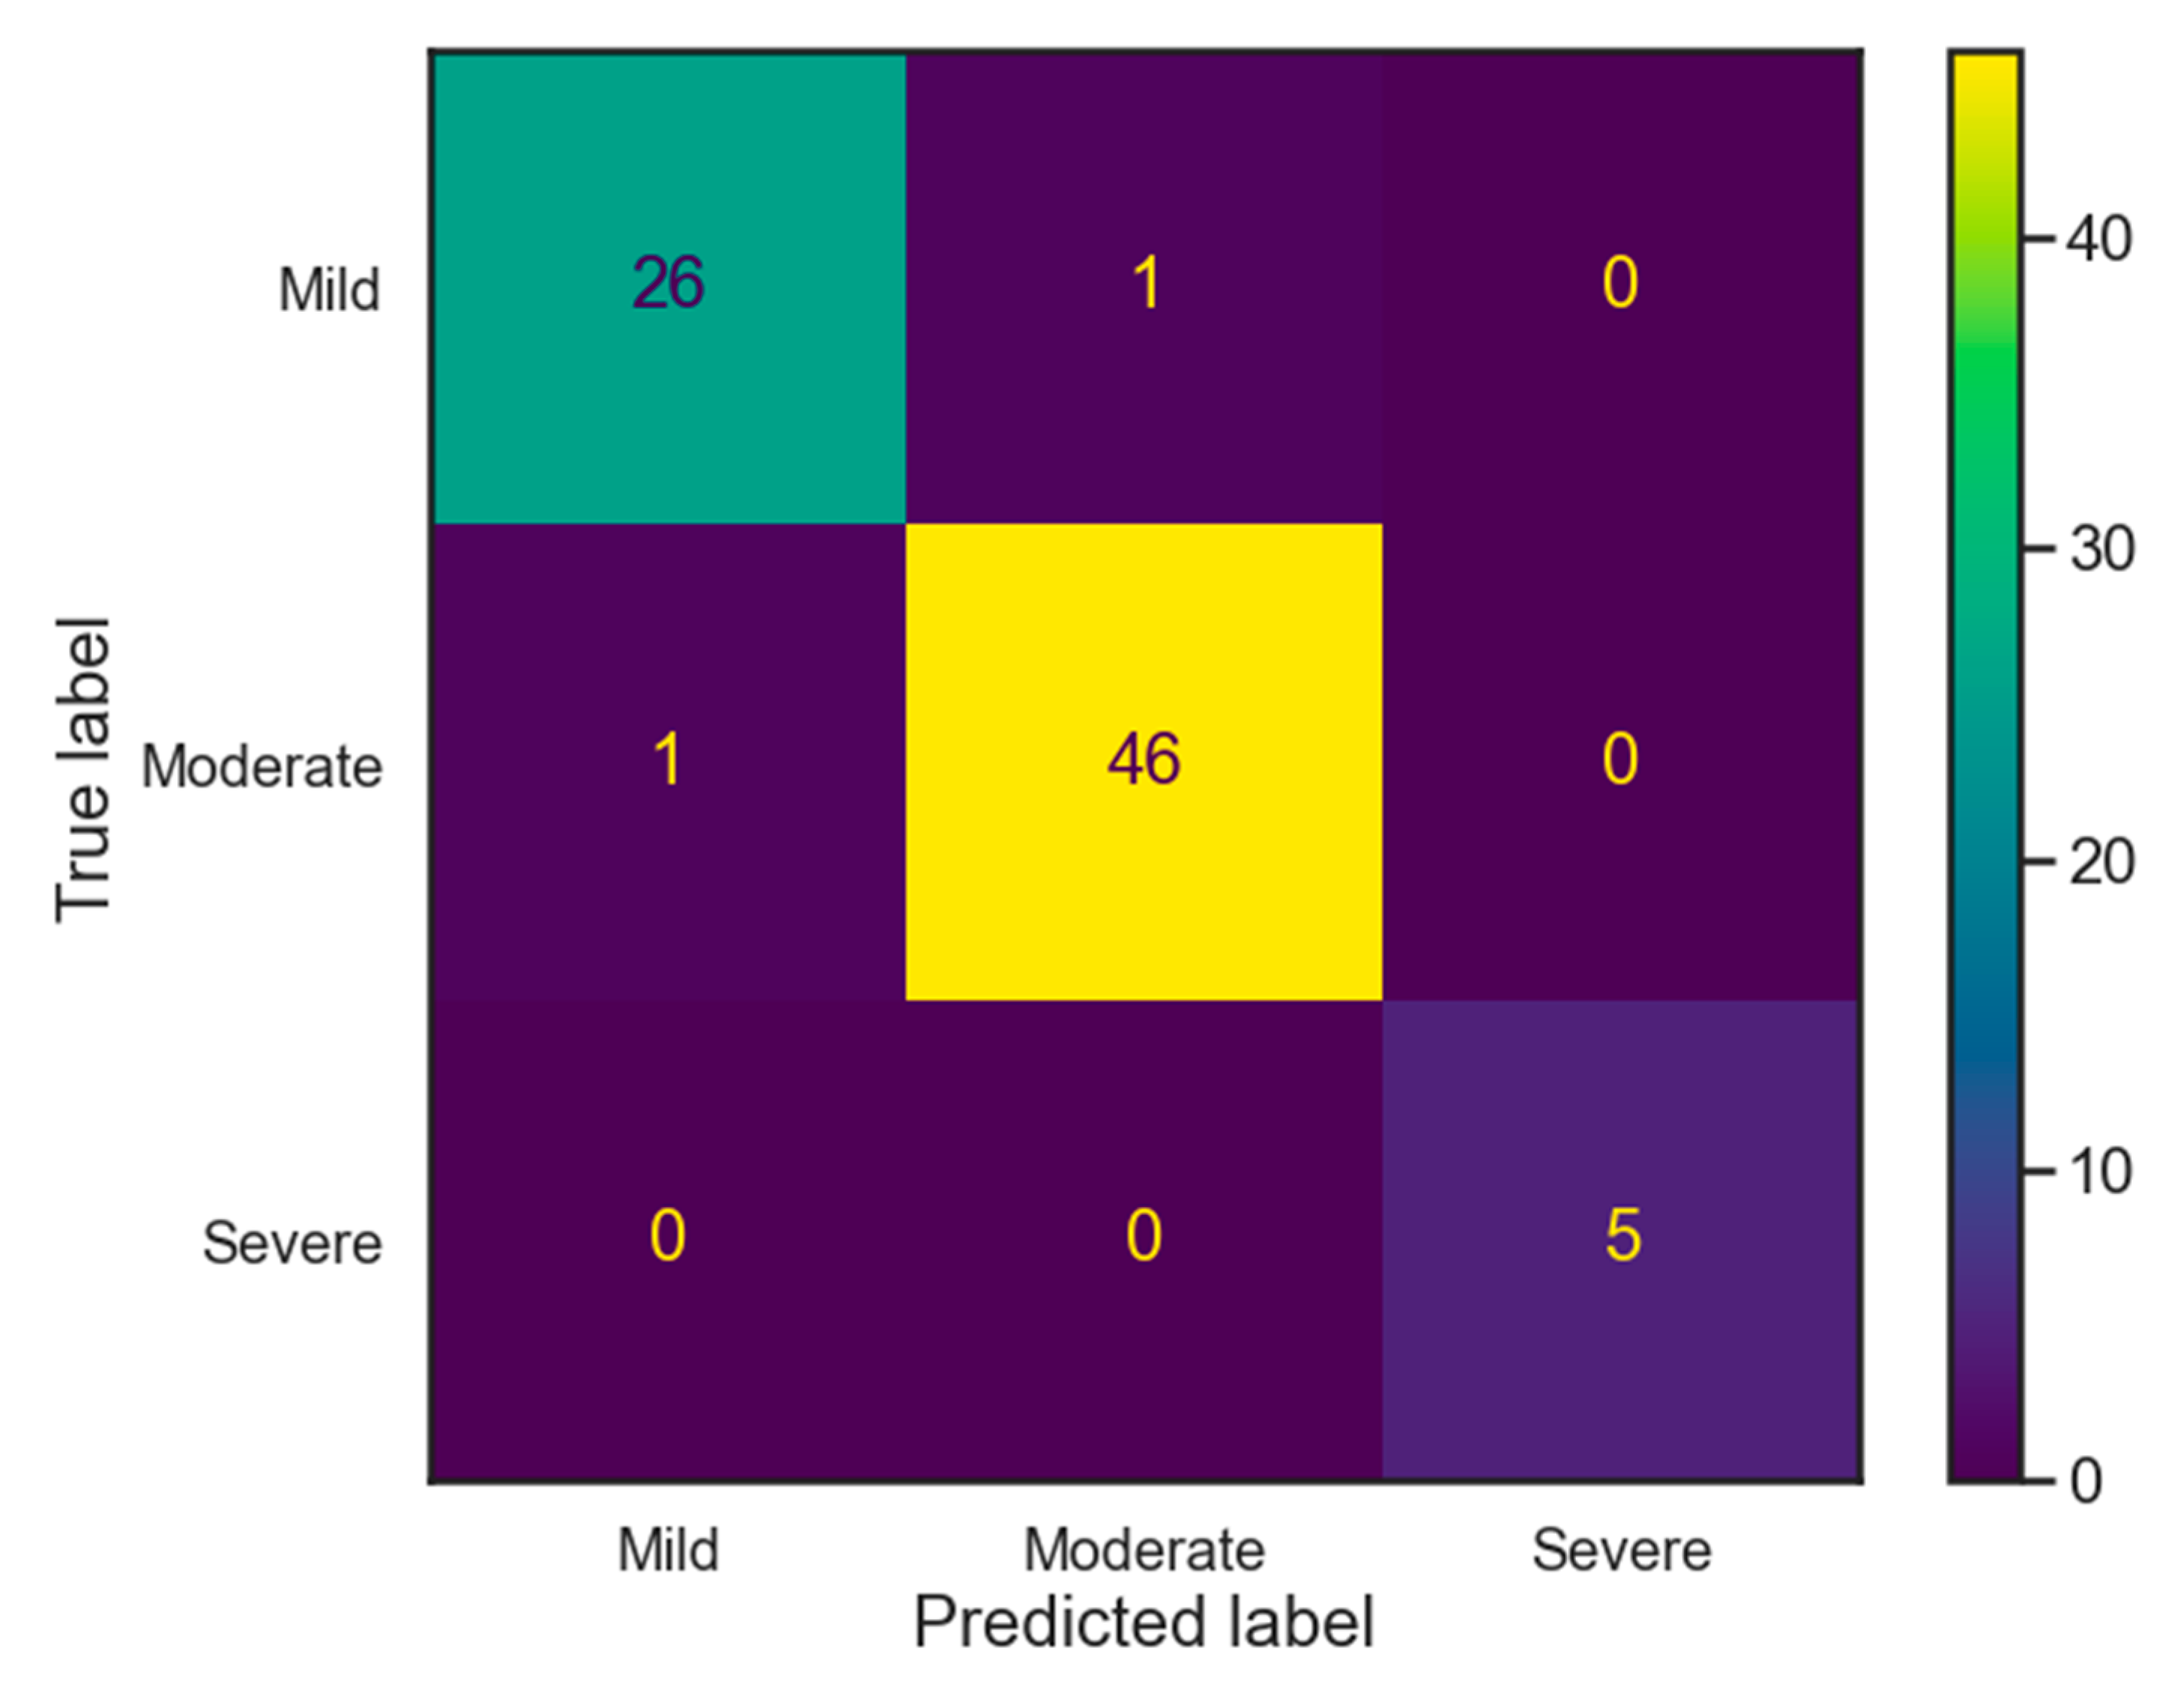
Lastly, we separate the 79 patient states into training and test data sets and use the initial K-means cluster as the ground truth labels. We performed a 4-fold cross validation (cross-fold validation is the typical method used to assess how well a data-driven model will generalize beyond the dataset) and despite the few number of training samples in each fold, a trained nearest neighbor classifier (using three nearest neighbors) is able to correctly predict all but two samples correctly, Figure 8. The two incorrect predictions were the first hour of patients with TBSA 15 and 20. Despite the small number of samples, this is an encouraging result that supports our goals of predicting a burn victim’s physiological trajectories given an initial burn TBSA. This is not an operational ML model but is an encouraging incremental result towards constructing a clinical pipeline that may, in the future, increase patient health related to burn outcomes.

4. Discussion

BioGears simulates the whole-body physiological response of burn injuries by coupling a model of inflammation with a cardiopulmonary circulatory and nervous system models. The model shows systemic physiological responses that follow appropriate trajectories, given an initial TBSA. The patient will die because of TBSA burns over 30%. A large data set of patient responses for a given burn TBSA is generated by simulating patients using this model. This database can then be leveraged to train a model to predict patient physiological trajectories. There appear to be three distinct grouping of patients within this data set that correspond to what we label as mild, moderate, and severe injuries. The trained nearest neighbor model can accurately sort patients into these three bins, given an initial patient state. The algorithm struggles to properly label a patient for the first few hours of the simulation for moderately burned patients, TBSA’s of 15 and 20. Future work that leverages real world data to test the efficacy of the trained ML model will be essential in determining clinical relevance. This will also be critical in determining if a computational model can properly train an ML algorithm as it relates to real patient data and will be an area of future work.
To continue this work the ML model can be trained on a more complex data set that includes common patient treatments such as fluid resuscitation. Given proper treatment we would like to determine if this model can properly predict patient trajectory changes, given a certain level of care provided. To validate this model, we would like test it against available electronic health records, to determine how well it performs with real patient data. Given these tests, we would hope to provide a tool that may eventually be used by care providers to predict patient trajectories, aid in triage, and suggest patient care in order to transition patients into safer labels.

5. Patents

All code, data, and results presented in this paper are available to the community via permissible Apache 2.0 open source license. Links to these resources can be found here. In addition, all patient state files and data associated with said simulations are also available under the creative commons 4.0 attribution and are available here.

Author Contributions

Conceptualization, A.A.-B., A.B. and M.H.; methodology, A.B. and A.A.-B.; software, N.T., S.W., A.B. and A.A.-B.; validation, A.B., M.S.-M. and M.H.; formal analysis, A.A.-B. and N.T.; investigation, A.B. and A.A.-B.; data curation, S.W., N.T. and A.A.-B.; writing—original draft preparation, A.B., N.T. and A.A.-B.; writing—review and editing, A.B., N.T., M.S.-M., M.H. and A.A.-B.; visualization, A.A.-B., and N.T.; supervision, M.H.; project administration, M.H. and M.S.-M.; All authors have read and agreed to the published version of the manuscript.

Funding

This work and all data gathered herein was funded by Department of Defense contract number W911NF-18-C-0037. The initial design and idea for the research that led to this application was led and managed by Dr. Matthew Hackett out of Army Research Lab.

Institutional Review Board Statement

No review boards were required for this study.

Informed Consent Statement

No human subjects were used for this study.

Data Availability Statement

Python code to generate the results found in this document can be found on github. All the data used to train the models can be found on zeonodo, under the creative commons license. Data can be re-generated using the BioGears physiology engine, available under the open source Apache 2.0 license.

Acknowledgments

We’d like to acknowledge and thank the large team at USISR who helped with discussions on the model construction: Michael Rowland, Alicia Williams, Jose Salinas and many others.

Conflicts of Interest

The authors declare no conflict of interest.

References

  1. Nielson, C.B.; Duethman, N.C.; Howard, J.M.; Moncure, M.; Wood, J.G. Burns: Pathophysiology of systemic complications and current management. J. Burn Care Res. 2017, 38, e469–e481. [Google Scholar] [CrossRef] [PubMed]
  2. American Burn Association. Burn Incidence and Treatment in the United States: 2016; National Burn Repository: Chicago, IL, USA, 2016. [Google Scholar]
  3. Reeves, P.T.; Borgman, M.A.; Caldwell, N.W.; Patel, L.; Aden, J.; Duggan, J.P.; Serio-Melvin, M.L.; Mann-Salinas, E.A. Bridging burn care education with modern technology, an integration with high fidelity human patient simulation. Burns 2018, 44, 1106–1129. [Google Scholar] [CrossRef]
  4. Rowan, M.P.; Cancio, L.C.; Elster, E.A.; Burmeister, D.M.; Rose, L.F.; Natesan, S.; Chan, R.K.; Christy, R.J.; Chung, K.K. Burn wound healing and treatment: Review and advancements. Crit. Care 2015, 19, 1–12. [Google Scholar] [CrossRef] [Green Version]
  5. Kaddoura, I.; Abu-Sittah, G.; Ibrahim, A.; Karamanoukian, R.; Papazian, N. Burn injury: Review of pathophysiology and therapeutic modalities in major burns. Ann. Burn. Fire Disasters 2017, 30, 95–102. [Google Scholar]
  6. Ng, C.-J.; You, S.-H.; Wu, I.-L.; Weng, Y.-M.; Chaou, C.-H.; Chien, C.-Y.; Seak, C.-J. Introduction of a mass burn casualty triage system in a hospital during a powder explosion disaster: A retrospective cohort study. World J. Emerg. Surg. 2018, 13, 38. [Google Scholar] [CrossRef] [PubMed]
  7. Madni, T.D.; Imran, J.B.; Clark, A.T.; Arnoldo, B.A.; Phelan, H.A.; Wolf, S.E. Analysis of Operating Room Efficiency in a Burn Center. J. Burn. Care Res. 2017, 39, 89–93. [Google Scholar] [CrossRef] [PubMed]
  8. ISBI Practice Guidelines Committee; Ahuja, R.B.; Gibran, N.; Greenhalgh, D.; Jeng, J.; Mackie, D.; Moghazy, A.; Moiemen, N.; Palmieri, T.; Peck, M.; et al. ISBI Practice Guidelines for Burn Care. Burns 2016, 42, 953–1021. [Google Scholar] [CrossRef]
  9. Ker, J.; Wang, L.; Rao, J.; Lim, C.T. Deep Learning Applications in Medical Image Analysis. IEEE Access 2017, 6, 9375–9389. [Google Scholar] [CrossRef]
  10. Mani, S.; Ozdas, A.; Aliferis, C.; Varol, H.A.; Chen, Q.; Carnevale, R.; Chen, Y.; Romano-Keeler, J.; Nian, H.; Weitkamp, J.-H. Medical decision support using machine learning for early detection of late-onset neonatal sepsis. J. Am. Med. Inform. Assoc. 2014, 21, 326–336. [Google Scholar] [CrossRef] [PubMed] [Green Version]
  11. Desautels, T.; Calvert, J.; Hoffman, J.; Jay, M.; Kerem, Y.; Shieh, L.; Shimabukuro, D.; Chettipally, U.; Feldman, M.D.; Barton, C.; et al. Prediction of Sepsis in the Intensive Care Unit with Minimal Electronic Health Record Data: A Machine Learning Approach. JMIR Med. Inform. 2016, 4, e28. [Google Scholar] [CrossRef]
  12. Shimabukuro, D.W.; Barton, C.W.; Feldman, M.D.; Mataraso, S.; Das, R. Effect of a machine learning-based severe sepsis prediction algorithm on patient survival and hospital length of stay: A randomised clinical trial. BMJ Open Respir. Res. 2017, 4, e000234. [Google Scholar] [CrossRef]
  13. Rashidi, H.H.; Sen, S.; Palmieri, T.L.; Blackmon, T.; Wajda, J.; Tran, N.K. Early Recognition of Burn- and Trauma-Related Acute Kidney Injury: A Pilot Comparison of Machine Learning Techniques. Sci. Rep. 2020, 10, 1–9. [Google Scholar] [CrossRef] [PubMed]
  14. Rowland, R.A.; Ponticorvo, A.; Baldado, M.L.; Kennedy, G.T.; Burmeister, D.M.; Christy, R.J.J.; Bernal, N.P.; Durkin, A.J. Burn wound classification model using spatial frequency-domain imaging and machine learning. J. Biomed. Opt. 2019, 24, 056007. [Google Scholar] [CrossRef]
  15. Klein, M.B.; Goverman, J.; Hayden, D.L.; Fagan, S.P.; McDonald-Smith, G.P.; Alexander, A.K.; Gamelli, R.L.; Gibran, N.S.; Finnerty, C.C.; Jeschke, M.G.; et al. Benchmarking Outcomes in the Critically Injured Burn Patient. Ann. Surg. 2014, 259, 833–841. [Google Scholar] [CrossRef]
  16. Jeschke, M.G.; Mlcak, R.P.; Finnerty, C.C.; Norbury, W.B.; Gauglitz, G.G.; Kulp, G.A.; Herndon, D.N. Burn size determines the inflammatory and hypermetabolic response. Crit. Care 2007, 11, R90. [Google Scholar] [CrossRef] [PubMed] [Green Version]
  17. Chow, C.C.; Clermont, G.; Kumar, R.; Lagoa, C.; Tawadrous, Z.; Gallo, D.; Betten, B.; Bartels, J.; Constantine, G.; Fink, M.P.; et al. The acute inflammatory response in diverse shock states. Shock 2005, 24, 74–84. [Google Scholar] [CrossRef] [PubMed]
  18. Yang, Q.; Berthiaume, F.; Androulakis, I.P. A quantitative model of thermal injury-induced acute inflammation. Math. Biosci. 2011, 229, 135–148. [Google Scholar] [CrossRef] [PubMed] [Green Version]
  19. McDaniel, M.; Baird, A. A full-body model of burn pathophysiology and treatment using the BioGears engine. In Proceedings of the 2019 41st Annual International Conference of the IEEE Engineering in Medicine and Biology Society (EMBC), Berlin, Germany, 23–27 July 2019; pp. 261–264. [Google Scholar]
  20. Baird, A.; McDaniel, M.; White, S.A.; Tatum, N.; Marin, L. BioGears: A C++ library for whole body physiology simulations. J. Open Source Softw. 2020, 5, 2645. [Google Scholar] [CrossRef]
  21. Reynolds, A.M. Mathematical Models of Acute Inflammation and a Full Lung Model of Gas Exchange under Inflammatory Stress. Ph.D. Thesis, University of Pittsburgh, Pittsburgh, PA, USA, 2008. [Google Scholar]
  22. Mazzoni, M.C.; Borgström, P.; Arfors, K.E.; Intaglietta, M. Dynamic fluid redistribution in hyperosmotic resuscitation of hypovolemic hemorrhage. Am. J. Physiol. Content 1988, 255, H629–H637. [Google Scholar] [CrossRef] [PubMed]
  23. Rippe, B.; Haraldsson, B. Transport of macromolecules across microvascular walls: The two-pore theory. Physiol. Rev. 1994, 74, 163–219. [Google Scholar] [CrossRef]
  24. McDaniel, M.; Keller, J.M.; White, S.; Baird, A. A Whole-Body Mathematical Model of Sepsis Progression and Treatment Designed in the BioGears Physiology Engine. Front. Physiol. 2019, 10, 1321. [Google Scholar] [CrossRef] [PubMed]
  25. Ashburn, M.A. Burn Pain: The Management of Procedure-Related Pain. J. Burn. Care Rehabil. 1995, 16, 365–371. [Google Scholar] [CrossRef] [PubMed]
  26. Perry, S.W.; Heidrich, G. Management of pain during debridement: A survey of U.S. burn units. Pain 1982, 13, 267–280. [Google Scholar] [CrossRef]
  27. McInnes, L.; Healy, J.; Melville, J. Umap: Uniform manifold approximation and projection for dimension reduction. arXiv Preprint arXiv:1802.03426.
  28. Becht, E.; McInnes, L.; Healy, J.; Dutertre, C.-A.; Kwok, I.W.H.; Ng, L.G.; Ginhoux, F.; Newell, E.W. Dimensionality reduction for visualizing single-cell data using UMAP. Nat. Biotechnol. 2018, 37, 38–44. [Google Scholar] [CrossRef]
  29. Likas, A.; Vlassis, N.; Verbeek, J.J. The global k-means clustering algorithm. Pattern Recognit. 2003, 36, 451–461. [Google Scholar] [CrossRef] [Green Version]
  30. Pham, D.T.; Dimov, S.S.; Nguyen, C.D. Selection of K in K-means clustering. Proc. Inst. Mech. Eng. Part C J. Mech. Eng. Sci. 2005, 219, 103–119. [Google Scholar] [CrossRef] [Green Version]
  31. Ennis, J.L.; Chung, K.K.; Renz, E.M.; Barillo, D.J.; Albrecht, M.C.; Jones, J.A.; Blackbourne, L.H.; Cancio, L.C.; Eastridge, B.J.; Flaherty, S.F.; et al. Joint Theater Trauma System Implementation of Burn Resuscitation Guidelines Improves Outcomes in Severely Burned Military Casualties. J. Trauma Inj. Infect. Crit. Care 2008, 64, S146–S152. [Google Scholar] [CrossRef]
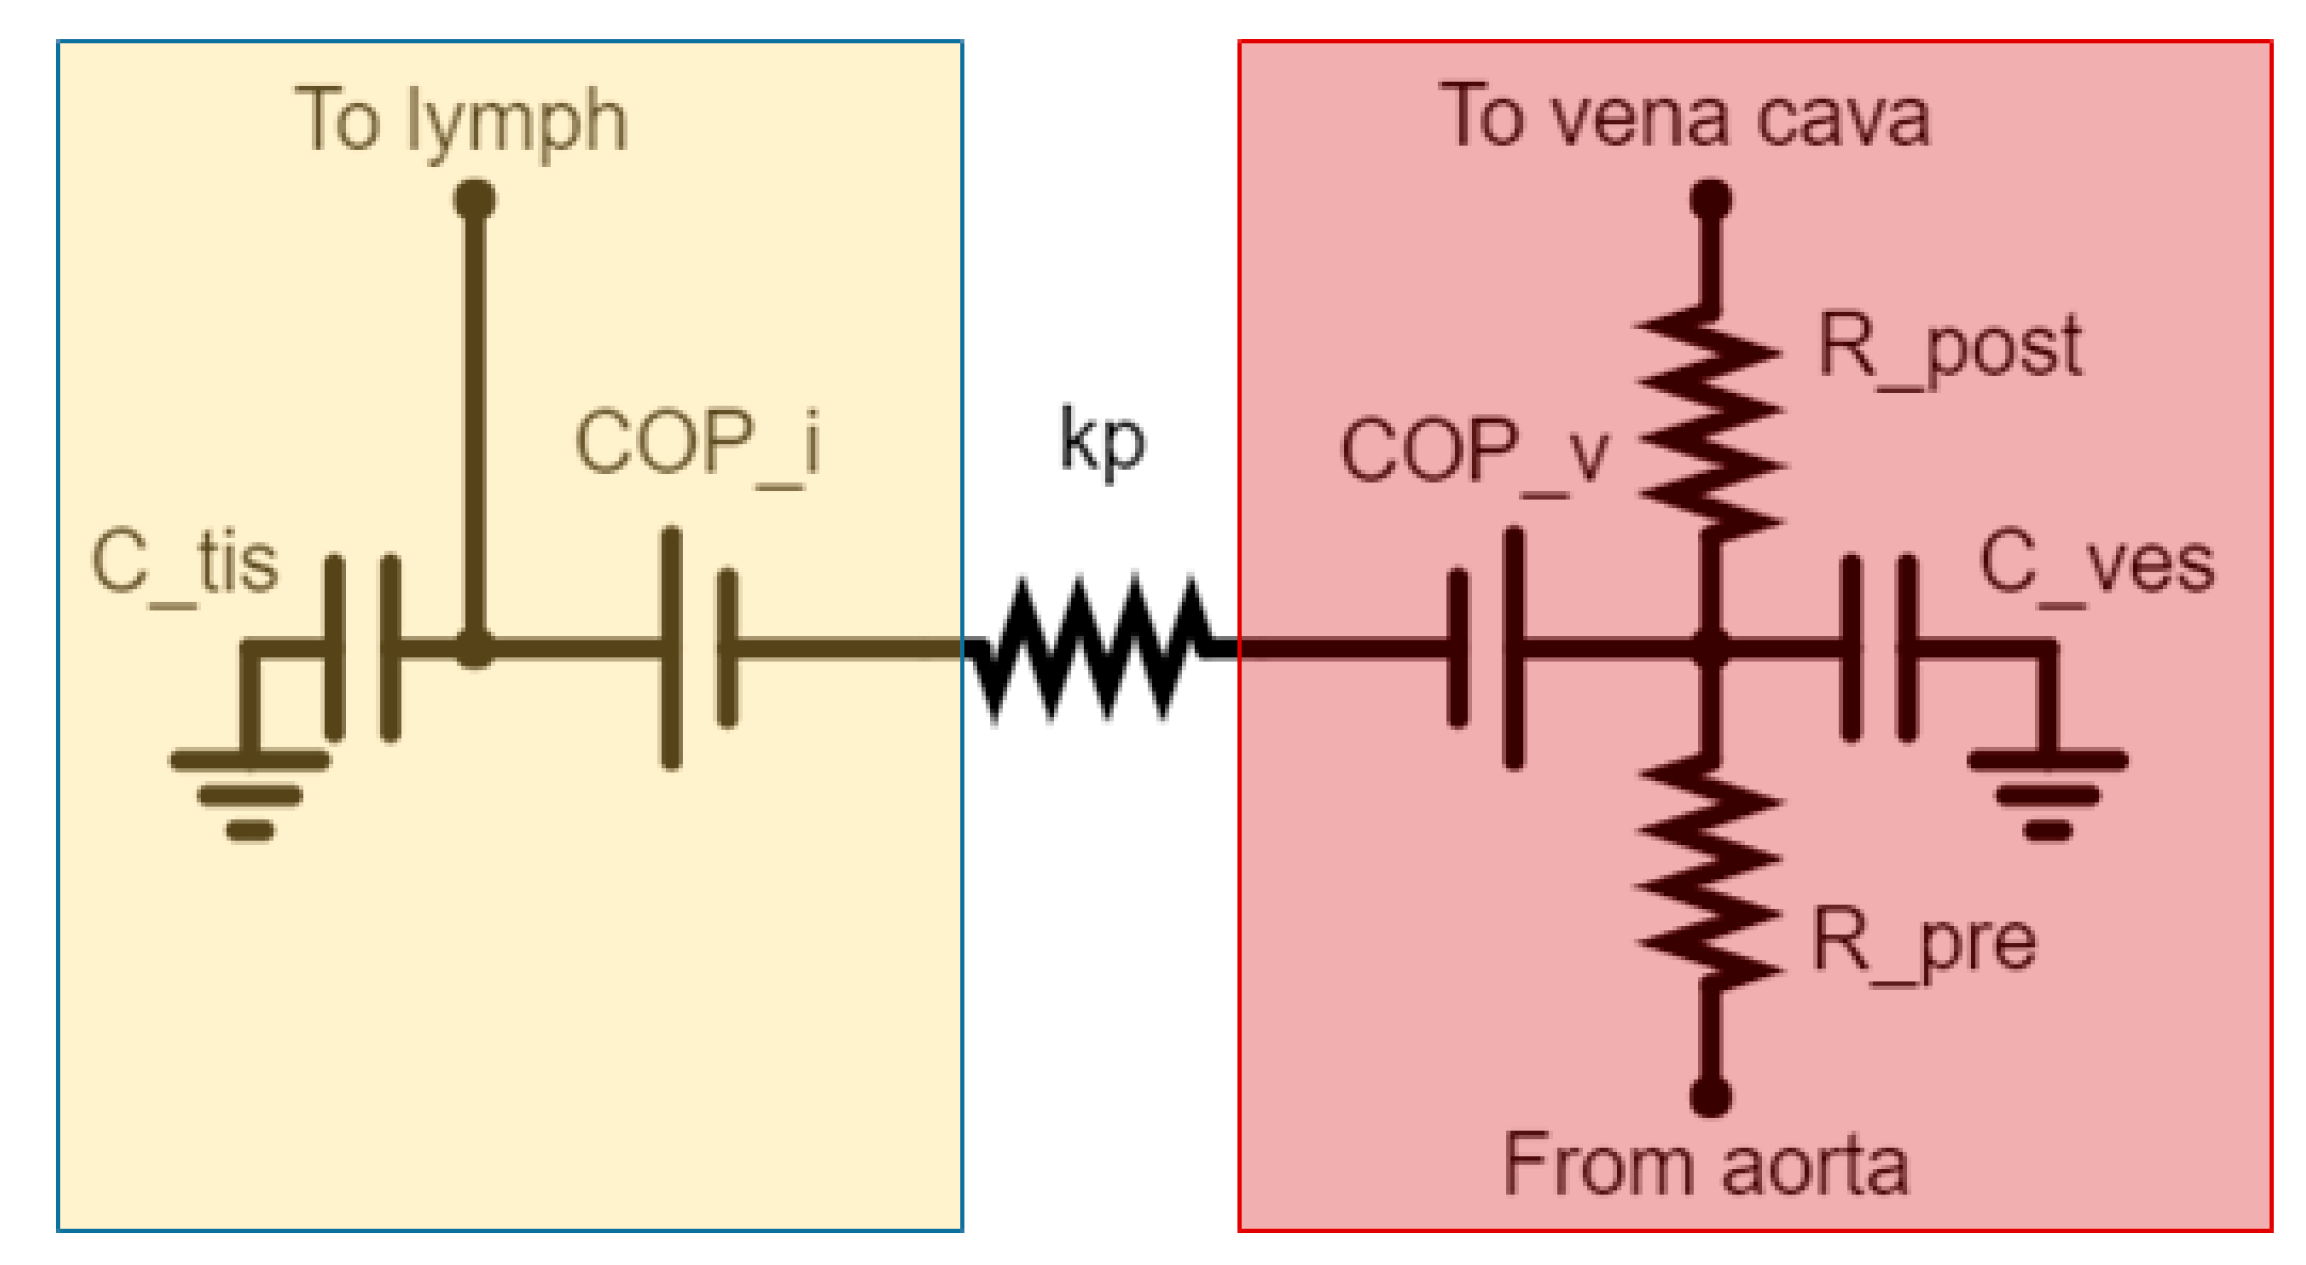
Figure 1. A sample vascular (red) and tissue (yellow) compartment pair for a given BioGears system circuit. The vascular and interstitial colloid osmotic pressures (COP_v and COP_i) are determined by (2) and (3), while kp is a property of the tissue. R_pre and R_post are pre- and post-capillary vessel resistance, while C_ves and C_tis are tissue compliance for each compartment.
Biomedinformatics 01 00009 g001
Figure 2. The BioGears physiology burn model overview [24]. The state of inflammation in the patient cascades into other downstream models to simulate the correct patient physiological response. This model allows us to generate simulated data sets of patient physiology as a function of burn total body surface area and is a safe way to collect data to train a machine learning algorithm.
Biomedinformatics 01 00009 g002
Figure 3. The BioGears response to burns of 10% (blue), 20% (orange), 30% (green) and 40% (purple) TBSA. Hypotension due to blood volume decreases is a function of the destruction of the tissue integrity and associated albumin flux into the tissue. Burns over 30%, left untreated, result in the patient dying (green and purple simulations).
Biomedinformatics 01 00009 g003
Figure 4. The BioGears response to burns of 10% (blue), 20% (orange), 30% (green) and 40% (purple) TBSA. Heart rate spikes due to blood volume decreases and the associated nervous system response. Burns over 30%, left untreated, result in the patient dying (green and purple simulations).
Biomedinformatics 01 00009 g004
Figure 5. The BioGears response to burns of 10% (blue), 20% (orange), 30% (green) and 40% (purple) TBSA. Respiration rate spikes due the patient’s pain response and decreases in circulating oxygen in the blood. Burns over 30%, left untreated, result in the patient dying (green and purple simulations).
Biomedinformatics 01 00009 g005
Figure 6. TBSA patient states (color indicates TBSA) are clustered (marker indicates K-means cluster) then displayed over time. While each patient begins in the top left in the first hour, they follow their own trajectories after this, corresponding to three burn categories.
Biomedinformatics 01 00009 g006
Figure 7. (a) is the Euclidean distance of the standardized, scaled full 20,397 feature space. (b) is a UMAP embedding of the feature space reduced to 15 dimensions. Reducing dimensionality is a helpful method when measuring Euclidean distance and when working with smaller datasets.
Biomedinformatics 01 00009 g007
Figure 8. A confusion matrix that summarizes a 4-fold cross validation of 79 patient states when training a nearest neighbor classifier. The only incorrectly classified patient states were the first hours of 15 and 20% TBSA.
Biomedinformatics 01 00009 g008
Publisher’s Note: MDPI stays neutral with regard to jurisdictional claims in published maps and institutional affiliations.