1. Introduction
Diffuse Large B-cell Lymphoma (DLBCL) is one of the most frequent non-Hodgkin lymphomas (NHLs) in western countries. DLBCL accounts for an approximate 25% of NHLs and is characterized by being heterogeneous from a clinicopathological point of view, including histological morphological features, genetic changes and biological characteristics [
1,
2,
3]. Within the category of DLBCL there are several distinct subtypes that are separated, such as the T cell histiocyte rich large B cell lymphoma, the primary DLBCL of mediastinum, the intravascular lymphoma and the lymphomatoid granulomatosis [
2]. The prognosis of DLBCL is variable, and with current treatment the disease is curable in 50% of the cases [
2,
4]. As DLBCL is heterogeneous, it is necessary to identify biomarkers with prognostic value.
The prognosis of DLBCL correlates with the International Prognostic Index (IPI) score, which includes the factors of the age, the serum lactate dehydrogenase, Eastern Cooperative Oncology Group (ECOG) performance status, the clinical stage and the number of extranodal disease sites [
5,
6,
7,
8]. A variation of the original IPI that incorporates more detailed information about these used clinical variables is the National Comprehensive Cancer Network (NCCN)-IPI [
9]. In this research both IPIs will be used.
The molecular genetics has also managed to stratify the patients according to their prognosis. The gene expression profiling identified three groups according to the postulated cell-of-origin: the germinal center B-cell type (GCB), the activated B-cell type (ABC), and the unclassified. The Hans’ algorithm also identifies the GCB and the non-GCB (ABC) groups, but is based on a stepwise progression of 3 immunohistochemical markers of CD10, BCL6 and MUM1 (
IRF4) [
10]. Other prognostic markers are the cytogenetic abnormalities of the
MYC,
BCL2 and
BCL6 oncogenes [
11,
12,
13,
14,
15,
16,
17,
18,
19], M2-like tumor-associated macrophages (M2-like TAMs) [
20,
21] and RGS1 (among others) [
22].
In comparison to the GCB, the ABC subtype is characterized by a more aggressive clinical evolution and constitutive activation of the anti-apoptotic nuclear factor kappa B (NF-kB) pathway [
23,
24,
25,
26]. We have recently described the prognostic value of a negative mediator of apoptosis in DLBCL, the tumor necrosis factor alpha-induced protein 8 (
TNFAIP8) [
27,
28]. In this research, we had used artificial intelligence—the multilayer perceptron neural network—to analyze the gene expression of the DLBCL series of the Lymphoma/Leukemia Molecular Profiling Project (LLMPP) and to identify the genes that were associated with the overall survival of the patients. The
TNFAIP8 was identified within the top 20 most relevant genes of the LLMPP series. Then, we validated the importance of
TNFAIP8 by immunohistochemistry and by digital quantification using a machine-learning Weka-based segmentation method in a series of DLBCL from Tokai University Hospital, and we confirmed that high
TNFAIP8 was associated with a poor overall survival of the patients [
28].
TNFAIP8 acts as a negative mediator of apoptosis and may play a role in tumor progression.
TNFAIP8 suppresses the TNF-mediated apoptosis by inhibiting Caspase-8 activity but not the processing of procaspase-8, subsequently resulting in inhibition of BID cleavage and Caspase-3 activation [
29,
30,
31].
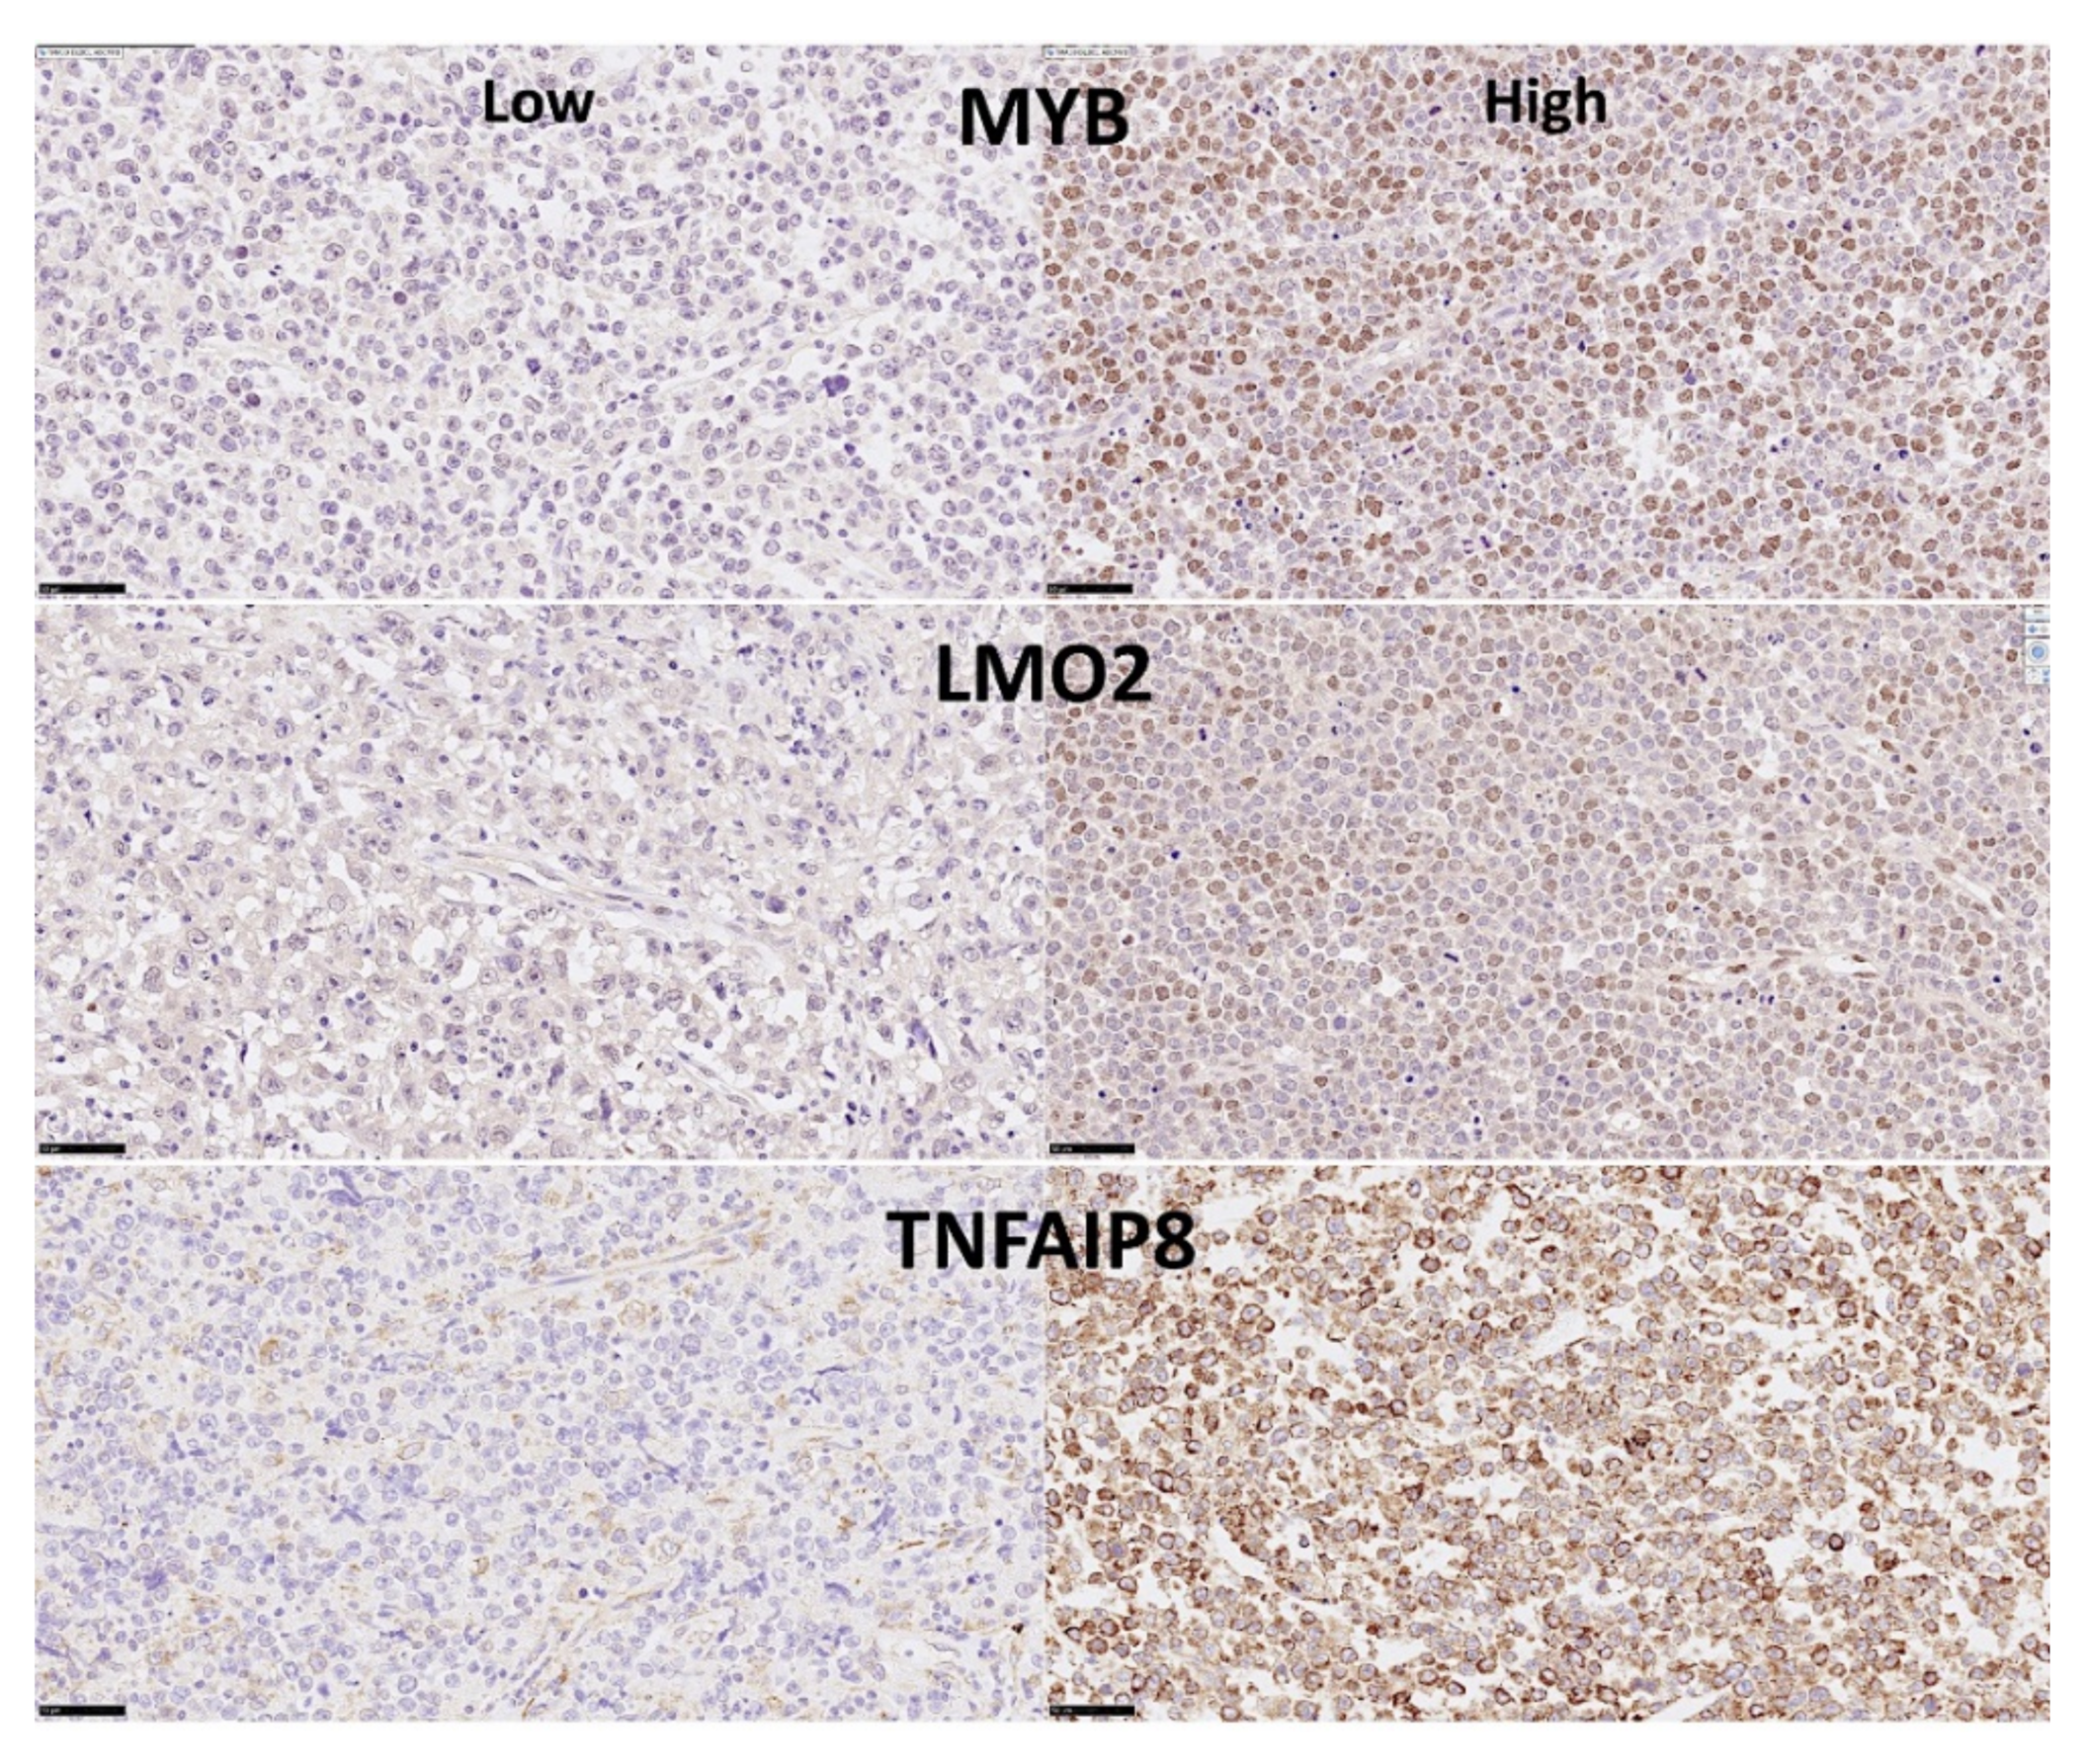
In our previous research, we quantified the protein expression of
TNFAIP8 in a series from Tokai University Hospital and we also correlated with two markers related to the proliferation cycle, the Ki67 and MYC. We found that through immunohistochemistry, the expression of TNFAIP8 was associated with a poor survival of the patients and also positively correlated with Ki67 and MYC in a moderate manner. Nevertheless, in our previous work we had the limitation of not knowing how in DLBCL the TNFAIP8 expression correlated with the apoptosis pathway (Caspase-8, Caspase-3, PARP), which is the main function of TNFAIP8. In
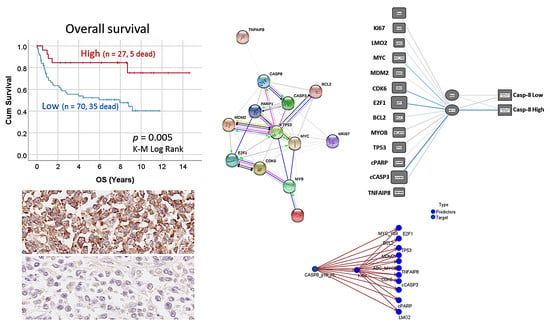
Figure 1 the protein–protein interactions of TNFAIP8 are shown. These interactions highlight the apoptosis (including Caspase-8), cell cycle and the p53 signaling pathways. In addition, in our previous research our correlations included only a linear analysis, and more complex nonlinear analyses (that may fit better in the biological processes) had not been performed. Statistics and machine learning differ in their aim: statistical models infer relationship between variables. Conversely, machine learning is designed to make the most accurate predictions.
The purpose of this research was to analyze the expression of Caspase-8 (CASP8) in DLBCL. A series of DLBCL from Tokai University was immunostained with Caspase-8 and the protein expression was quantified by digital image analysis, and other markers of the Caspase-8 pathway including BCL2, cCASP3, CDK6, E2F1, LMO2, MDM2, MKI67, MYB, MYC, cPARP and TP53 were analyzed as well. We performed statistics and machine learning analyses to investigate the correlations between them and with the clinicopathological characteristics of the samples. Then, we also used the multilayer perceptron neural network analysis to identify other genes related to CASP8 using the LLMPP dataset. We found that high expression of Caspase-8 was associated with a good prognosis of the patients.
3. Results
3.4. Predictive Modeling of Caspase-8 Protein Expression by the Rest of Caspase-8-Related Markers (Tokai Series)
Predictive analytics was performed to model the immunohistochemical expression of Caspase-8 as a dichotomic variable (high vs. low, using the same 8.7% cut-off) with all the other Caspase-8-related markers, which were used as quantitative variables.
Twelve different models were executed, including the algorithms of C5.0 node that builds a decision tree or a rule set, logistic regression, Bayesian Network, discriminant analysis, k-Nearest Neighbor (KNN), Support Vector Machine (SVM), Tree-AS decision tree, Chi-squared Automatic Interaction Detection (CHAID) decision tree, Classification and Regression (C&R) Tree and Neural Network.
Results of the analysis showed that 9 models predicted the Caspase-8 expression. When ranked according to overall accuracy, they were as follows: CHAID (92%, 4 variables), Bayesian Network (88%, 12 variables), SVM (87%, 12 variables), Discriminant (86%, 12 variables), C5 (85%, 2 variables), Logistic regression (83%, 12 variables), Neural network (80%, 12 variables), C&R Tree (72%, 12 variables), and KNN Algorithm (69%, 12 variables).
3.5. Gene Expression Analysis Based on CASP8 Expression in DLBCL (LLMPP Series)
The LLMPP DLBCL dataset that is comprised of 20,684 genes was used to identify in an unsupervised manner which genes are associated with the CASP8 expression. A multilayer perceptron analysis was performed, with CASP8 as dependent variable (quantitative data) and the rest of 20,863 as predictors (also as quantitative variables). As a result of the artificial neutral network, the genes were ranked according to their normalized importance for prediction of the CASP8 expression. The neural network moderately managed to predict the CASP8 expression. According to their normalized importance, the top most relevant genes were: MED29 (1st), PRH1, YIPF3, PLEKHH1, PRB4, IKZF1, CYSRT1, ACTC1, FAM160B1, TBC1D10C, TMEM176B, ADAMTS10, CTSV, CEP20, AZGP1, ZNF557, SDCCAG8, CSKMT, BGLAP and SRP54 (20th).
To understand the relationship between CASP8 expression and the top 20 genes, the expression of CASP8 was modeled using the top 20 genes. The analysis included the following model types: regression, generalized liner, linear-AS, LSVM, random trees, Tree-AS, linear, CHAID, C&R tree and neural network. The most relevant models were the following: CHAID (correlation 0.806), neural network (0.712), regression (0.668), generalized linear (0.668), linear (0.667) and C&R tree (0.647).
A visualization of the CHAID and neural network is shown in
Figure 11. The regression output was the following:
CASP8 =
MED29*0.1483 +
PRH1* − 0.1032 +
YIPF3* − 0.1555 +
PLEKHH1*0.1117 +
PRB4* − 0.001069 +
IKZF1*0.1014 +
CYSRT1*0.008583 +
ACTC1*0.04482 +
FAM160B1*0.2315 +
TBC1D10C*0.2088 +
TMEM176B*0.1449 +
ADAMTS10*0.1131 +
CTSV* − 0.0005433 +
CEP20*0.1234 +
AZGP1*0.06398 +
ZNF5571*0.08978 +
SDCCAG8* − 0.04932 +
CSKMT*0.05439 +
BGLAP*0.08571 +
SRP54*0.3457 − 6.131.
Further analysis was performed focusing on CASP8 as a dichotomic variable in the DLBCL GEO GSE10846. Using a ROC curve analysis, the best cut-off of CASP8 for the overall survival phenotype (dead/alive) was searched, and the value was 10.3805. Among the 414 cases of the series, CASP8 was high in 180 (48.3%) and low in 234 (69.2%). We confirmed the association of most of the previously identified 20 top genes of the neural network analysis with a high CASP8 expression. The Gene Set Enrichment Analysis (GSEA) is a biostatistical method that confirms if a defined set of genes correlates between two biological states (e.g., phenotypes). We used GSEA to correlate the phenotype CASP8 high vs. low with several set of genes (pathways). The whole collection of the MSigDB gene sets were used (23,677 genes sets in total, MSigDB database v7.3 updated March 2021), which include 9 major collections: H (hallmark genes), C1 (positional), C2 (curated), C3 (regulatory target), C4 (computational), C5 (ontology), C6 (oncogenic signature), C7 (immunologic signature), and C8 (cell type signature). From the 23,677 tested genes sets, 843 gene sets were significantly enriched at nominal p value < 5%, either towards high or low CASP8. For example, significantly enriched pathways of the oncogenic signature that associated to high CASP8 were ALK, KRAS, PGF, P53 and CYCLIND1. Other correlations included sets of the immunologic signature such as macrophages (Genes up-regulated in bone marrow-derived macrophages treated with IL4, GSE25088). The complete results are available on request from the corresponding author (Carreras J).
4. Discussion
This research focused on the analysis of Caspase-8 in DLBCL from Tokai University Hospital. The protein expression of Caspase-8 was evaluated by immunohistochemistry, followed by marker quantification by digital image analysis. We found that high Caspase-8 protein expression was associated with a favorable prognosis of the patients, including a favorable overall and progression-free survival.
Apoptosis is a term to designate programmed cell death. The mechanism of cell death has multiple roles, including a function in the pathogenesis, homeostasis, and control of several types of infection, as well as in cancer [
41]. Excessive cell damage results in passive necrosis. On the other hand, the mechanism of cell death can be triggered by several molecular programs including cellular stress, oncogenic changes that involve tumor suppressor genes and oncogenes, several pathogens, and other immune mechanisms. Apoptosis is one of the most known and studied types of programmed cell death [
41]; other types of programmed cell death are necroptosis, pyroptosis, ferroptosis, mitotic catastrophy and autophagic cell death, among others [
41]. The pathway of apoptosis includes an extrinsic (controlled death receptors of the TNFR superfamily) and an intrinsic (mitochondrial) pathway. Interestingly, ligation of these death receptors induces both activation of extrinsic apoptosis and necroptosis, and the balance between these two pathways determines whether the cell lives. Caspase-8 has a role in initiating of extrinsic apoptosis and inhibiting necroptosis [
41]. Caspase-8 activates Caspase-3 by proteolytic cleavage, and then Caspase-3 cleaves other vital cellular proteins or other caspases, which result in activation of cPARP, which eventually leads to apoptosis [
42,
43,
44].
In DLBCL, the mechanisms of cell survival are dysregulated [
45]. Dysregulation of an inhibitor of apoptosis proteins (IAPs) has been described in DLBCL [
45]. For example, overexpression of XIAP (an apoptosis inhibitor) was associated with a worse outcome in DLBCL [
46]. Another inhibitor, the Survivin, was also found overexpressed in DLBCL [
47] and in ABC molecular type DLBCL the overexpression was also associated to a poor prognosis [
47]. Besides, we recently described that high expression of another apoptosis inhibitor (TNFAIP8) was associated with a poor prognosis of DLBCL [
40]. In this project the protein expression of Caspase-8 was analyzed in a series of Tokai University’s, and we found that high expression was associated with a favorable survival of the patients. Therefore, while anti-apoptosis seems to be associated to a poor prognosis of DLBCL, the pro-apoptosis Caspase-8 associates to a favorable outcome of the patients.
In DLBCL there is also dysregulation of TP53 [
45], which includes not only mutations or deletions of TP53, but also alterations of TP53 pathways-related markers of BCL6, MDM2, CDKN2A, etc. In this research some of these markers were analyzed by immunohistochemistry in the Tokai series, and the relationship between them as well as with Caspase-8 was explored as shown in
Figure 1. In addition, using several modeling analyses, we showed how these markers correlated with the Caspase-8 expression, either as positive or negative correlation, so a pathogenic model can be postulated. For example, the Caspase-8 expression could be calculated as 0.2*MYC + −0.2*MDM2 + 0.9*E2F1 + 0.1*BCL2 + −0.3*TP53 + −1.7*cPARP + 3.1*cCASP3 − 2.697.
This research focused on the analysis of Caspase-8 in a series of Tokai University’s and we found that high protein expression of Caspase-8 correlated with a favorable outcome of the patients, both the overall survival and the progression-free survival. As shown in the
Figure 6, the 30% of the patients with high Caspase-8 expression had a favorable overall survival. At the 10-years’ time, around 80% of the patients with high Caspase-8 expression were still alive. Conversely, at that time only 40% were alive in the low expression group. This finding was important and to the best of our knowledge, to date, this association has not been reported in DLBCL. Nevertheless, the Caspase-8 did not correlate with the conventional clinicopathological variables that are usually associated with the prognosis of DLBCL such as the cell-of-origin molecular classifications (Hans’ algorithm) and the International Prognostic Index (IPI) that integrates the clinical variables of age, performance status, LDH, extranodal sites and stage. Therefore, a functional network association analysis was performed, markers associated to Caspase-8 were identified (
Figure 1), and finally several types of predictive modeling were tested.
Predictive analytics was performed to model the immunohistochemical expression of Caspase-8 as a dichotomic variable (high vs. low, using the same 8.7% cut-off for the overall survival analysis) with the other Caspase-8-related markers, which were used as quantitative variables.
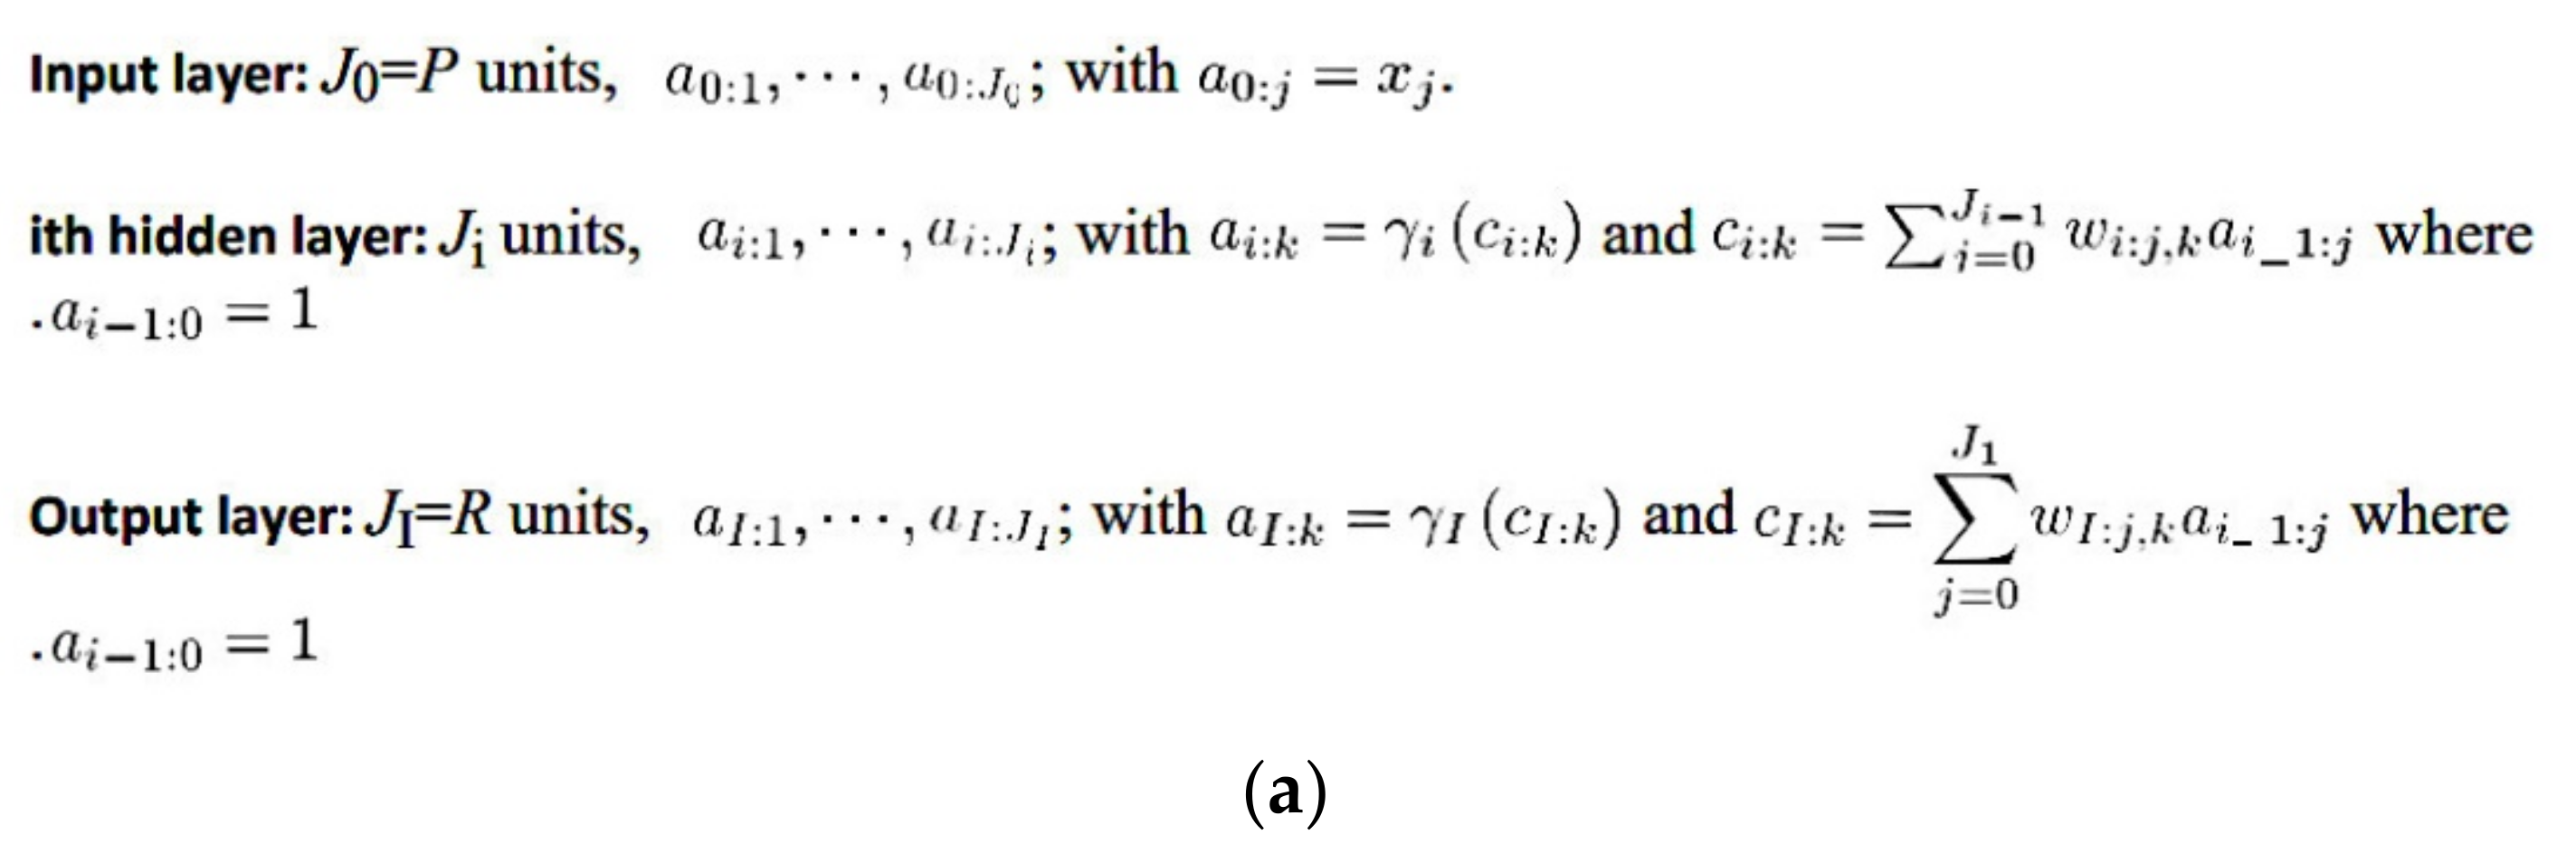
Twelve different models were executed, including the algorithms of C5.0 node that builds a decision tree or a rule set, logistic regression, Bayesian Network, discriminant analysis, k-Nearest Neighbor (KNN), Support Vector Machine (SVM), Tree-AS decision tree, Chi-squared Automatic Interaction Detection (CHAID) decision tree, Classification and Regression (C&R) Tree and Neural Network. All these models of data mining are tools that enable to develop predictive models using the research experimental data. This data mining process allowed better results and data interpretation, and integrated methods of machine learning, artificial intelligence, and statistics. Of note, each method had certain strengths and was best suited for particular types of problems. Among the 12 different models that were executed, 9 models predicted the Caspase-8 protein expression as a dichotomic variable (high vs. low). When ranked according to their overall accuracy for Caspase-8 prediction, the results were as follows: CHAID tree (92%, 4 variables), Bayesian Network (88%, 12 variables), C5 tree (85%, 2 variables), Logistic regression (83%, 12 variables) and Neural network (80%, 12 variables). The results of all these types of analysis were compatible between them, and each model provided insights into the relationship between Caspase-8 and the rest of the markers. Nevertheless, as previously stated, each method had strengths and weaknesses. For example, the decision trees had an overall accuracy that ranged from 92% for the CHAID tree to 85% of the C5 tree. This means that prediction of Caspase-8 was successful, although variable. Nevertheless, in these models not all the markers were used in the final model, so the relevance of some of the markers cannot be properly assessed. The Bayesian Network built a probabilistic model and made use of all the markers. Bayesian Networks are very robust where information is missing and make the best possible prediction using whatever information is present. Causal relationships between nodes may be represented but the links in the network (i.e., arcs) do not necessarily represent direct cause and effect. The logistic regression (i.e., nominal regression) classifies records based on values of input fields. It is comparable to the linear regression, but the target variable is categorical instead of numeric. This method had the strength of allowing us to know which were the most relevant markers for the prediction of Caspase-8, with information of the direction of the association (increase or decrease) and the strength of that association. Neural networks are simple models of the way the nervous system operates. The basic units are neurons, which are typically organized into layers. There are three parts in a neural network: the input, the hidden and the output layers. The network learns thorough training. Since the output is known, as the training progresses the network becomes increasingly accurate in replicating the known outcomes. Since the deep neural networks have a multilayer non-linear structure (i.e., black box model), neural networks are criticized to be non-transparent because their predictions are not traceable by humans. In our analysis we could rank the markers according to their normalized importance for Caspase-8 prediction, but the reason for this association was elusive because the synaptic weights are only sort of meaningful. In summary, we used a series of algorithms to create classification models. Each model used the values of the input fields (our markers) to predict the value of one output or target field (Caspase-8 as a dichotomic variable, high vs. low), and the integration of all the information made the results more understandable (explainable). As shown in
Table 10, the most relevant markers associated with Caspase-8 were the following: cCASP3, E2F1, TP53, cPARP, MDM2, BCL2 and TNFAIP8. Caspase 3, PARP, BCL2 are known markers closely related to apoptosis. Therefore, it makes sense that they were highly associated with Caspase-8. Nevertheless, some of the markers are also associated with other pathways. MDM2 is a ligase that inhibits the p53 and p73-mediated cell cycle arrest and apoptosis [
31]. The p53 protein is a tumor suppressor that also controls the cell cycle and induces apoptosis. MYC proto-oncogene is a transcription factor that activates the transcription of growth-related genes and promotes angiogenesis. Ki67 has a role in chromatin organization and it is a widely used marker of cell proliferation. E2F1 is also involved in the cell cycle. CDK6 is a kinase that also controls the G1/S cell cycle transition and the cell differentiation [
31]. MYB also controls the cell cycle and cell differentiation. LMO2 is a nuclear marker of normal B lymphocytes of the germinal centers, and DLBCL is supposed to be developed from these lymphocytes. Finally, TNFAIP8 is a negative regulator of apoptosis and plays a role in tumor progression [
31]. In summary, the most relevant markers that we have highlighted belonged to the apoptosis and the control of cell cycle.
Finally, the Capase-8 gene expression as a quantitative variable was also analyzed in an independent series of DLBCL of the LLMPP, as the relationship with other genes could also be successfully explored. The most relevant gene was MED29, a component of the Mediator complex that is involved in the regulation of transcription [
31]. MED29 has been related to prostate cancer [
48].
Future research directions should include analyzing the same markers in larger series of DLBCL to validate our findings. In addition, in-vitro or in-vivo analyses may also help to clarify the pathological function of Caspase-8 in DLBCL.


 ,
, 


