1. Introduction
Electricity powers every aspect of modern life, from lighting homes and operating machinery to enabling communication, medical advancements, and research [
1]. As we advance into the digital age, understanding its pivotal role is essential for shaping a sustainable, technologically driven future. Beyond daily necessities like communication, healthcare, and education, electricity also drives commercial operations and supports tourism, especially in remote areas. Reliable electricity is vital for economic growth in these sectors.
Electricity production depends on a variety of sources, and each source has environmental impacts [
2]. Traditionally, fossil fuels like coal, oil, and natural gas, along with hydropower, have been used due to their abundant availability and high energy output. Hydropower, while being a relatively cleaner energy source, comes with its challenges. It is expensive to develop and requires extensive public consultation and community engagement to ensure its feasibility and acceptance; Fossil fuel sources, on the other hand, have negative environmental impacts [
3], releasing substantial amounts of greenhouse gases and contributing heavily to climate change and environmental degradation. Nuclear power is a low-emission alternative but raises safety concerns [
4] and challenges related to nuclear waste management [
5]. As the awareness of greenhouse gas emissions and environmental damage grows, the push for cleaner and more sustainable alternatives, such as renewable energy sources, becomes increasingly imperative for a greener and healthier planet.
Recently, the focus has shifted toward renewable energy sources such as wind power, solar power, geothermal energy, and biomass for a greener future [
6]. Among these, solar power stands out as the fastest-growing renewable source globally [
7], offering a scalable solution that enables decentralized energy production. This approach reduces transmission losses and interruptions while enhancing grid resilience [
8,
9]. Thus, with its unique advantages, solar power emerges as a promising solution to promote sustainable energy practices, encouraging environmental stewardship and paving the way for a cleaner, decentralized, and resilient energy landscape.
Solar energy holds immense potential for generating electricity. Solar panels harness the abundant sunlight [
10], converting it into clean electricity without emitting any harmful pollutants or greenhouse gases. This renewable energy empowers individuals and communities to participate in electricity generation, fostering energy independence and reducing carbon footprints [
11].
There are two primary methods for harnessing solar energy: solar rooftop panels and solar parks. Solar rooftop panels are installed on commercial, industrial, or residential buildings, allowing localized electricity production [
12]. This localized generation not only reduces transmission losses but also empowers property owners to become active contributors to the energy grid, fostering energy self-sufficiency and potentially lowering electricity bills. Additionally, solar rooftop installations utilize existing infrastructure, optimizing land use and minimizing the environmental impact.
In contrast, solar parks are large-scale installations dedicated solely to solar energy generation [
13]. Solar parks can take advantage of economies of scale, making them cost-effective for utilities and energy providers. However, they may require significant land availability and might encounter challenges in land acquisition and public acceptance. While both solar rooftop panels and solar parks contribute to the growth of renewable energy, solar rooftop installations stand out for their distributed and accessible nature, making them an appealing option to drive sustainable electricity generation while leveraging existing urban spaces.
Having a solar system does not guarantee zero electricity bills [
14], as various factors can contribute to unexpectedly high costs. For example, during winter, increased consumption from electric heating and hot water systems can impact overall usage. On average, solar can reduce bills by 40% to 70%, depending on self-consumption and usage patterns.
To maximize benefits, it is crucial to ensure proper installation and sizing of the solar system [
15]. Moreover, diagnosing solar system issues requires monitoring and understanding of real-world performance. Factors like solar panel orientation, tilt, and shading greatly affect solar output [
16]. While the ideal orientation is South-facing in the Northern hemisphere [
17], practical constraints might lead to East and West-facing panels. Partial shading can impact system performance, and it is essential to detect and address any shading issues.
During energy crises, developing countries face many difficulties, ranging from power shortages to complex power distribution issues. The geographical obstacles, such as landslides and harsh weather, hinder the establishment of reliable electricity infrastructure. Also, domestic insurgents and acts of terrorism further disrupt power generation and distribution. As demand surges due to population growth and industrial development, the need for electricity increases, whereas the cost of installing or expanding plants continues to escalate. This confluence of factors places immense pressure on developing countries, underscoring the urgent need for sustainable and diversified energy solutions to alleviate the burden and foster economic growth and environmental preservation.
Globally, electricity demand is increasing rapidly alongside population growth. Dense populations in clusters of buildings require powerful and continuous electricity transmission lines that can provide electricity regularly [
18]. There is a growing body of literature that recognizes the importance of solar panels in generating electricity [
19]. Solar panel installation is the globally adopted activity for utilizing renewable energy for electricity production. Countries like Australia, China, Germany, Japan, Spain, and Italy are promoting rooftop solar panel installations to harness renewable sources from the sun [
14].
Countries like Pakistan are particularly challenged in meeting this growing energy demand while striving to reduce carbon emissions [
20]. The deployment of PV systems is therefore vital for Pakistan to reach its ambitious goal of generating 30% of electricity from renewable sources by 2030 [
21]. Currently, non-hydro renewable resources (wind, solar, biogases) account for only approximately 4.8% of Pakistan’s electricity generation [
22], necessitating a significant acceleration in solar deployment to meet climate goals. Recent reports confirm a rapid solar boom driven by high tariffs and frequent outages, but a robust, localized planning framework remains underdeveloped. To date, most energy planning for solar in Pakistan has occurred at the national or regional scale, relying on generalized isolation data. A significant research gap persists in bridging this macro-level planning with granular, building-level technical assessments. Localized studies are necessary to provide accurate, actionable data for municipal planning and targeted investment.
In the tourism-rich districts of Khyber Pakhtunkhwa, the need for sustainable, decentralized energy solutions is even more pressing, given the frequent geographical barriers and security challenges that hinder conventional electricity transmission. The present research addresses this gap by providing a high-resolution, building-level assessment of solar PV potential across KPK’s tourism districts. Specifically, this study has two specific objectives: (1) to estimate solar radiation potential using the Area Solar Radiation tool with a building-level focus, and (2) to identify and prioritize the union councils (the smallest administrative unit of local government) within KPK that are best suited for large-scale solar PV deployment. This research provides a starting point for understanding solar potential at the smallest administrative levels (Union Council), a pre-investment framework that complements, rather than duplicates, existing high-resolution rooftop PV studies. This is not intended to accurately calculate solar potential at the individual building level; rather, it introduces UC level prioritization framework, translating technical solar potential estimates into actionable planning units aligned with Pakistan’s administrative and governance structure.
3. Results
Table 1 summarizes the distribution of 1,290,654 building footprints in relation to the potential electric units generated by solar panels across various building area categories. The data is organized into five ranges of the electric units in kWh and five building area categories that are expressed in marlas. Each category of building area is reported by the number of footprints and their corresponding percentage of the row total, providing a view of how building size correlates with solar energy generation potential.
The data shows a significant concentration of smaller buildings (1–5 marlas), comprising 66.4% of the total, with mid-sized buildings (6–10 marlas) at 19.1% and larger buildings (11–15 marlas and above) contributing smaller fractions (6.9% for 11–15 marlas, 3.1% for 16–20 marlas, and 4.6% for >21 marlas).
In the case of potential electric units generated by solar panels, 38% of the total buildings have a potential of less than 500 units.
In the lowest per marla unit value category (<500), most of the buildings (99.9% out of category total: 490,744) are small, falling in the 1–5 marla range.
Table 1 provides an in-depth look at the potential electric output from solar panels across various building areas in Marlas, revealing key patterns in energy generation across size categories. Smaller buildings, particularly those within the 1–5 marla range, overwhelmingly produce less than 500 kWh/year, accounting for 99.9% of such units, while larger buildings (21 marlas or more) contribute more prominently to higher energy brackets. A significant number of buildings in the 6–10 marla range yield between 500 and 749 kWh/year, indicating a high energy potential among medium-sized structures. Notably, buildings larger than 15 marlas display the highest efficiency in energy production, with most generating over 1250 kWh/year. This pattern underscores that larger building areas are crucial for maximizing solar potential and suggests they should be prioritized in solar energy strategies for optimal output. This table, therefore, not only quantifies energy distribution but also highlights the critical correlation between building size and energy potential, offering insights for targeted solar initiatives.
Table 2 presents the distribution of solar energy potential across districts by categorizing buildings based on their yearly electric unit generation. Districts like Swabi and Mansehra show the highest counts of buildings with the potential for solar power generation, particularly with a significant number in the <500 kWh category. Swabi leads with 121,722 buildings producing less than 500 units, which accounts for 45.8% of this energy bracket, indicating a high concentration of lower-output solar units. Conversely, districts like Torghar and Batagram have fewer buildings overall, with a marked proportion generating less than 500 units, suggesting a more limited solar power base.
Importantly, this table reveals that while certain districts like Swabi dominate in quantity for low-range units, larger solar capacity (over 1250 kWh) is spread more evenly, with districts such as Swat and Abbottabad showing strong potential for generating higher energy levels. These findings emphasize both the variation in solar power potential across regions and the opportunity to target specific districts for efficient solar scaling, especially in those with higher energy outputs. This information provides a foundation for making strategic decisions on solar panel deployment to maximize renewable energy yield across districts.
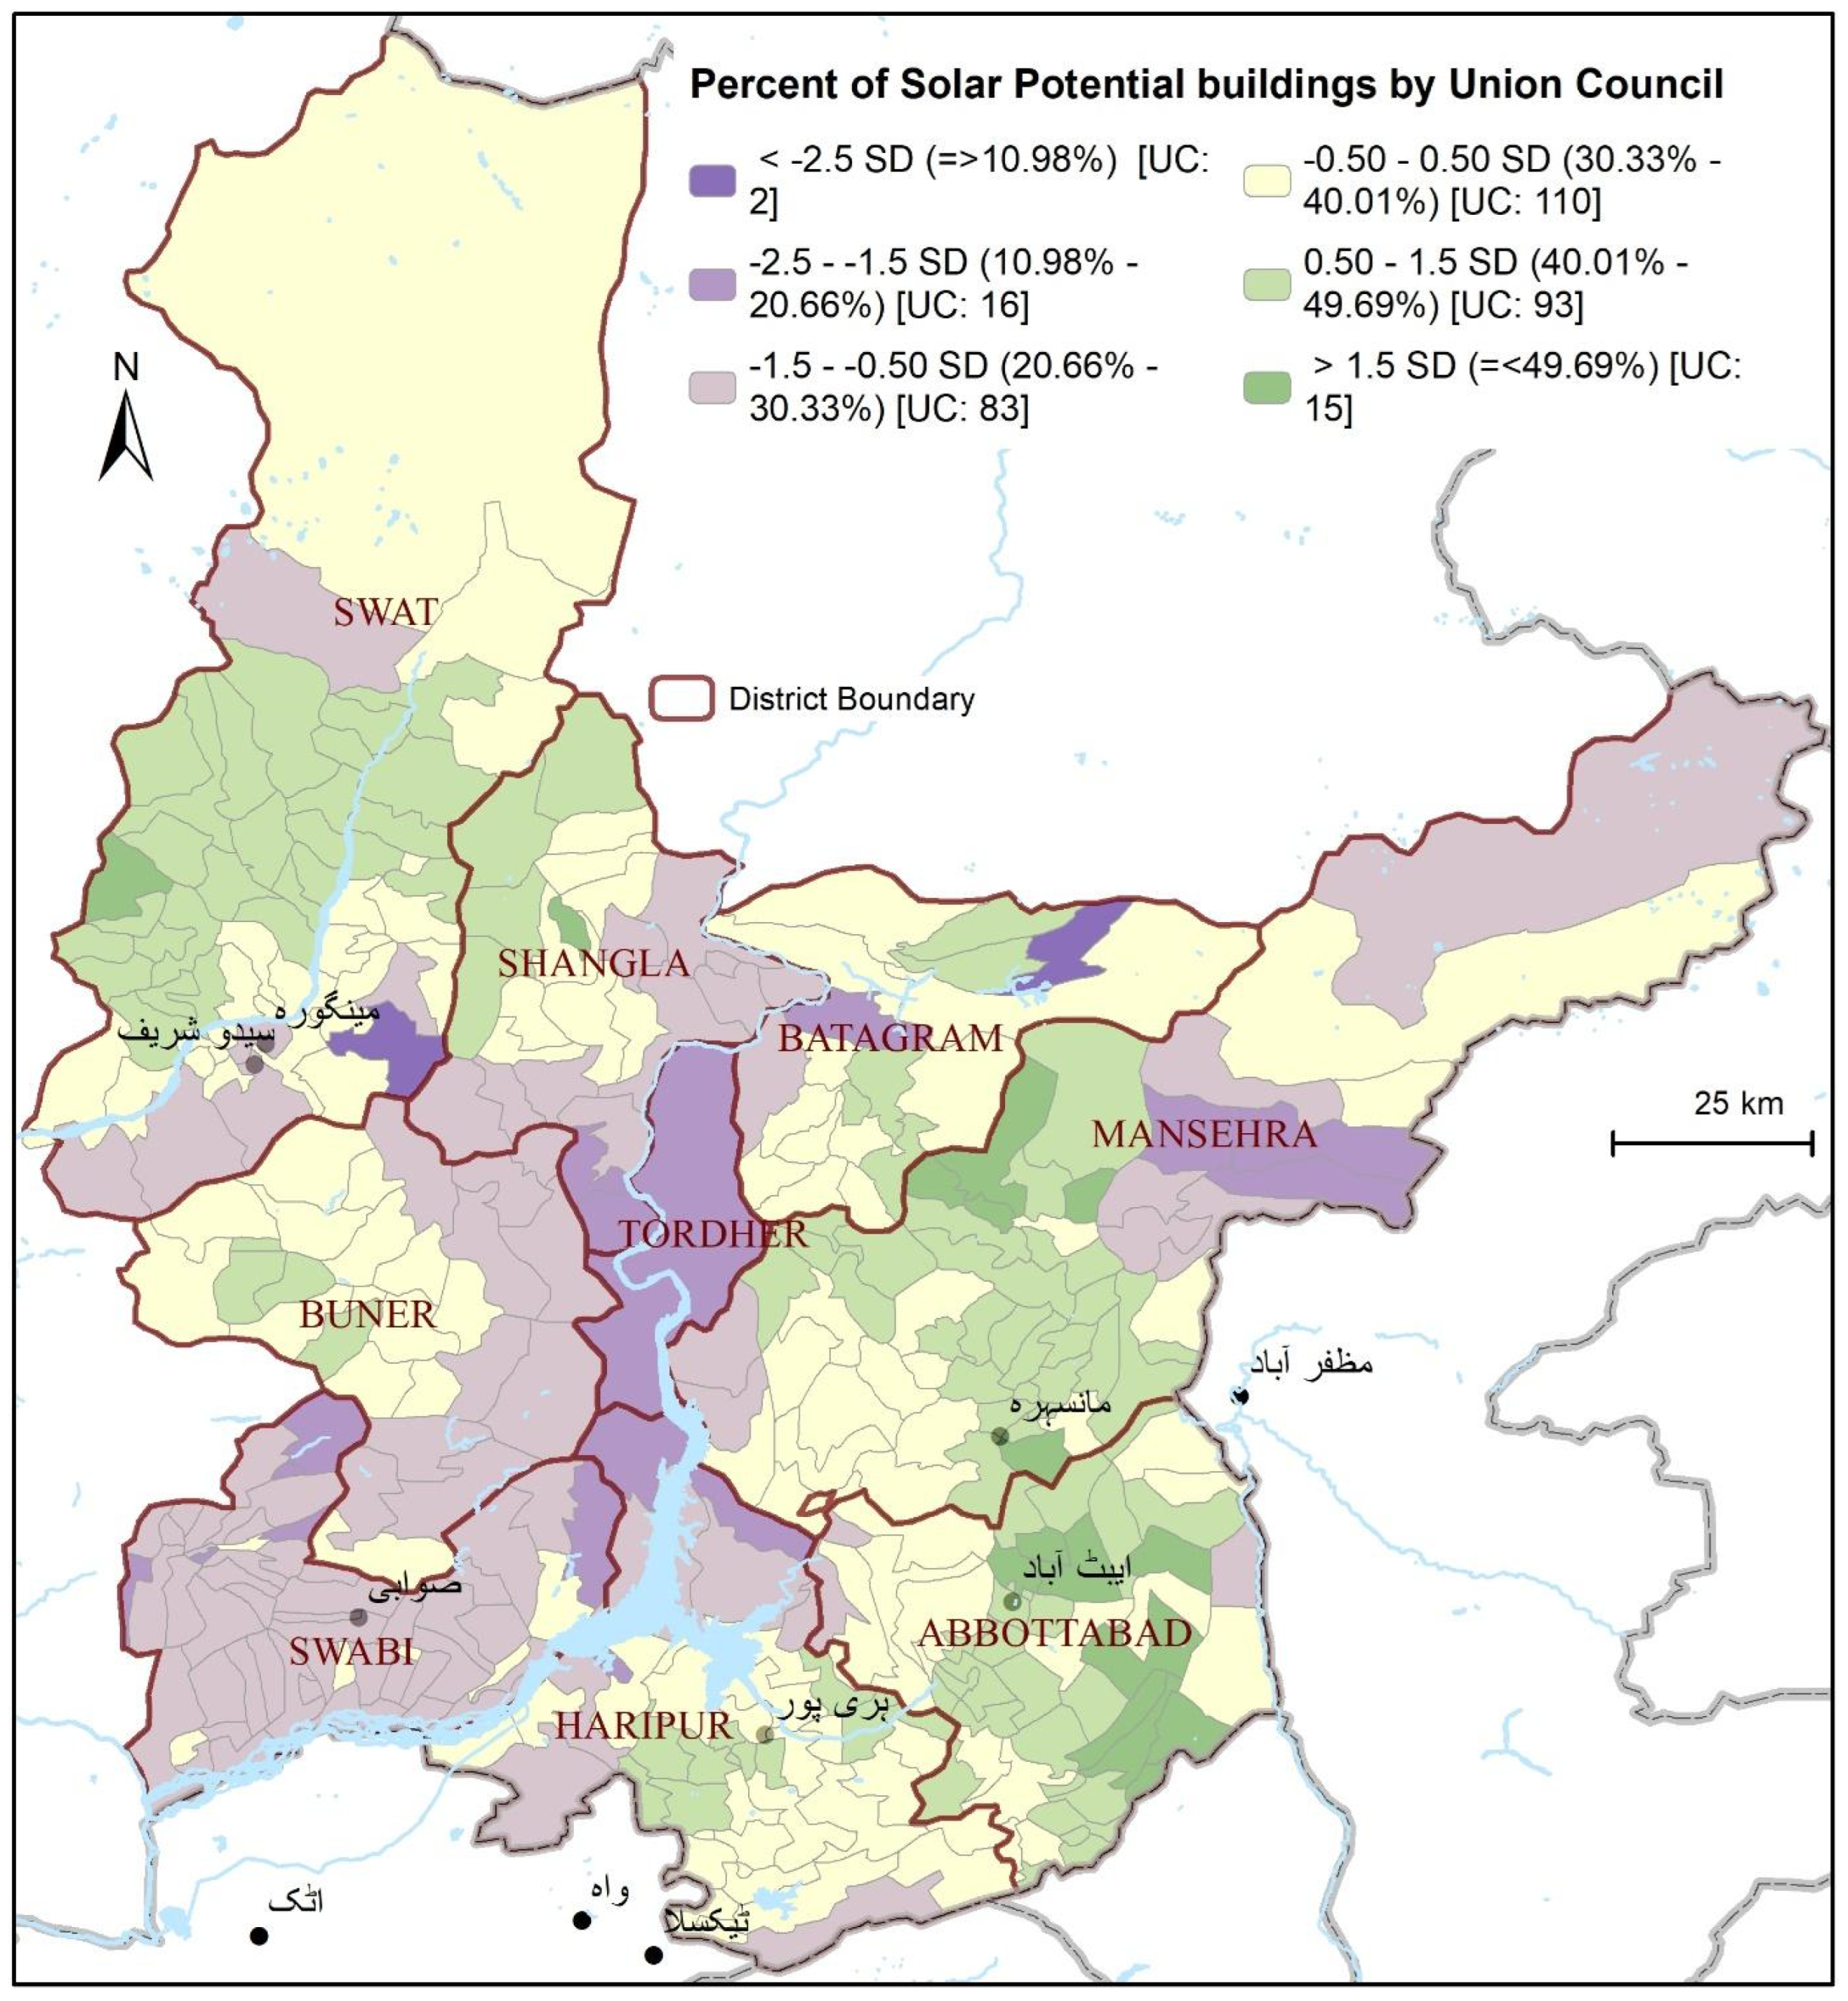
Figure 2 illustrates the distribution of suitable buildings for solar panel installation within various union councils in the study area. This map categorizes the union councils into six distinct shades, ranging from less than 10.98% to greater than 49.69%, based on the percentage of buildings conducive to solar panel installation. A bivariate (diverging) color ramp is applied to aid interpretation: the first three classes (below the mean −0.5 SD) are shown in a shade of purple, the fourth class (within ±0.5 SD of the mean) is displayed in a neutral light yellow, and the last two classes (above the mean +0.5 SD) is represented in shades of green. For each class, the percentage of suitable buildings is provided in parentheses, along with the number of union councils falling into that category.
Specifically, Class 1 (below mean −2.5 SD) includes 2 union councils with less than 10.98% of buildings suitable. Class 2 (−0.5 SD to −1.5 SD) encompasses 16 union councils with 11–20.66% of buildings suitable, while Class 3 (−1.5 SD to 0.5 SD) covers 83 union councils with 21–30.33% of buildings suitable. Class 4, representing values within ±0.5 SD of the mean, contains 110 union councils with 30–40.01% of buildings suitable. Class 5 (mean +0.5 SD to +1.5 SD) includes 93 union councils with 41–49.69% of buildings suitable, and Class 6 (above mean +1.5 SD) comprises 15 union councils where 49.69% or more buildings are suitable. This classification and color scheme clearly highlight the spatial gradient in solar potential: most union councils exhibit moderate suitability (Class 3–4), while smaller numbers show very low (Class 1–2) or very high rooftop solar potential (Class 5–6). The use of diverging colors allows readers to quickly identify areas with below-average, near-average, and above-average solar potential.
Beyond the statistical distribution,
Figure 2 reveals distinct geographic clusters of solar potential across the study area. High-suitability zones (Classes 5 and 6) are predominantly concentrated in the southeastern districts of Abbottabad and Mansehra, where urban density and favourable topographic orientations create significant hotspots for rooftop PV. Conversely, a low-potential corridor (Classes 1 and 2) is visible through the central and southwestern regions, particularly in Tordher, Swabi and parts of Batagram, likely due to more rugged terrain or variations in building footprints. In the northern districts like Swat and Shangla, the potential is more fragmented, with high-suitability pockets appearing primarily within valley settlements. This spatial gradient underscores that while the region is mountainous, localized clusters of high-density, suitable rooftops offer ‘low-hanging fruit’ for targeted renewable energy policies.
Table 3 summarizes the statistical analysis of solar potential, electricity consumption, per marla electricity units, and building area derived from the dataset. The dataset comprises 1,289,140 observations.
4. Discussion
Our primary objective was to estimate solar radiation potential within the study area, which we successfully achieved through the utilization of the Area Solar Radiation tool. This analysis provided a comprehensive understanding of solar energy availability across various regions, forming a crucial foundation for informed decision-making regarding renewable energy initiatives. Secondly, we aimed to identify priority areas, specifically union councils, where the deployment of solar PV systems could be most advantageous. Through the meticulous evaluation of standard deviation values and the percentage of suitable buildings for solar panel installation, we have not only identified these priority areas but have also categorized them based on their suitability, ensuring that our research objectives have been effectively met.
Our results are consistent with the established solar ranges from global and regional datasets, including the World Bank Global Solar Atlas [
31,
32,
33]. These sources report average Global Horizontal Irradiance (GHI) values of approximately 1640–2000 kWh/m
2/year for Northern Pakistan. The mean solar radiation obtained in our study (~1700–1900 kWh/m
2/year) falls within this range, with differences generally within ±10–15%, consistent with regional-scale solar assessments. Published studies indicate that Pakistan lies within a high solar insolation belt (~1600–2100 kWh/m
2/year), with site-specific estimates (e.g., Multan, ~30° N) around 1860 kWh/m
2/year [
31,
35]. Comparable magnitudes are also reported in PVGIS-based studies in Khyber Pakhtunkhwa [
34]. Furthermore, spatial patterns follow expected terrain effects, such as reduced solar potential in valleys and higher values in elevated, unobstructed areas [
30], supporting the logical consistency of the results.
The key findings of this research show the significance of geospatial analysis in identifying the solar potential to identify the buildings suitable for solar panel installations. We discovered that approximately one-third (35%) of the total buildings within the study area are preferable and capable of generating suitable electricity through solar panels. This highlights the crucial importance of conducting thorough research to identify eligible buildings, as not all structures are suitable for solar panel installation. The potential benefits of solar energy might seem appealing to residents; our assessments revealed the need for comprehensive geospatial research to ensure the feasibility and success of solar panel deployments, especially in mountainous regions. Rushing into installation without proper analysis can result in substantial financial losses. These findings serve as a valuable reminder of the complexities involved in harnessing solar energy effectively and sustainably.
The size of buildings plays a pivotal role in the context of solar panel installations, underlining the importance of comprehensive research and assessment, especially when considering the different classes of society: lower class, middle class, and upper class. In the absence of specific socioeconomic data, our study categorizes buildings based on size, offering a practical approach. Buildings ranging from 1 to 5 marlas are categorized as lower class, those between 6 and 15 marlas as middle class, and structures exceeding 15 marlas as upper class. The different thresholds (marlas, or power generation (i.e., 750 kWh) could be adopted depending on policy goals, economic assumptions, or future integration of detailed PV system parameters.
Our findings reveal that out of a total of 857,432 lower-class buildings, 150,484 are suitable for solar panel installation. Similarly, within the middle-class category of 334,894 buildings, 220,354 are identified as suitable for panel installation, while among the upper-class buildings totaling 98,328, a significant 85,014 are found suitable for panel installation.
If we assess affordability based on building size, for lower-class individuals, approximately 17% of their buildings are suitable for solar panel installation, emphasizing the need for careful consideration and research to prevent financial losses in this segment. In contrast, around 65% of middle-class buildings are suitable, indicating a more favourable situation. Remarkably, the upper class stands out with approximately 86% of their buildings being suitable for solar panel installation, presenting an opportunity for them to harness solar energy effectively.
This disparity highlights a significant societal divide in terms of solar energy access based on building size and class. It is upon policymakers and government authorities to address these disparities. For the lower class, where suitable buildings are fewer, any initiatives to promote solar panel adoption should be accompanied by research to safeguard against financial setbacks. Meanwhile, the middle and upper classes, with a higher proportion of suitable buildings, present a substantial opportunity for promoting sustainable solar energy adoption.
This research aligns prominently with Sustainable Development Goal 7 (SDG 7), which is “Affordable and Clean Energy.” This goal urges the need to ensure access to affordable, reliable, sustainable, and modern energy for all. SDG 7 seeks to tackle energy-related challenges, including increasing the share of renewable energy in the global energy mix. This research addresses this challenge by assessing and prioritizing areas for the deployment of solar PV systems. By identifying buildings that are suitable for solar panel installation, it facilitates the transition towards cleaner and more sustainable energy sources.
Energy affordability is a key aspect of SDG 7. By categorizing buildings based on size and socioeconomic status, this study highlights the disparities in solar panel suitability and affordability across different segments of society. This information is crucial for policymakers and governments to formulate targeted strategies that ensure equitable access to clean energy benefits, aligning with SDG 7’s aim of providing universal access to affordable, reliable, and modern energy services.
The results obtained at the Union Council level through the research hold immense potential for targeted campaigns and initiatives. By identifying areas with a high percentage of suitable buildings for solar panel installation, the data can be used to launch awareness and adoption campaigns. These campaigns can specifically target regions where solar energy adoption is most viable, maximizing their impact and ensuring that communities in these areas are well-informed about the benefits of solar power. Moreover, such data-driven campaigns can also encourage local governments and organizations to allocate resources effectively, ultimately accelerating the transition towards clean and sustainable energy solutions.
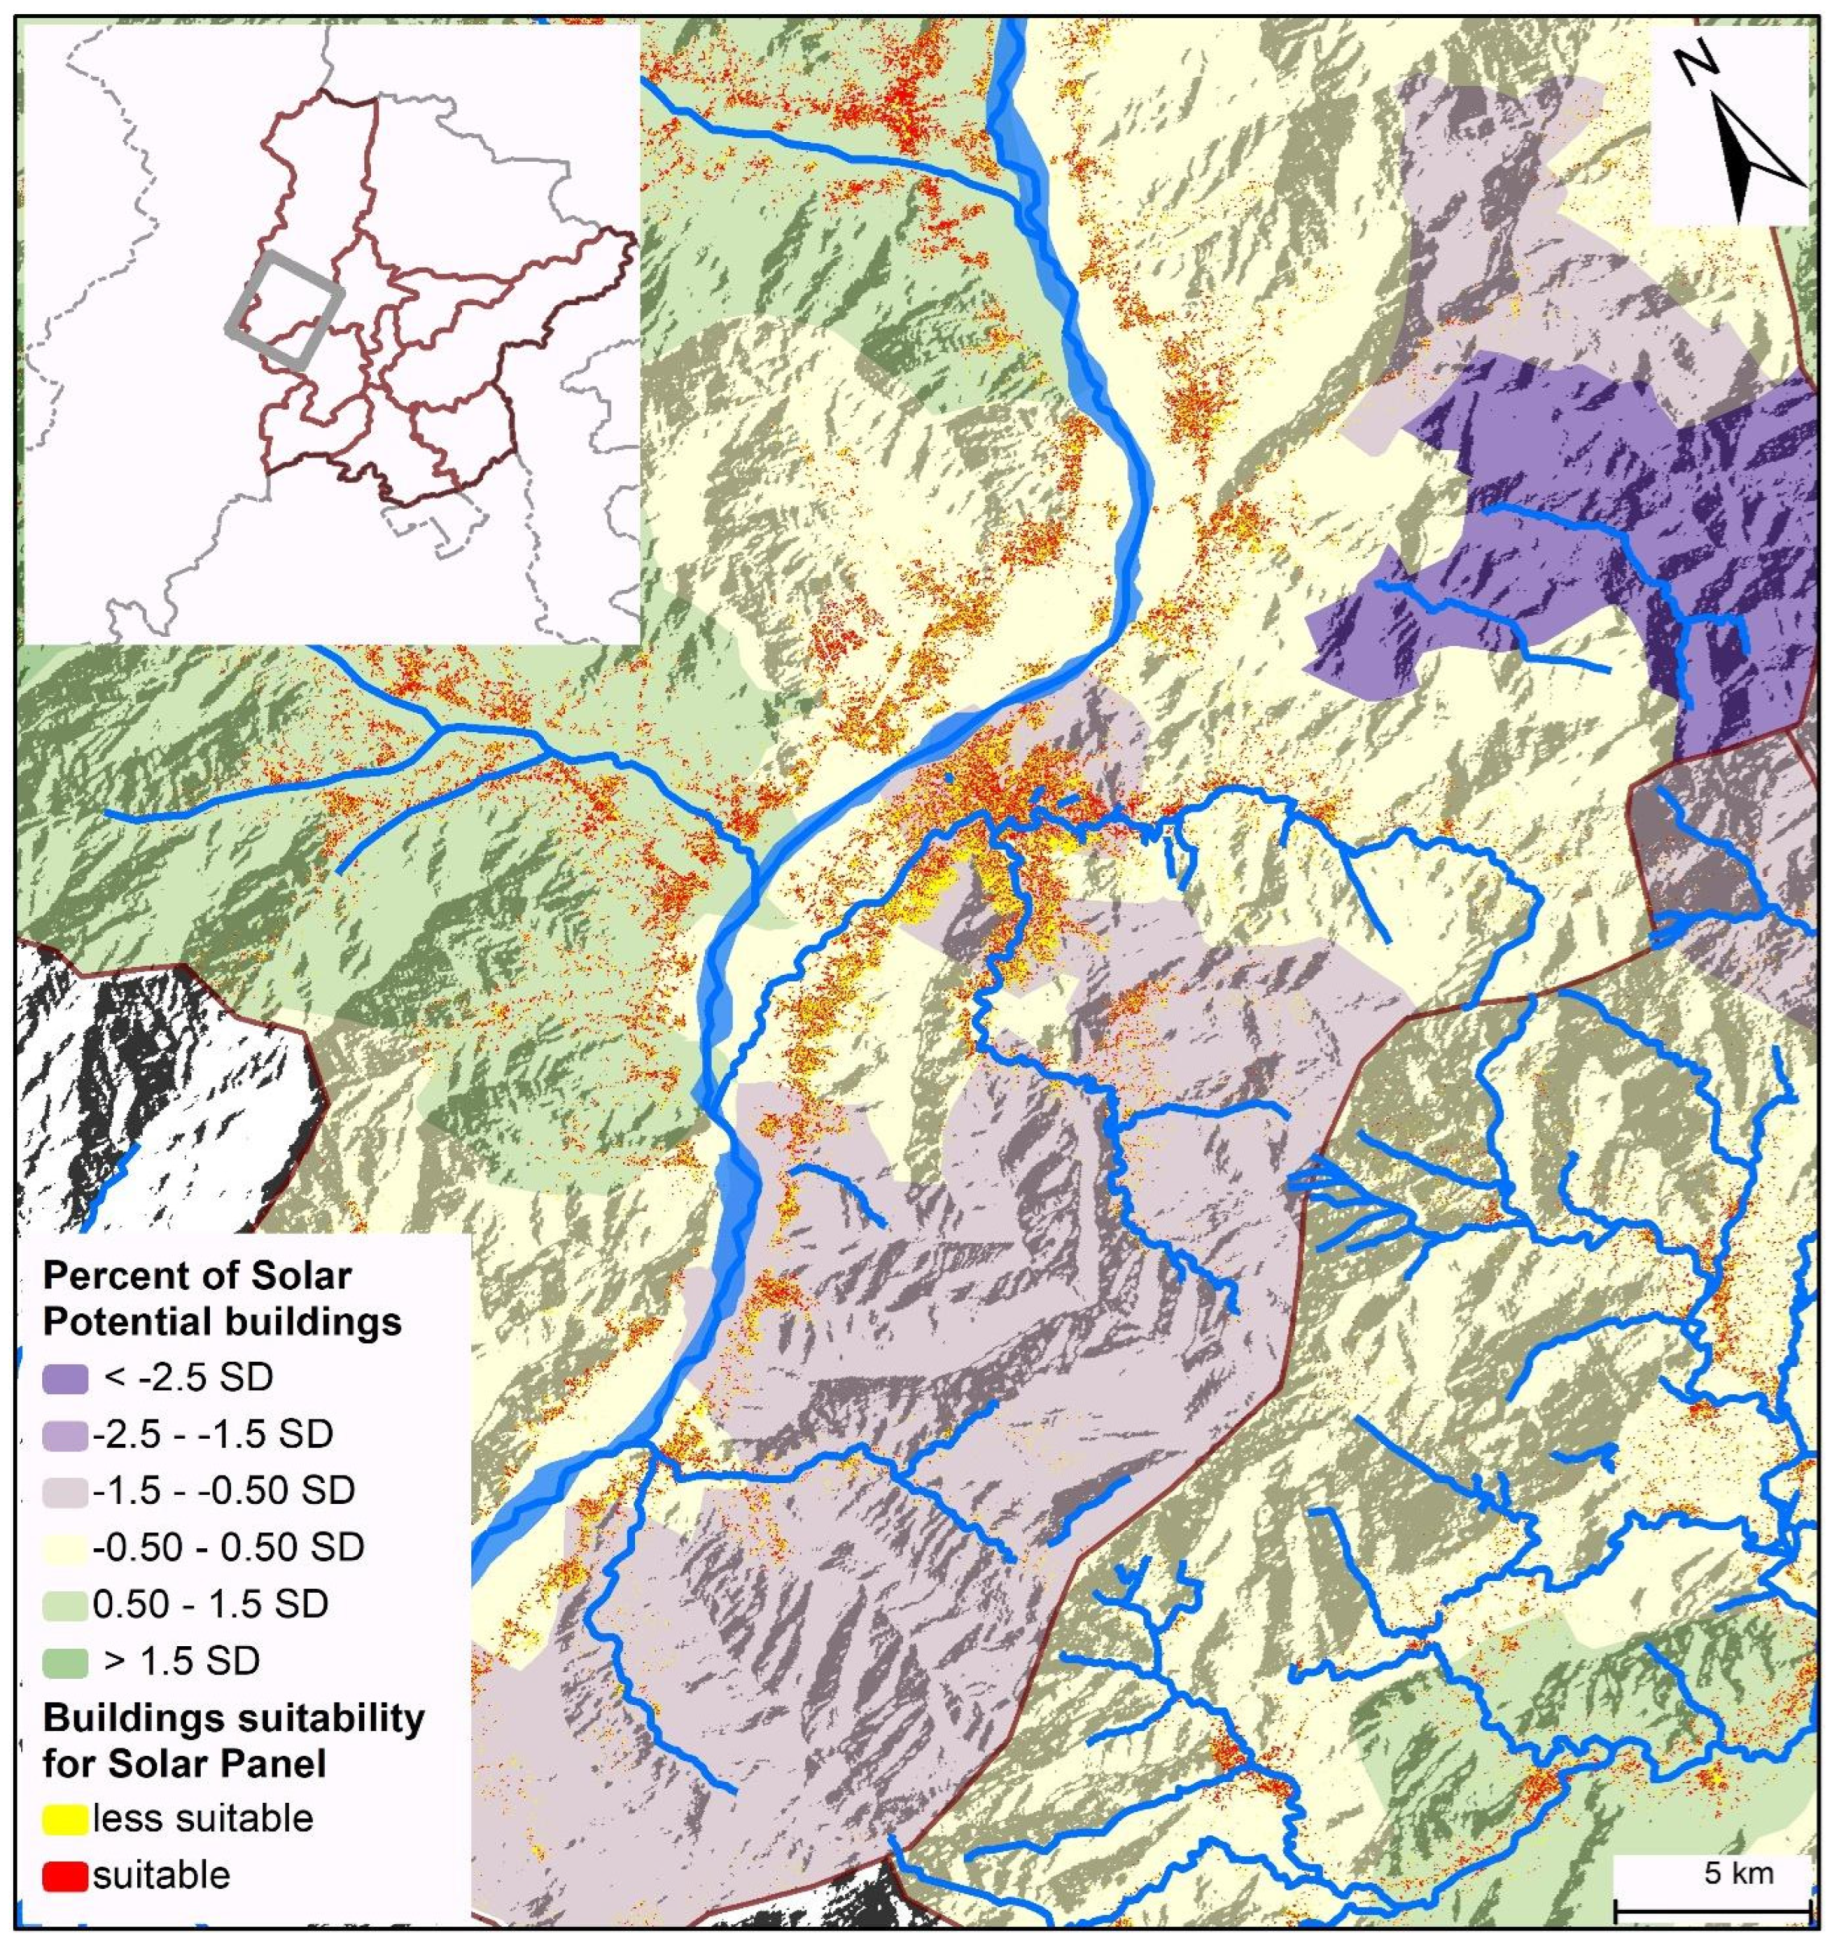
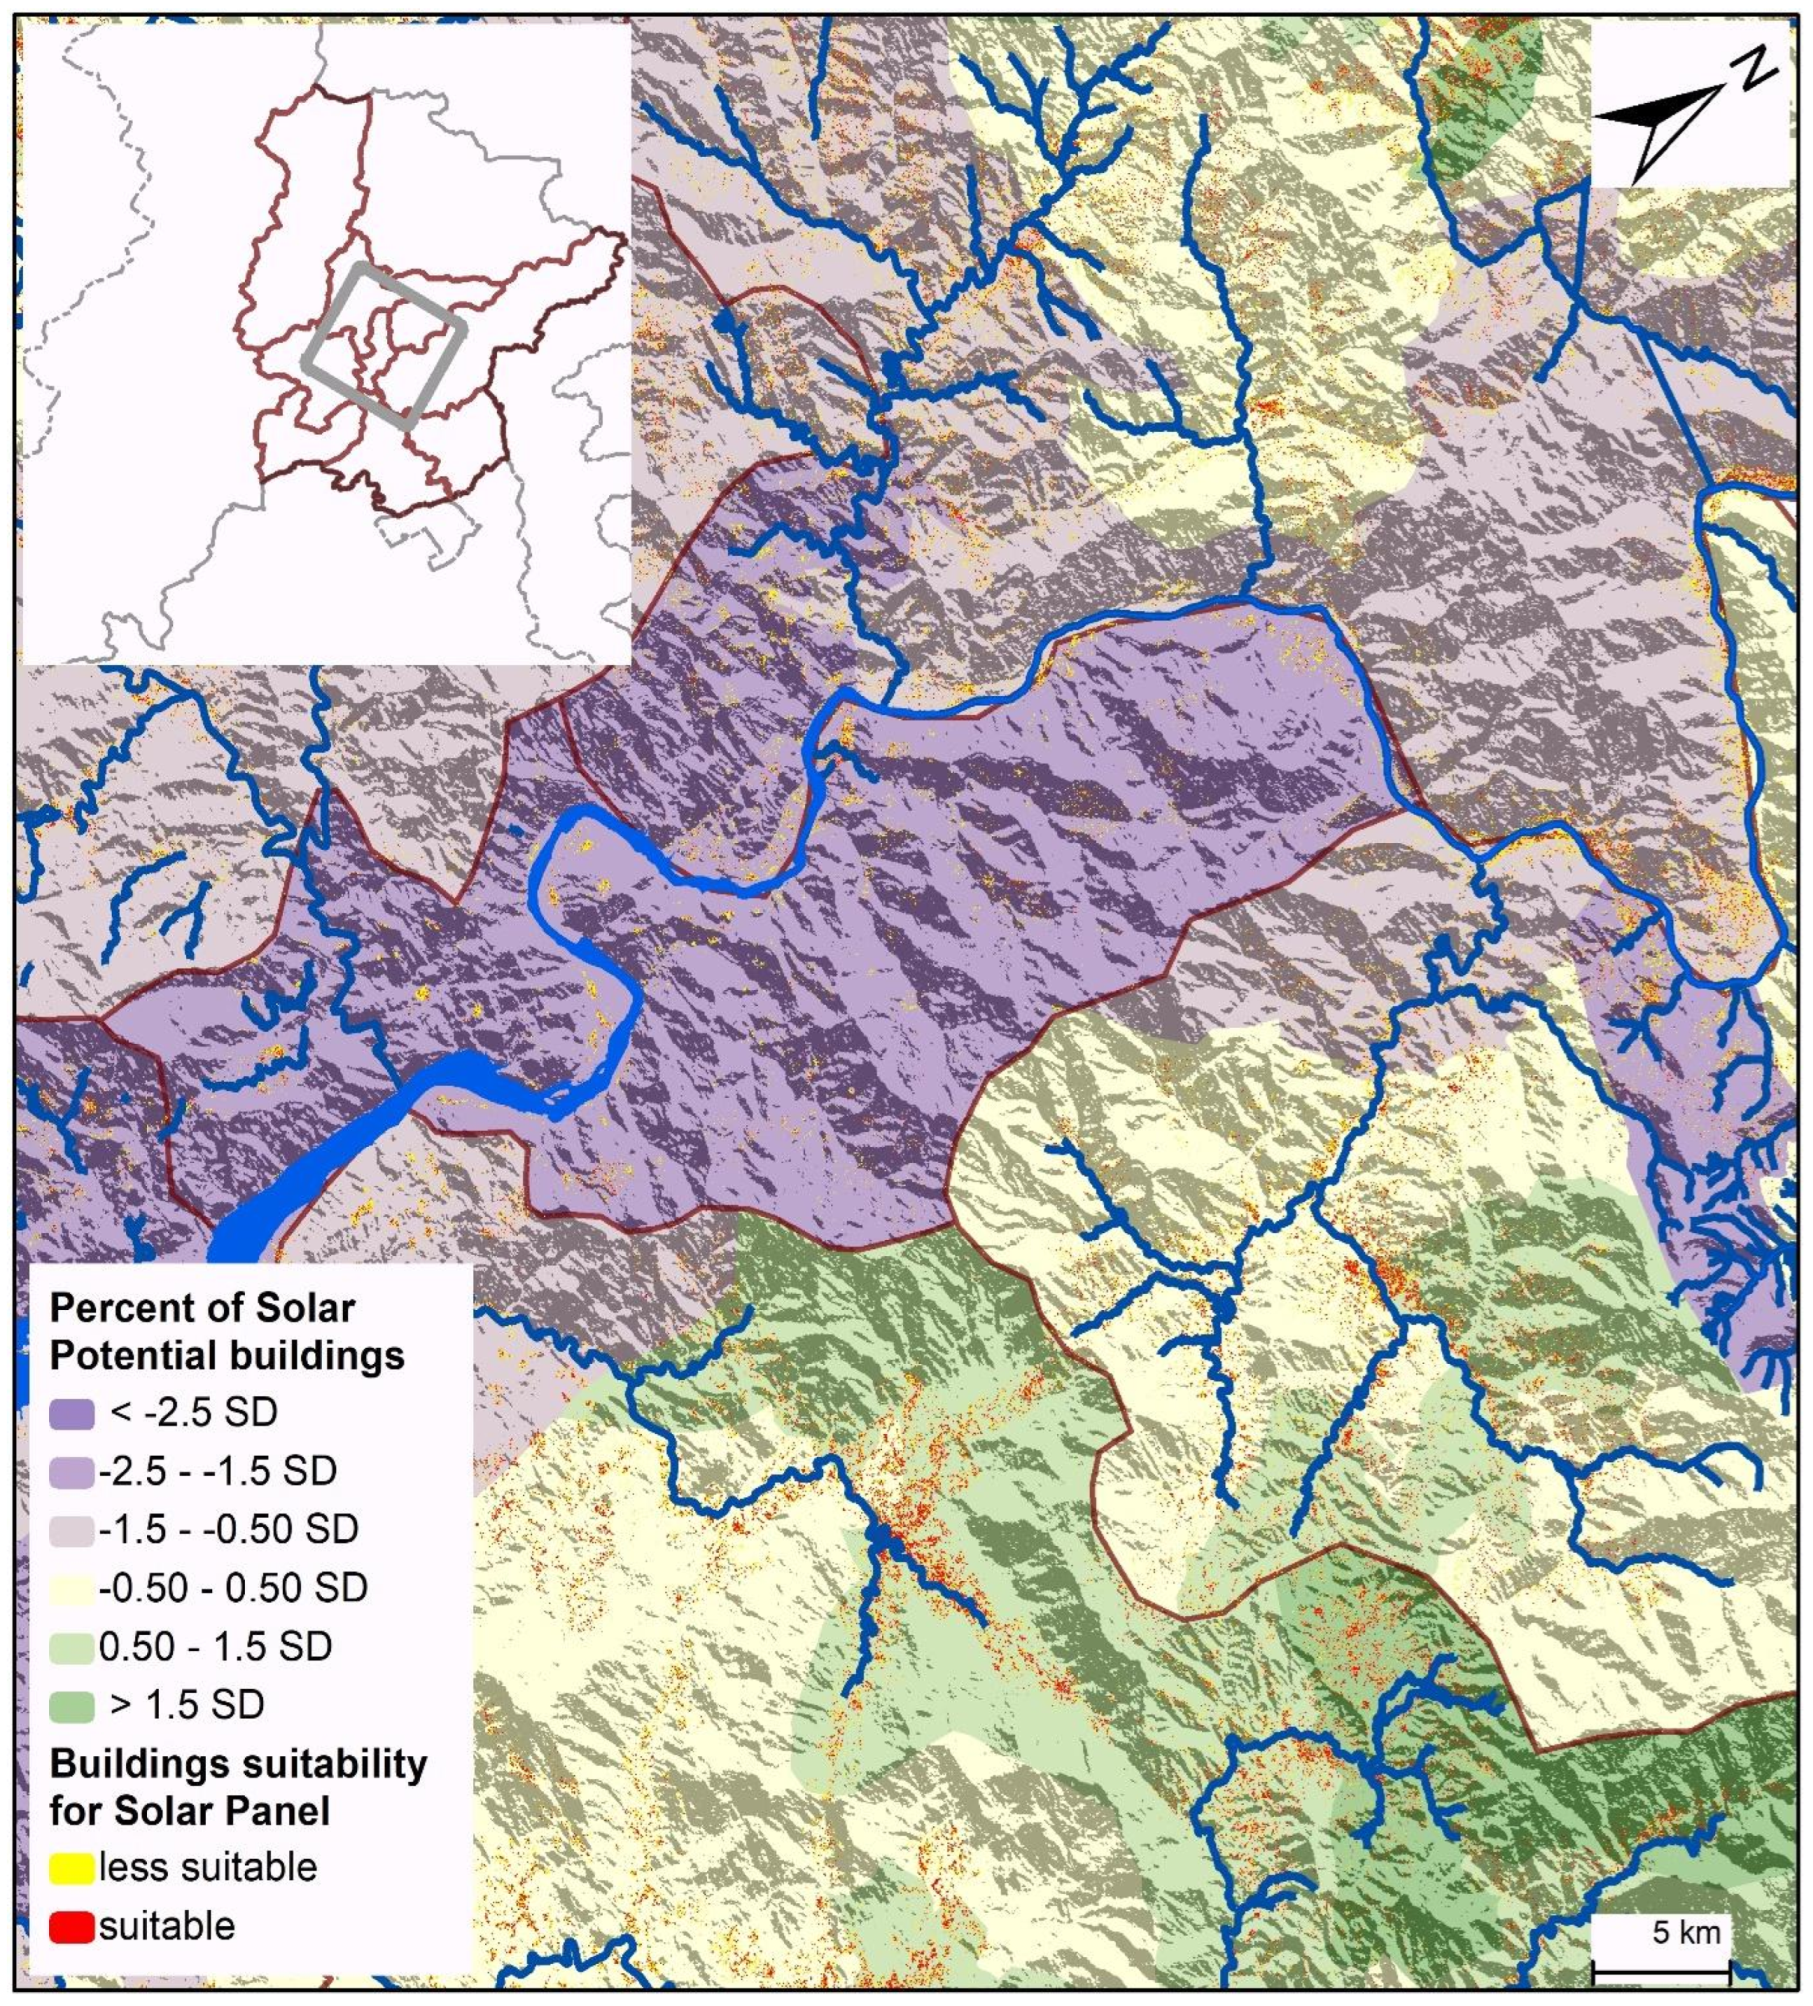
Figure 2,
Figure 3 and
Figure 4 identify the regions that can be targeted. Within
Figure 2, the Standard Deviation (SD) ranges from −0.50 to greater than 1.50, signifying areas where 30% to over 50% of buildings are suitable for solar panel installation. These three SD classes have 218 Union Councils (UCs) out of a total of 319 UCs, making them prime candidates for targeted campaigns. Notably, 15 UCs boast over 50% suitability, while 93 UCs fall within the 40% to 49% suitability range, all of which present promising opportunities for solar adoption initiatives. This information should encourage the government and policymakers to take proactive steps.
Abbottabad district, located in the southeast corner of the study area, emerges as a standout with nearly all its UCs exhibiting over 30% building suitability. The southwest regions of Swat and Mansehra district also offer potential targets, along with the southeast of Haripur district, and the northwest of Shangla district. In the Battagram district, there are UCs with suitable buildings for solar panel installation. However, it is worth noting that districts near the Tarbela Dam, likely due to their valley-like terrain surrounded by mountains, have fewer suitable buildings. Regions like the Swabi district, Tordher district, and the northern part of the Haripur district are affected. These findings underscore the importance of location-specific strategies for promoting solar energy adoption, ensuring that regions with higher suitability are prioritized while addressing challenges in less suitable areas.
For buildings that might not have enough sunlight for solar panels on their own, it may still be possible to benefit from solar power. If the neighbouring building has more potential for solar panels, they can work together. That building can put up solar panels and then share the extra electricity with other buildings nearby. This way, even houses that cannot have their own panels can still use clean and green solar energy. It is a way for more houses to harness solar power, even if they cannot do it alone.
Unlike many rooftop solar studies that focus on small urban areas using high-resolution LiDAR or DSM data, both in Pakistan (e.g., Islamabad case study using Open Buildings/GIS [
36], and deep learning rooftop PV potential in Islamabad [
37] and internationally [
38,
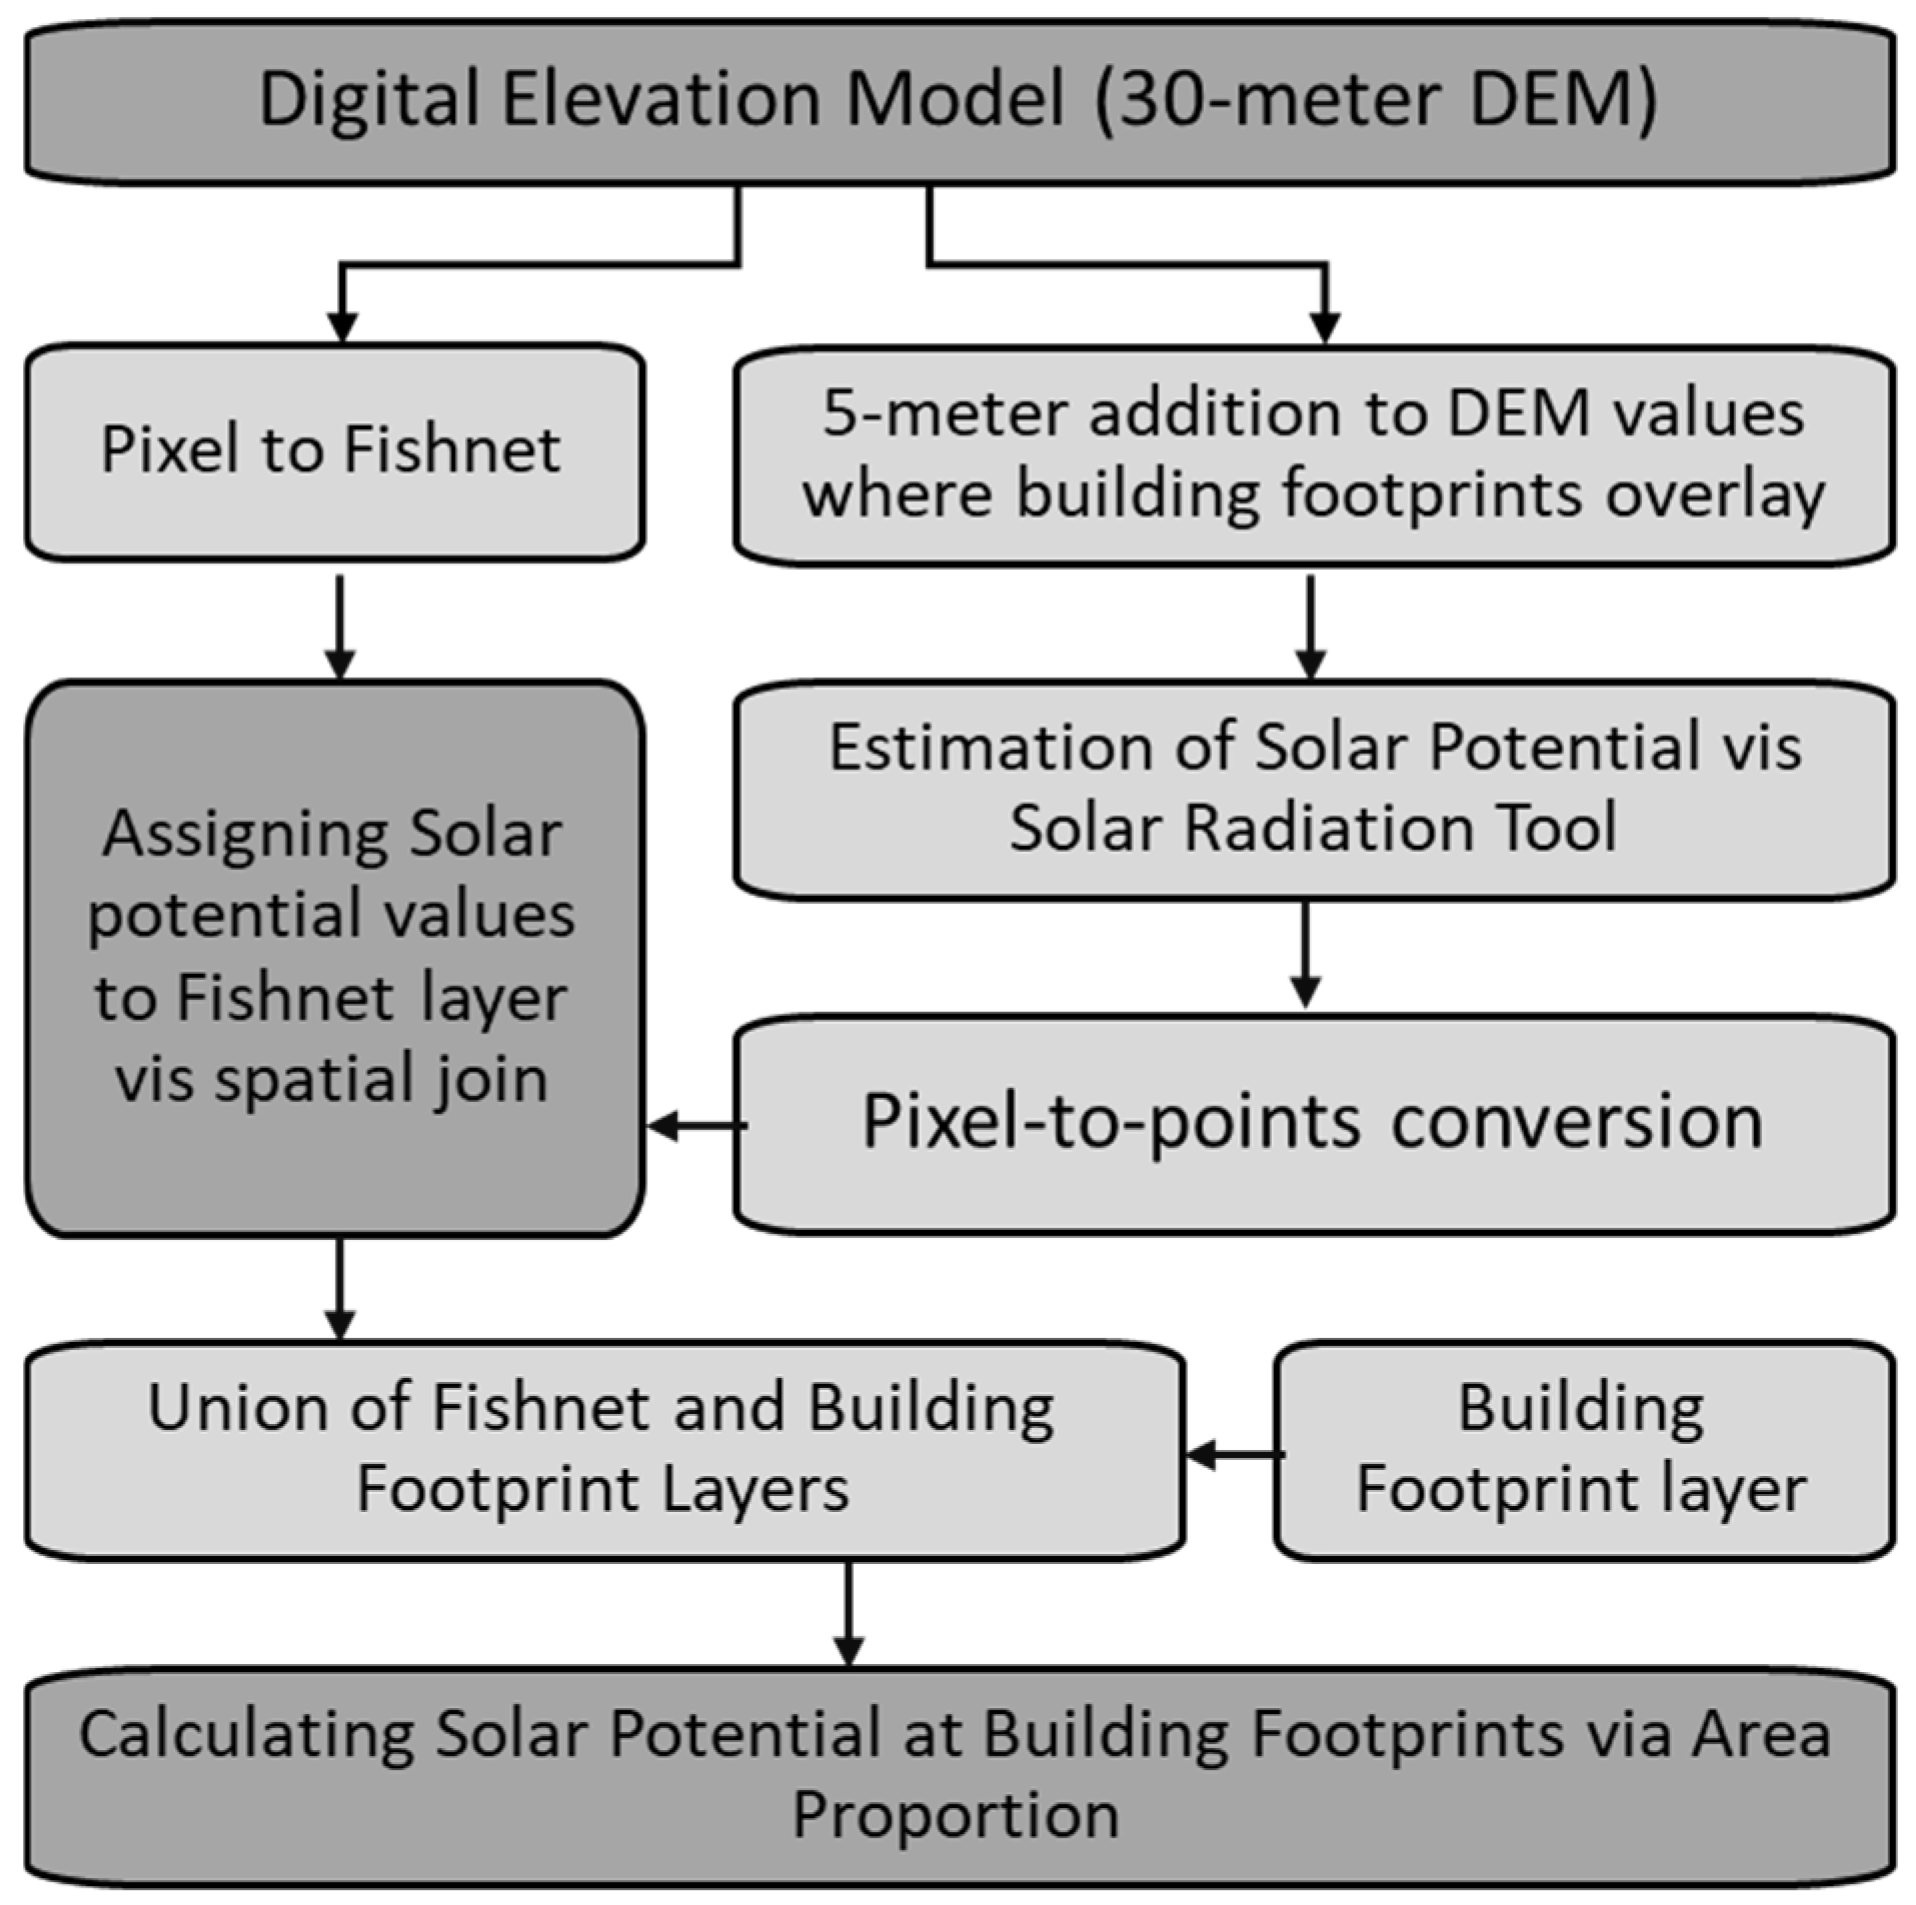
39], this research develops and demonstrates a scalable, open-data-driven geospatial workflow capable of evaluating over 1.29 million buildings across a large, topographically complex region. The study integrates DEM-based solar radiation modeling, building footprint overlays, fishnet-based area weighting, and administrative aggregation to enable solar potential assessment in data-constrained environments, an approach rarely implemented at this spatial and computational scale in the existing literature. Additionally, rather than producing only building-level outputs, this study introduces a UC-level prioritization framework, translating technical solar potential estimates into actionable planning units aligned with Pakistan’s administrative and governance structure. This multi-scale linkage between rooftop analysis and local decision-making distinguishes the study from prior work that remains largely technical or site-specific.
Limitations
In the context of this study, a comparison between LiDAR and DEM data was conducted to evaluate their effectiveness for shadow analysis. The results highlighted the superior accuracy of LiDAR data in providing detailed information about terrain and elevation, which is crucial for assessing solar potential. However, one challenge encountered was that the DEM data lacked detailed information on certain buildings or structures. To address this, a workaround was implemented by adding a 5 m value to the pixels under buildings in the DEM data, artificially increasing their height to compensate for the missing elevation details. This adjustment allowed for more accurate subsequent analysis.
It is important to note that the 30 m DEM resolution introduces spatial generalization, and many rooftops area smaller than a single pixel. Consequently, the estimated solar radiation values should be interpreted as building-linked potential for comparative and planning purposes, rather than precise rooftop-level generation. However, many large-area solar potential assessments globally rely on DEM resolutions of 30 m or coarser for regional screening, particularly in mountainous terrain where slope [
40,
41], aspect, and topographic shading are dominant controls. The study’s conclusions are drawn at the Union Council and district scale, where aggregation reduces pixel-level noise and improves robustness. The 5 m adjustment provides a transparent, reproducible proxy for the average single-story building height and rooftop panel placement. While this approach may under-represent multi-story buildings, these constitute a very small fraction of total residential structures in northern Khyber Pakhtunkhwa, making the method suitable for large-scale prioritization and policy analysis. It should also be noted that while building-level solar modeling provides high-resolution technical outputs, such granularity is often misaligned with the administrative units through which energy policy, budgeting, and implementation decisions are made
During the calculation of solar radiation values, the consideration of rainy and cloudy days was not explicitly included. On average, there are 250–300 sunny days per year based on the geographic regions from low altitudes to mountainous areas. This omission may lead to slight discrepancies in the estimated solar radiation values, as these weather conditions can affect the amount of sunlight received. To mitigate this limitation, it is suggested to incorporate the average number of rainy and cloudy days in the calculation process. By determining the ratio of rainy or cloudy days to the total number of days, the average yearly values can be adjusted accordingly. This adjustment will account for the variations in solar radiation due to different weather patterns, resulting in more precise estimates. However, the analysis is based on the Area Solar Radiation algorithm [
30], a well-established and validated model for estimating solar insolation. Our contribution lies in integrating this algorithm with large-scale building footprint data. We emphasize that this study is intended as a screening and prioritization framework, consistent with similar large-area solar potential studies [
42], rather than an precise engineering-level rooftop estimates. The results should be interpreted as relative solar potential at the building footprint and union council scale, supported by consistency checks with published datasets and expected spatial patterns, rather than absolute measure values.
One potential limitation arises from the building footprint data obtained from Microsoft Bing, specifically regarding the accuracy of building classifications. It was observed that in some cases, multiple buildings with connecting blocks were classified as single separate buildings. This classification error could lead to inaccuracies in the analysis, particularly when assessing the eligibility and potential of individual buildings. The use of 30 m resolution of DEM also introduces spatial generalization, especially for small rooftops; however, the analysis is intended to guide policy prioritization and funding decisions, rather than final system sizing. Further validation and cross-referencing of the building data, including the number of floors for multi-story buildings, residential and commercial categories from alternative sources, could help mitigate this limitation and enhance the overall accuracy of the analysis.
Other limitations in the analysis include the potential impact of tree shade and snow cover on solar radiation estimates. Tree canopies can block sunlight, reducing the available solar radiation on rooftops, especially during specific times of the year when trees are fully leafed. Similarly, snow covers on rooftops or the surrounding terrain can reflect sunlight, potentially altering the total amount of solar radiation received. The panel counts, horizontal or optimally titled surface modelling, system efficiency, and detailed rooftop geometry are also excluded in this study. However, based on established solar modelling literature*, the expected magnitude of variation from the assumed height and tilt parameters is moderate relative to spatial variability in radiation driven by terrain and location. These factors were not explicitly accounted for in the analysis, and their inclusion in future studies could further refine solar potential estimates [
43]. Finally, while precise rooftop-level estimates are not achievable due to data constraints, the methodology provides reliable relative solar potential at the building footprint and union council scale, suitable for planning, prioritization, and policy decisions, which was the primary objective of this analysis.