Article

Thermophysical Characterization of Cerrado Brazilian Fruit Pulps Under Freezing Condition

by
Gustavo Della Justina da Silva
1,
João Renato de Jesus Junqueira
2,*,
Thaisa Carvalho Volpe Balbinoti
3,
Lincoln Carlos Silva de Oliveira
1 and
Paula Giarolla Silveira
4
1
Chemistry Institute, Federal University of Mato Grosso do Sul/UFMS, Av. Costa e Silva s/n, Campo Grande 79070-900, Brazil
2
Faculty of Pharmacy, Federal University of Minas Gerais/UFMG, Av. Presidente Antônio Carlos, 6627, Campus Pampulha, Belo Horizonte 31270-901, Brazil
3
Faculty of Pharmaceutical Sciences, Food and Nutrition, Federal University of Mato Grosso do Sul/UFMS, Av. Costa e Silva s/n, Campo Grande 79070-900, Brazil
4
Food Science Department, Federal University of Lavras/UFLA, Trevo Rotatório Professor Edmir Sá Santos s/n, Lavras 37200-000, Brazil
*
Author to whom correspondence should be addressed.
Thermo 2026, 6(3), 51; https://doi.org/10.3390/thermo6030051
Submission received: 11 April 2026 / Revised: 27 May 2026 / Accepted: 26 June 2026 / Published: 1 July 2026

Abstract

This study investigated the thermophysical properties of mangaba (Hancornia speciosa) and guavira (Campomanesia adamantium) pulps at different soluble solid concentrations (9.0 to 13.5 °Brix) and temperatures (0 to −25 °C). Using mathematical models and experimental data, properties such as density (ρ), apparent specific heat capacity (cp), thermal conductivity (k), and thermal diffusivity (α) were estimated. The results showed that all properties were strongly influenced by temperature and concentration. Density and apparent specific heat capacity increased with °Brix and temperature, while thermal conductivity and diffusivity were higher in samples with greater moisture content. These results provide useful information for the design, simulation, and optimization of freezing and storage processes for native Cerrado fruit pulps, contributing to their technological valorization and potential use in frozen food products.

1. Introduction

The Brazilian Cerrado is recognized as one of the richest savannas in the world in terms of biodiversity, harboring a wide variety of native fruit species with high nutritional and functional potential. Among them, mangaba (Hancornia speciosa) and guavira (Campomanesia adamantium) stand out for their unique flavor, composition, and bioactive content [1,2]. These fruits are emblematic of sociobiodiversity, offering a valuable source of income and identity for local communities, although they are still underexplored in technological applications.
Efforts to valorize native fruits are increasingly associated with the development of sustainable food systems. The bioeconomy framework promotes the responsible use of natural resources to foster local development, food security, and principles of the circular economy [3,4]. Scientific studies that support the industrial viability of Cerrado fruits can significantly contribute to strengthening regional food chains and conservation initiatives, especially when aligned with technological innovation [5].
Despite their cultural and nutritional relevance, scientific data on the thermal behavior and physicochemical properties of mangaba and guavira under freezing conditions are scarce. These parameters are crucial for the proper design of cold chain operations, where phenomena such as ice formation, thermal resistance, and phase change behavior govern product stability and quality [6]. The few available models tend to generalize tropical fruits without considering the peculiarities of native species or the effect of soluble solids.
Thermophysical properties such as density (ρ), specific heat (cp), thermal conductivity (k), and thermal diffusivity (α) are essential for predicting the response of food materials to heat transfer. These variables impact not only energy efficiency but also texture, nutrient retention, and shelf life in frozen or chilled products [7,8]. These properties are often estimated from generic databases or extrapolated from unrelated fruit matrices, limiting accuracy and technological adoption.
Furthermore, the soluble solids content (°Brix) affects freezing point depression and modifies water availability during freezing. Variations in °Brix influence the fraction of unfrozen water, impacting thermal conductivity and diffusivity, as well as the concentration of solutes in the liquid phase [8,9]. However, the interaction between °Brix and temperature in Cerrado fruit pulps remains poorly described, particularly under freezing conditions.
The composition of these pulps is another determining factor. Mangaba pulp is rich in ascorbic acid and pectin, while guavira pulp has high levels of polyphenols and dietary fiber, as well as a distinct volatile profile [1,10]. Their proximal and structural characteristics modulate thermal behavior, reinforcing the need for experimental characterization and specific modeling. Understanding their unique composition helps optimize frozen pulp production, ingredient functionality, and product development.
Research on the freezing behavior of exotic fruit pulps has expanded, but still rarely includes species from the Cerrado. Recent advances in modeling thermal properties and predicting the ice fraction for tropical fruits suggest a clear opportunity to expand knowledge and support innovation in frozen foods derived from native biodiversity [11,12]. As international markets and consumers increasingly demand natural, traceable, and sustainable ingredients, Brazilian fruits can become key assets in the functional foods segment.
Thus, this study aimed to experimentally characterize the proximate composition and initial freezing temperature of mangaba and guavira pulps at different soluble solid concentrations (9.0 to 13.5 °Brix) and to estimate their ice mass fraction and thermophysical properties—density (ρ), apparent specific heat capacity (cp), thermal conductivity (k), and thermal diffusivity (α)—over the temperature range from 0 to −25 °C using predictive models based on composition and phase-dependent behavior.

2. Materials and Methods

2.1. Sample Preparation

The pulps of mangaba (Hancornia speciosa) and guavira (Campomanesia adamantium) were obtained from local producers in Campo Grande, Mato Grosso do Sul, Brazil. Before analysis, the pulps were homogenized to reduce possible compositional heterogeneity. The total soluble solids content was determined using an Abbé refractometer (Tecnal RL3, São Paulo, Brazil), according to the standard refractometric procedure [13], and expressed as °Brix. The initial soluble solids content of both pulps was approximately 13.5 ± 0.2 °Brix.
To evaluate the effect of soluble solid concentration on freezing behavior and model-based thermophysical properties, the original pulps were diluted with distilled water to obtain samples at 9.0, 10.5, and 12.0 °Brix. After water addition, each sample was homogenized, and the soluble solids content was rechecked using the refractometer until the target concentration was reached. The original pulp, with approximately 13.5 °Brix, was maintained as the highest concentration level. These concentration levels were selected because they are within the range commonly reported for mangaba [2] and guavira [10] fruits, considering natural variations associated with ripening stage, environmental and genetic factors, and post-harvest conditions [14].

2.2. Proximate Composition

The proximate composition of mangaba and guavira pulps was determined for each soluble solid concentration evaluated in this study: 9.0, 10.5, 12.0, and 13.5 °Brix. Moisture, lipid, protein, ash, and crude fiber contents were determined according to standard analytical procedures [15]. Carbohydrate content was calculated by difference using the following equation: Carbohydrates = 100 − (moisture + lipid + protein + ash + crude fiber).
The results were expressed as g/100 g of pulp on a wet basis. All analyses were performed in triplicate, and the results were reported as mean ± standard deviation. The proximate composition data obtained experimentally were used as input values for the subsequent model-based estimation of thermophysical properties. For this purpose, the composition values expressed in g/100 g were converted into mass fractions of each component.

2.3. Freezing Point Determination

The initial freezing temperature (Tf) of mangaba and guavira pulps at each soluble solid concentration was experimentally determined by Differential Scanning Calorimetry using a DSC-60 calorimeter (Shimadzu Corporation, Kyoto, Japan). Approximately 5 mg of each sample was weighed into aluminum pans, which were hermetically sealed to prevent moisture loss during thermal analysis. An empty sealed aluminum pan was used as a reference.
The samples were cooled from room temperature to −80 °C at a rate of 5 °C/min and subsequently heated to 300 °C at 10 °C/min under a nitrogen atmosphere at a flow rate of 50 cm3/min. The initial freezing temperature was determined from the DSC thermograms based on the onset temperature of the low-temperature endothermic transition associated with ice melting in the frozen pulp matrix. The onset temperature was obtained from the intersection between the extrapolated baseline and the tangent line at the beginning of the thermal event.
All measurements were performed in triplicate, and the results were expressed as mean ± standard deviation.

2.4. Frozen Water Fraction Determination

The ice mass fraction (xice) in the fruit pulps was estimated to describe the proportion of water converted into ice at each temperature under freezing conditions. This parameter is relevant because ice formation affects the thermal behavior of frozen foods and directly influences the subsequent estimation of thermophysical properties.
The ice mass fraction was estimated using the empirical model proposed by [16], as shown in Equation (1):
x i c e = 1.105 x w 0 1 + 0.8765 ln T f T + 1
where xw0 is the mass fraction of water (unfrozen) in the frozen pulp [-], Tf is the freezing point [°C], and T is the food temperature [°C].
The values of xw0 were obtained from the experimentally determined moisture content of each pulp and soluble solid concentration, expressed in g/100 g and converted to mass fraction. The Tf values were obtained by differential scanning calorimetry, as described in Section 2.3. Therefore, the ice mass fraction was estimated from experimental moisture and freezing point data.

2.5. Theoretical Models for Predicting Thermophysical Properties

Density (ρ), apparent specific heat capacity (cp), thermal conductivity (k), and thermal diffusivity (α) were estimated using predictive equations based on the experimentally determined proximate composition, initial freezing temperature, and estimated ice mass fraction of the pulps.
The predictive equations used for the individual food components were based on the models proposed by Choi and Oikos [17] and the American Society of Heating (ASHRAE) [18], which relate thermophysical properties to temperature and food composition. All the equations can be employed from −40 °C to 150 °C.
The experimentally determined composition of each pulp and soluble solid concentration was converted into mass fractions and used as input data in the calculations. For temperatures below the initial freezing point, the contribution of ice formation was considered through the estimated ice mass fraction described in Section 2.4.

2.5.1. Density

Density (ρ) represents the ratio between mass and volume and, in fruit pulp, is influenced by the water, solids, and fiber content. It is a fundamental parameter in the food industry, affecting storage, transport, packaging, texture, and sensory perception [19]. The density estimate was recorded according to Table 1.
Then, to determine the density of each food component, Equation (9) was used to calculate the density of the pulp.
ρ = 1 x i ρ i
where xi and ρi are the mass fraction [-] and the estimated density [kg/m3] of each component, respectively.

2.5.2. Apparent Specific Heat Capacity

Specific heat (cp) is a property that indicates the amount of energy required to raise the temperature of a unit mass by 1 °C. Understanding specific heat is essential in fruit pulp freezing processes, ensuring energy efficiency and preserving product quality. In this study, apparent specific heat capacity was estimated from the mass fractions of the pulp components and the temperature-dependent predictive equations presented in Table 2.
The component-specific heat capacity values were estimated using the equations proposed by Choi and Okos [17] and ASHRAE [18]. The apparent specific heat capacity of each pulp was then calculated as the weighted sum of the component contributions, according to Equation (17):
c p = c p i   x i
where cpi is the estimated apparent specific heat capacity [kJ/kg K] of each component, and xi is the mass fraction of each component.

2.5.3. Thermal Conductivity

Thermal conductivity (k) describes the ability of a material to transfer heat through its structure. In frozen fruit pulps, this property is strongly affected by the relative proportions of water, ice, and soluble solids, as well as by the spatial arrangement of these phases. In this study, thermal conductivity was estimated using component-based predictive equations and mixture models commonly applied to heterogeneous food systems.
First, the thermal conductivity of each component—protein, lipid, carbohydrate, fiber, ash, moisture, and ice—was estimated as a function of temperature using the equations presented in Table 3.
Then, the contribution of each component to the effective thermal conductivity of the pulp was calculated using its volume fraction. The volume fraction of each component (Xi) was obtained from the mass fraction and estimated density of each component, according to Equation (25):
X i = x i ρ i x i ρ i
where Xi is the volume fraction of component i [-], xi is the mass fraction of component i [-], and ρi is the estimated density [kg/m3] of component i.
To account for possible differences in phase arrangement within the frozen pulp matrix, three theoretical models were applied: parallel, series, and Maxwell–Eucken. These models represent idealized limiting or intermediate arrangements of the components relative to the heat flow direction.
In the parallel model, all components are assumed to be arranged parallel to the heat flow direction [20]. This configuration represents the upper-bound estimate of thermal conductivity because the phases with higher conductivity contribute more directly to heat transfer. The effective thermal conductivity in the parallel model (kp) was calculated using Equation (26):
k p = X i   k i
In the series model, the components are assumed to be arranged perpendicular to the heat flow direction, so that heat must pass successively through each phase. This configuration represents the lower-bound estimate of thermal conductivity because the overall heat transfer is limited by the thermal resistance of each component [20]. The effective thermal conductivity in the series model (ks) was calculated using Equation (27):
1 k s = X i k i
The Maxwell–Eucken model was used as an intermediate approach for heterogeneous systems composed of a continuous (c) phase and dispersed (d) phases. In this study, the continuous phase was represented by the water/ice phase, while the dispersed phase corresponded to the remaining solid constituents of the pulp. This model assumes that the dispersed phase is distributed within the continuous phase without forming continuous heat-conduction pathways [12]. The Maxwell–Eucken thermal conductivity (kME) was calculated using Equation (28):
k M E = k c k d + 2 k c 2 X d k c k d k d + 2 k d + X d k c k d
where kME is the Maxwell–Eucken thermal conductivity [W/m K], kc is the thermal conductivity of the continuous phase [W/m K], kd is the thermal conductivity of the dispersed phase [W/m K], and Xd is the volume fraction of the dispersed phase [-].

2.5.4. Thermal Diffusivity

Thermal diffusivity (α) was estimated from the predicted thermal conductivity, density, and apparent specific heat capacity values, according to Equation (29):
α = k ρ   c p
where α is the thermal diffusivity [m2/s], k is the estimated thermal conductivity [W/m K], ρ is the estimated density [kg/m], and cp is the estimated apparent specific heat capacity [J/kg K].
It represents the ability of the material to conduct heat relative to its ability to store it. In addition, it determines how quickly thermal energy propagates or diffuses through the material [21].
The resulting α values were interpreted as model-based estimations derived from the previously estimated properties. Therefore, they were used to compare the effects of temperature and soluble solid concentration on the thermal behavior of mangaba and guavira pulps.
It is important to emphasize that thermophysical properties were not experimentally measured in this study. These properties were estimated using predictive equations widely applied in food engineering and validated for multiphase food systems [17,18]. Therefore, the obtained values should be interpreted as model-based estimations supported by experimental proximate composition and freezing point data.

3. Results and Discussion

3.1. Experimental Characterization

3.1.1. Proximate Composition

Since the fruits of the Cerrado are harvested in specific regions during short periods, their characterization is of practical importance, as they are generally marketed in the form of pulp. The proximate composition of the fruits (in different concentrations) is presented in Table 4.
According to Table 4, water (moisture) is the predominant component in both fruits, as is commonly observed in fruits. It was noted that as the soluble solids content increases, the moisture content decreases. This observation is in accordance with expectations, given that the reduction in moisture content is associated with the concentration of other constituents, such as proteins and carbohydrates.
It is important to note that the moisture content in fruits is directly associated with their perishability, and technological preservation processes are required to reduce losses, such as dehydration, freezing and concentration [22].
The proximate composition of the fruit pulp was similar to that found in literature. Zitha et al. [23] found moisture content values for mangaba pulp of 80 g/100 g. Andrade et al. [1] found moisture content values for guavira pulp of 85 g/100 g.
In general, the differences in proximate composition are associated with the conditions in which the fruits are obtained, with factors such as climate, soil, and temperature contributing to these variations, in addition to processing technology and post-harvest storage [3].

3.1.2. Initial Freezing Temperature

The initial freezing temperatures (Tf) of the pulps in different concentrations, determined by differential scanning calorimetry, are presented in Table 5.
The reduction in Tf with increasing solids content was aligned with freezing point depression, a colligative property. Similar trends were observed by Sviech et al. [24] for surinam cherry, siriguela, araza, guava and mango pulps.
Tf is influenced by the presence of low molecular weight substances, such as sugars, due to the increase in mixing entropy and the entropy change that occurs when non-volatile solutes are added to a solvent [25]. According to Table 5, higher solid concentrations resulted in lower Tf values for both fruits.
The freezing point of cryoconcentrated phases is crucial for controlling the behavior of fruits during freezing, as it allows for the direct calculation of the ice crystal fraction at any temperature below this point. This property is fundamental for the design of refrigeration equipment and low-temperature processing applications, such as frozen foods and ice cream.
In general, the Tf varies between fruit species. Sviech et al. [11] studied the initial freezing temperature of pitanga and araza in different concentrations (10 to 20 °Brix), obtaining Tf ranging from −0.89 °C to −1.82 °C.

3.2. Model-Based Thermophysical Estimation

The results presented in this section were interpreted as model-based estimations intended to compare the effects of temperature and soluble solid concentration on the thermal behavior of mangaba and guavira pulps.

3.2.1. Frozen Water Fraction

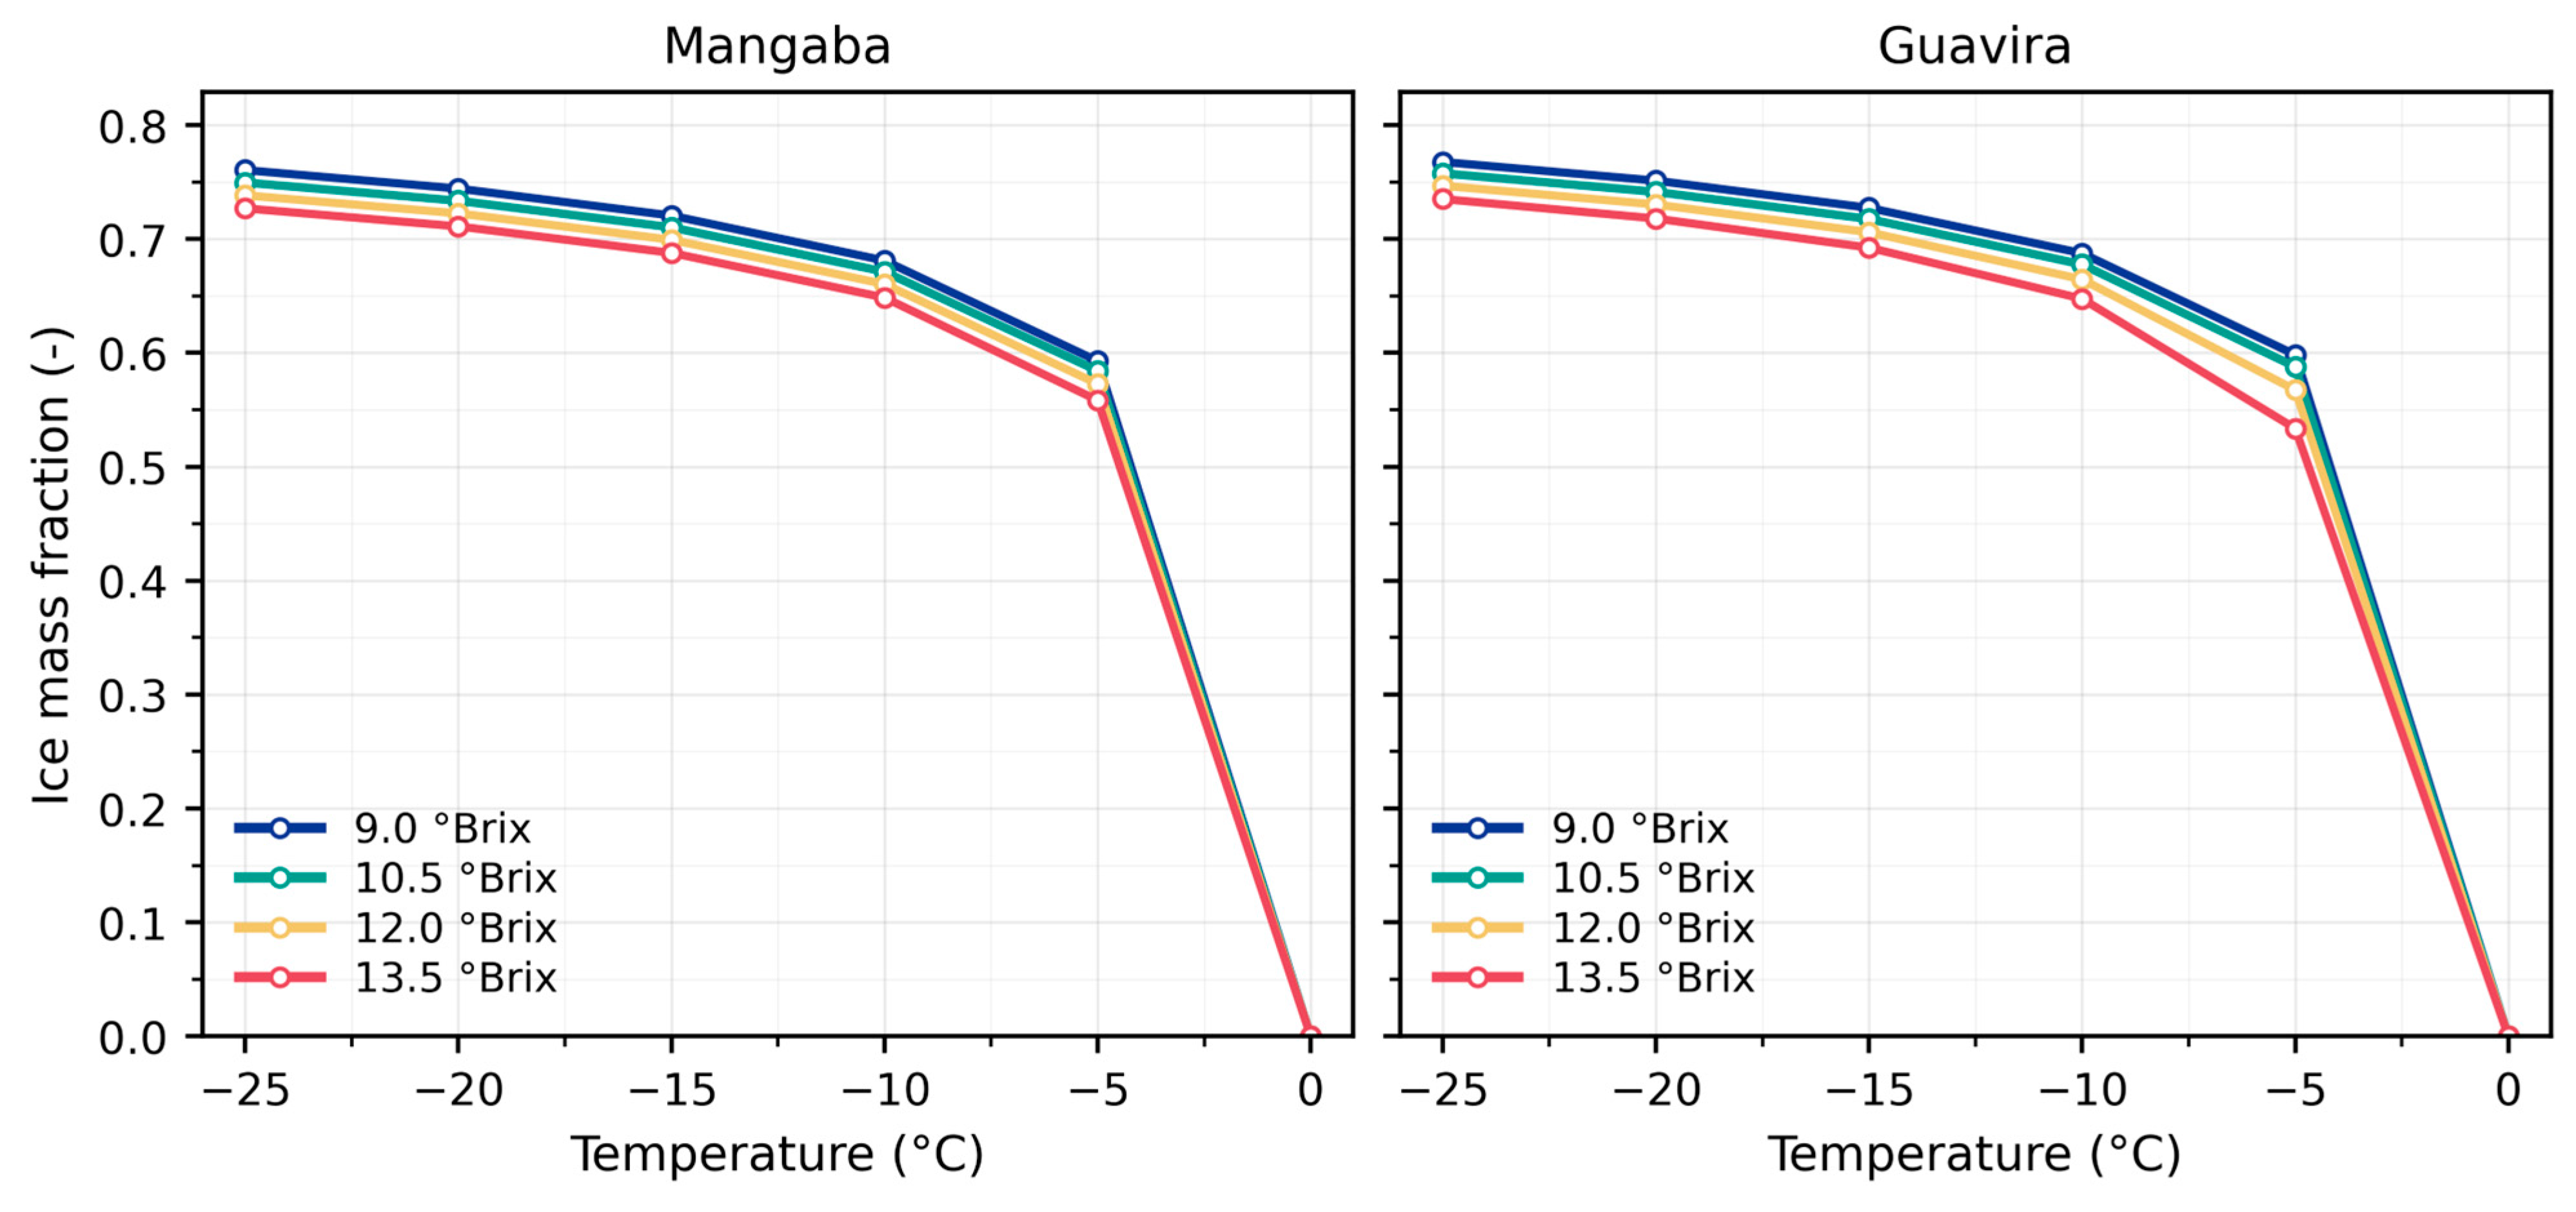
For both fruits, an increase in the mass fraction of ice (xice) is observed in the temperature range of 0 °C to −5 °C, according to Figure 1. This continuous increase is related to the fact that this temperature range is close to Tf (Table 5).
Although there is an increase in this value after −5 °C, it is not very pronounced (approximately 30%). Mangaba and guavira pulps are composed of water and solid fractions, and as sensible heat is removed below Tf, the water begins to crystallize into ice. With further heat removal, an increasing proportion of water turns to ice, resulting in a remaining solution that is more concentrated in terms of solids content.
Furthermore, more concentrated pulps exhibit lower ice mass fractions because their Tf is lower in comparison with less concentrated pulps. Additionally, they present higher viscosities, which makes the formation of ice crystals difficult once the mobility of water within the pulp is reduced [8,26].

3.2.2. Density (ρ)

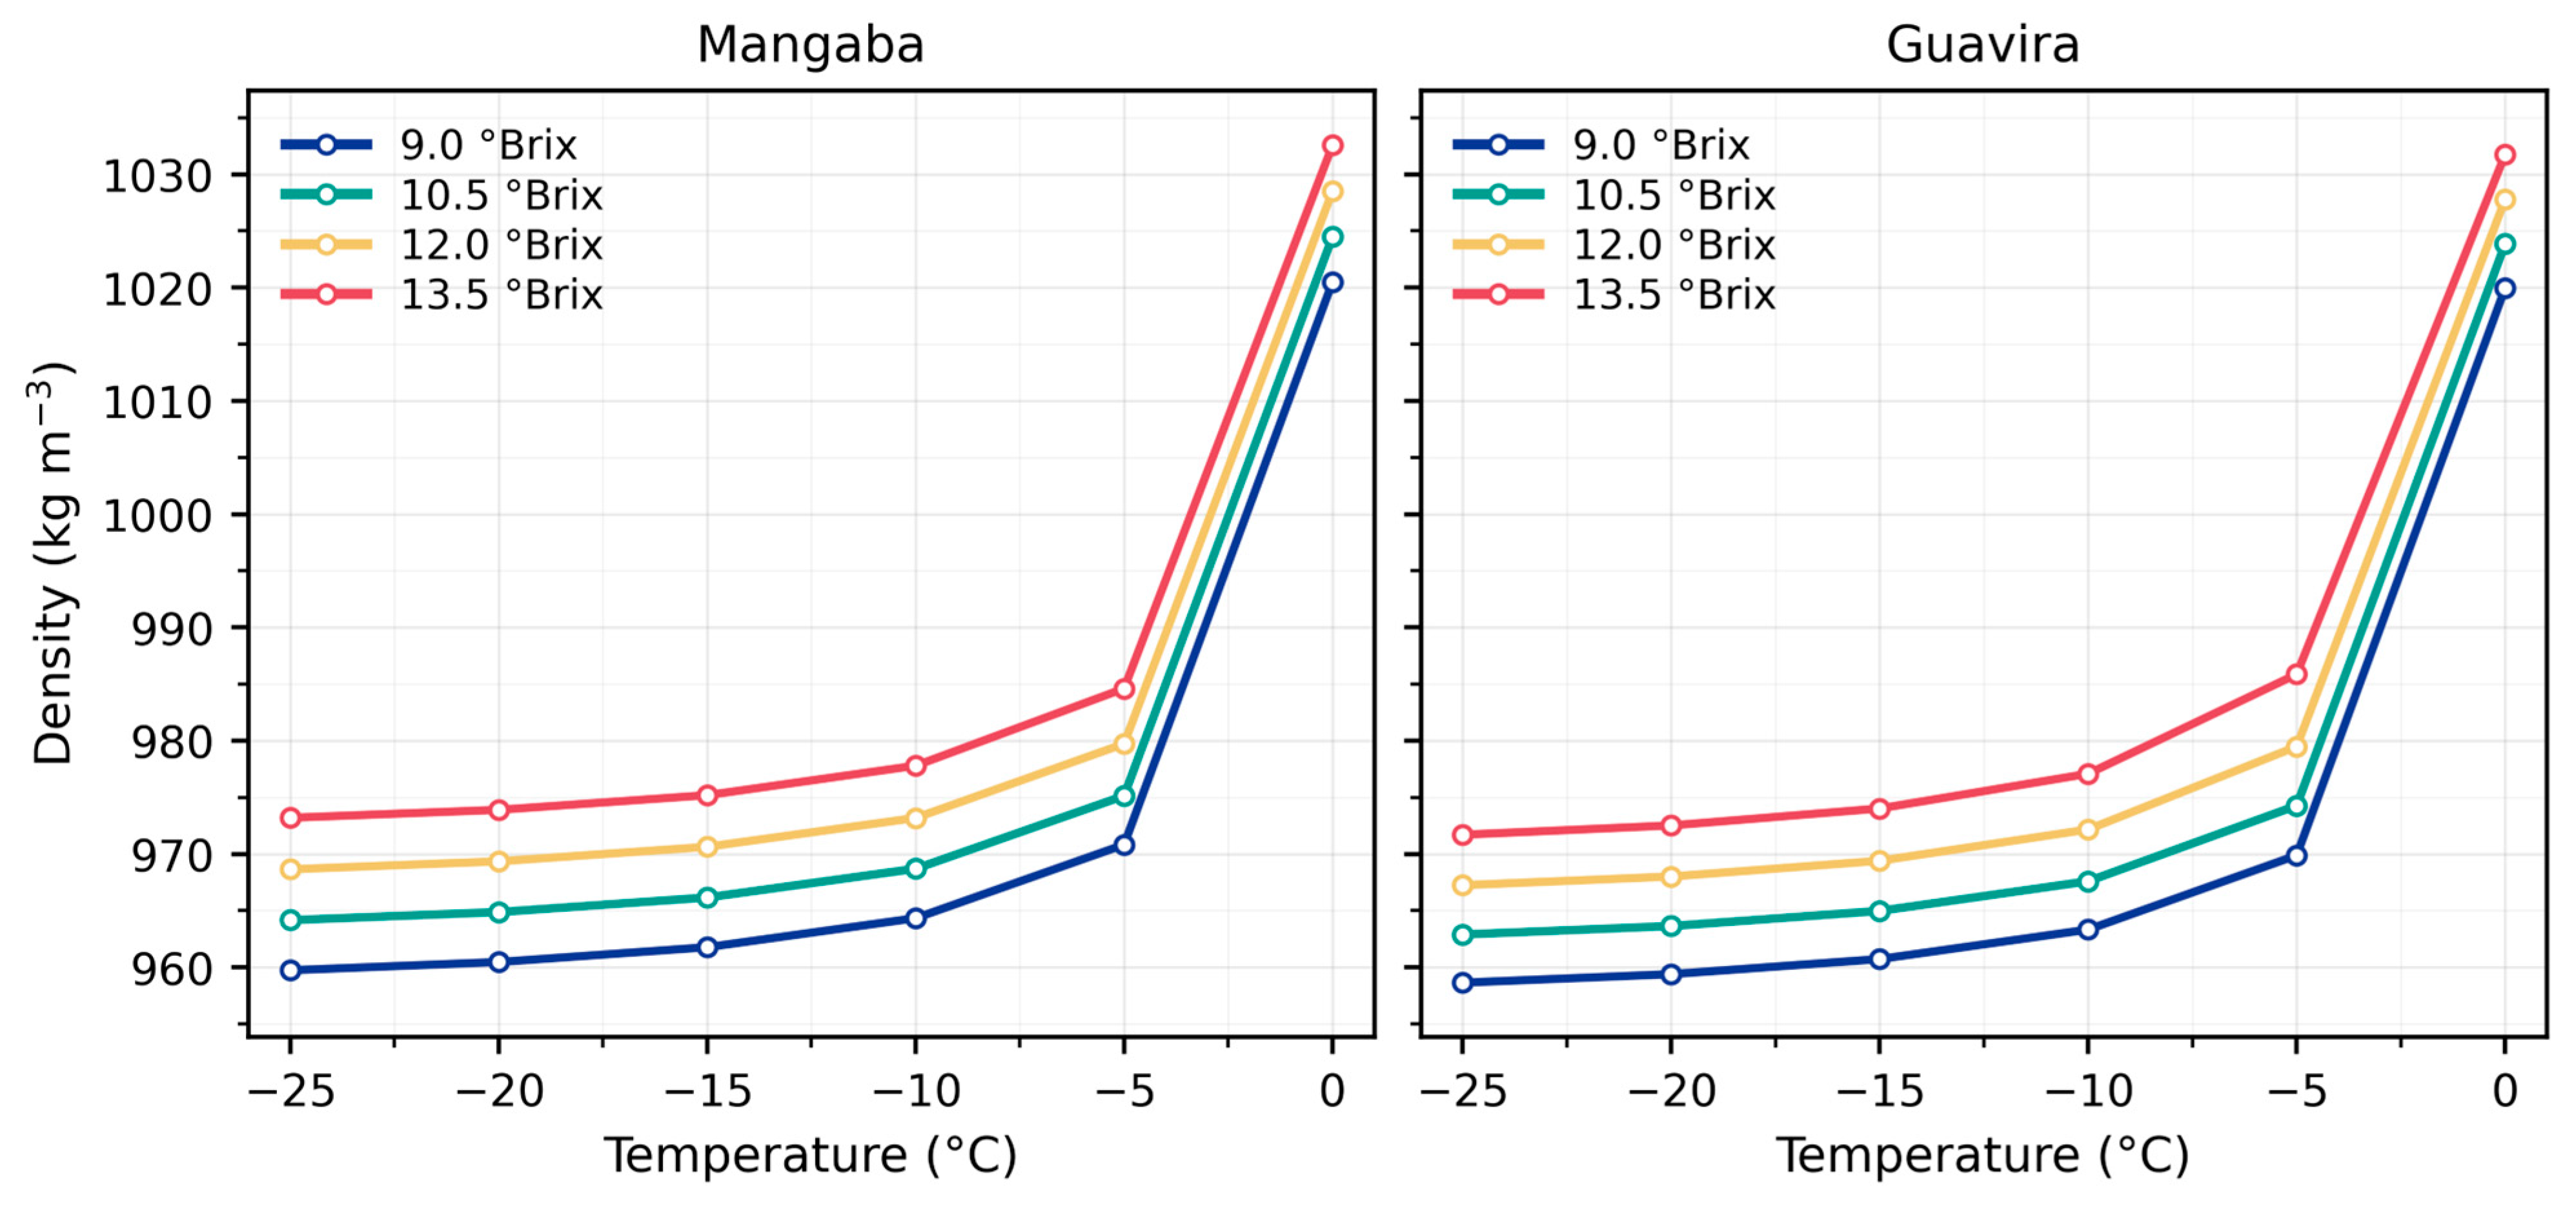
The density of the fruits is presented in Figure 2. It was observed that density increased with increasing °Brix content and decreasing temperature. However, this variation became more pronounced near 0 °C.
For both fruits, the predicted density values ranged from approximately 958 to 1033 kg/m3. This trend is consistent with the behavior of aqueous sugar solutions, where increasing solute concentration increases mass per unit volume, while decreasing temperature reduces molecular mobility and causes volume contraction. At 0 °C and 13.5 °Brix, mangaba reached the highest density (1032.6 kg/m3), slightly above guavira (1031.8 kg/m3).
At freezing temperatures, especially between −25 °C and −10 °C, the density differences between concentrations were reduced. This is likely due to the formation of ice crystals, which exclude solutes from the frozen phase and, therefore, reduce the density of the remaining unfrozen liquid fraction. Sviech et al. [11] demonstrated that, below the initial freezing point, phase separation alters the apparent density of fruit pulps due to changes in the concentration of the remaining liquid phase.
The non-linearity observed around the freezing point is also in accordance with the thermodynamic principles described by Zhao and Takhar [27], which emphasize the complexity of phase changes in multicomponent foods, particularly due to localized freezing and the presence of solute-rich microenvironments.
According to Figure 2, guavira showed slightly lower density values than mangaba at all measured points, a difference attributed to its compositional profile [2]. This difference was especially notable at higher temperatures (−5 °C to 0 °C), where solutes are more completely dissolved, and their individual contributions to density are more evident.
Furthermore, the density behavior is aligned with the predictive structures for biphasic systems [12], where the effective thermal and physical properties are described as functions of structural arrangement, porosity, and concentration gradients in porous and semi-porous matrices, including fruit pulps.
Rydzak et al. [28] also observed an increase in density with increasing °Brix in commercial apple juices, highlighting the influence of both fruit composition and processing. These results corroborate the behavior observed in mangaba and guavira pulps, mainly at higher concentrations.

3.2.3. Apparent Specific Heat Capacity (cp)

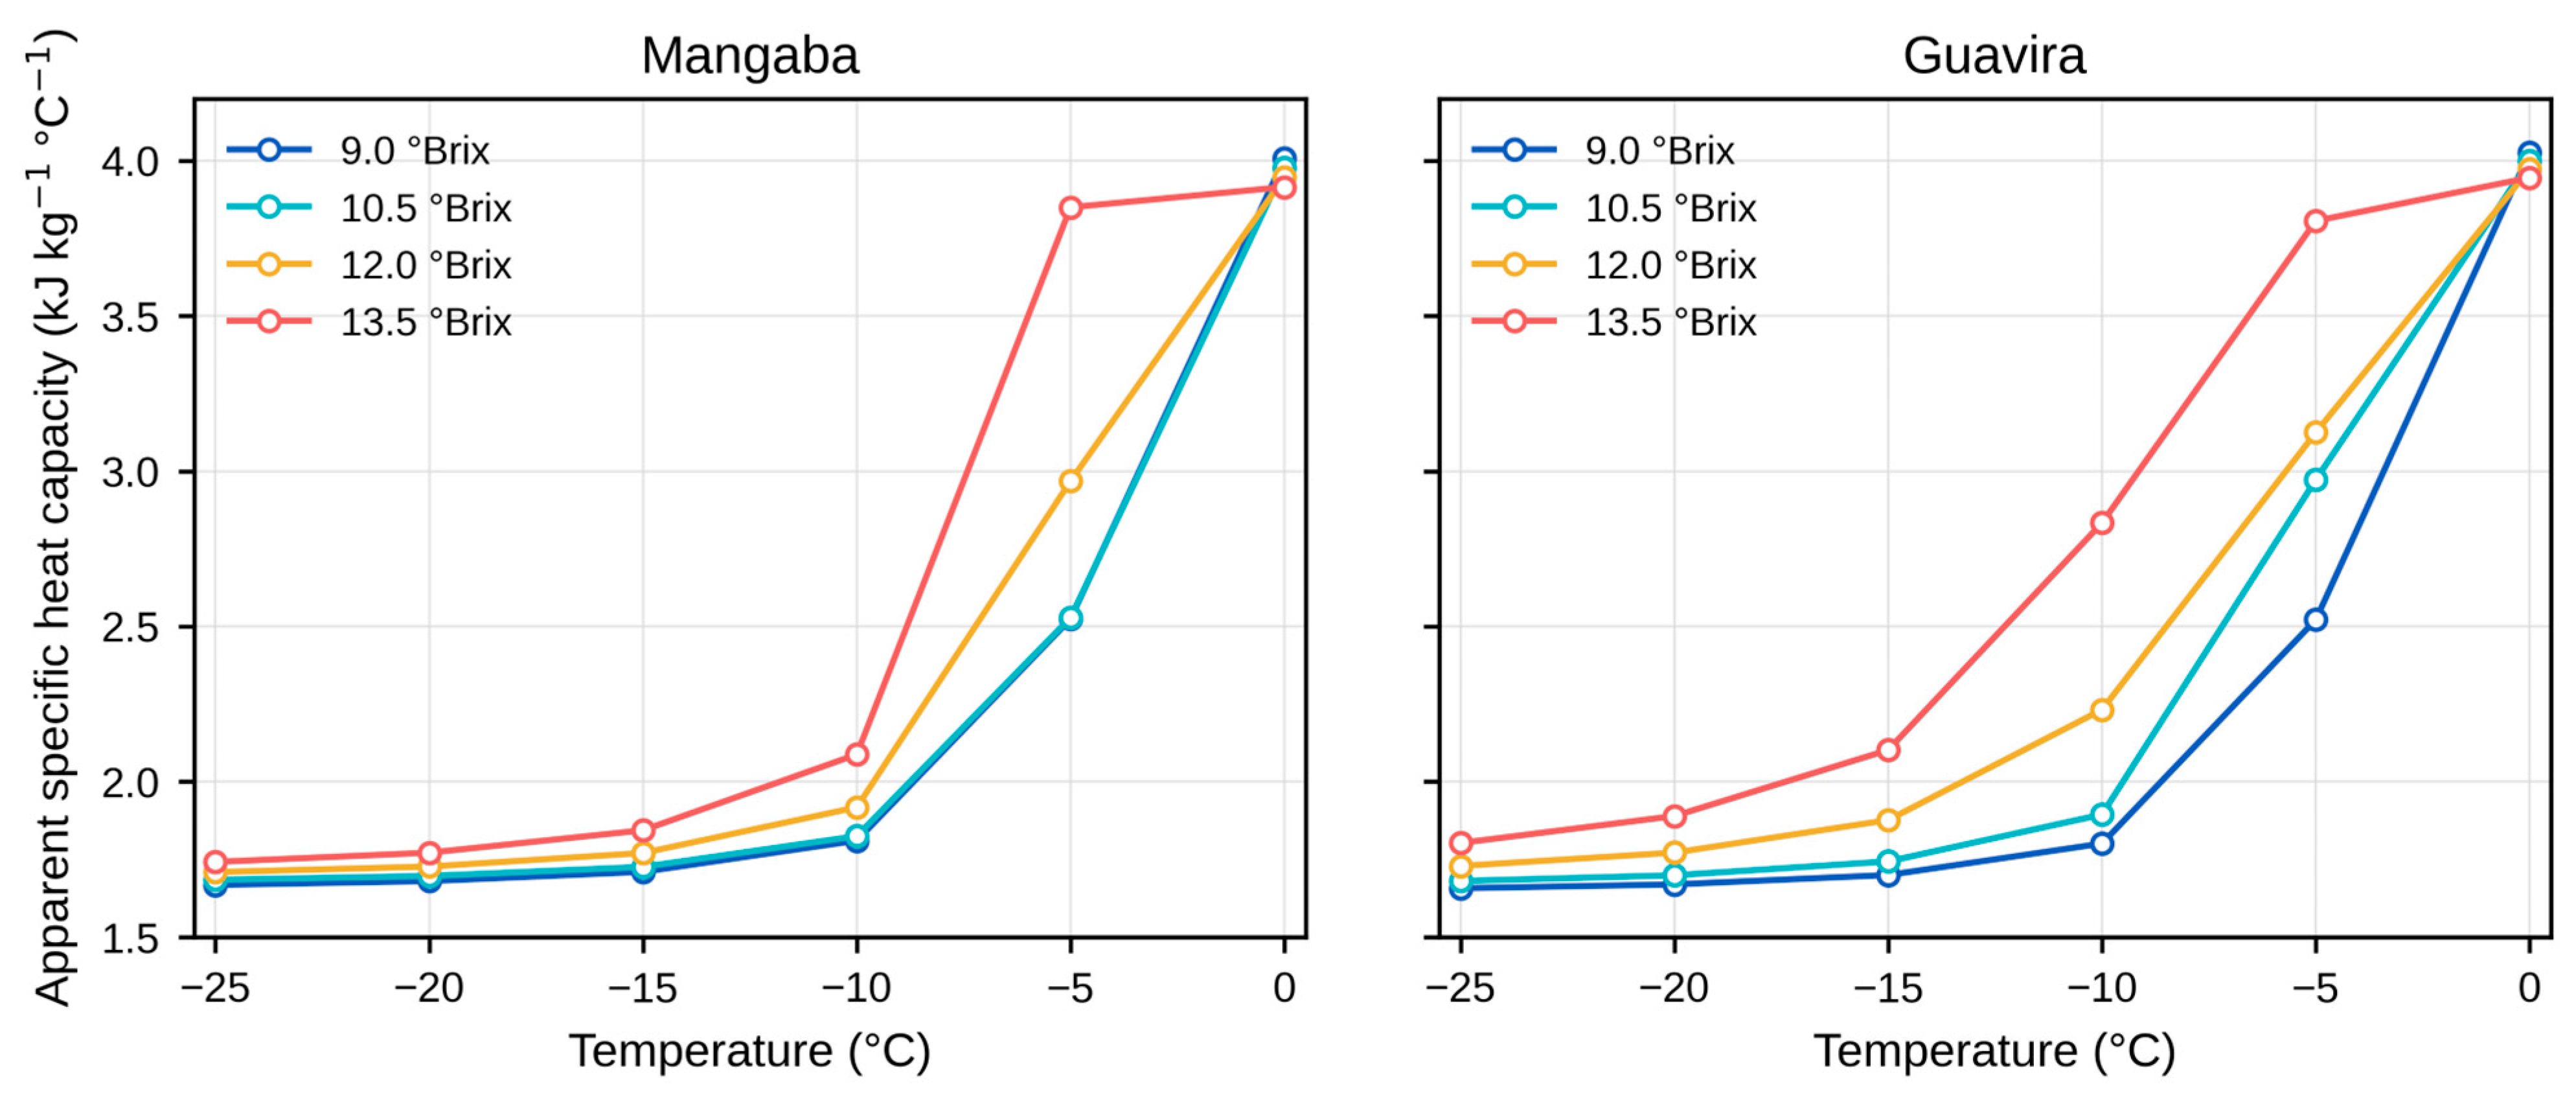
The estimated apparent specific heat capacity (cp) of mangaba and guavira pulps ranged from 1.65 and 4.02 kJ/kg·°C, depending on the temperature and soluble solids content, as shown in Figure 3.
As the temperature increased from −25 °C to 0 °C, cp values rose, attributed to the reduction of the ice fraction and the increase in non-frozen water, which may lead to higher cp. Lower °Brix concentrations present higher cp values, mainly at freezing temperatures, due to higher moisture content and reduced effects of cryo-concentration [9].
At temperatures close to 0 °C, a marked increase in the estimated cp was observed in all samples, with mangaba and guavira reaching up to 4.02 kJ/kg·°C. This behavior is consistent with that of aqueous systems near complete thawing. Sviech et al. [11] reported similar trends in pitanga and araza pulps, observing that cp is significantly influenced by the fraction of unfrozen water above the initial freezing point. Enthalpy changes in fruit-based systems revealed irregular phase transitions influenced by composition and freezing rate.
The cp values of mangaba and guavira are within the range reported for other tropical fruits. Cruzalegui and Siche [29] estimated the specific heat capacities for various fruit derivatives, with values ranging from 1.574 kJ/kg·°C for banana to 4.422 kJ/kg·°C for aguaje. Similarly, Mukama et al. [6] reported cp values between 1.72 and 4.05 kJ/kg·°C for whole fruits, with an average of 3.74 kJ/kg·°C.

3.2.4. Thermal Conductivity (k)

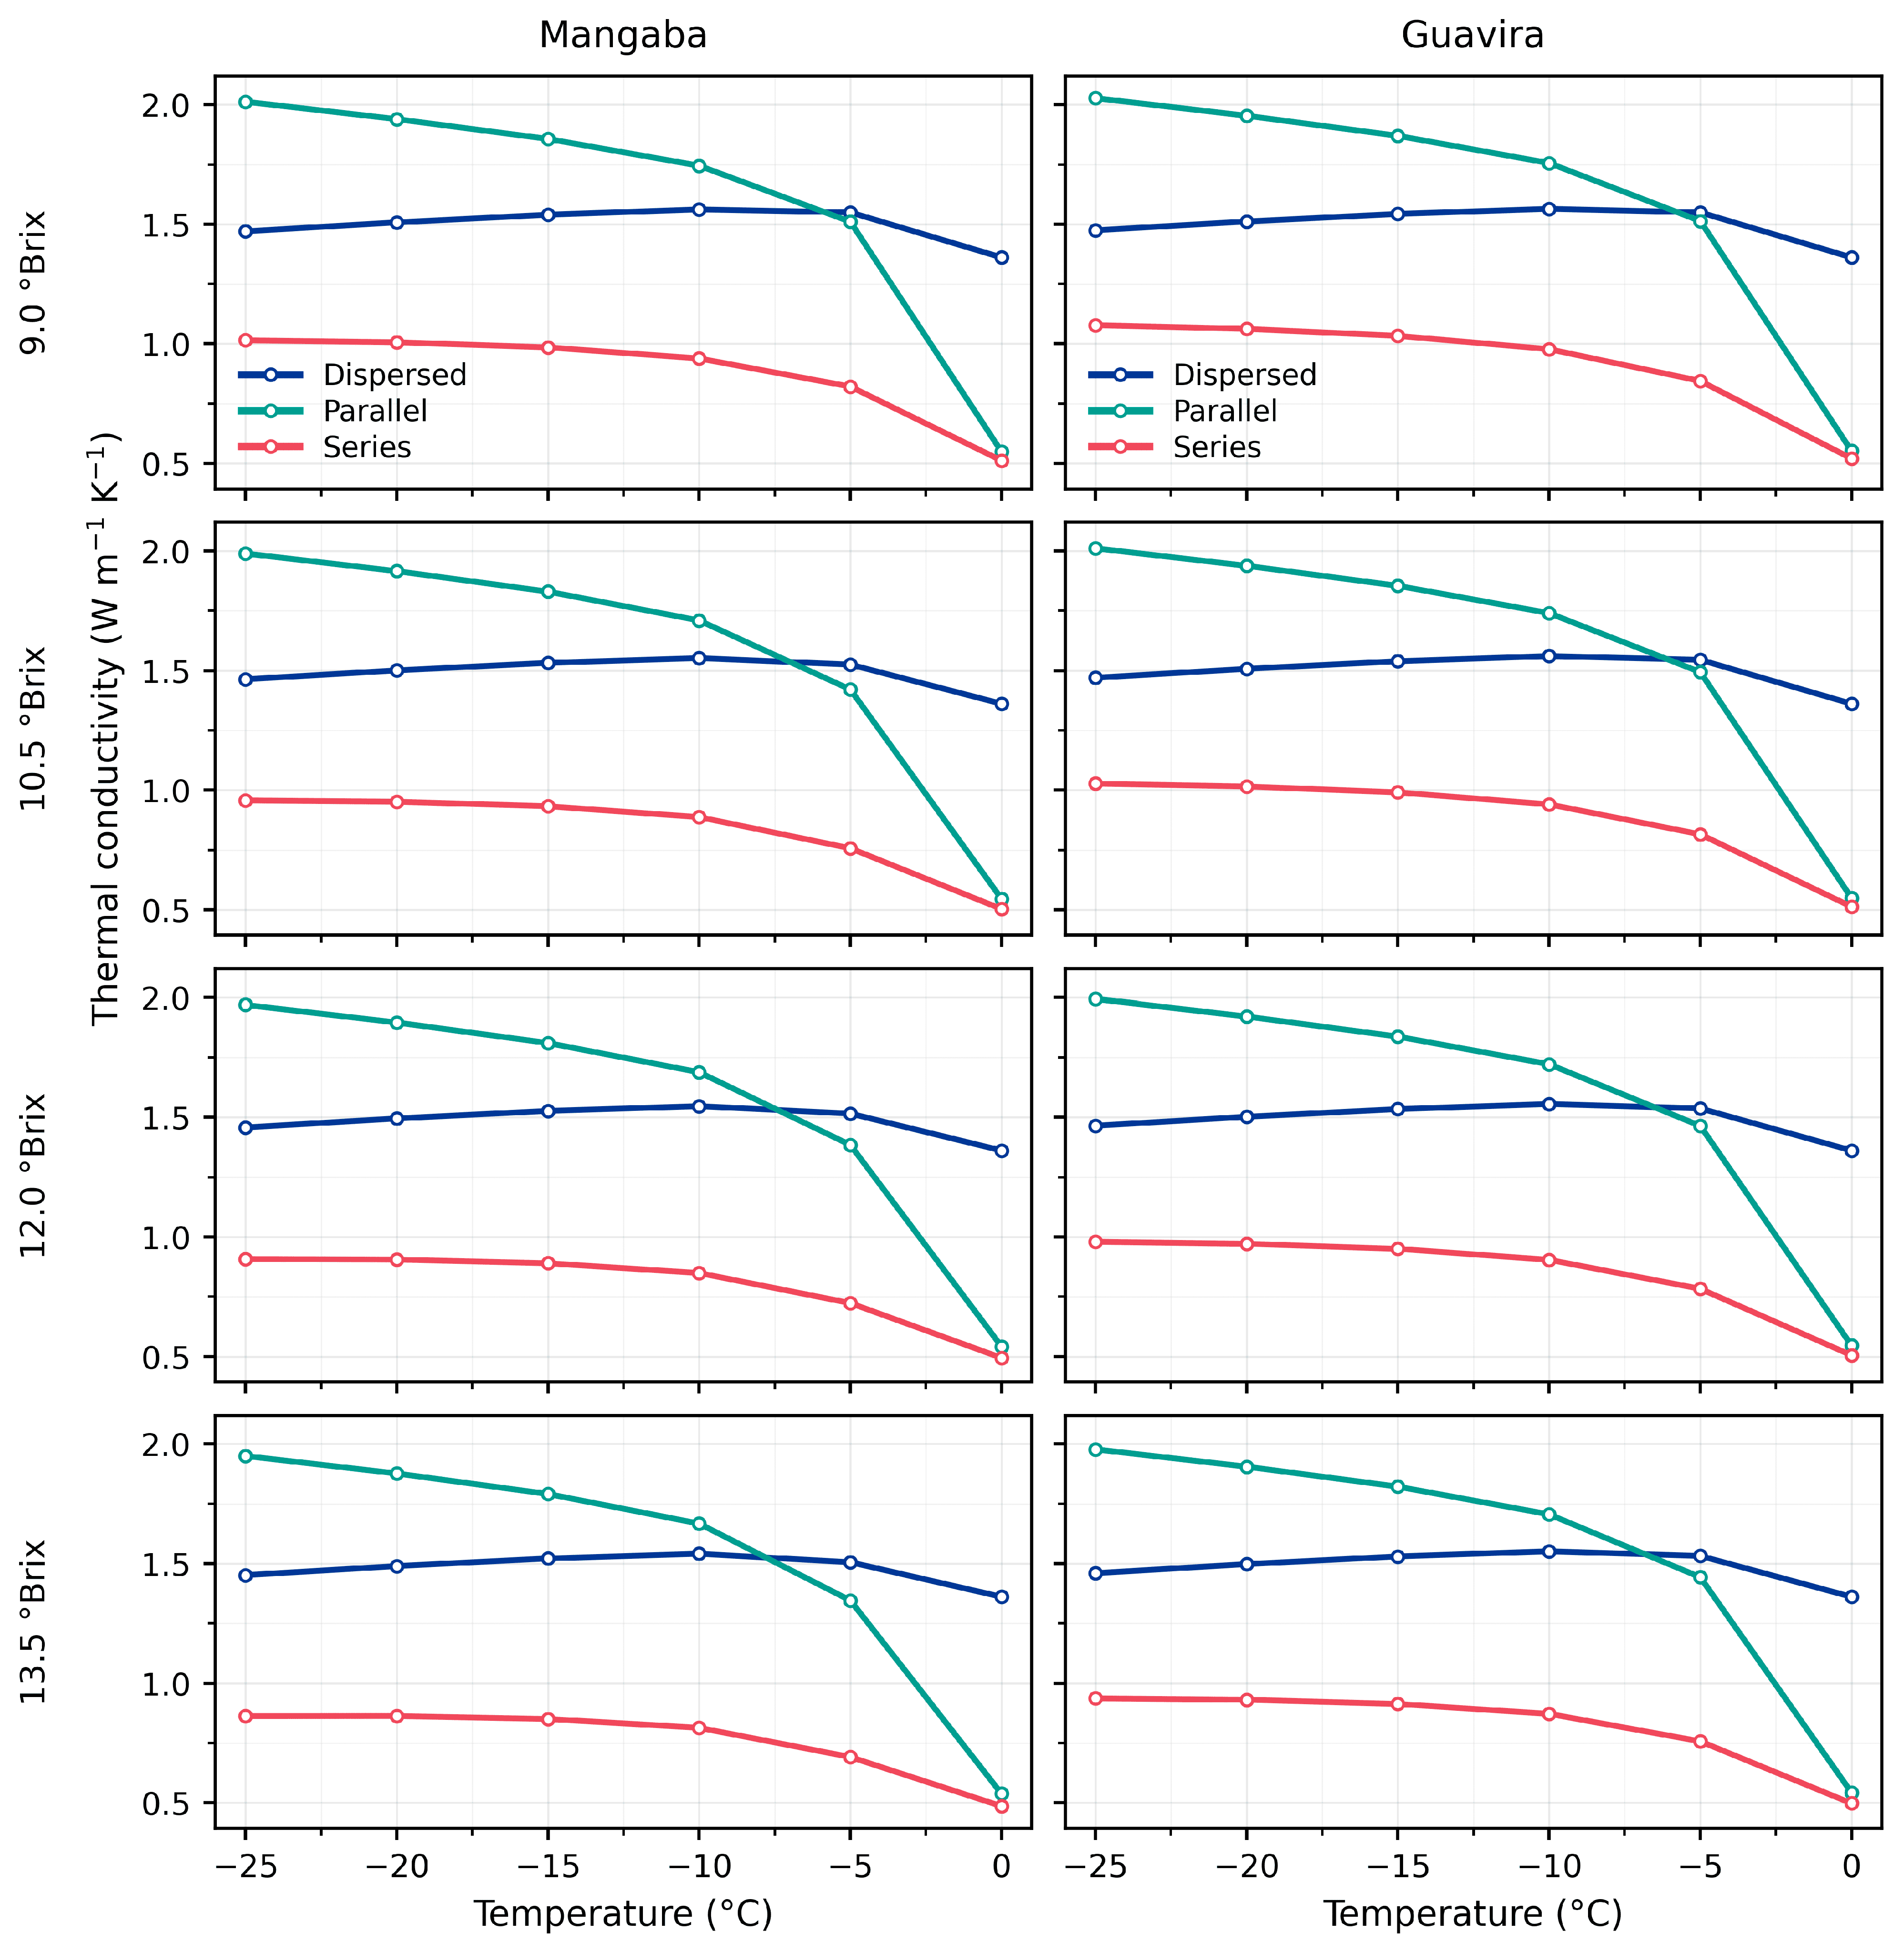
The estimated thermal conductivity values (k), calculated using the series, parallel, and Maxwell–Eucken models, are shown in Figure 4. These models represent different theoretical arrangements of the pulp components relative to the heat flow direction and should be interpreted as model-based estimates rather than experimental measurements.
For both fruits and all soluble solid concentrations, the parallel model produced the highest k values, while the series model produced the lowest values. This behavior was expected because the parallel model represents an upper-bound heat-transfer arrangement, whereas the series model represents a lower-bound arrangement controlled by the successive thermal resistance of the components. The Maxwell–Eucken model provided intermediate values, consistent with its assumption of dispersed phases within a continuous phase.
Regardless of the model applied, thermal conductivity decreased as temperature increased from −25 °C to 0 °C. This trend is associated with the reduction in the ice fraction during warming, since ice has higher thermal conductivity than liquid water [7,30]. Therefore, at lower temperatures, the greater contribution of the ice phase increased the estimated k values.
Higher soluble solid concentrations showed slightly lower thermal conductivity values. This behavior is consistent with the lower moisture and ice fractions of more concentrated pulps, which reduce the contribution of the water/ice phase to heat transfer. Below approximately −10 °C, variations in k became less pronounced, suggesting that the frozen water fraction became the dominant factor controlling heat conduction in the pulp matrix.

3.2.5. Thermal Diffusivity (α)

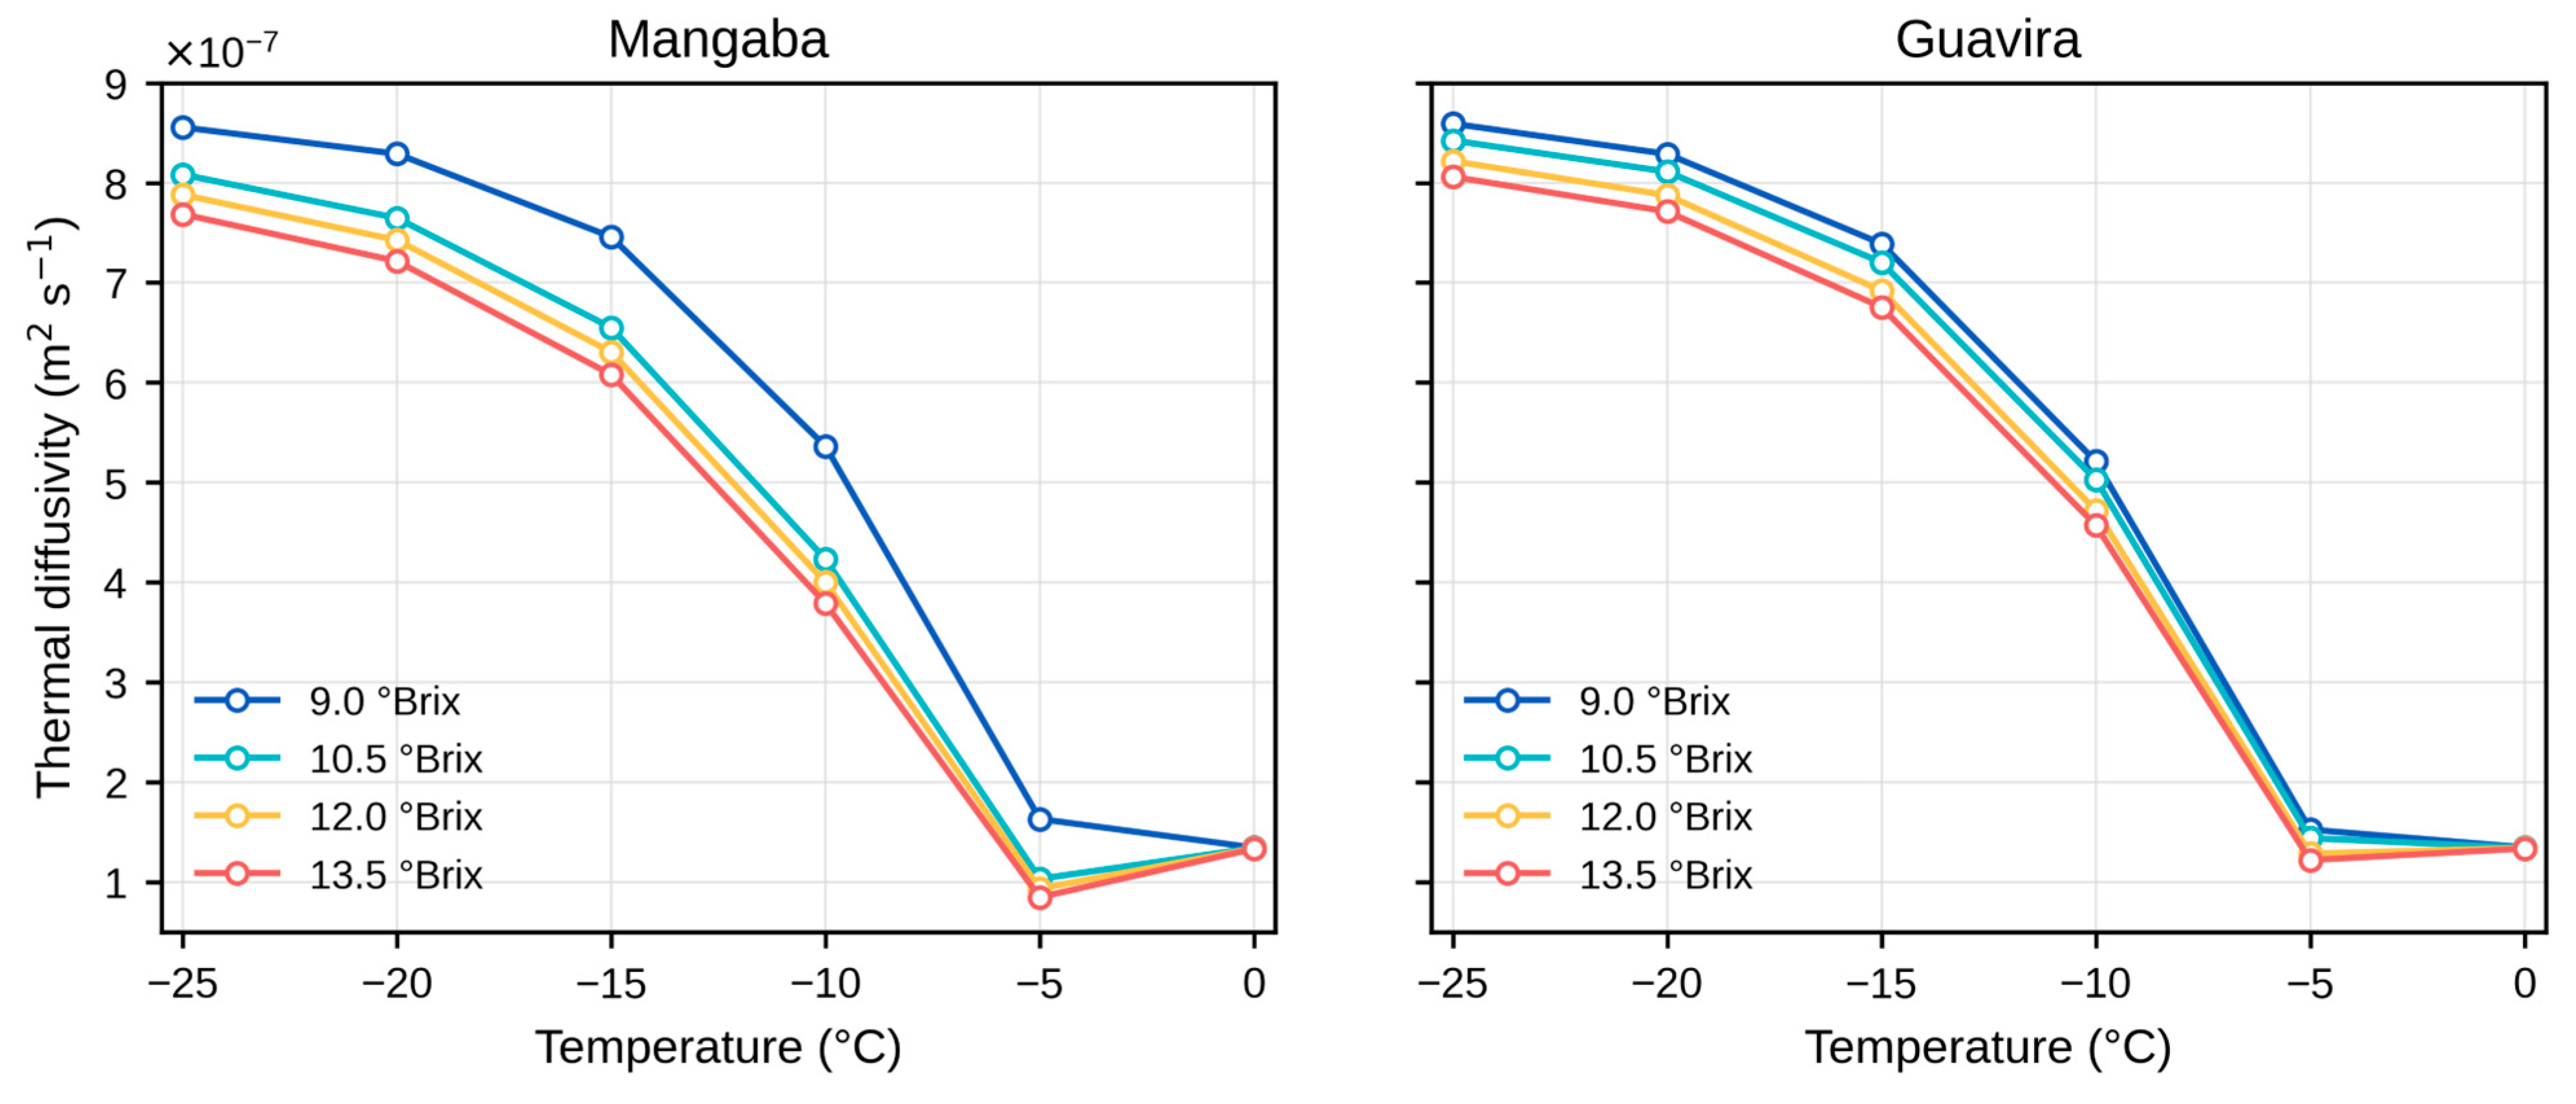
For both mangaba and guavira pulps, the estimated thermal diffusivity increased as temperature decreased below the initial freezing region (Figure 5). This behavior is mainly associated with the increase in ice fraction and the corresponding increase in thermal conductivity, since ice conducts heat more effectively than liquid water [7]. The sharp variation observed near the freezing region reflects the phase transition of water and the resulting changes in the balance between heat conduction and heat storage capacity.
Pulps with lower soluble solid concentration generally presented higher estimated thermal diffusivity values, particularly at lower temperatures. This trend can be attributed to their higher moisture content and greater ice formation, which increased the contribution of the ice phase to heat transfer. Conversely, more concentrated pulps showed slightly lower α values due to their lower water and ice fractions.
The observed behavior is consistent with the dependence of thermal diffusivity on moisture content reported by Pohndorf et al. [31] and with studies showing that thermal properties of foods change markedly during freezing due to phase transitions [9,32]. Therefore, temperature and soluble solid concentration affect thermal diffusivity mainly through their influence on ice formation, thermal conductivity, and apparent heat storage capacity.
The thermal diffusivity of cajá seed was investigated by Gama et al. [33], where the values ranged from 6.93 × 10⁻⁸ m2/s (higher solids content) to 8.74 × 10⁻⁸ m2/s (lower solids content) at lower temperatures. Assawarachan et al. [9] observed that, in passion fruit juice, electrical and thermal properties change sharply near phase transitions, which corroborates the thermal behavior observed in our study.

4. Conclusions

This study experimentally determined the proximate composition and initial freezing temperature of mangaba and guavira pulps at different soluble solid concentrations and used these data as input for model-based estimation of thermophysical properties under freezing conditions. The main conclusions are:
  • The soluble solid concentration affected the initial freezing temperature of both pulps. Mangaba showed a more pronounced reduction in Tf, from −1.6 °C at 9.0 °Brix to −2.8 °C at 13.5 °Brix, while guavira showed a smaller decrease, from −1.7 °C to −2.1 °C over the same concentration range.
  • The proximate composition confirmed the predominance of moisture in both pulps. Guavira presented slightly higher moisture and carbohydrate contents, whereas mangaba showed higher lipid and protein contents. These compositional differences contributed to the predicted thermophysical behavior of each pulp.
  • The estimated ice mass fraction increased as the temperature decreased below the initial freezing region. Pulps with lower soluble solid concentration showed higher ice fractions, reflecting their higher water availability.
  • The estimated density and apparent specific heat capacity varied with temperature and soluble solid concentration. Density increased with increasing °Brix, while apparent specific heat capacity increased as temperature approached 0 °C, mainly due to the greater contribution of unfrozen water.
  • The estimated thermal conductivity and thermal diffusivity were strongly influenced by ice formation. Lower °Brix pulps generally presented higher values, especially at lower temperatures, due to their higher moisture content and greater ice fraction.
  • Overall, mangaba exhibited a stronger freezing point depression with increasing soluble solids, while guavira showed slightly higher moisture content and, consequently, greater water availability for ice formation at comparable concentrations.
  • The results provide useful model-based information for the design, simulation, and optimization of freezing and frozen storage processes involving native Cerrado fruit pulps, allowing a more accurate estimation of the thermal behavior of these products during processing, supporting the definition of more efficient operating conditions, reducing quality losses associated with inadequate freezing, and contributing to the technological and industrial viability of these still underexploited raw materials.

Author Contributions

Conceptualization, J.R.d.J.J. and G.D.J.d.S.; methodology, J.R.d.J.J. and G.D.J.d.S.; software, T.C.V.B. and P.G.S.; validation, J.R.d.J.J. and G.D.J.d.S.; formal analysis, L.C.S.d.O. and G.D.J.d.S.; investigation, J.R.d.J.J. and G.D.J.d.S.; data curation, J.R.d.J.J. and G.D.J.d.S.; writing—original draft preparation, J.R.d.J.J. and G.D.J.d.S.; writing—review and editing, T.C.V.B., J.R.d.J.J. and G.D.J.d.S. All authors have read and agreed to the published version of the manuscript.

Funding

This study was financed in part by the Federal University of Mato Grosso do Sul (UFMS)—Finance Code 001; by the Coordenação de Aperfeiçoamento de Pessoal de Nível Superior—Brasil (CAPES)—Finance Code 001.

Data Availability Statement

The raw data supporting the conclusions of this article will be made available by the authors on request.

Acknowledgments

The authors would like to thank the Coordination for the Improvement of Higher Education Personnel (CAPES), National Council for Scientific and Technological Development (CNPq), Foundation for Research Support of the State of Minas Gerais (FAPEMIG) and Federal University of Minas Gerais (UFMG).

Conflicts of Interest

The authors declare no conflicts of interest.

References

  1. Silva, C.A.d.A.; Fonseca, G.G. Brazilian Savannah Fruits: Characteristics, Properties, and Potential Applications. Food Sci. Biotechnol. 2016, 25, 1225–1232. [Google Scholar] [CrossRef]
  2. Schiassi, M.C.E.V.; de Souza, V.R.; Lago, A.M.T.; Campos, L.G.; Queiroz, F. Fruits from the Brazilian Cerrado Region: Physico-Chemical Characterization, Bioactive Compounds, Antioxidant Activities, and Sensory Evaluation. Food Chem. 2018, 245, 305–311. [Google Scholar] [CrossRef] [PubMed]
  3. Ibourki, M.; Bouzid, H.A.; Bijla, L.; Aissa, R.; Sakar, E.H.; Ainane, T.; Gharby, S.; El Hammadi, A. Physical Fruit Traits, Proximate Composition, Fatty Acid and Elemental Profiling of Almond [Prunus Dulcis Mill. DA Webb] Kernels from Ten Genotypes Grown in Southern Morocco. OCL—Oilseeds Fats Crops Lipids 2022, 29, 9. [Google Scholar] [CrossRef]
  4. Warchold, A.; Pradhan, P. Bioeconomy and Sustainable Development Goals: How Do Their Interactions Matter? Geogr. Sustain. 2025, 6, 100293. [Google Scholar] [CrossRef]
  5. Junqueira, J.R.d.J.; Miyagusku, L.; Balbinoti, T.C.V.; Junqueira, M.C.R.S.; de Lucena, R.F.P. Infrared Drying of Bocaiuva (Acrocomia aculeata) Slices: Drying Kinetics, Energy Consumption, and Quality Characteristics. Food Biophys. 2024, 19, 885–894. [Google Scholar] [CrossRef]
  6. Mukama, M.; Ambaw, A.; Opara, U.L. Thermophysical Properties of Fruit—A Review with Reference to Postharvest Handling. J. Food Meas. Charact. 2020, 14, 2917–2937. [Google Scholar] [CrossRef]
  7. Bonales, L.J.; Rodriguez, A.C.; Sanz, P.D. Thermal Conductivity of Ice Prepared under Different Conditions. Int. J. Food Prop. 2017, 20, S610–S619. [Google Scholar] [CrossRef]
  8. Pereira, C.G.; Resende, J.V.; Pereira, G.G.; Giarola, T.M.O.; Prado, M.E.T. Thermal Conductivity Measurements and Predictive Models for Frozen Guava and Passion Fruit Pulps. Int. J. Food Prop. 2013, 16, 778–789. [Google Scholar] [CrossRef]
  9. Assawarachan, R.; Tantikul, S. Modeling the Effects of Temperature and Total Soluble Solids on Electrical Conductivity of Passion Fruit Juice During Ohmic Heating. Processes 2025, 13, 1324. [Google Scholar] [CrossRef]
  10. Goldoni, J.; Giacobbo, C.L.; Galon, L.; Zarzzeka, C.; Uberti, A.; Lugaresi, A. Physicochemical Characterization of Fruits of Campomanesia guazumifolia (Cambess.) O. Berg (Myrtaceae). Acta Sci. Biol. Sci. 2019, 41, e45923. [Google Scholar] [CrossRef]
  11. Sviech, F.; Ubbink, J.; Prata, A.S. Analysis of the Effect of Sugars and Organic Acids on the Ice Melting Behavior of Pitanga and Araza Pulp by Differential Scanning Calorimetry (DSC). Thermochim. Acta 2021, 700, 178934. [Google Scholar] [CrossRef]
  12. Zhu, J. A Three-Cell Effective Thermal Conductivity Model of Two-Phase Porous Media. Int. J. Heat Mass Transf. 2023, 209, 124127. [Google Scholar] [CrossRef]
  13. Instituto Adolfo Lutz. Métodos Físicos-Quimicos Para Análise de Alimentos; Instituto Adolfo Lutz: São Paulo, Brazil, 2008; Volume 5. [Google Scholar]
  14. Chitarra, M.I.F.; Chitarra, A.B. Pós-Colheita de Frutos e Hortaliças: Fisiologia e Manuseio, 2nd ed.; Editora UFLA: Lavras, Brazil, 2005. [Google Scholar]
  15. AOAC International. Official Methods of Analysis of AOAC International, 20th ed.; AOAC International: Rockville, MD, USA, 2016. [Google Scholar]
  16. Carson, J.K. Review of Effective Thermal Conductivity Models for Foods. Int. J. Refrig. 2006, 29, 958–967. [Google Scholar] [CrossRef]
  17. Choi, Y.; Okos, M.R. Effects of Temperature and Composition on the Thermal Properties of Foods. In Food Engineering and Process Applications; Elsevier Applied Science Publishers: London, UK, 1986; Volume 1, pp. 93–101. [Google Scholar]
  18. American Society of Heating. ASHRAE Handbook: Refrigeration; Refrigeration and Air-Conditioning Engineers: Atlanta, GA, USA, 2002. [Google Scholar]
  19. Ramos, A.M.; Ibarz, A. Density of Juice and Fruit Puree as a Function of Soluble Solids Content and Temperature. J. Food Eng. 1998, 35, 57–63. [Google Scholar] [CrossRef]
  20. Islam, S.; Bhat, G. A Model for Predicting Thermal Conductivity of Porous Composite Materials. Heat Mass Transf. 2023, 59, 2023–2034. [Google Scholar] [CrossRef]
  21. Mari, J.; Mari, M.; Ferreira, M.; Conceição, W.; Andrade, C. A Simple Method to Estimate the Thermal Diffusivity of Foods. J. Food Process Eng. 2018, 41, e12821. [Google Scholar] [CrossRef]
  22. Xu, B.; Sylvain Tiliwa, E.; Yan, W.; Roknul Azam, S.M.; Wei, B.; Zhou, C.; Ma, H.; Bhandari, B. Recent Development in High Quality Drying of Fruits and Vegetables Assisted by Ultrasound: A Review. Food Res. Int. 2022, 152, 110744. [Google Scholar] [CrossRef] [PubMed]
  23. Zitha, E.Z.M.; Machado, P.d.S.; Junqueira, L.A.; João, E.C.B.; de Resende, J.V.; Carvalho, E.E.N.; Vilas Boas, E.V. de B. Impact of Processing, Packages, and Storage on Quality of Mangaba (Hancornia speciosa Gomes) Jelly. J. Food Process. Preserv. 2020, 44, e14814. [Google Scholar] [CrossRef]
  24. Sviech, F.; Cardoso, P.; Oliveira, R.A.; Ubbink, J.; Prata, A.S. State Diagrams and Water Sorption Isotherms of Pitanga, Ciriguela Araza, Mango, and Guava. J. Food Process Eng. 2023, 46, e14370. [Google Scholar] [CrossRef]
  25. Castro, M.C.; Siraque, M.; Alves, E.S.; Saqueti, B.H.F.; Ramos, L.W.C. Química Na Cozinha Uma Sequência Didática Para o Ensino de Propriedades Coligativas. Res. Soc. Dev. 2021, 10, e335101422120. [Google Scholar] [CrossRef]
  26. Sousa, S.d.F.; Queiroz, A.J.d.M.; Figueirêdo, R.M.F.; Silva, F.B. Comportamento Reológico das Polpas de Noni Integral e Concentradas. Braz. J. Food Technol. 2017, 20, 1–10. [Google Scholar] [CrossRef][Green Version]
  27. Zhao, Y.; Takhar, P.S. Freezing of Foods: Mathematical and Experimental Aspects. Food Eng. Rev. 2017, 9, 1–12. [Google Scholar] [CrossRef]
  28. Rydzak, L.; Kobus, Z.; Nadulski, R.; Wilczyński, K.; Pecyna, A.; Santoro, F.; Sagan, A.; Starek-Wójcicka, A.; Krzywicka, M. Analysis of Selected Physicochemical Properties of Commercial Apple Juices. Processes 2020, 8, 1457. [Google Scholar] [CrossRef]
  29. Cruzalegui, R.J.; Siche, R. Thermal Properties of Fruits and Their Derivatives: Fundamentals and Estimation Methods. Food Res. 2025, 9, 159–171. [Google Scholar] [CrossRef] [PubMed]
  30. Klinbun, W.; Rattanadecho, P. An Investigation of the Dielectric and Thermal Properties of Frozen Foods over a Temperature from −18 to 80 °C. Int. J. Food Prop. 2017, 20, 455–464. [Google Scholar] [CrossRef]
  31. Pohndorf, R.S.; da Rocha, J.C.; Lindemann, I.; Peres, W.B.; de Oliveira, M.; Elias, M.C. Physical Properties and Effective Thermal Diffusivity of Soybean Grains as a Function of Moisture Content and Broken Kernels. J. Food Process Eng. 2018, 41, e12626. [Google Scholar] [CrossRef]
  32. Carson, J.K.; Hoang, D.K. Modelling Thermal Diffusivity of Meat during Freezing. Int. J. Food Eng. 2022, 18, 627–632. [Google Scholar] [CrossRef]
  33. Gama, M.J.A.; Mata, M.E.R.M.C.; Duarte, M.E.M.; Aragão, R.F.; Farias, P.A. Apparent Thermal Diffusivity of Cajá Seeds at Temperatures above Freezing to Ultra-Low Temperatures. Rev. Bras. Eng. Agrícola Ambient. 2012, 16, 303–308. [Google Scholar]
Figure 1. Ice mass fraction of the mangaba and guavira pulps at different concentrations and the temperature range from 0 to −25 °C.
Thermo 06 00051 g001
Figure 2. Estimated density of mangaba and guavira pulps at different soluble solid concentrations over the temperature range from 0 to −25 °C.
Thermo 06 00051 g002
Figure 3. Estimated apparent specific heat capacity of mangaba and guavira pulps at different soluble solid concentrations over the temperature range from 0 to −25 °C.
Thermo 06 00051 g003
Figure 4. Estimated thermal conductivity of mangaba and guavira pulps at different soluble solid concentrations over the temperature range from 0 to −25 °C, calculated using the series, parallel, and Maxwell–Eucken models.
Thermo 06 00051 g004
Figure 5. Estimated thermal diffusivity of mangaba and guavira pulps at different soluble solid concentrations over the temperature range from 0 to −25 °C.
Thermo 06 00051 g005
Table 1. Models for determining the density of food components.
Component [g/100 g]Density Functions [kg/m3]Equation
Protein ρ = 1.3299 × 10 3 5.184 × 10 1 T (2)
Lipid ρ = 9.2559 × 10 2 4.1757 × 10 1 T (3)
Carbohydrates ρ = 1.5991 × 10 3 3.1046 × 10 1 T (4)
Fiber ρ = 1.3115 × 10 3 3.6589 × 10 1 T (5)
Ash ρ = 2.4238 × 10 3 2.8063 × 10 1 T (6)
Moisture ρ = 9.9718 × 10 2 + 3.1439 × 10 3 T 3.7574 × 10 3 T 2 (7)
Ice ρ = 9.1689 × 10 2 1.3071 × 10 1 T (8)
American Society of Heating [18].
Table 2. Models for determining the apparent specific heat capacity of food components.
Component [g/100 g]Specific Heat Functions [kJ/kg K]Equation
Protein c p = 2.0082 + 1.2089 × 10 3 T 1.3129 × 10 6 T 2 (10)
Lipid c p = 1.9842 + 1.4733 × 10 3 T 4.8008 × 10 6 T 2 (11)
Carbohydrates c p = 1.5488 + 1.9625 × 10 3 T 5.9399 × 10 6 T 2 (12)
Fiber c p = 1.8459 + 1.8306 × 10 3 T 4.6509 × 10 6 T 2 (13)
Ash c p = 1.0926 + 1.8896 × 10 3 T 3.6817 × 10 6 T 2 (14)
Moisture c p = 4.0817 9.0864 × 10 3 T 9.9516 × 10 4 T 2 (15)
Ice c p = 2.0623 + 6.0769 × 10 3 T (16)
American Society of Heating [18].
Table 3. Models for determining the thermal conductivity of food components.
Component [g/100 g]Thermal Conductivity Functions [W/m K]Equation
Protein k = 1.7881 × 10 1 + 1.1958 × 10 3 T 2.7178 × 10 6 T 2 (18)
Lipid k = 1.8071 × 10 1 + 2.7604 × 10 3 T 1.7749 × 10 7 T 2 (19)
Carbohydrates k = 2.0141 × 10 1 + 1.3874 × 10 3 T 4.3312 × 10 6 T 2 (20)
Fiber k = 1.8331 × 10 1 + 1.2497 × 10 3 T 3.1683 × 10 6 T 2 (21)
Ash k = 3.2962 × 10 1 + 1.4011 × 10 3 T 2.9069 × 10 6 T 2 (22)
Moisture k w = 5.7109 × 10 1 + 1.7625 × 10 3 T 6.7036 × 10 6 T 2 (23)
Ice k = 2.2196 6.2489 × 10 3 T + 1.0154 × 10 4 T 2 (24)
American Society of Heating [18].
Table 4. Proximate composition of mangaba and guavira pulps at different concentrations.
Component [g/100 g]9.0 °Brix10.5 °Brix12.0 °Brix13.5 °Brix
Mangaba
Moisture92.060 ± 1.07590.337 ± 0.98789.414 ± 0.96588.901 ± 0.996
Lipid0.562 ± 0.0410.656 ± 0.0430.751 ± 0.0330.844 ± 0.037
Protein0.964 ± 0.0671.125 ± 0.0711.285 ± 0.0721.446 ± 0.055
Ash0.225 ± 0.0210.262 ± 0.0180.300 ± 0.0120.337 ± 0.013
Fiber2.732 ± 0.0973.187 ± 0.0883.642 ± 0.0884.098 ± 0.071
Carbohydrates3.455 ± 0.0874.031 ± 0.0854.607 ± 0.0665.183 ± 0.072
Guavira
Moisture92.921 ± 1.10991.749 ± 1.00490.568 ± 0.98489.396 ± 0.922
Lipid0.121 ± 0.0040.143 ± 0.0050.161 ± 0.0090.179 ± 0.009
Protein0.339 ± 0.0100.396 ± 0.0120.453 ± 0.0290.514 ± 0.016
Ash0.213 ± 0.0260.248 ± 0.0310.284 ± 0.0170.325 ± 0.030
Fiber2.746 ± 0.1043.204 ± 0.0983.662 ± 0.0914.122 ± 0.115
Carbohydrates3.653 ± 0.0734.262 ± 0.0654.871 ± 0.0335.481 ± 0.063
Table 5. Initial freezing temperatures of the mangaba and guavira pulps at different concentrations.
Concentration [°Brix]MangabaGuavira
9.0−1.6 ± 0.1 °C−1.7 ± 0.1 °C
10.5−2.4 ± 0.1 °C−1.8 ± 0.1 °C
12.0−2.6 ± 0.1 °C−2.0 ± 0.1 °C
13.5−2.8 ± 0.1 °C−2.1 ± 0.1 °C
Disclaimer/Publisher’s Note: The statements, opinions and data contained in all publications are solely those of the individual author(s) and contributor(s) and not of MDPI and/or the editor(s). MDPI and/or the editor(s) disclaim responsibility for any injury to people or property resulting from any ideas, methods, instructions or products referred to in the content.