Article

Enhancing Solar Desalination: A Water-Channel-Integrated Modified Double-Slope Solar Still for Diverse Water Treatment Applications


by
Thavamani Jeyaraj
1,
Dhanasekar Sevugamoorthy
2,
GaneshKumar Poongavanam
1,*,
Ramalingam Senthil
1 and
Vinothkumar Sivalingam
3
1
Department of Mechanical Engineering, SRM Institute of Science and Technology, Kattankulathur, Chennai 603203, Tamil Nadu, India
2
Department of Civil Engineering, SRM Institute of Science and Technology, Kattankulathur, Chennai 603203, Tamil Nadu, India
3
Key Laboratory of High-Efficiency and Clean Mechanical Manufacture, National Demonstration Centre for Experimental Mechanical Engineering Education, School of Mechanical Engineering, Shandong University, Jinan 250061, China
*
Author to whom correspondence should be addressed.
Thermo 2026, 6(3), 52; https://doi.org/10.3390/thermo6030052
Submission received: 16 May 2026 / Revised: 15 June 2026 / Accepted: 25 June 2026 / Published: 1 July 2026

Abstract

This experimental study investigates the performance and sustainability of a modified double-slope solar still (MDSSS) integrated with a combined water channel to enhance evaporation rates. The integration of the water channel ensures uniform water flow and enhanced heat distribution across the basin surface, thereby improving thermal performance. Experiments were conducted using three types of feed water, groundwater, saline water, and domestic wastewater, to assess the system’s versatility and effectiveness in various water desalination applications. Under identical meteorological conditions, thermal parameters, distillate yield, energy efficiency, and sustainability were analyzed. The results revealed that incorporating the water channel significantly increased evaporation and condensation rates compared to the conventional double-slope solar still (DSSS) configuration. Also, the performance of an MDSSS was evaluated under various water qualities, including physical, chemical, and biological parameters. The experiment begins at half the optimal water depth for water quality, with the remaining half passing through an open-channel attachment into the solar still basin. The modified system effectively reduced pollutants, achieving a 98.18% reduction in chemical oxygen demand in groundwater, complete salt removal from saline water, and a 96.67% reduction in sewage water.

1. Introduction

The amount of water a person should drink each day is influenced by several factors, including age, gender, activity level, and climate [1]. The U.S. National Academies of Sciences, Engineering, and Medicine recommends that adult men should consume 3.7 L of water daily, while adult women should consume 2.7 L [2]. In 2022, adults in India between the ages of 30 and 44 drank an average of 2.26 L of water daily, while those aged 19 and below consumed an average of 1.97 L. International water-access guidelines state that each person needs 50 to 100 L of safe water per day to meet basic domestic needs, such as drinking, cooking, personal hygiene, and sanitation. However, the actual amount of water required for drinking is only a small portion of this total daily requirement [3]. Water use in homes is influenced by factors such as water-consuming activities, household size, and appliance and fixture use. ISO recommends conducting a life-cycle assessment to evaluate the environmental impact of water use in buildings. The details of water usage are listed in Figure 1. Inadequate wastewater management worsens environmental contamination in rural areas, polluting water supplies and spreading disease to isolated communities. Wastewater discharges into surface waters are becoming increasingly critical across regions worldwide and will remain so. Wastewater is categorized by source and may contain physical, chemical, and biological contaminants. It includes sewage water, black water, greywater, and industrial wastewater [4]. Wastewater treatment is crucial for micro screening [5], pumping [6], removing grit [7], settling [8], aeration tanks [9], secondary settling [10], filtering [11], disinfection [12], and oxygen uptake [13] to protect the environment and public health. Conventional wastewater treatment plants struggle to eliminate contaminants of emerging concern, heavy metals, and E. coli owing to their small size, persistence, and complication [14]. Further, a system installation may not be suitable for every home and could have drawbacks.
The solar distillation process is a simple water treatment method that relies on sunlight. It is a slow process, but it purifies water of various quality types. Solar wastewater treatment is a sustainable method that includes pretreatment, biological treatment, and disinfection using a solar still [16]. For example, a solar still system was installed at Iran’s Sarkhon Gas Refinery zone to treat oily effluent, reducing dissolved solids and conductivity and allowing the treated water to be used for agricultural purposes [17]. A pilot-scale solar still was utilized to assess the effectiveness of solar distillation for managing wastewater from an olive mill. Conventional distillation experiments showed higher phenol concentrations, while heating underfloor increased production rates [18]. A solar still greenhouse system was developed to treat sewage, recover diesel, and use its nutrients for plant cultivation. It demonstrated solar radiation deodorization, reduced biochemical oxygen demand (BOD), and produced coliform-free condensates [19]. Since one-third of the world’s population lives in water-stressed nations and two-thirds are predicted to experience water scarcity by 2025, solar energy-based photocatalytic wastewater treatment holds promise for resolving the global water issue. Advanced oxidation processes can improve the utilization of water sources and support sustainable development [20].
Solar stills come in various types; namely, single [21], double [22], tubular [23], hemispherical [24], hemispherical [25,26], triangular [27], pyramid-shaped [28], semi-cylinder [29], and ‘V’-type [30], were used for collecting pure water for different purposes. Solar still productivity is enhanced by increasing water temperature, modifying the structure, adding reflectors, using wicks/fins, and using external heating sources. Algeria has improved solar still yield using treated sand, with yield inversely proportional to sand particle diameter [31]. Solar desalination, using activated carbon, graphite, coal, and wood charcoal, improves water absorption in isolated regions like southern Algeria, increasing daily yield by 79.39%, 57.58%, 50.30%, and 18.18%, respectively [32]. Solar stills are a valuable solution for purifying brackish and saltwater for drinking, and factors affecting production include climatic conditions, operational techniques, and design parameters. Methods such as sponge cubes and cuprous oxide nanoparticles have been developed to enhance production and yield [33]. Conventional solar still walls are typically painted black to prevent condensation of water vapor and enhance evaporation [34]. Thermoforming has enabled the creation of a single-slope solar still capable of producing high-quality drinking water from wastewater with exceptional efficiency [35]. A sustainable technique for cleaning contaminated water is evaporation-based freshwater generation powered by solar energy, with studies showing high pollutant removal rates and reduced salt concentration in real wastewater [36]. The parameters for testing water quality are divided into three categories: physical, biological, and chemical. When an external water source becomes contaminated, harbor staff are required to take corrective measures and maintain ongoing water quality monitoring within the fisheries harbor complex. In any water-purification system, the yield rate is influenced by multiple factors, such as ambient temperature, relative humidity, water temperature, intake pressure, and supply power or natural sources [37].
The efficiency of a solar still is determined by its ability to purify water. Several factors, such as solar intensity, wind speed, basin and glass cover temperatures, water surface area, basin padding, feed water temperature, angle of glass cover, and water depth, can influence the productivity of a solar still. This study aims to maintain optimal water depth in the basin using a channel attachment and to compare the yield with that of the base system. Further investigation of water quality from a 1 cm basin water depth for different water attributes, such as brackish, saline, and sewage water, in the same solar still structure. Three solar stills were tested in the climatic conditions of Chennai. The work is innovative in predicting water quality verification for three types of raw water: brackish groundwater, 20,000 ppm saline water, and domestic sewage. It is done in a DSSS with a feedwater channel attachment to maintain a minimum basin water depth for maximum yield rate. Water quality is monitored using standard measurement equipment.
Pure water is typically colorless, but it can become colored by dissolved organic and inorganic substances. Reduced oxygen, organic pollution, phenols, and H2S can cause odor in water. Turbidity measures suspended matter and should be below one NTU [38]. Water samples from textile mills in Rawalpindi and Islamabad, Pakistan, showed high levels of heavy metals, exceeding WHO drinking water limits. Water is used for irrigation after treatment [39]. Effective wastewater management strategies are necessary to address water scarcity, population growth, and industrialization [40,41]. Recent research on removing fragrance materials from wastewater treatment is complex due to their semi-volatile nature. Efficient removal depends on biodegradability, physicochemical properties, and plant operation [42]. Nanomaterial-based technologies, such as carbon nanotubes, copper, graphene, iron, titanium, and polymer-based nanoadsorbents, offer promising solutions [43]. Stream buffers, vegetated and wetland cover, effectively remove pollutants such as metals, nutrients, pesticides, and sediment. Wastewater treatment facilities face challenges in meeting environmental regulations and reducing costs. Turbidity, a measure of fluid clarity, is frequently utilized in wastewater treatment as an indicator of effluent quality, enhancing operational monitoring efficiency through easy measurement and automation. Existing methods require human intervention and are labor-intensive [44]. The research reveals a strong correlation between turbidity, total suspended solids (TSS), and Chemical Oxygen Demand (COD) in SBR plant effluent, aiding in continuous monitoring of wastewater quality [45]. Thus, wastewater treatment varies based on water quality and intended use. The treatment aligns with Sustainable Development Goals 7 and 9 by utilizing affordable, clean energy, addressing domestic and industrial needs, and fostering innovation and infrastructure.
Wastewater treatment faces challenges in effectively treating organic chemicals. Advanced technologies such as activated carbon adsorption, oxidation, and membrane filtration are necessary to remove complex pollutants. Inadequate wastewater treatment can compromise drinking water quality, raise health concerns, and expose people to chemicals, pharmaceuticals, and microbial hazards during reuse [46]. Maintaining optimal pH levels is crucial for effective chemical treatment in industrial wastewater. pH affects processes such as coagulation, precipitation, ion exchange, neutralization, adsorption, oxidation-reduction reactions, chelation, and disinfection. It influences particle charge, precipitation, ion-exchange resins, neutralization, adsorption, oxidation-reduction reactions, chelation, and disinfection methods, ensuring efficient removal of contaminants, reducing heavy-metal toxicity, and enhancing disinfection efficiency [47]. When using microorganisms to remove organic material in wastewater treatment, it is crucial to maintain dissolved oxygen (DO) levels around 2 mg/L [48]. Low DO levels may indicate poor water quality and high organic content. A water sample is digested for a specific duration using a chemical oxidant, typically potassium dichromate, and an acidic solution, and the oxygen consumption is then measured. A higher COD value indicates a greater concentration of pollutants in the water [49]. The sample water classification based on calcium carbonate content ranges from 0 to 60 mg/L, with moderately hard water ranging from 61 to 120 mg/L, hard water ranging from 121 to 180 mg/L, and very hard water exceeding 180 mg/L [50,51]. But these waters typically have higher electrical conductivity than other water types, with potable water ranging from 30 to 1500 mS/cm, freshwater streams from 100 to 2000 mS/cm, industrial wastewater from 10,000 mS/cm, and seawater from 55,000 mS/cm [52]. Thus, wastewater treatment is the process of analyzing and removing chemical parameters from wastewater to minimize environmental risks.
Biological wastewater treatment effectively removes pollutants and nutrients from various wastewater types, but traditional methods face challenges such as low efficiency, high energy consumption, and excess sludge generation. Environmental laws require cost-effective strategies to protect water from pollution [53]. Biological methods have gained attention in recent years, and their bioremediation technologies significantly contribute to reducing water pollution [54,55]. The biological wastewater treatment method, a widely used and cost-effective process involving biodegradation and bleaching by microorganisms, fungi, bacteria, yeasts, and algae, has limitations such as an inability to completely remove color, resistance to complex xenobiotic dyes, large land area requirements, and limited design and operation flexibility [56]. Appropriate treatment techniques, such as aerobic and anaerobic biological treatment, coagulation, filtration, and flocculation, are necessary to remove organic material from raw wastewater with high BOD levels. An important metric in wastewater treatment is the BOD, which indicates the amount of dissolved oxygen aerobic bacteria require to break down organic material. High BOD levels lead to oxygen depletion, affecting aquatic life and water quality. E. coli concentrations are linked to high TSS, turbidity, phosphorus, nitrate, and BOD concentrations due to their presence with particles. The sand filter is a popular, cost-effective, and efficient method for disinfecting E. coli and enterococcus, with a 99% removal rate [57].
The literature review focuses on understanding wastewater treatment and the challenges associated with its physical, chemical, and biological parameters using various wastewater treatment methods. All are more expensive and require higher energy costs. Few methods have limited resistance to cleaning chemicals, solvents, and pH ranges. Its fouling factor affects the system’s lifetime and performance. Solar still overcomes these factors and addresses purification issues. The work focuses on modifying the DSSS to reduce water depth during sunny hours, thereby enhancing yield and evaporation. The system underwent various water quality tests for purification at the Kattankulathur location. The novelty of the work is that it preheats the basin water using a channel attachment in the DSSS and evaluates its performance with different water qualities. This modified solar still efficiently addresses water scarcity in the warmest regions affected by climate change and contributes to fulfilling Sustainable Development Goal 6 by providing clean water.

2. Materials and Methods

2.1. Conditions Related to Geography and Climate

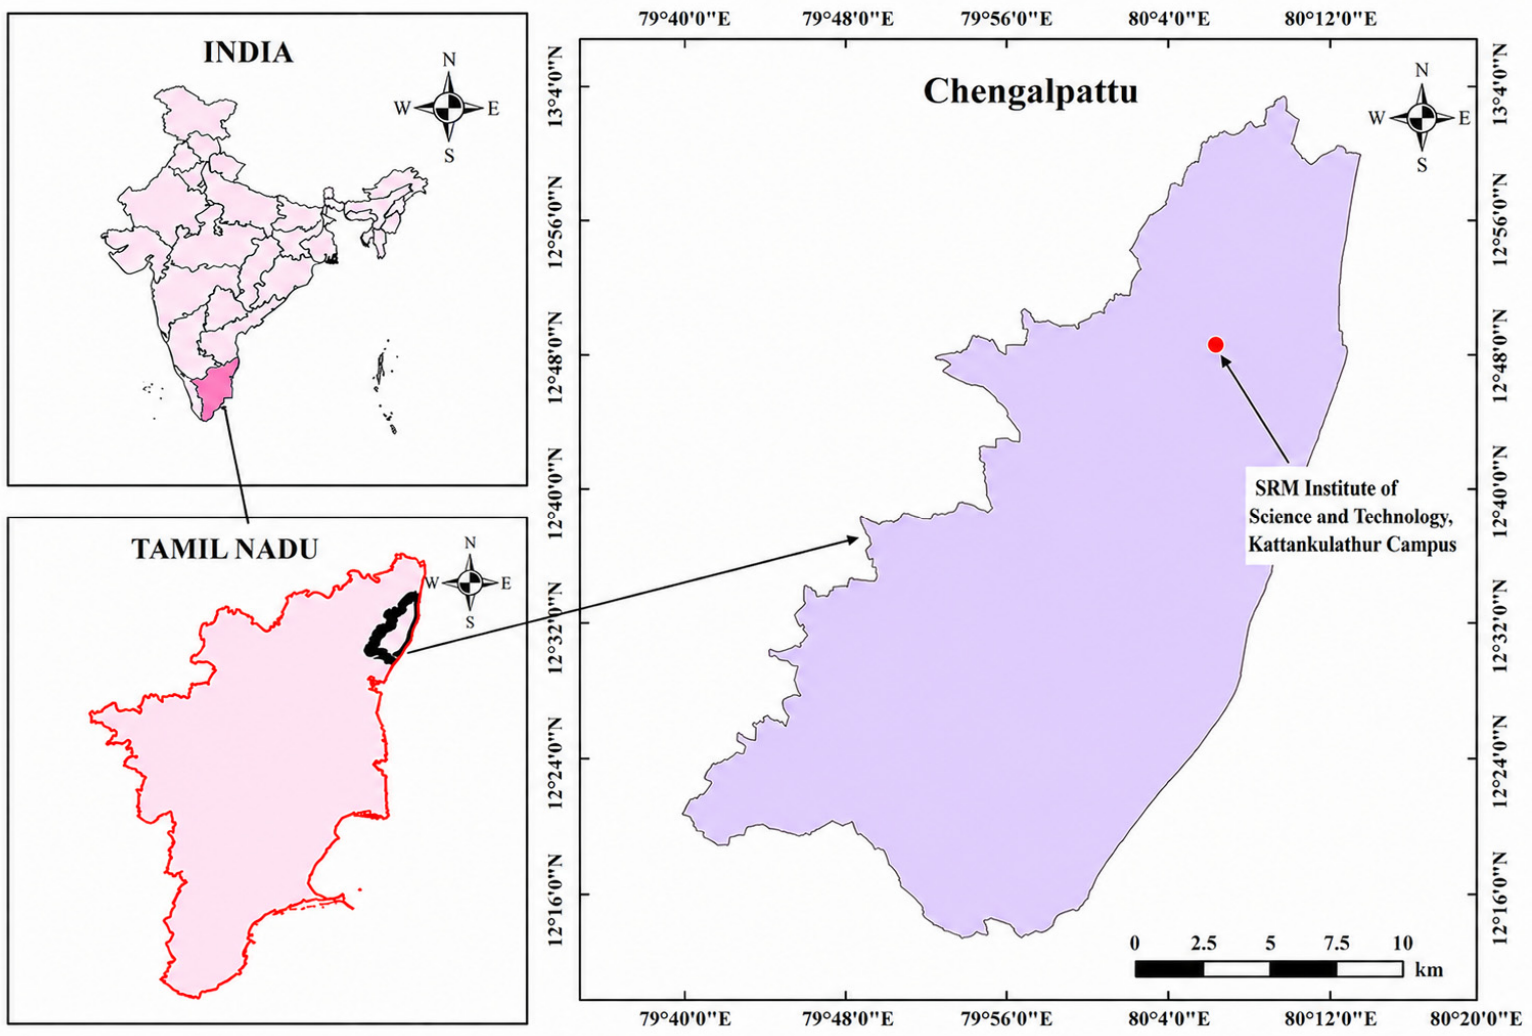
The MDSSS was constructed using readily available materials, and its performance depends on the local geography and Chengalpattu climatic conditions. The experiments utilized groundwater, saline water, and sewage samples from the Chengalpattu region of Tamil Nadu, India, reflecting local water quality challenges and freshwater scarcity. This assessment of the system’s suitability for regional water treatment can inform future studies that explore its performance with water samples from diverse geographic locations and wastewater sources. In most cases, the experimental setup arrangement increases the feed water temperature and improves water quality and yield rate. Geography relates system performance to its environmental conditions. Climate change is a major issue in environmental conditions. The channel incorporation of the DSSS was tested in the institution’s environmental lab at SRM Institute of Science and Technology, under Kattankulathur climate conditions. The solar still location is shown in Figure 2. Groundwater (GW) and sewage water (SW) were collected from the SRM IST campus, as discussed in Table 1. The saline water (SSW) was collected at 8.3889° N, 76.9760° E near Kovalam beach, Chennai, India, throughout the study. The test was conducted in accordance with IS 3025: Part 1: 2019 [58] for water and wastewater sampling and testing.

2.2. Solar Still Experimental Approaches

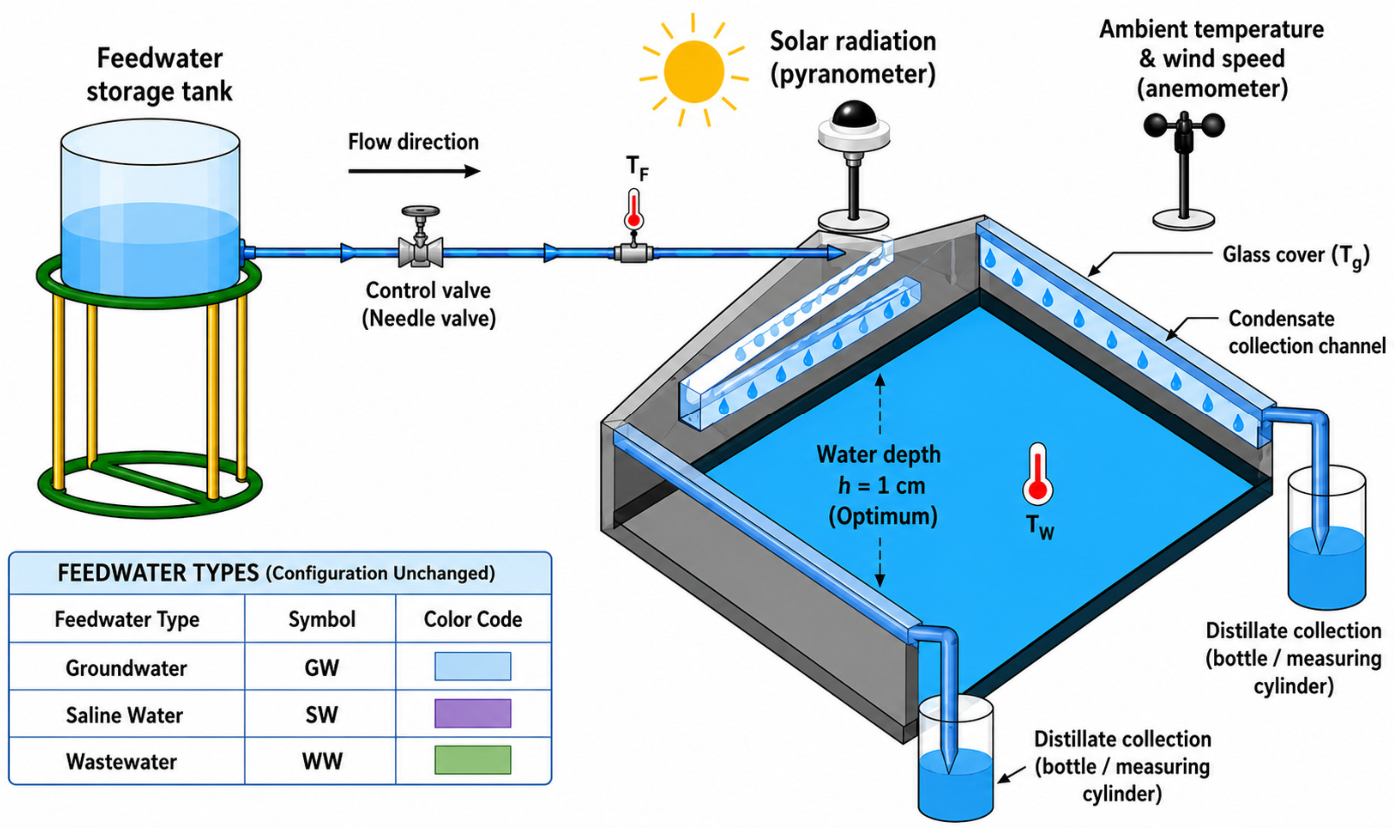
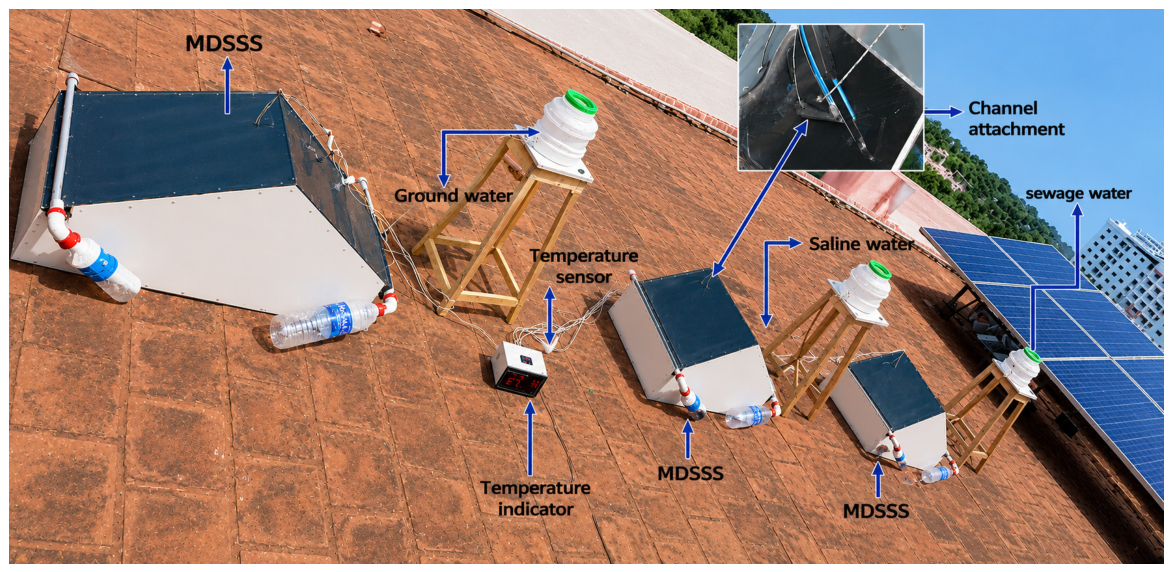
The modified DSSS consists of a basin plate, glass covers, channel shapes, and condensing water collecting tubes. Galvanized iron sheets are utilized to fabricate the DSSS with a square-shaped channel attachment, and the schematic diagram of the MDSSS with different water quality is shown in Figure 3. The experimental setup details are shown in Figure 4. The basin absorber, measuring 0.5 × 1 m2, is coated with black paint to enhance the solar still’s absorptivity. A 4 mm-thick transparent glass cover is used for high transmissivity. The channel has a 10 mm square cross-section and a length of 300 mm, with lightweight materials attached to the walls. The channel in the MDSSS ensures uniform feedwater distribution and promotes thin-film flow, thereby improving heat transfer and evaporation. It is not based on an ASHRAE standard, as it serves as a feedwater distribution component rather than an HVAC air-flow system. The channel’s dimensions and angle were chosen in accordance with solar still design principles and experimental needs to optimize thermal performance and freshwater production. The feedwater channel improves evaporation and condensation rates in the MDSSS. Allowing feedwater to flow as a thin film enhances solar exposure and heat transfer, raising the basin water temperature and accelerating evaporation. This generates more vapor, boosting condensation on the inner glass surfaces and increasing freshwater collection. Thus, the channel provides uniform feedwater distribution, maintains optimal thermal conditions, and enhances the overall productivity of the solar still.
The system’s outer surface is covered with insulating pinewood to minimize heat loss. Evaporation occurs from the basin’s water surface to the bottom of the glass cover, while condensation begins at the bottom of the glass cover and moves to the surface of the collecting tube. The glass cover is inclined at a 30° angle to ensure the drop of condensed water for maximum yield. The optimal basin water depth is determined for all test setups with different water qualities, including groundwater, saline water, and SW. Each system follows the same working process, but with variations in water properties. The initial water properties are itemized in Table 2.
K-type thermocouples are used to measure the temperatures of various components, including the basin, the bottom and top glass covers, the channel entry and exit, and the ambient. All K-type thermocouples were calibrated against a standard laboratory thermometer before the experiments. Temperature readings from the thermocouples were compared with the reference thermometer at fixed points, revealing deviations within the manufacturer’s accuracy limits. The calibrated thermocouples were used for all temperature measurements during the investigation. Their accuracy was ±0.5 °C, with a measured deviation after calibration of ±0.3 °C. Temperature measurements were taken using calibrated K-type thermocouples placed at various points in the experimental setup. Separate sensors monitored the basin water, absorber plate, air-vapor inside the still, and the inner and outer glass cover temperatures. The thermocouples were strategically positioned to accurately capture thermal behavior, providing direct measurements rather than relying on a uniform temperature distribution. Sensor accuracy was confirmed through calibration, and uncertainties were considered in the analysis. Eight K-type thermocouples were used, with an average temperature reported from three installed in the basin water.
The measurement uncertainty was included in the overall uncertainty analysis of the experimental system. A 12-point temperature indicator displays temperature readings at different positions in the solar still via thermocouples. A solar power meter measures the solar intensity during the day. Thermometers, solar power meters, and distillate-measuring beaker readings are monitored to determine the modified solar still temperatures for the basin and glass, the intensity of solar light, and the quantity of condensate. A TDS (Total Dissolved Solids) meter is used to assess water quality. The details of the measuring instruments are tabulated in Table 3.

2.3. The Setup and Procedure of the Experiment

In this research, integrating an open channel into the DSSS minimizes the water depth required throughout the day, thereby achieving optimal basin water depth. The open-channel serves as a water feed path and absorbs heat from both the bottom and the top. The bottom surface of the channel absorbs heat from the solar sidewall; the top surface absorbs sunlight’s heat, but it is positioned below the glass cover. Furthermore, a square-shaped channel has a cross-section of 10 mm2, a length of 300 mm, an angle of 17°, and is attached to the east and west directions of the solar still. It enables gravity-driven flow and promotes thin-film water distribution. The angle improves contact with the heated surface, enhancing solar energy absorption and preheating the water before it enters the basin. It minimizes stagnation and ensures a consistent water supply, improving evaporation and freshwater production. The channel fix angle was chosen to balance flow stability, heat transfer, and system performance; however, the 10 mm bottom side of the channel does not cast a shadow in the solar still. A 4 mm-thick transparent glass cover, angled at 30°, is placed on top of the solar still. Its top surface absorbs solar light, while the lower side collects condensed water. The solar still basin, with an area of 1 m2, is constructed from a galvanized iron sheet and the solar still’s lower portion measures 15 cm in height, while its middle portion measures 44.1 cm. The top glass cover is insulated using M-seal and plastic blocks. This research utilized a comprehensive analytical method to evaluate the efficacy of solar stills with various water sources, including groundwater, saline water, and SW. The modified system basin collects impurities from the storage tank via the zig-zag channel attachment at a rate of 0.625 L per hour from 9 am to 5 pm, with 5 L of water added before the experiment begins.
A steady water flow was achieved through a controlled feedwater supply and a 17-degree inclined channel. This design allowed gravity to evenly distribute water as a thin film before it entered the basin. By regulating the feedwater flow rate, the basin water level remained stable, minimizing fluctuations that could affect thermal performance. It reduced stagnation and ensured consistent heat absorption, resulting in stable evaporation and reliable freshwater production throughout the experiment. Water and air moisture temperatures are measured with a thermocouple, which is monitored with a temperature indicator. An anemometer measures wind velocity, and a solar power meter measures solar radiation. All data were recorded on different days, and the system performance will be compared using the highest temperatures in May 2024. The thermal performance of the MDSSS relies on various heat transfer mechanisms, including conduction, natural convection, and evaporation. It is accelerated by solar radiation and enters through the glass covers, where the basin’s surface, the water layer, and the feedwater channel absorb it, thereby raising the water temperature by conduction. Natural convection within the basin aids in heat distribution and vapor transport. As the basin water temperature rises, evaporation generates vapor that travels to cooler glass surfaces, where it condenses and releases heat due to the temperature difference between the hot vapor and the cooler glass. This condensate flows into the collection trough. Thus, an inclined feedwater channel improves heat transfer through thin-film water flow, with preheating aiding evaporation and boosting freshwater production.

2.4. Sample Water Testing Procedure

The evaluation of modified solar still systems is based on the quality of water sources such as groundwater, saline water, and SW. The sample water was tested and classified as follows: physical, chemical, and bacteriological tests. The study examined the physicochemical characteristics of various water types, including pH, COD, dissolved oxygen, EC, TH, and turbidity. Three-modified solar stills are used to capture various water sources, including groundwater, saline water, and SW, to assess yield rates and water quality. In all three systems, half of the water depth in the basin is collected directly, while the remaining half passes through a channel during sunlight hours from 9 am to 5 pm, starting from the optimal depth. Water yield quality is tested using the following method.
  • Physical Characteristics.
  • Chemical Characteristics.
  • Bacteriological Characteristics.

2.4.1. Physical Characteristics

The physical characteristics of water, such as its appearance, play a significant role in assessing water quality. A color change often signifies an increase in turbidity, often due to the presence of finely divided suspended solids. Odor is a crucial parameter; unusual smells may suggest poor water quality. These sensory changes can serve as early warning signs of contamination or impurities. This study examines the physical properties of water, including color, turbidity, taste, odor, and EC.

2.4.2. Chemical Characteristics

The chemical characteristics of water are crucial for assessing water quality, as they reveal information about molecular changes beyond the presence of suspended or dissolved solids. The evaluation process involves assessing key chemical parameters, including COD, dissolved oxygen (DO), pH, and TH. These indicators provide a comprehensive view of water quality by reflecting the water’s acidity, oxygen content, organic pollution, and mineral concentration. The composition of water can significantly influence its usefulness and safety, as indicated by various parameters.

2.4.3. Biological Characteristics of Water

The biological characteristics of water and sewage are crucial for evaluating the risk of waterborne diseases and associated health issues. The World Health Organization places a significant emphasis on ensuring the safety of drinking water. Biological tests, such as measuring BOD and detecting E. coli in samples, provide valuable insights into water quality. These tests help identify potential contamination and assess the risk of pathogens, which are essential to public health and safety.

3. Theoretical Calculation for Yield and Water Quality

The yield of distilled water was determined experimentally by collecting the condensate discharged from the solar still into graduated measuring cylinders through the condensate collection channels. The volume of distilled water was recorded at hourly intervals throughout the experimental period, and it was converted to mass using the density of water. The measured water yield (mw) was used to calculate the hourly and daily thermal efficiencies of the solar still using Equations (1) and (2). The heat transfer relations presented in Equations (4)–(14) were used to evaluate the system’s thermal behavior and evaporation mechanisms; they were not used to estimate actual distillate production.
ηh = (mw × Lw)/(A × Is)
ηd = (∑mw × Lw)/(A × ∑Is)
Lw = 2.49 × 10⁶ [1 − 9.5 × 10⁻⁴Tw + 1.32 × 10⁻⁷Tw2 − 4.79 × 10⁻⁹Tw3]
The formula calculates radiative heat transfer between the inner side of a glass cover and the basin’s water surface, considering infinite parallel planes [63].
q r a d , w g = h r a d , w g   ( T w T g )
The coefficient hrad is determined empirically using Equation (5). The effective emissivity of the water surface to glass cover is denoted by εeff, while Stefan Boltzmann’s constant, σ, is calculated as 5.67 × 10⁻⁸ W/m2 K4.
h r a d , w g = ε e f f × σ T w 2 + T g 2 × [ T w + T g ]
ε e f f = 1 1 ε g + 1 ε w 1
The following formula is used to determine the convective heat transfer between the inner side of the glass cover and the basin’s water surface [64,65].
q c , w g = h c , w g   ( T w T g )
f = T g T a T p T g = h ( r a d , g a ) h w 1 h ( r a d , p g ) h ( c , p g ) 1
where an empirical relation provided by Dunkle [66] is used to get the convective heat transfer coefficient [67].
h c , w g = 0.884 ( T ) 0.33
T = T w T g + P w P g T w + 273 268900 P w
P w = e 25.317 5144 T w + 273 ;   P g = e 25.317 5144 T g + 273
Evaporative heat transfer occurs between the water’s surface and the glass cover, converting water into humid air. This process is calculated using the following equation [68].
q e , w g = h e , w g   ( T w T g )
h e ,   w g = 0.0163 × h c , w g × P w P g T w T g
The following relation calculates the evaporative mass of water vapor.
m e v a = h e , w g h c , w g × T w T g h f g × h c , w g
The calculation of total dissolved solids in water quality samples is influenced by EC and a proportionality constant (ke), with values ranging from 0.55 to 0.8 [69]. TDS is measured in mg/L, and EC is the electrical conductivity in micro Siemens per centimeter at 25 °C.
TDS = ke × EC
The following terms calculate TSS. The standard measuring procedure is provided by the following equation [70,71,72,73]
TSS m g L = ( W e i g h t   o f   s o l i d s   ( m g ) × 1000   m L / L ) S a m p l e   v o l u m e   ( m L )
TS = TSS + TDS
B O D m g L = I n i t i a l   D O m g L F i n a l   D O m g L × B O D   B o t t l e   V o l u m e m L S m a p l e   V o l u m e   ( m L )

Uncertainty Analysis

The uncertainty analysis is conducted, and the instrument’s errors, uncertainty yield rate, experimental uncertainty, and standard deviations are estimated using the manufacturer’s specifications. Equations (19)–(23) are used to evaluate the uncertainty analysis [74].
W Y = Y x 1 w 1 2 + Y x 2 w 2 2 + Y x 3 w 3 2 + + Y x n w n 2
The parameters x1, x2, x3,…, xn and w1, w2, w3,…, wn are independent, and Y and WY are the outputs of the given function.
The equation given determines the total uncertainty for assessing solar radiation.
w s = w p y r o m e t e r 2 + w r 2
The total uncertainty for the temperature measurement is calculated using the following equation.
w T = w t h 2 + w r 2
The total uncertainty for the wind speed is calculated using the following equation.
w w = w a n e m o m e t e r 2 + w r 2
The total uncertainty for experiments is calculated using the following equation.
w e x = w T 2 + w s 2 + w w 2

4. Result and Discussion

A three-modified DSSS was constructed to research its performance with different water qualities. The modified system’s channel attachment preheats the feed water and absorbs more solar light. The experiment was conducted in May 2024, under the climatic conditions of Chengalpattu. This study recorded the highest yield rate of the day and compared system performance factors, including basin water temperature, glass temperature, and yield water quantity. Economic analysis and payback period were also examined.

4.1. Effect of Solar Radiation on the Solar Still

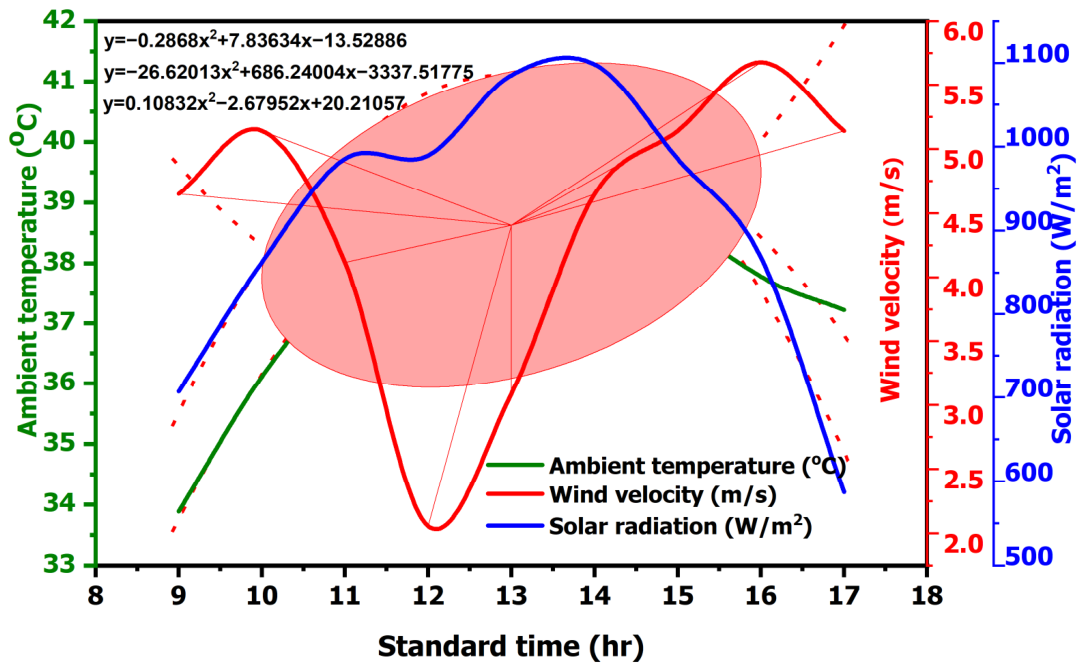
The efficiency of solar stills depends greatly on the strength of solar radiation. Solar intensity absorption depends on the water quality parameters at the optimal basin water depth, glass cover thickness, and basin area. The experiment took place during the peak solar radiation in May 2024. The uncertainties related to ambient temperature, wind velocity, and solar radiation were evaluated based on instrument precision. During the study, ambient temperature ranged from 34 °C to 39 °C, wind velocity ranged from 2.1 m/s to 5.7 m/s, and solar radiation ranged from 590 W/m2 to 1090 W/m2. The instrument accuracies of ±0.1 °C, ±0.1 m/s, and ±10 W/m2, the uncertainties are about 2.0%, 2.8%, and 2.0% of the ranges measured. These uncertainties are much smaller than the variations in the experimental data, suggesting that the trends and performance characteristics of the MDSSS system are reliable and not significantly affected by measurement errors. It is shown in Figure 5. Solar radiation intensity was measured at the experiment location. The solar radiation variation during the experiment followed the summer conditions in Chengalpattu at the time of measurement for the modified solar still. The highest radiation was recorded at 2:00 pm, with an estimate of 1098 W/m2.
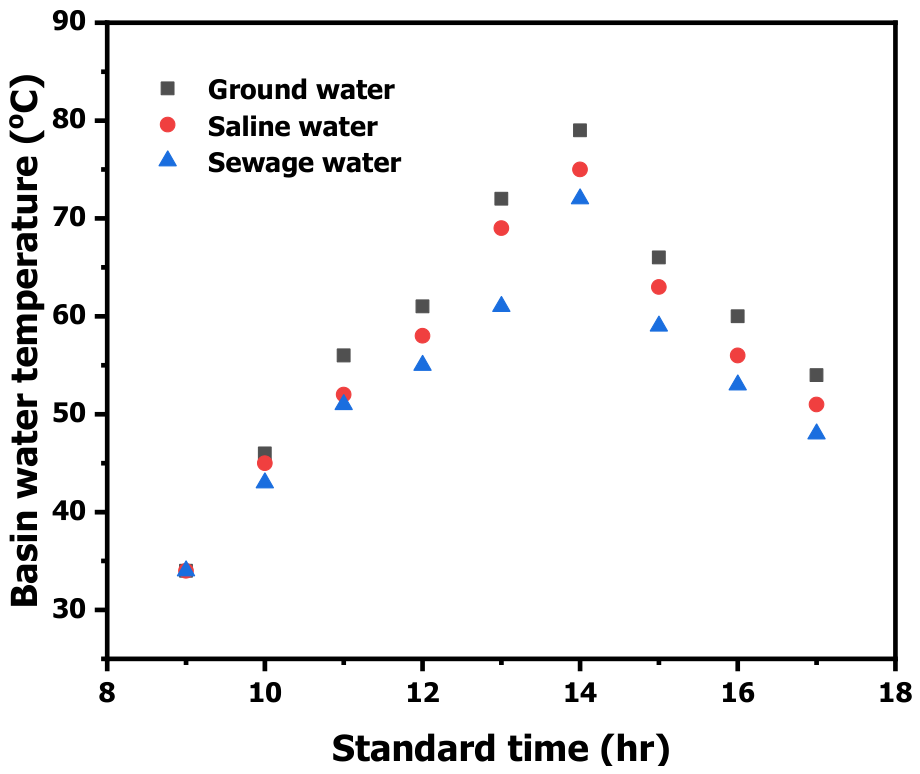
On 30 May 2024, an MDSSS was used to record the basin’s temperature and to test sewage, salt, and groundwater from morning to evening. The highest temperature of 79 °C was recorded for groundwater, followed by 75 °C for saline water and 72 °C for SW, as shown in Figure 6. It is observed that water is the most efficient absorber of solar energy among other fluids, but it absorbs only 13% of the energy [75]. The salt concentration in the solution affects the ability of saltwater to retain heat longer than freshwater [65]. Additionally, the specific heat capacity of water decreases with increasing salt concentration, reducing its ability to store heat. The boiling point of water is influenced by salt concentration: a 10% salt solution boils at 102 °C, 2 °C higher than pure water.
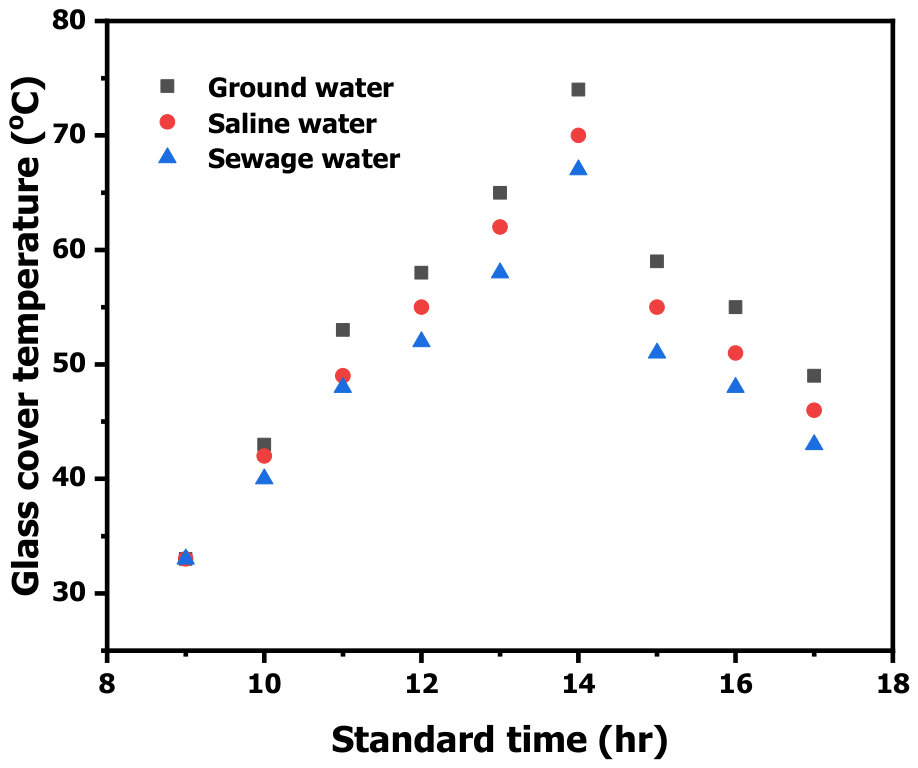
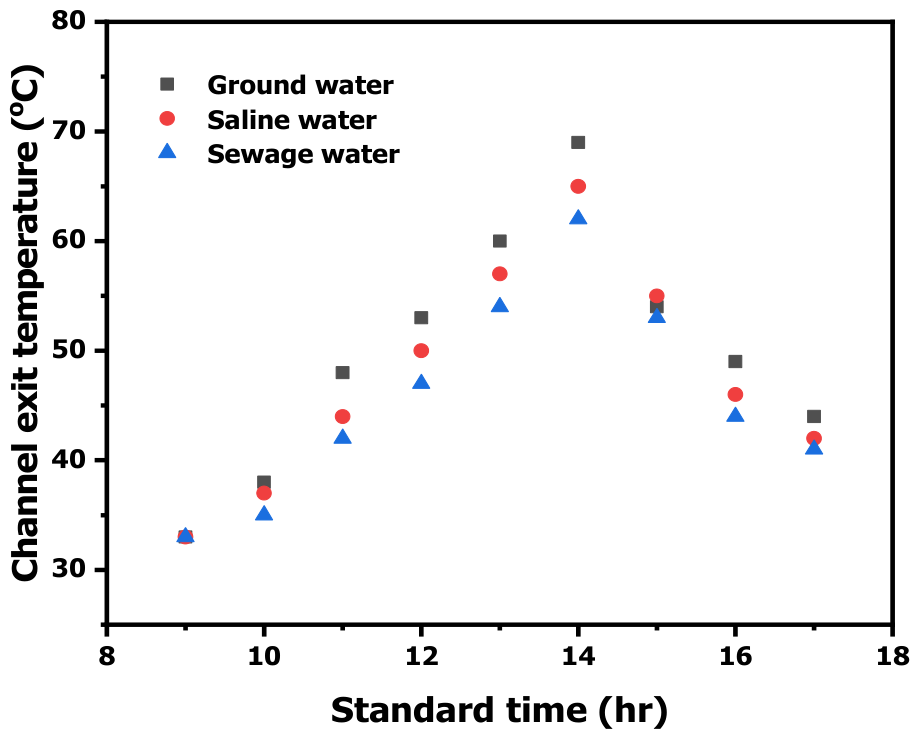
The system used to monitor the temperature of the glass cover across different water qualities, including groundwater, saline, and SW. The peak temperature occurs at 1 pm in all three water quality systems, reaching 74 °C, 70 °C, and 67 °C, respectively. Due to the higher salt concentration, the saline water solar still collects less sunlight than the groundwater, but more than the SW. The graph details are displayed in Figure 7. The glass cover thickness is 4 mm in all three systems. The temperature of the basin’s water and the glass’s thermal resistance affect the bottom of the glass cover. The outer-to-inner thermal resistance ratio, denoted as “f”, is calculated assuming one-dimensional heat flow and ignoring thermal capacity and the temperature drop across the glass cover. The channel bottom surface collects the heat from the wall side, and the top surface receives the solar radiation. The channel is positioned below the glass cover, effectively absorbing the infiltration rate from the system. The channel exit water temperature is monitored and plotted in Figure 8.

4.2. Distillation Water Production in a Solar Still

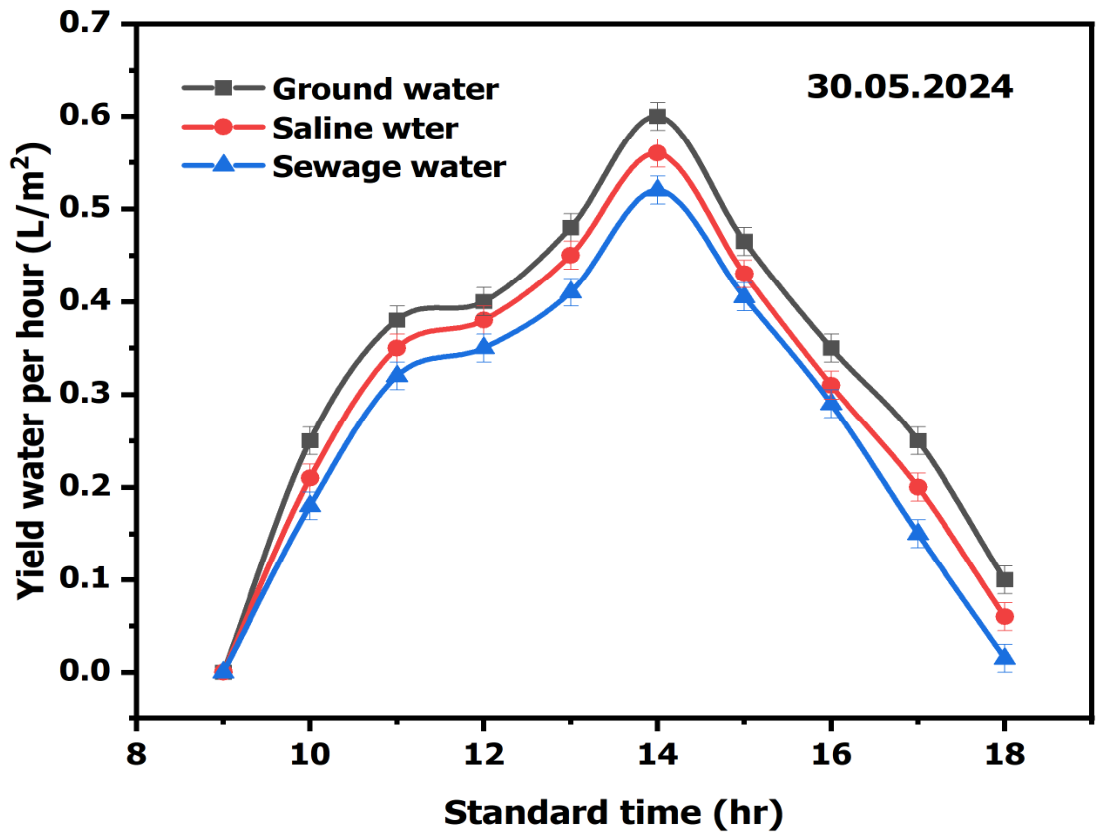
Solar stills use solar energy to distill water from impure sources, mimicking the natural process of evaporation and condensation in rainfall. It is a cost-effective way to produce high-quality distilled water in rural areas with abundant solar energy. The work focused on evaluating the effectiveness of a modified solar still with three different water sources: groundwater, saline water, and SW, over several days. The highest yield rate was achieved on 30 May 2024, which corresponded to the highest atmospheric temperature and solar radiation. The yield rates for the modified solar still with the three water sources (groundwater, saline water, and SW) are 3.250, 2.950, and 2.640 L/m2, respectively. The hourly yield rates of different water-quality-containing solar stills are plotted in Figure 9. The experiments were conducted to determine the optimal water levels in the basin. The maximum yield was obtained when the groundwater level was at its highest at 2 PM. The peak yield for all solar still types occurred at 2 pm, with groundwater-fed solar stills yielding higher rates. The 22.02% increase in daily productivity of the solar still with a channel attachment, compared to the conventional model, is due to improved heat transfer and evaporation. The channel allows feedwater to flow as a thin film, maximizing exposure to solar radiation and preheating before it enters the basin. This raises the water temperature, reduces thermal inertia, and enhances evaporation. The channel attachment increases the heat transfer surface area and promotes uniform water distribution, thereby increasing vapor generation, condensation, and freshwater collection, as reported in a published paper [76].
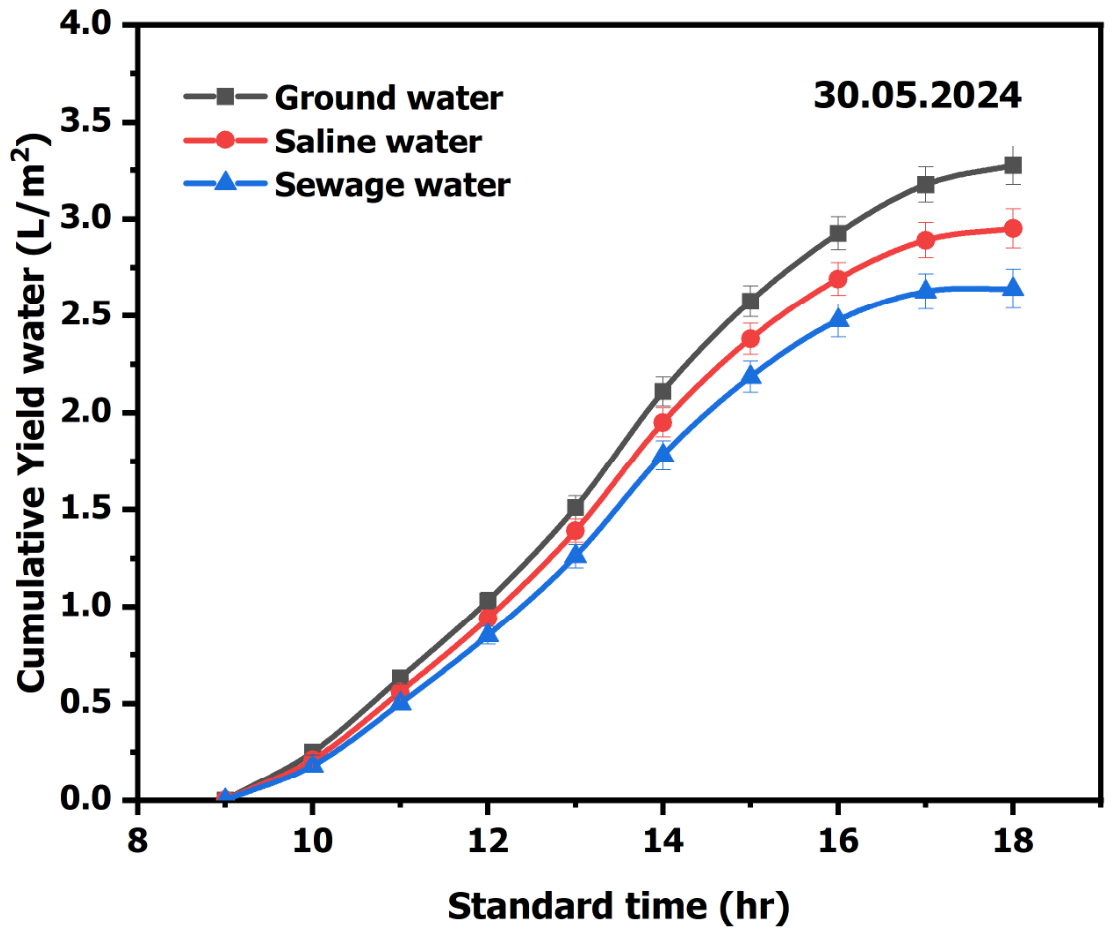
Cumulative yield refers to the total amount of fresh water produced by a solar still across different water qualities over a specific period from 9 am to 5 pm. The cumulative yield of groundwater is superior to that of other water taken in the solar still. It is displayed in Figure 10. Thus, the evaporation rate in a solar still is influenced by water’s volatility, which varies with its boiling point.

4.3. Efficiency of the Solar Stills

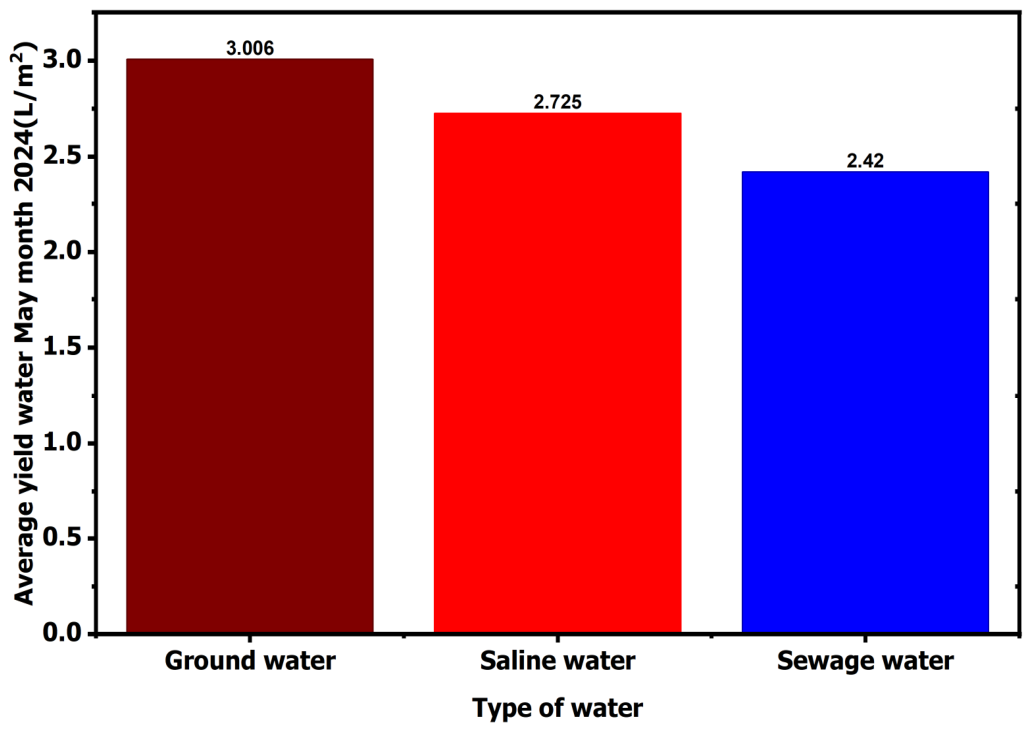
The efficiency of solar stills is influenced by factors such as water basin depth, design, energy storage materials, evaporative and condensation surface areas, fins, and Fresnel lenses. This study focuses on the effectiveness of a modified solar still using different water qualities (groundwater, saline water, and SW) in the basin. The technique used in all cases remains consistent, but the water quality prepared varies. However, the resulting water quality meets the same standards. The quantity of water produced by the modified DSSS was compared across different water quality types in May 2024, and the results are listed in Table 4. This analysis aimed to determine the water yield from the modified solar still. It found that the yields of saline and SW are lower than those of groundwater due to their higher EC, turbidity, and nutrient levels. The average yield rate for May is illustrated in Figure 11.

4.4. Water Yield Quality Analysis in the Modified Solar Still

Monitoring water quality and assessing the overall resource capacity in a solar still are essential processes. It involves analyzing water quality and yield, as well as a reservoir’s ability to supply water to specific locations at specific times. A test was conducted on 30 May 2024 to compare the amount of water evaporated from a basin of the solar still and the recharge from different types of water in the modified solar still. Monitoring physical parameters such as turbidity, color, and odor and chemical parameters, such as pH, COD, conductivity, dissolved oxygen (DO) level, and TH, and biological parameters, such as BOD and E. coli, can help determine water quality.
SW presents a greater challenge for testing than other types of water, such as ground and saline water, because it has higher levels of pollution. SW testing evaluates the physical and chemical parameters of sewage to assess water pollution levels and determine purification treatments. A water sample’s dissolved oxygen content is directly correlated with the amount of organic matter it decomposes. The presence of fecal coliform bacteria can be determined using a presence/absence test and the most probable number method.
The physical characteristics of the three water samples, including color, turbidity, taste, and odor, are summarized in Table 5, both before and after treatment. Table 6 provides a comprehensive overview of the chemical properties of the samples, including pH, dissolved oxygen, COD, TH, and conductivity before and after treatment. Additionally, the biological characteristics, including BOD and E. coli levels, are shown in Table 7 for pretreatment and post-treatment assessments.

4.5. The Modified Double-Slope Solar Still’s Payback Period and Economic Analysis Calculation

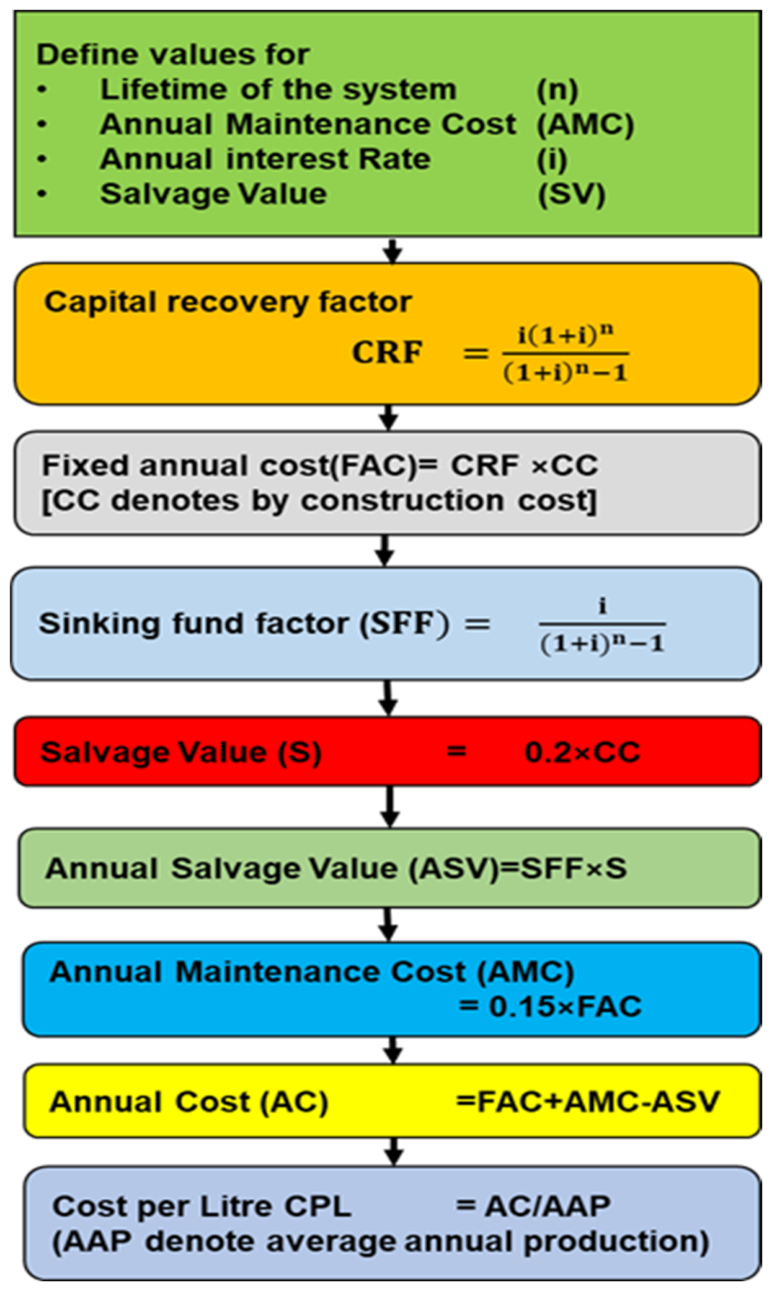
The payback period and economic analysis of a modified double-slope solar system are determined by estimating the initial capital investment, annual maintenance costs, and annual salvage value. The capital recovery factor depends on the assumed interest rate (i) of 12% and the solar still’s lifetime. The solar still’s fixed annual cost is calculated by multiplying the construction cost and the capital recovery factor. Salvage value is the estimated resale value of an asset at the end of its useful life, calculated as 20% of the construction cost. The Sinking Fund Factor (SFF) is a financial tool used to determine the amount to be set aside each period for future financial needs. The sinking fund method calculates depreciation for an asset by setting aside a fund for replacement at the end of its useful life. The annual salvage value is calculated by multiplying the salvage value and the SFF. An estimated 15% of the fixed annual expenditure is allocated to maintenance. The annual cost is determined by subtracting the annual salvage value from the sum of the annual maintenance and fixed costs. The cost per liter is calculated by dividing the annual cost by the average annual production and then multiplying by 80% of that day in the year. The details of the economic calculation procedure are provided in the flowchart (Figure 12), and the calculations are presented in Table 8.
Water quality analysis is a process that uses physical, chemical, and biological tests to assess water quality. It is categorized into three types: simple, complete, and special analyses. Simple analyses provide a quick overview of groundwater’s chemical components, while special analyses are designed for specific tasks. The present work compares water quality by examining various treatment techniques for different types of water, as outlined in Table 9.
The analysis presented in Table 9 demonstrates the effectiveness of the MDSSS in enhancing the quality of groundwater, saline water, and SW. After the distillation process, significant reductions were noted in several key water quality parameters. All water samples maintained acceptable pH levels, and there was a notable reduction in turbidity, indicating effective removal of impurities. The TH of the water decreased from 110, 15, and 360 mg/L to 2, 0, and 12 mg/L for groundwater, saline water, and SW, respectively. Furthermore, the BOD values dropped from 325, 360, and 1400 mg/L to 75, 25, and 12 mg/L, reflecting a significant reduction in biodegradable organic matter. Notably, complete removal of E. coli was achieved in the treated samples, confirming effective elimination of microbial contamination. These results align with previous research on sewage treatment plants and artificial wetlands, which observed substantial reductions in BOD, COD, and suspended solids. Thus, the MDSSS offers a sustainable, environmentally friendly option for freshwater production and purification, particularly in regions with limited access to water.

5. Conclusions

The research used a DSSS with a channel attachment system to purify various water-quality samples from Chengalpattu. The system’s performance was evaluated based on its physical, chemical, and biological characteristics, as well as its yield rate. Most samples tested met the water quality standards according to IS 3025-11, IS 3025-38, IS 3025-58, IS 3025-21, and IS 3025-14. The MDSSS incorporated a channel with a 17° slope, which facilitated downward flow of heated water, enhanced solar exposure of the water film, and promoted evaporation within the system. The observed freshwater productivity and thermal performance are consistent with the optimized configuration evaluated in the present study. The channel attachment enhances the MDSSS’s productivity by allowing water to flow as a thin film along the inclined surface. It increases the surface area for solar energy absorption and reduces water depth, which accelerates heating and evaporation. As a result, the evaporation rate improves, leading to greater freshwater productivity and thermal efficiency of the modified solar still. Increased basin water temperature accelerates evaporation, generating more water vapor for condensation on the glass cover. Thus, the inclined channel ensures a continuous and uniform water supply, maintaining a stable basin water depth and consistent evaporation.
Suspended impurities in SW increase turbidity, which hinders the transmission of solar radiation. These particles scatter and absorb solar energy, reducing penetration depth and heating uniformity. Thus, the accumulation of suspended matter at the water’s surface increases thermal resistance and reduces heat transfer efficiency. Consequently, these factors can lower the evaporation rate and freshwater productivity of solar stills when treating highly turbid SW.
Different water qualities absorb solar light based on their thermal properties. Three-modified systems maintained optimal basin water depth, and their yield rate measured and estimated system performance. However, MDSSS provided better water purification in all cases compared to the base system. The yield rate of SW in the system was lower than that of groundwater. It examined improvements in water quality by comparing the physical, chemical, and biological characteristics of the water before and after sample treatment. Sustainability is crucial for SW usage systems to remove BOD and E. coli from evaporation processes and filtration for makeup feed water due to sedimentation issues. MDSSS effectively removes pollutants in the solar distillation process. The evaporation rate of the SW system was relatively low due to the high concentration of contaminants, which reduced vapor pressure. The BOD removal of various available water in Chengalpattu, including ground, saline, and SW, was 95.23%, 100%, and 97.43%, respectively. The COD removal for these various waters was 98.18%, 100%, and 96.67%, respectively. The salt concentration in seawater decreased by 100% after evaporation in a modified solar still.
In the present and future, various processes such as boiling, distillation, reverse osmosis, chlorination, filtration, and microfiltration are used to improve water quality. It is important to note that reverse osmosis systems are ineffective in removing bacteria and viruses, so an additional disinfection process is necessary. Additionally, the byproducts of chlorine can pose health risks, including increased cancer risk, reproductive issues, asthma symptoms, and congenital abnormalities. The filtration process involves passing water through layers of sand and gravel to remove insoluble particles.
Distillation is a superior water-purification process compared to other methods, but it has a limited yield. The modified system shows promise for effective wastewater purification and economic performance, but low freshwater production rates and high land requirements limit its use in large-scale industrial treatment. This technology is better suited for small-scale, decentralized applications. However, with optimized design and modular scaling, it could serve as a supplementary treatment for industrial wastewater, particularly in areas with high solar irradiance and limited access to conventional energy. To enhance this MDSSS system for the future, a few key points need to be addressed:
  • The surface of the heat collection channel should be modified with textured fins.
  • Excess heat can be stored at the bottom of the solar still using energy storage materials, including nanomaterials.
  • The first stage filters SW, and the second stage allows the water to pass through the channel into the basin of the solar still.
  • The water production rate is to be increased by combining these modifications and reducing the water depth layer.
Future research should aim to scale up the MDSSS to boost freshwater production and evaluate its performance under different climatic conditions and wastewater types. Integrating advanced thermal energy storage, nanofluids, phase change materials, solar concentrators, and automated water flow controls could improve efficiency. Long-term durability studies, life-cycle assessments, and techno-economic analyses are recommended to assess large-scale feasibility. Furthermore, future work could address the treatment of industrial wastewater with complex contaminants and develop modular solar desalination units for decentralized water treatment in remote areas.

Author Contributions

Conceptualization, T.J. and D.S.; Methodology, T.J., D.S. and G.P.; Validation, T.J. and D.S.; Formal analysis, T.J., D.S., G.P., R.S. and V.S.; Investigation, T.J., D.S., G.P. and R.S.; Writing—original draft, T.J., D.S. and G.P.; Writing—review and editing, T.J., D.S., G.P., R.S. and V.S.; Supervision, T.J. and D.S.; Funding acquisition, T.J. and D.S. All authors have read and agreed to the published version of the manuscript.

Funding

This research received no external funding.

Data Availability Statement

The original contributions presented in this study are included in the article. Further inquiries can be directed to the corresponding author.

Conflicts of Interest

The authors declare no conflicts of interest.

Abbreviations

The following abbreviations are used in this manuscript:
ABasin area (m2)
fGlass resistance factor (-)
IIrradiance W/m2
LEnthalpy of vaporization (J/kg)
mDistillate yield (kg/m2)
PPressure (N/m2)
qHeat flow rate (W/m2)
TTemperature (°C)
WUncertainty
ɳEfficiency
εEmissivity
σStefan-Boltzmann constant (W/m2 K4)
∆TTemperature difference
cconvection
dday
effeffectiveness
evaevaporative
gglass
rradiation
ssolar, sun
wwater
BODBiochemical oxygen demand
CODChemical oxygen demand
DSSSDouble slope solar still
MDSSSModified double slope solar still
TDSTotal dissolved solids

References

  1. Salas, E.B. Average Water Consumption Per Person India 2021, by Age Group; Statista Research Department: Hamburg, Germany, 2022. [Google Scholar]
  2. Mayo Clinic Press. Nutrition and Healthy Eating; Mayo Clinic Press: Rochester, MN, USA, 2022. [Google Scholar]
  3. Ki-moon, B.; UN Secretary General. The human right to water and sanitation. Media Brief at the United Nations General Assembly, 28 July 2010.
  4. Edokpayi, J.N.; Odiyo, J.O.; Durowoju, O.S. Impact of Wastewater on Surface Water Quality in Developing Countries: A Case Study of South Africa. In Water Quality; InTech: London, UK, 2017. [Google Scholar] [CrossRef]
  5. Ljunggren, M. Micro screening in wastewater treatment—An overview. Vatten 2006, 62, 171–177. [Google Scholar]
  6. Renzoni, R.; Germain, A. Life Cycle Assessment of Water: From the pumping station to the wastewater treatment plant (9 pp). Int. J. Life Cycle Assess. 2007, 12, 118–126. [Google Scholar] [CrossRef]
  7. Mansour-Geoffrion, M.; Dold, P.L.; Lamarre, D.; Gadbois, A.; Déléris, S.; Comeau, Y. Characterizing hydrocyclone performance for grit removal from wastewater treatment activated sludge plants. Miner. Eng. 2010, 23, 359–364. [Google Scholar] [CrossRef]
  8. Manheim, D.; Nelson, Y. Settling and bioflocculation of two species of algae used in wastewater treatment and algae biomass production. Environ. Prog. Sustain. Energy 2013, 32, 946–954. [Google Scholar] [CrossRef]
  9. Rosso, D.; Larson, L.E.; Stenstrom, M.K. Aeration of large-scale municipal wastewater treatment plants: State of the art. Water Sci. Technol. 2008, 57, 973–978. [Google Scholar] [CrossRef] [PubMed]
  10. Bürger, R.; Diehl, S.; Nopens, I. A consistent modelling methodology for secondary settling tanks in wastewater treatment. Water Res. 2011, 45, 2247–2260. [Google Scholar] [CrossRef] [PubMed]
  11. Aziz, S.Q.; Ali, S.M. Performance of biological filtration process for wastewater treatment: A review. ZANCO J. Pure Appl. Sci. 2016, 28, 554–563. [Google Scholar]
  12. Kitis, M. Disinfection of wastewater with peracetic acid: A review. Environ. Int. 2004, 30, 47–55. [Google Scholar] [CrossRef] [PubMed]
  13. Hagman, M.; La, J.; Jansen, C. Oxygen uptake rate measurements for application at wastewater treatment plants. Vatten 2007, 63, 131–138. [Google Scholar]
  14. Matesun, J.; Petrik, L.; Musvoto, E.; Ayinde, W.; Ikumi, D. Limitations of wastewater treatment plants in removing trace anthropogenic biomarkers and future directions: A review. Ecotoxicol. Environ. Saf. 2024, 281, 116610. [Google Scholar] [CrossRef] [PubMed]
  15. The Water Research Foundation. Residential End Uses of Water, Version 2: Executive Report; The Water Research Foundation: Alexandria, VA, USA, 2016. [Google Scholar]
  16. Igoud, S.; Zeriri, D.; Aoudjit, L.; Boutra, B.; Sebti, A.; Khene, F.; Mameche, A. Climate change adaptation by solar wastewater treatment (SOWAT) for reuse in agriculture and industry. Irrig. Drain. 2021, 70, 243–253. [Google Scholar] [CrossRef]
  17. Asadia, R.Z.; Sujab, F.; Mashhoona, F.; Rahimic, S. Feasibility studies for using a solar still on Sarkhon Gas Refinery wastewater recovery. Desalin. Water Treat. 2011, 30, 154–160. [Google Scholar] [CrossRef]
  18. Mastoras, P.; Vakalis, S.; Fountoulakis, M.S.; Gatidou, G.; Katsianou, P.; Koulis, G.; Thomaidis, N.S.; Haralambopoulos, D.; Stasinakis, A.S. Evaluation of the performance of a pilot-scale solar still for olive mill wastewater treatment. J. Clean. Prod. 2022, 365, 4–9. [Google Scholar] [CrossRef]
  19. Qasim, S.R. Treatment of domestic sewage by using solar distillation and plant culture. J. Environ. Sci. Health Part A Environ. Sci. Eng. 1978, 13, 615–627. [Google Scholar] [CrossRef]
  20. Pandey, A.K.; Reji Kumar, R.; B, K.; Laghari, I.A.; Samykano, M.; Kothari, R.; Abusorrah, A.M.; Sharma, K.; Tyagi, V.V. Utilization of solar energy for wastewater treatment: Challenges and progressive research trends. J. Environ. Manag. 2021, 297, 113300. [Google Scholar] [CrossRef] [PubMed]
  21. Nagaraju, V.; Murali, G.; Bewoor, A.K.; Kumar, R.; Sharifpur, M.; Assad, M.E.H.; Awad, M.M. Experimental study on performance of single slope solar still integrated with sand troughs. Sustain. Energy Technol. Assess. 2022, 50, 101884. [Google Scholar] [CrossRef]
  22. El-Maghlany, W.M. An approach to optimization of double slope solar still geometry for maximum collected solar energy. Alex. Eng. J. 2015, 54, 823–828. [Google Scholar] [CrossRef]
  23. Manokar, A.M. Performance analysis of tubular solar still using clam shells (coastal waste): An experimental investigation, energy, exergy, economic, and environmental study. Sep. Purif. Technol. 2025, 379, 134991. [Google Scholar] [CrossRef]
  24. Prabhu, B.; Attia, M.E.H.; Abdel-Aziz, M.M. Hybrid heat-transfer enhancement in hemispherical solar stills employing boules scrubber metallic inox and copper oxide nanoparticles. Sep. Purif. Technol. 2025, 383, 136161. [Google Scholar] [CrossRef]
  25. Arunkumar, T.; Jayaprakash, R.; Denkenberger, D.; Ahsan, A.; Okundamiya, M.S.; Kumar, S.; Tanaka, H.; Aybar, H.Ş. An experimental study on a hemispherical solar still. Desalination 2012, 286, 342–348. [Google Scholar] [CrossRef]
  26. Essa, F.A. Innovative integration: Enhancing solar distillation efficiency with modified spherical solar stills. Desalination 2024, 576, 117388. [Google Scholar] [CrossRef]
  27. Siddula, S.; Stalin, N.; Mahesha, C.R.; Dattu, V.S.N.C.; S, H.; Singh, D.P.; Mohanavel, V.; Sathyamurthy, R. Triangular and single slope solar stills: Performance and yield studies with different water mass. Energy Rep. 2022, 8, 480–488. [Google Scholar] [CrossRef]
  28. Elsheikh, A.H.; Egiza, M.; Diab, M.R.; Nassar, M.; Alhosary, M.; Nassar, S.; Rozza, M.; Faisal, N.; Essa, F.A. Modelling and optimization of an inverted pyramid solar still using ANFIS-PSO: Predictive analysis of water production, energy, and exergy efficiency. Sep. Purif. Technol. 2025, 377, 134492. [Google Scholar] [CrossRef]
  29. Jeyabalaji, C.; Murugavel, K.K.; Rajaseenivasan, T. An experimental comparative performance study of semi-cylindrical and double slope solar still. Desalin. Water Treat. 2017, 67, 11–15. [Google Scholar] [CrossRef]
  30. Kiran, A.A.; Sivashankar, P.V.; Suneesh, P.U.; Denkenberger, D.C. V-Type solar still integrated with hybrid solar concentrator. Cogent Eng. 2022, 9, 2073650. [Google Scholar] [CrossRef]
  31. Sellami, M.H.; Bouguettaia, H.; Bechki, D.; Zeroual, M.; Kachi, S.; Boughali, S.; Bouchekima, B.; Mahcene, H. Effect of absorber coating on the performance of a solar still in the region of Ouargla (Algeria). Desalin. Water Treat. 2013, 51, 6490–6497. [Google Scholar] [CrossRef]
  32. Temmar, S.; Khelef, A.; Sellami, M.H.; Cherraye, R.; Khechekhouche, A.; Laouini, S.E. Effect of different carbon types on a traditional solar still outp. Desalin. Water Treat. 2023, 284, 11–18. [Google Scholar] [CrossRef]
  33. Sharshir, S.W.; Yang, N.; Peng, G.; Kabeel, A.E. Factors affecting solar stills productivity and improvement techniques: A detailed review. Appl. Therm. Eng. 2016, 100, 267–284. [Google Scholar] [CrossRef]
  34. Tenthani, C.; Madhlopa, A.; Kimambo, C.Z. Improved Solar Still for Water Purification. J. Sustain. Energy Environ. 2012, 3, 111–113. [Google Scholar]
  35. Flendrig, L.M.; Shah, B.; Subrahmaniam, N.; Ramakrishnan, V. Low cost thermoformed solar still water purifier for D&E countries. Phys. Chem. Earth 2009, 34, 50–54. [Google Scholar] [CrossRef]
  36. Arunkumar, T.; Sathyamurthy, R.; Denkenberger, D.; Lee, S.J. Solar distillation meets the real world: A review of solar stills purifying real wastewater and seawater. Environ. Sci. Pollut. Res. 2022, 29, 22860–22884. [Google Scholar] [CrossRef] [PubMed]
  37. GB 34914-2021; Minimum Allowable Value of Water Efficiency and Water Efficiency Grades for Reverse Osmosis Drinking Water Purifiers. General Administration of Quality Supervision: Beijing, China, 2022.
  38. Sadeq, S.N. The Physical and Chemical Properties of Water; Kirkuk University: Kirkuk, Iraq, 2021. [Google Scholar] [CrossRef]
  39. Iram, S.; Kanwal, S.; Ahmad, I.; Tabassam, T.; Suthar, V.; Mahmood-ul-Hassan, M. Assessment of physicochemical parameters of wastewater samples. Environ. Monit. Assess. 2013, 185, 2503–2515. [Google Scholar] [CrossRef] [PubMed]
  40. Parde, D.; Behera, M. Challenges of Wastewater and Wastewater Management. In Sustainable Industrial Wastewater Treatment and Pollution Control; Springer Nature: Singapore, 2023; pp. 229–255. [Google Scholar] [CrossRef]
  41. Kumari, S.; Dwivedi, S.; Khan, M.E.A.R.; Nayanam, S.; Dhasmana, A.; Malik, S. The Challenges of Wastewater and Wastewater Management. In Advanced and Innovative Approaches of Environmental Biotechnology in Industrial Wastewater Treatment; Springer Nature: Singapore, 2023; pp. 99–121. [Google Scholar] [CrossRef]
  42. Simonich, S.L. Fragrance Materials in Wastewater Treatment. In Water Pollution; Springer: Berlin/Heidelberg, Germany, 2004; pp. 79–118. [Google Scholar] [CrossRef]
  43. Chaudhary, J.P.; Jhajharia, P. Recent Advances in Wastewater Treatment. In Integrated Waste Management; Springer Nature: Singapore, 2024; pp. 289–302. [Google Scholar] [CrossRef]
  44. Mullins, D.; Coburn, D.; Hannon, L.; Jones, E.; Clifford, E.; Glavin, M. A novel image processing-based system for turbidity measurement in domestic and industrial wastewater. Water Sci. Technol. 2018, 77, 1469–1482. [Google Scholar] [CrossRef] [PubMed]
  45. Mucha, Z.; Kułakowski, P. Turbidity measurements as a tool of monitoring and control of the SBR effluent at the small wastewater treatment plant—Preliminary study. Arch. Environ. Prot. 2016, 42, 33–36. [Google Scholar] [CrossRef]
  46. Kesari, K.K.; Soni, R.; Jamal, Q.M.S.; Tripathi, P.; Lal, J.A.; Jha, N.K.; Siddiqui, M.H.; Kumar, P.; Tripathi, V.; Ruokolainen, J. Wastewater Treatment and Reuse: A Review of its Applications and Health Implications. Water Air Soil Pollut. 2021, 232, 208. [Google Scholar] [CrossRef]
  47. Sharma, V. Chemical Treatment of Industrial Wastewater. 2024. Available online: https://blog.mywastesolution.com/chemical-treatment-of-industrial-wastewater/ (accessed on 10 May 2026).
  48. AlpHa Measurement Solutions, Dissolved Oxygen (DO) in Wastewater Treatment. Available online: https://alpha-measure.com/dissolved-oxygen/dissolved-oxygen-waste-water-treatment-industrial-waste-water-treatment/ (accessed on 10 May 2026).
  49. Wilhelm, F.M. Pollution of Aquatic Ecosystems I. In Encyclopedia of Inland Waters; Elsevier: Amsterdam, The Netherlands, 2009; pp. 110–119. [Google Scholar] [CrossRef]
  50. Fuller, R. Water hardness. In Dictionary Geotechnical Engineering; Springer: Berlin/Heidelberg, Germany, 2014; p. 1507. [Google Scholar] [CrossRef]
  51. Jain, B.P.; Goswami, S.K.; Pandey, S. Mineral. In Protocols in Biochemistry and Clinical Biochemistry; Elsevier: Amsterdam, The Netherlands, 2021; pp. 49–54. [Google Scholar] [CrossRef]
  52. Atlas Scientific. The Importance of Electrical Conductivity of Wastewater. 30 July 2025. Available online: https://atlas-scientific.com/blog/electrical-conductivity-of-wastewater/ (accessed on 10 May 2026).
  53. Hussain, A.; Kumari, R.; Sachan, S.G.; Sachan, A. Biological wastewater treatment technology: Advancement and drawbacks. In Microbial Ecology of Wastewater Treatment Plants; Elsevier: Amsterdam, The Netherlands, 2021; pp. 175–192. [Google Scholar] [CrossRef]
  54. Jain, M.; Khan, S.A.; Sharma, K.; Jadhao, P.R.; Pant, K.K.; Ziora, Z.M.; Blaskovich, M.A.T. Current perspective of innovative strategies for bioremediation of organic pollutants from wastewater. Bioresour. Technol. 2022, 344, 126305. [Google Scholar] [CrossRef] [PubMed]
  55. Hidangmayum, A.; Debnath, A.; Guru, A.; Singh, B.N.; Upadhyay, S.K.; Dwivedi, P. Mechanistic and recent updates in nano-bioremediation for developing green technology to alleviate agricultural contaminants. Int. J. Environ. Sci. Technol. 2023, 20, 11693–11718. [Google Scholar] [CrossRef] [PubMed]
  56. Roy, M.; Saha, R. Dyes and their removal technologies from wastewater: A critical review. In Intelligent Environmental Data Monitoring for Pollution Management; Elsevier: Amsterdam, The Netherlands, 2021; pp. 127–160. [Google Scholar] [CrossRef]
  57. Qian, S.; Hou, R.; Yuan, R.; Zhou, B.; Chen, Z.; Chen, H. Removal of Escherichia coli from domestic sewage using biological sand filters: Reduction effect and microbial community analysis. Environ. Res. 2022, 209, 112908. [Google Scholar] [CrossRef] [PubMed]
  58. IS 3025-51; Methods of Sampling and Tests (Physical and Chemical) for Water and Waste Water, Part 51: Carbonate and Bicarbonate. Bureau of Indian Standards: New Delhi, India, 2023.
  59. IS 3025-11; Methods of Sampling and Test (Physical and Chemical) for Water and Wastewater, Part 11: pH Value. Bureau of Indian Standard: New Delhi, India, 1983.
  60. IS 3025-1; Methods of Sampling and Test (Physical and Chemical) for Water and Wastewater Part 1: Sampling. Bureau of Indian Standards: New Delhi, India, 1987.
  61. IS 3025-58; Methods of Sampling and Test (Physical and Chemical) for Water and Wastewater, Part 58: Chemical Oxygen Demand (COD). Bureau of Indian Standards: New Delhi, India, 2006.
  62. IS 3025-21; Methods of Sampling and Test (Physical and Chemical) for Water and Wastewater, Part 21: Total Hardness. Bureau of Indian Standard: New Delhi, India, 2009.
  63. Malik, M.A.S.; Tran, V.V. A simplified mathematical model for predicting the nocturnal output of a solar still. Sol. Energy 1973, 14, 371–385. [Google Scholar] [CrossRef]
  64. Sivakumar, V.; Ganapathy Sundaram, E. Assessment of convective heat transfer coefficient and mass of water evaporated from a single-slope passive solar still by different thermal models: An experimental validation. Int. J. Ambient Energy 2017, 38, 742–751. [Google Scholar] [CrossRef]
  65. Ogungbe, A.S.; Ogabi, C.O.; Alabi, A.A.; Ometan, O.O. Comparison of Heat Retention in Fresh Water and Salt Water Samples. Eur. J. Acad. Essays 2015, 2, 10–14. [Google Scholar]
  66. Dunkle, R. Solar Water distillation: The roof type still and a multiple effect diffusion still. In Conference International Heat Transfer; CSIRO: New York, NY, USA, 1961. [Google Scholar]
  67. Rahbar, N.; Esfahani, J.A.; Fotouhi-Bafghi, E. Estimation of convective heat transfer coefficient and water-productivity in a tubular solar still—CFD simulation and theoretical analysis. Sol. Energy 2015, 113, 313–323. [Google Scholar] [CrossRef]
  68. Chávez, S.; Terres, H.; Lizardi, A.; Lara, A.; Reyes, M.; Andrade, E. Study of Evaporative Heat and Mass Transfer in Solar Distillation. J. Phys. Conf. Ser. 2022, 2307, 012007. [Google Scholar] [CrossRef]
  69. Taylor, M.; Elliott, H.A.; Navitsky, L.O. Relationship between total dissolved solids and electrical conductivity in Marcellus hydraulic fracturing fluids. Water Sci. Technol. 2018, 77, 1998–2004. [Google Scholar] [CrossRef] [PubMed]
  70. Adjovu, G.E.; Stephen, H.; James, D.; Ahmad, S. Measurement of Total Dissolved Solids and Total Suspended Solids in Water Systems: A Review of the Issues, Conventional, and Remote Sensing Techniques. Remote Sens. 2023, 15, 3534. [Google Scholar] [CrossRef]
  71. Ozarks Environmental and Water Resources Institute. Standard Operating Procedure for: Total Suspended Solids (SOP-006); Missouri State University: Springfield, MO, USA, 2023; Available online: https://oewri.missouristate.edu/_Files/SOP-006_Total_Suspended_Solids_2023_2.pdf (accessed on 30 May 2026).
  72. Kiepper, B.H. Understanding Laboratory Wastewater Tests: II. Solids (TS, TSS, TDS, TVS, TFS); University of Georgia (UGA) Cooperative Extension: Athens, GA, USA, 2023. [Google Scholar]
  73. Kumar, R.; Kumar, A. WATER ANALYSIS | Biochemical Oxygen Demand. In Encyclopedia of Analytical Science, 2nd ed.; Elsevier: Amsterdam, The Netherlands, 2004; pp. 315–324. [Google Scholar] [CrossRef]
  74. Prakash, O.; Ahmad, A.; Kumar, A.; Chatterjee, R.; Chattopadhyaya, S.; Sharma, S.; Sharma, A.; Li, C.; Tag Eldin, E.M. Performance analysis and economic-feasibility evaluation of single-slope single-basin domestic solar still under different water-depths. Energies 2022, 15, 8517. [Google Scholar] [CrossRef]
  75. Otanicar, T.P.; Phelan, P.E.; Golden, J.S. Optical properties of liquids for direct absorption solar thermal energy systems. Sol. Energy 2009, 83, 969–977. [Google Scholar] [CrossRef]
  76. Thavamani, J.; Kumar, P. Experimental investigation on the performance improvement of double-slope solar still by different shapes of the channel integration. Environ. Sci. Pollut. Res. 2023, 30, 49450–49469. [Google Scholar] [CrossRef] [PubMed]
  77. Jeyaraj, T.; Kumar, P. Theoretical and experimental investigation of double slope solar still with channel integration: Energy, exergy and water quality analysis. Renew. Sustain. Energy Rev. 2023, 188, 113779. [Google Scholar] [CrossRef]
  78. Ishak, K.A.S.S.; Panneerselvam, A.; Ambikapathy, V.; Sathya, R.; Vinothkanna, A. An investigation of sewage water treatment plant and its physico-chemical analysis. Biocatal. Agric. Biotechnol. 2021, 35, 102061. [Google Scholar] [CrossRef]
  79. Bhutiani, R.; Khanna, D.R.; Kumar, S.; Ahamad, F. Physico-chemical analysis of Sewage water treatment plant at Jagjeetpur Haridwar, Uttarakhand. Environ. Conserv. J. 2016, 17, 133–142. [Google Scholar] [CrossRef]
  80. Koul, B.; Yadav, D.; Singh, S.; Kumar, M.; Song, M. Insights into the Domestic Wastewater Treatment (DWWT) Regimes: A Review. Water 2022, 14, 3542. [Google Scholar] [CrossRef]
  81. El Hafidi, E.M.; Mortadi, A.; Chahid, E.G.; Laasri, S. Monitoring of domestic wastewater treatment via infiltration percolation using impedance spectroscopy. Environ. Technol. Innov. 2023, 32, 103421. [Google Scholar] [CrossRef]
  82. Lu, S.; Pei, L.; Bai, X. Study on method of domestic wastewater treatment through new-type multi-layer artificial wetland. Int. J. Hydrogen Energy 2015, 40, 11207–11214. [Google Scholar] [CrossRef]
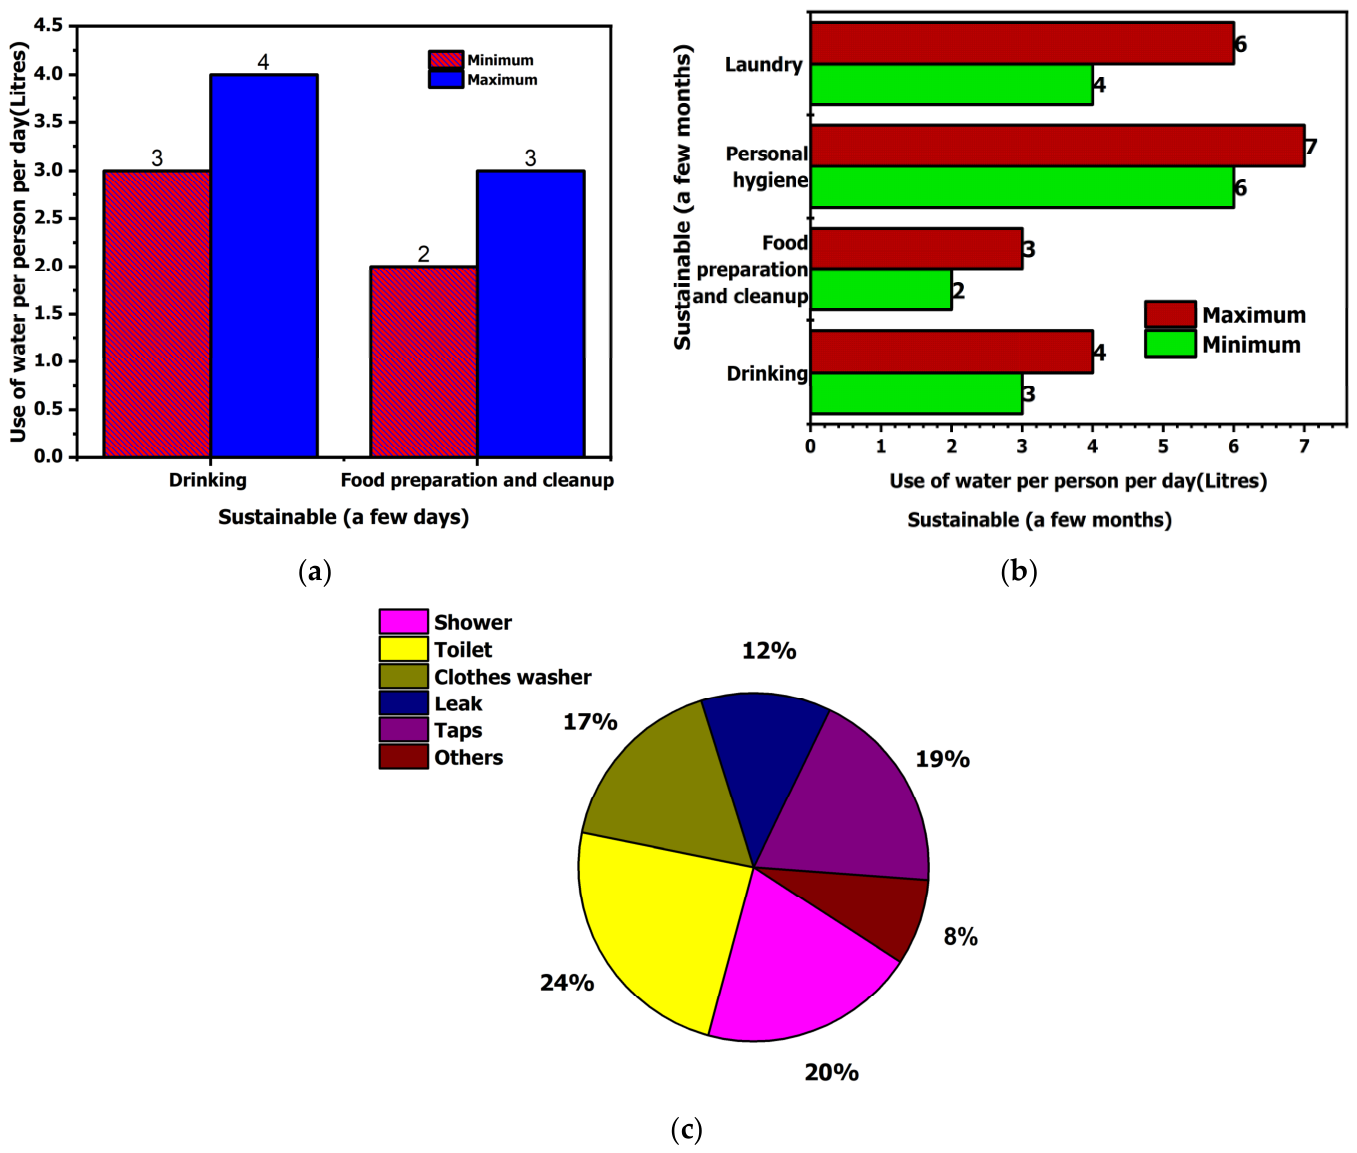
Figure 1. Consumption of water usage per person per day in (a) a few days, (b) a few months, (c) Water Usage in Residential [15].
Thermo 06 00052 g001
Figure 2. Location of the solar still in Kattankulathur-Chengalpattu.
Thermo 06 00052 g002
Figure 3. Schematic diagram of the experimental setup and feedwater supply system of the MDSSS.
Thermo 06 00052 g003
Figure 4. Experimental setup of MDSSS when comparing the different water quality.
Thermo 06 00052 g004
Figure 5. Comparison of the wind velocity, solar radiation, and ambient temperature with Indian Standard Time on 30 May 2024.
Thermo 06 00052 g005
Figure 6. Compare the basin water temperature in a solar still for various water quality types on 30 May 2024.
Thermo 06 00052 g006
Figure 7. Comparison of the glass cover temperature in a solar still for various water quality types on 30 May 2024.
Thermo 06 00052 g007
Figure 8. Comparison of the channel exit temperature in a solar still for various water quality types on 30 May 2024.
Thermo 06 00052 g008
Figure 9. Compare the yield of water per hour in a solar still for various water quality types at 30 May 2024.
Thermo 06 00052 g009
Figure 10. Comparison of the cumulative water yield in a solar still for various water quality types on 30 May 2024.
Thermo 06 00052 g010
Figure 11. Comparison of the average water yield in a solar still for various water quality types on 30 May 2024.
Thermo 06 00052 g011
Figure 12. Flow chart for calculating distillate water price [77].
Thermo 06 00052 g012
Table 1. Meteorological conditions for selected location.
Location ParametersValue
Location of the selected site
Latitude12.8230° N
Longitude80.0447° E
Weather conditions
Atmospheric temperature ranges27–33 °C
Relative humidity80–89%
Average daily solar irradiations for Chengalpattu5.88 kWh/m2
Peak solar radiation in the day6.6 kWh/m2 in June
Lowest solar radiation in the day1.9 kWh/m2 in December
Wind velocity0–5.9 m/s
Conducted the experiment periodApril, May, June 2024
Table 2. Comparison of various water quality parameters at the initial condition [59,60,61,62].
ParametersGroundwater (GW)Saline Salt Water (SSW)SWStandards for Discharge into Inland Surface Water
pH7.286.997.125.5–9.0
Electrical conductivity (EC) (mg/L)686610NA
Dissolved oxygen (DO) (mg/L)5.665.695.094–6
COD (mg/L)11015360250
Turbidity (NTU)0.31.38.35–10
Total Hardness (TH) (mg/L)3253601400250
Table 3. Range and accuracy for the calibrated instruments used in this study.
InstrumentsRangeAccuracy
Thermocouples0–100 °C±0.1 °C
Solar power meter0–2000 W/m2±0.1 W/m2
Anemometer0.4–30 m/s±0.1 m/s
Measuring beaker1000 mL±10 mL
TDS meter0–9990 ppm±0.005 ppm
Table 4. Comparison of water yield for various water quality types in a solar still.
DateTa
(°C)
Wind Speed
(m/s)
Solar Radiation
(W/m2)
Ground Water
(L/m2)
Saline Water
(L/m2)
SW
(L/m2)
1 May 2024404.6410503.1202.8502.550
4 May 2024386.169853.0002.7252.400
8 May 2024345.149552.8502.5502.250
17 May 2024324.699422.8002.6002.300
23 May 2024362.579752.9502.6502.350
27 May 2024386.469883.0502.7502.450
30 May 2024414.7010983.2752.9502.640
Average water yield in May 20243.0062.7252.420
Decrease in the yield rate compared to groundwater 9.35%19.49%
Table 5. Physical Characteristics Analysis.
Physical CharacteristicsGWSSWSW
Before Treatment (B)After Treatment (A)Before Treatment (B)After Treatment (A)Before Treatment (B)After Treatment (A)
ColorThermo 06 00052 i001Thermo 06 00052 i002Thermo 06 00052 i003Thermo 06 00052 i004Thermo 06 00052 i005Thermo 06 00052 i006
Turbidity (NTU)0.30.21.30.38.30.2
TasteSourSweetSaltySweetNANA
OdorOdorOdorlessOdorOdorlessOdorOdorless
Table 6. Chemical Characteristics Analysis.
Chemical TestGWSSWSWMethod Adopted
BABABA
pH7.286.896.996.827.126.99IS 3025-11
DO (mg/L)5.665.376.695.365.365.09IS 3025-38
COD (mg/L)1100215036012IS 3025-58
TH (mg/L)32575360251400150IS 3025-21
Conductivity (mS/cm)684664109IS 3025-14
Table 7. Biological Characteristics Analysis.
Biological CharacteristicsGWSSWSW
BABABA
BOD (mg/L)422–410BDL1564–6
E. coli (mg/L)2 in 100BDLBDLBDL106 in 100BDL
Table 8. Economic analysis compared for the MDSSS.
ParametersUnitDSSS + SquareDSSS + SquareDSSS + Square
Type of water Ground waterSaline waterSW
Cost of CapitalRs900090009000
Capital recovery factor (CRF)-0.1760.1760.176
Fixed annual cost (FAC)Rs/year158415841584
Salvage value(S)Rs180018001800
SFF-0.0570.0570.057
Annual Salvage Cost (ASV)Rs/year102.60102.60102.60
Annual Maintenance Cost (AMC)Rs/year237.60237.60237.60
Annual cost (AC)Rs/year171917191719
Yield rate per dayL/day3.2752.9502.640
Average annual productivity (Pd)L/year956.3861.4770.8
Cost per liter of yield (CPL)Rs/L1.791.992.23
Annual market value of water (Rs 15/L)Rs/year14,344.512,921.011,562.0
Cost per liter per market (Rs 15)Rs/L49.12544.2539.60
Payback periodDays183.2203.4227.3
Table 9. Analyzing the water quality using various treatment techniques for different types of water.
SourceType of WaterTreatment TechniquesAnalyzing the Water Quality (mg/L)
[78]SewageSewage
treatment plant (STP)
ParametersInletOutletVariation
TSS (mg/L)1102585
TDS (mg/L)580435145
BOD (mg/L)32012308
COD (mg/L)83033797
[79]15 samples of sewage water18 MLD
sewage
treatment
plant
ParametersInletOutletVariation
pH7.13–8.766.01–8.21.12–0.56
Cl (mg/L)96.5–112.945.4–57.251.1–55.7
CaCO3178–211154–20524–6
DO (mg/L)0.70–1.964.01–6.223.31–4.26
Hardness (mg/L)212–249178–21034–39
BOD (mg/L)90–1293.6–8.586.4–120.5
COD (mg/L)231–25216–30215–222
[80]Domestic sewage waterDomestic Wastewater TreatmentParameterType of waterRanges
TDS (mg/L)Drinking water350–500
Waste water2000
BOD (mg/L)Drinking water1–2
Clean water3–5
Polluted water6–9
[81]Domestic wastewaterInfiltration
percolation
This method effectively removes 81–99% of heavy metals, 86% of suspended matter, 70% of BOD5, and 80% of COD.
[82]Domestic wastewaterMulti-layer
artificial
wetland
The wetland could be cleaned of COD, BOD5, Total nitrogen, and Total phosphorus, with an average removal rate of 90.6%, 87.9%, 63.4%, and 92.6%, respectively.
This workType of waterModified double-slope solar stillType of waterParametersInletOutletVariation
Ground waterpH7.286.890.39
Saline water6.996.820.17
Sewage water7.126.990.13
Ground waterDO (mg/L)5.665.370.29
Saline water6.695.360.33
Sewage water5.365.090.27
Ground waterCOD (mg/L)5.665.370.29
Saline water6.695.360.33
Sewage water5.365.090.27
Ground waterTH (mg/L)11002108
Saline water15015
Sewage water36012348
Ground waterBOD (mg/L)32575250
Saline water36025335
Sewage water1400121388
Ground waterE-coli (mg/L)2/10002
Saline water000
Sewage water106/1000106
Ground waterTurbidity
(NTU)
0.30.20.1
Saline water1.30.31.0
Sewage water8.30.28.1
Disclaimer/Publisher’s Note: The statements, opinions and data contained in all publications are solely those of the individual author(s) and contributor(s) and not of MDPI and/or the editor(s). MDPI and/or the editor(s) disclaim responsibility for any injury to people or property resulting from any ideas, methods, instructions or products referred to in the content.