Article

Experimental Investigation of Thermal and Electrical Performance of a PVT System with Pulsating Flow Under Solar Simulation


by
Abdulwahed Mushabbab
1,
Abdulelah Alhamayani
2,* and
Andrew Chiasson
3
1
Department of Applied Mechanical Engineering, College of Applied Engineering, King Saud University, P.O. Box 800, Riyadh 11421, Saudi Arabia
2
Mechanical Engineering Department, College of Engineering and Architecture, Umm Al-Qura University, P.O. Box 5555, Makkah 24382, Saudi Arabia
3
Department of Mechanical and Aerospace Engineering, University of Dayton, Dayton, OH 45469, USA
*
Author to whom correspondence should be addressed.
Thermo 2026, 6(1), 11; https://doi.org/10.3390/thermo6010011
Submission received: 22 November 2025 / Revised: 20 January 2026 / Accepted: 27 January 2026 / Published: 3 February 2026

Abstract

Photovoltaic–thermal (PVT) collectors often experience limited heat extraction under laminar cooling conditions, and the influence of controlled flow pulsation on full-scale PVT performance has not been clearly established. This study experimentally investigates a water-cooled PVT system operated under pulsating flow using an indoor solar simulator to quantify its thermal and electrical response. Flow pulsations were generated using a solenoid valve at frequencies of 0.25, 0.5, 1, and 2 Hz across inlet flow rates of 1–4 L/min, with average irradiance maintained between 700 and 800 W/m2. System performance was benchmarked against uncooled and continuous-flow reference cases. Pulsating operation reduced the PVT surface temperature and produced a clear enhancement in thermal performance relative to continuous flow, while electrical efficiency exhibited a smaller but consistent improvement that followed the same thermal trend. A pulsation frequency of 0.5 Hz yielded the most favorable results, achieving thermal efficiencies exceeding 50% at higher flow rates without any measurable increase in average pressure drop. Electrical efficiency stabilized at approximately 9.82%, slightly higher than that obtained under continuous-flow operation. The results indicate that low-frequency pulsating flow can significantly improve thermal energy extraction in PVT systems under controlled conditions, with modest associated electrical gains, and provide a basis for further investigation of flow-modulation strategies for thermally driven PVT applications.

1. Introduction

The increasing deployment of solar photovoltaic (PV) systems is driven by the urgent demand for clean energy solutions, the falling cost of solar technology, and rising conversion efficiencies [1,2,3]. However, one of the main limitations of PV modules is their strong temperature dependence. As the operating temperature increases, the electrical output of the panel decreases due to higher cell resistance and thermal degradation effects [4]. This issue becomes more pronounced under high irradiance or indoor simulated testing conditions, where limited natural convection leads to rapid heat accumulation on the PV surface [5]. To mitigate thermal buildup, active cooling techniques have been integrated into PV systems, resulting in photovoltaic thermal (PVT) configurations that recover both electrical and thermal energy. Water-based PVT systems in particular offer superior heat transfer performance relative to air-based counterparts, with reported thermal efficiencies exceeding 75% under laboratory conditions [6,7,8,9]. Despite advancements in thermal extraction, attaining consistent and efficient cooling across the full photovoltaic surface remains a problem that requires more innovation.
In recent years, PVT systems have seen a surge in innovation aimed at enhancing both thermal management and energy efficiency. Mahdi et al. developed a hybrid PVT system integrating phase change materials (PCMs), porous media, and nanofluids, resulting in significant thermal management improvements and increased system efficiency [10]. Namuq and Mahdi [11] further enhanced thermal regulation by incorporating porous fins with PCMs, achieving better heat transfer and reduced PV cell temperatures. They showed that using optimized staggered porous fins with phase change materials in PVT systems lowered peak PV cell temperature by about 5 °C, improved heat transfer during PCM melting, and increased thermal efficiency by 16% and electrical output by 2.9% compared to finless and solid-fin designs. Riad et al. [12] conducted a comparative study on symmetric and asymmetric copper tubing designs for PVT systems, demonstrating that optimized tubing configurations can lead to more uniform cooling and improved electrical output. It can be seen that optimized serpentine copper tubing layouts in PVT systems improve cooling uniformity, with a symmetric design reducing PV temperature to 39.8 °C and achieving 16.8% electrical efficiency, while an asymmetric design operated at 42.7 °C with slightly lower electrical efficiency but higher thermal efficiency of about 30.4%. Additionally, adaptive cooling strategies, such as the self-adaptive wicking evaporator developed by Liu et al. [13], have shown promise in regulating PV temperatures through controlled evaporation processes. Advanced control strategies have also been explored to optimize PVT system performance. A study by Cornago et al. [14] introduced an optimized four-step fan control strategy, resulting in a 2.3% increase in the net annual energy balance for rooftop PV installations. Furthermore, the integration of nanofluids, such as iron and copper oxides, has been investigated to enhance cooling efficiency, with studies indicating significant reductions in PV module temperatures [15]. Recently, Alhamayani conducted a detailed numerical and deep learning-based analysis of PVT systems cooled with various nanofluids under Riyadh’s extreme climate. The study identified CuO nanofluid at 4% volume concentration as the most effective coolant, achieving a PVT panel temperature reduction of 34.5 °C, with electrical, thermal, and total exergy efficiencies of 16.7%, 79.2%, and 18.07%, respectively [16]. These developments underscore the ongoing efforts to address thermal challenges in PVT systems, aiming to maintain optimal operating temperatures and maximize energy output. The integration of advanced materials, innovative cooling designs, and adaptive control strategies represents a significant step forward in the evolution of efficient and sustainable PVT technologies. Other studies have investigated novel methods to enhance cooling in PVT systems through the reconfiguration of absorber surfaces and the application of sophisticated coolant mixtures. A study by Ahmed et al. [17] looked at a modified PVT collector equipped with fea-tures like ribs, petal-shaped structures, and twisted coil inserts. Their tests were per-formeddone indoors under solar irradiance ranging from 400 to 1000 W/m2, with flow rates between 0.6 and 4.5 L per minute. By using silicon carbide-based nanofluids and phase-change materials, they achieved thermal efficiency as high as 86.2% and elec-trical efficiency around 11%. In a separate study, Azeez et al. [18] tested absorber tubes with dimples, petal patterns, and twisted tapes under similar flow conditions. Com-pared to smooth tubes with plain water, their setup delivered up to three times better heat transfer, along with a 32% boost in electrical output and a 21.2% increase in thermal energy.
While much work has focused on material and design upgrades, flow control itself remains a largely untapped lever. One approach gaining traction is pulsating flow. By intermittently disrupting the thermal boundary layer and enhancing fluid mixing, pulsating flow mechanisms offer the potential to improve convective heat transfer coefficients and overall system thermal performance [19]. Extensive studies in heat transfer literature have analyzed its impact on various configurations. Elshafei et al. [20] investigated turbulent pulsating airflow through a heated copper tube, using a rotating butterfly valve to generate pulsations downstream. Their results showed significant heat transfer sensitivity to frequency (6.6–68 Hz) and Reynolds number (10,900–37,000), with distinct deviations from steady flow behavior. Davletshin et al. [21] studied airflow with forced pulsations in rib-roughened channels and found up to 30% enhancement in local heat transfer, particularly near the ribs, with pulsation frequencies up to 100 Hz. Khosravi-Bizhaem et al. [22] used distilled water through helically coiled tubes, pulsed via a solenoid valve. At low Reynolds numbers (2000–9500) and frequencies between 2 and 10 Hz, the optimal performance was achieved at 4 Hz, yielding a nearly 20% improvement in convective heat transfer. Naphon and Wiriyasart [23] explored nanofluid flow under pulsation generated by a peristaltic pump through micro-fin tubes subjected to a magnetic field. Their laminar flow experiments (Re < 2400) under 160 W heat input showed a 22.2% Nusselt number increase at 20 Hz frequency over base fluid.
Bayomy and Saghir [24] investigated aluminum foam heat sinks cooled by pulsating water flow at low frequencies (0.04–0.1 Hz) and a velocity of 0.7 m/s. With a heat flux of 13.8 W/cm2 applied from below, they observed up to 14% increase in the average Nusselt number and notable temperature reductions, showing pulsation’s relevance in electronics cooling. In the solar domain, Nateqi et al. [25] implemented a low-frequency (0.2 Hz) pulsating spray cooling system over PV modules, showing a 50% reduction in water use and 16.84% increase in electrical efficiency relative to a non-cooled panel. Alizadeh et al. [26] simulated a flat plate closed-loop pulsating heat pipe beneath PV modules under various irradiance levels. Their results showed up to 22.2 °C temperature drop and a 35.3% improvement in panel efficiency. Ibrahim et al. [27] conducted an experimental study applying pulsating water flow through a 0.4 m cooling channel under a concentrated multijunction PV panel. At a fixed frequency of 0.5 Hz and variable flow rates (up to 2.7 L/min), the system demonstrated marginal surface cooling but improved electrical output compared to steady flow, especially at moderate flow conditions. These studies confirm that pulsating flow can deliver meaningful thermal advantages in compact systems, provided that the flow and frequency are properly tuned. Table 1 summarizes key previous studies on pulsating flow and its impact on thermal performance across different domains, including its nascent application in PV cooling.
Although pulsating flow has been studied extensively as a heat transfer technique, its use for cooling full scale monocrystalline PVT collectors under indoor solar simulation is still rarely addressed. To the authors’ knowledge, earlier work has not systematically mapped how pulsation frequency affects thermal and electrical performance together in a complete PVT unit, rather than in simplified heat exchanger rigs or small PV samples. This study closes that gap by quantifying how changes in pulsation frequency and flow rate influence surface temperature, electrical efficiency, thermal efficiency, and pressure drop in a full-scale water-cooled PVT system operating in the laminar regime. Unlike previous PVT studies, the present work evaluates these thermal, electrical, and hydraulic responses simultaneously in a complete, full-scale monocrystalline PVT module under controlled indoor solar simulation, enabling direct comparison between continuous and pulsating flow operation. Using laminar water flow is deliberate because it provides a clean baseline with well controlled conditions, which helps separate the influence of pulsation settings from turbulence driven effects that can mask trends. A dedicated experimental platform was therefore built around an indoor solar simulator and solenoid valve-based pulsation control, allowing repeatable tests across multiple frequencies and flow rates under steady irradiance. Beyond reporting performance metrics, this approach also helps clarify practical tradeoffs that matter in real systems, such as whether temperature uniformity improves or worsens as pulsation settings change and whether any benefit comes with an added hydraulic penalty. The resulting dataset provides a reference point for later studies that move toward more applied operating scenarios, including outdoor transients, different channel layouts, and alternative working fluids such as nanofluids.

2. Construction of the PVT System

2.1. Electrical Instruments

This study employs an experimental setup that integrates several electrical instrumentation and control systems to facilitate real-time monitoring and performance measurement of the photovoltaic thermal (PVT) system. A 150 W monocrystalline silicon photovoltaic module, with 36 high-efficiency cells, is mounted horizontally beneath artificial light sources, acting as the main experiment component of the system. The panel generates electrical power, which is directed to a 12 V, 89 Ah battery to safely absorb and dissipate the output during testing. High-precision voltage measurements were obtained using an ADS1115 analog-to-digital converter (Brooklyn, NY, USA), while current output was monitored using an INA219 current sensor (Brooklyn, NY, USA). Both sensors were interfaced with an Arduino UNO, which handled data acquisition and logging to a memory card for later analysis. The incorporation of a Maximum Power Point Tracking (MPPT) solar charge controller optimized the power transfer from the photovoltaic module to the battery, ensuring efficient energy conversion under the given irradiance conditions. Table 2 lists all the electrical instruments utilized in this study.

2.2. Solar Simulator

This research aims to examine the performance of the PVT system integrated with a pulsating pump under steady and controlled solar radiation conditions. A solar simulator is built indoors to eliminate any external variables that could influence the measurements of this experiment.
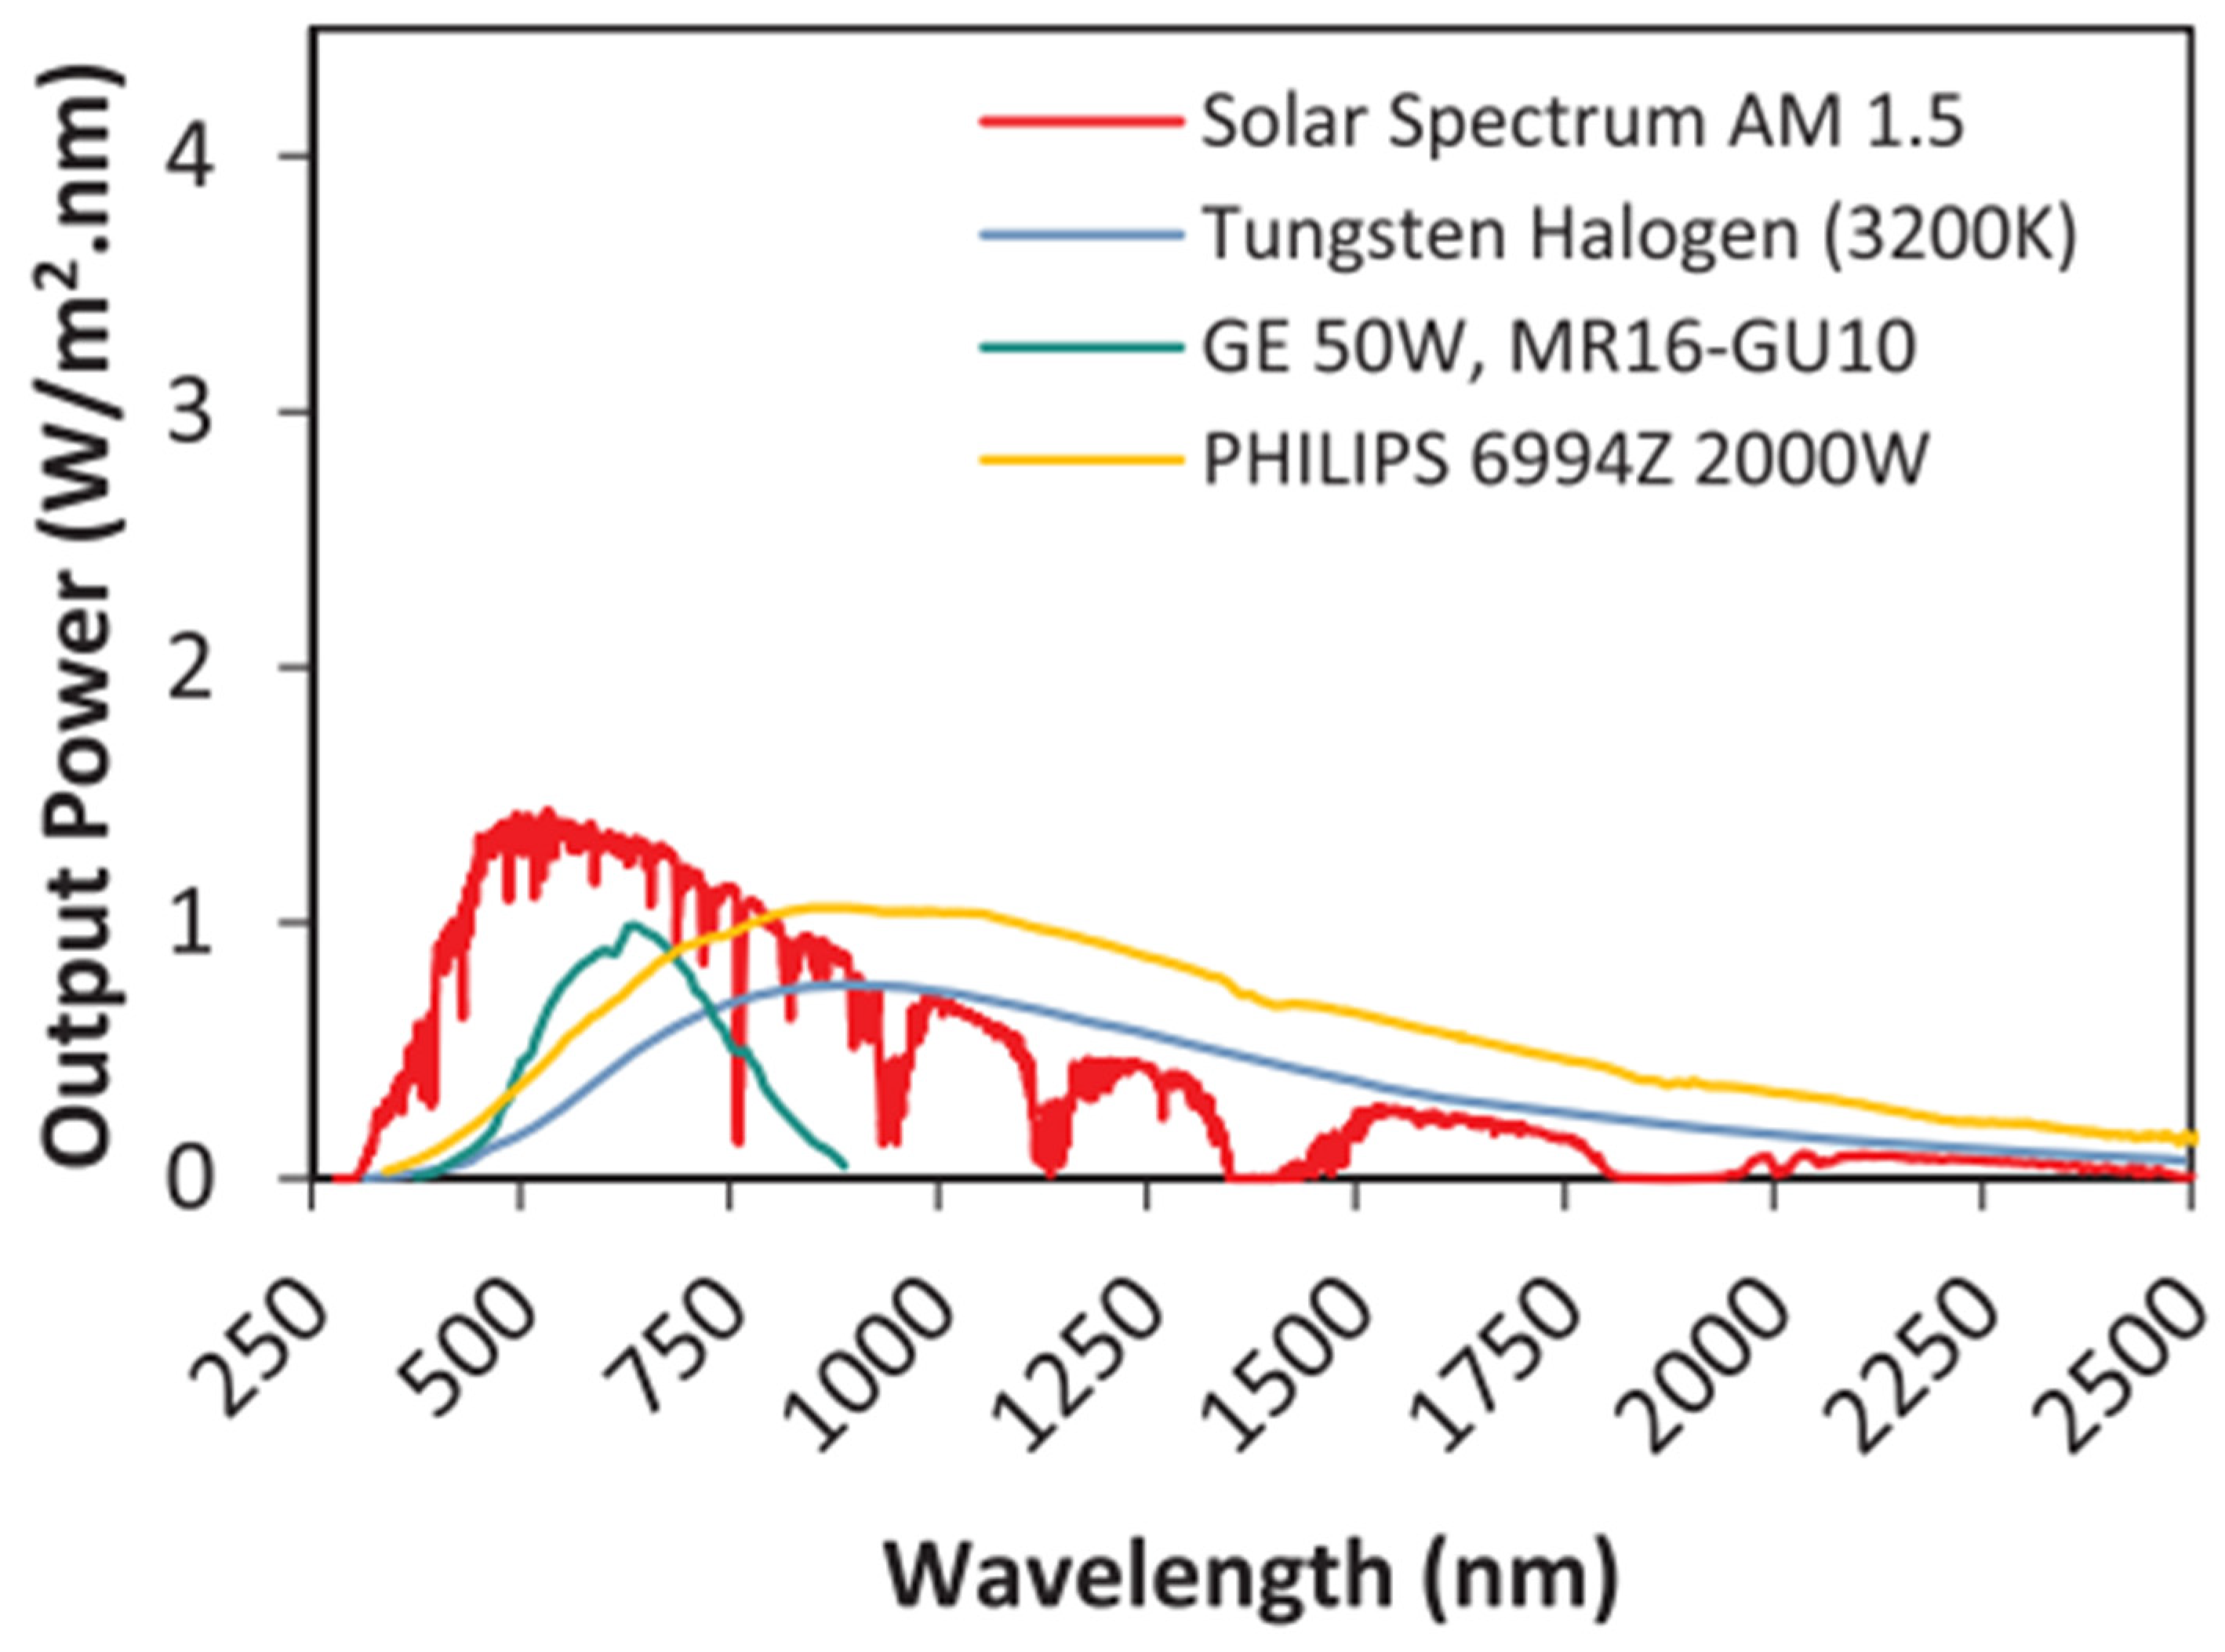
Various lamp types are frequently employed as light sources for solar simulators, including metal halide bulbs, xenon arc lamps, and mercury vapor lamps. Halogen lamps were selected in this study due to their affordability, ease of use, and compatibility with standard 120 V AC power supplies, eliminating the need for specialized drivers. These lamps are commonly used in solar simulation for their broad spectral emission across visible and near-infrared regions. The spectral distribution of halogen lamps differs from the AM1.5 solar spectrum because their lower color temperature (3000–3500 K compared to 5800 K for the sun) reduces ultraviolet and short-wave content while increasing infrared radiation. This spectral shift can raise the module temperature and slightly reduce electrical efficiency relative to outdoor sunlight. Nevertheless, halogen lamps provide a continuous emission across the visible range that closely resembles natural sunlight and are widely accepted in indoor PVT research [28,29,30,31]. Figure 1 compares their typical output with the standard solar spectrum.
For PVT applications, this spectral mismatch mainly influences the electrical response, while thermal efficiency is much less sensitive to spectral differences. Therefore, results under real outdoor sunlight may differ. Thermal performance may drop slightly while electrical performance may rise slightly. As a result, relative comparisons between steady and pulsating cooling remain reliable when both cases are tested under the same indoor conditions. In addition, halogen lamps supply stable irradiance with constant voltage, ensuring repeatable operation. Running the simulator indoors allowed irradiance to be applied consistently and independently of weather or time of day, which was essential for isolating the effect of pulsating flow on PVT performance.
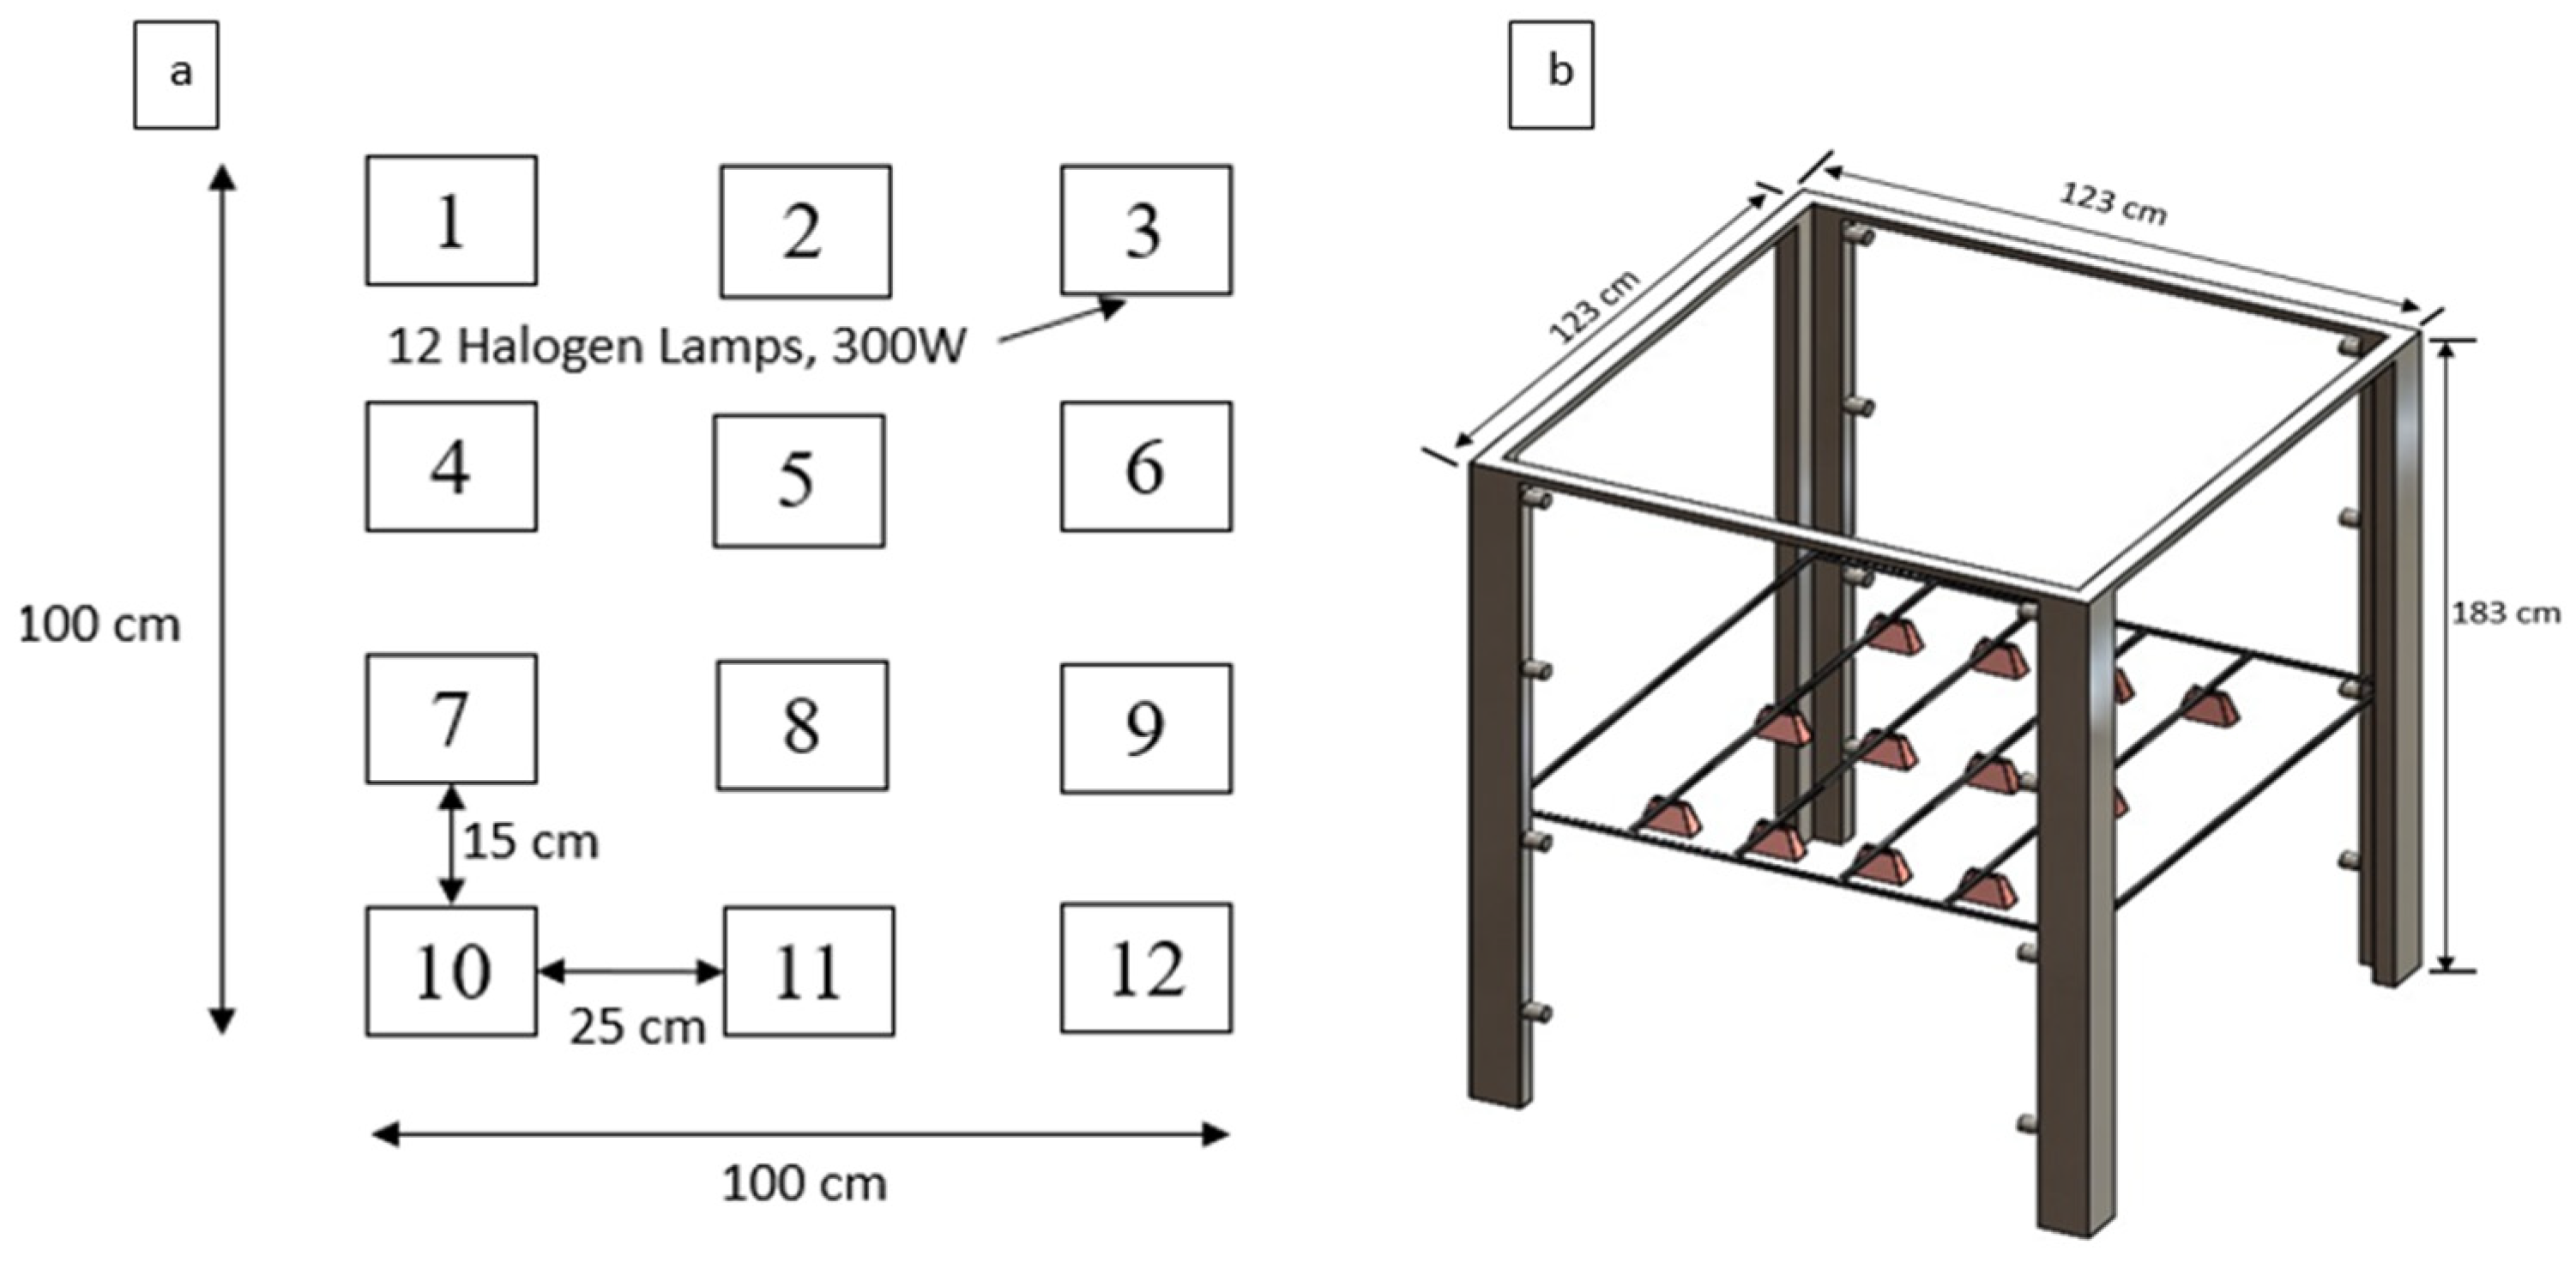
The solar simulator was designed in accordance with the EN-12975-2 standard [33,34]. It consists of twelve halogen lamps, each with an integrated reflector, arranged in a uniform 4 × 3 matrix above the test module. The protective glass covers of the halogen lamps were removed to enhance irradiance output at the PV surface. The lamps are double-ended with coiled-coil tungsten filaments and produce halogen light with a color temperature of approximately 3000 K. Each lamp operates at 120 V and uses a 300 W Feit Electric halogen bulb. The twelve lamps are organized into four independent circuits, each comprising three lamps connected to the 120 V power supply through separate switches. This arrangement allows precise control over the total irradiance output.
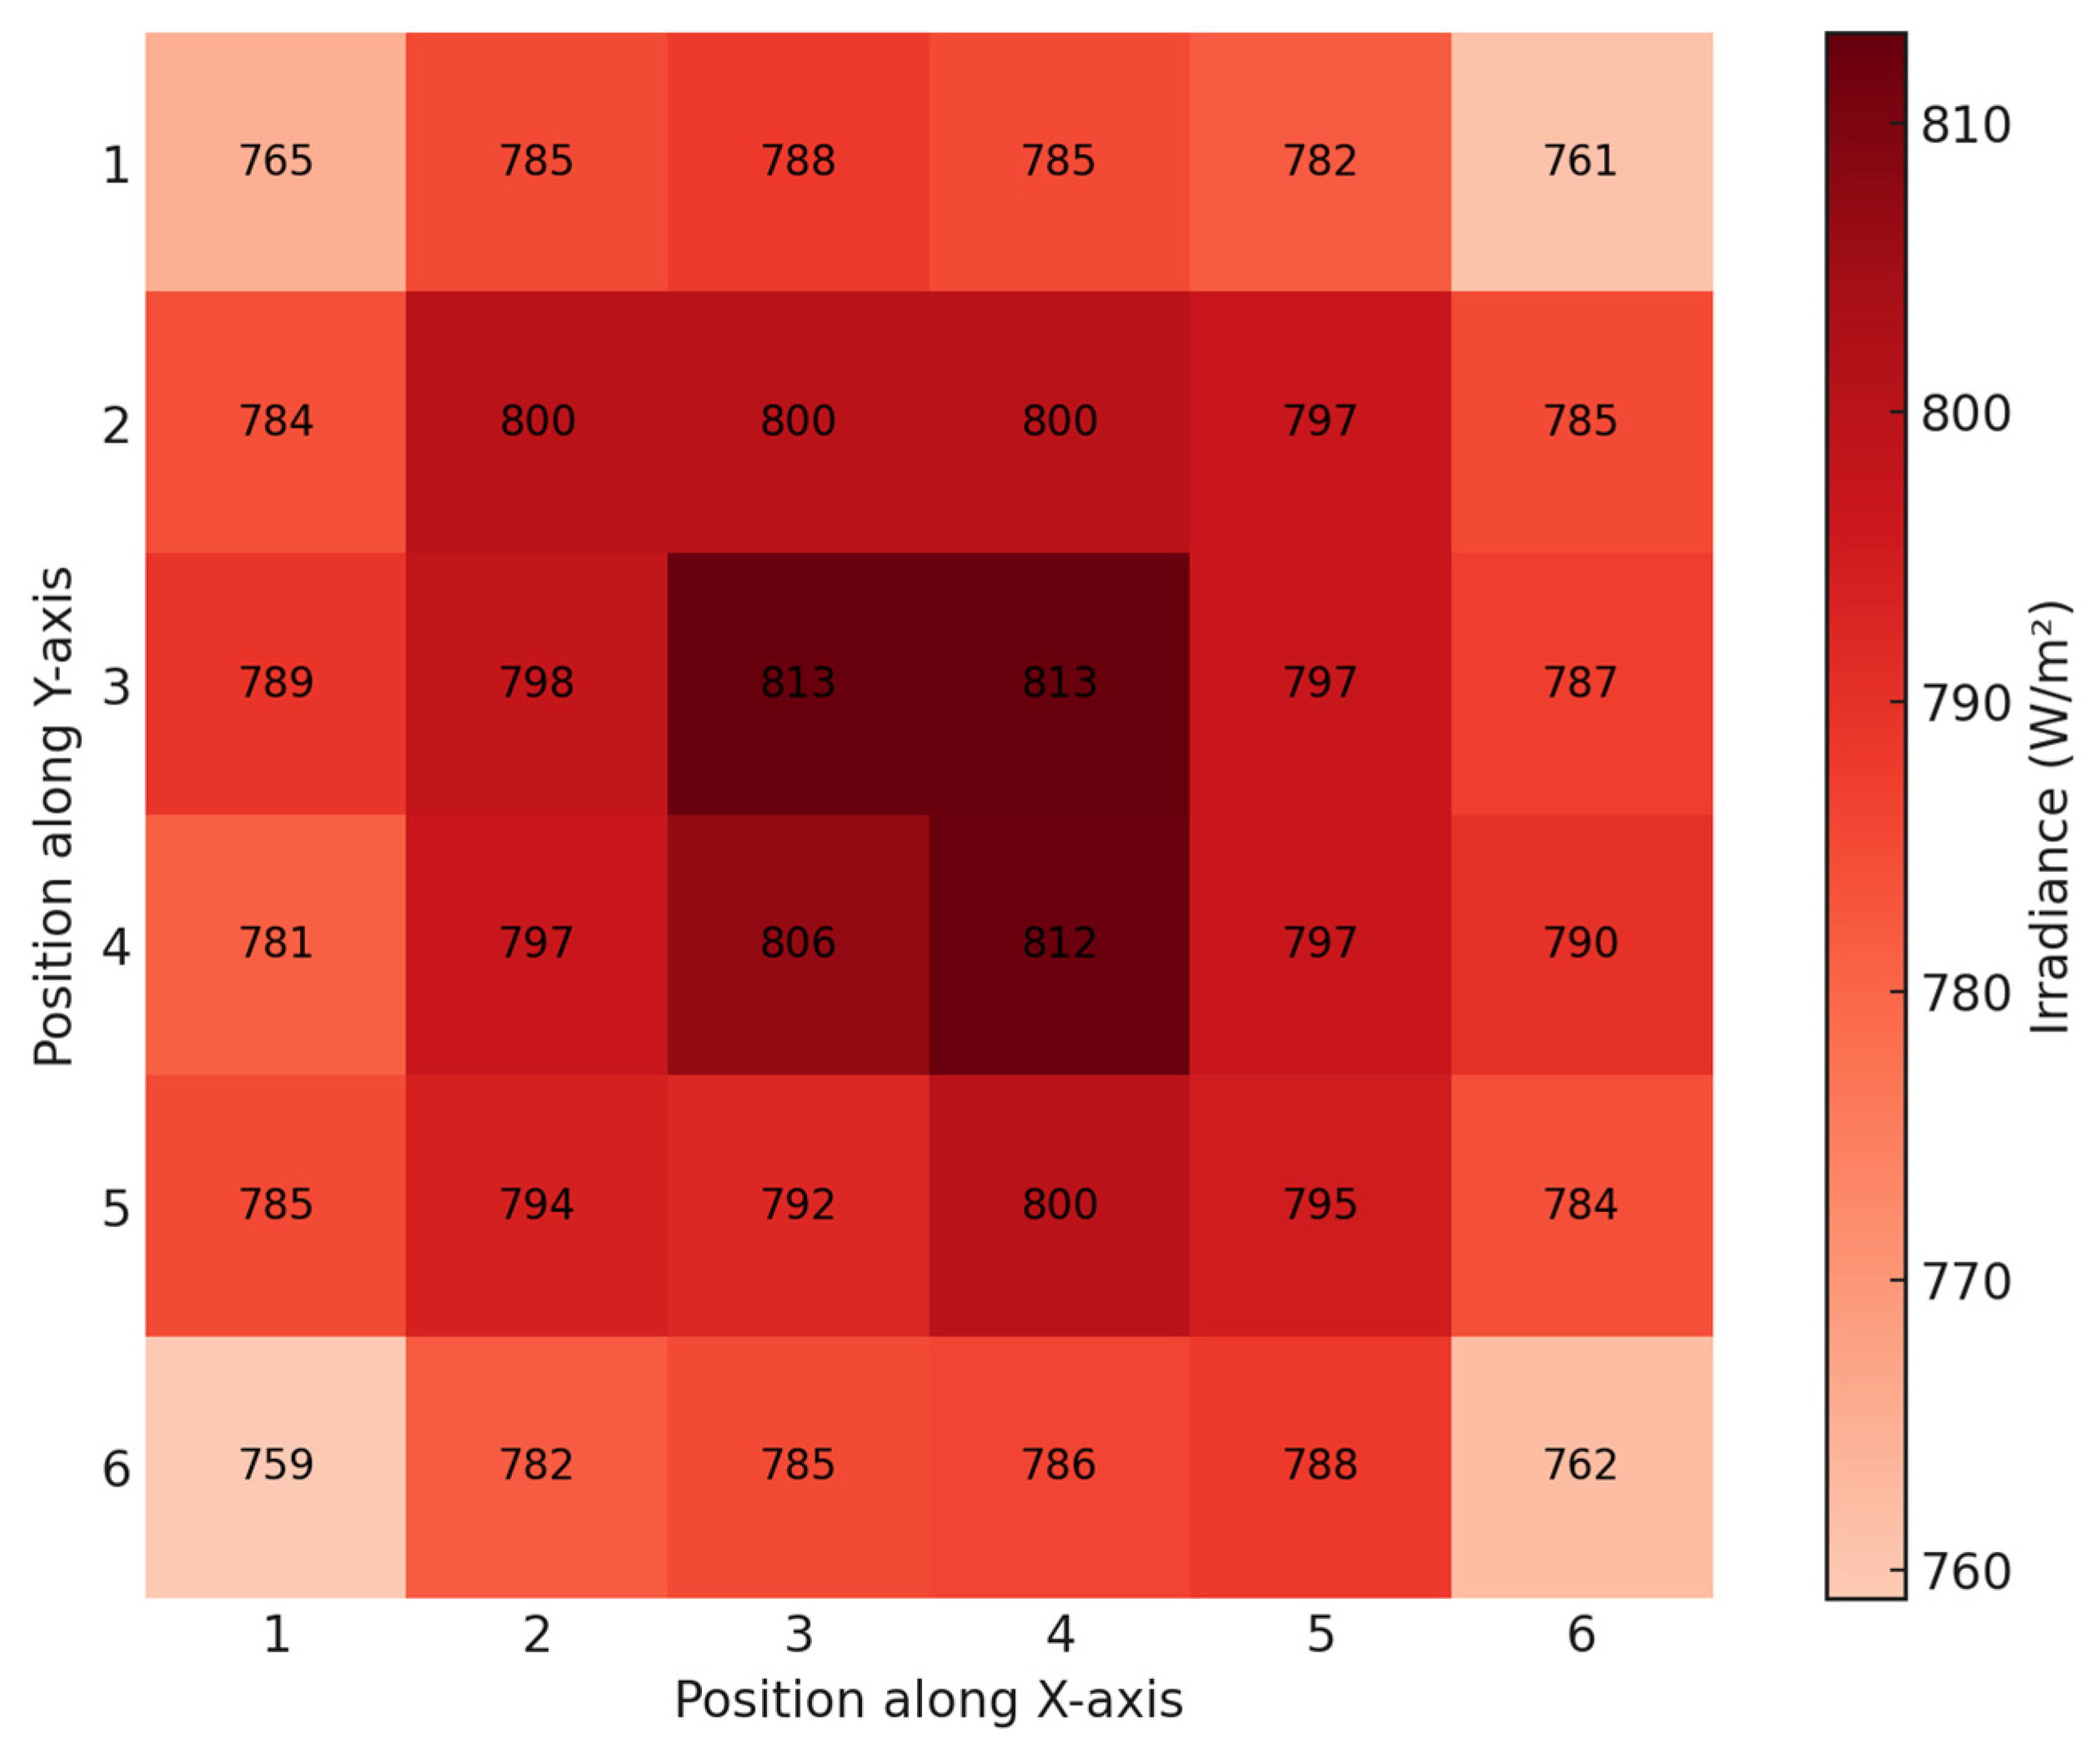
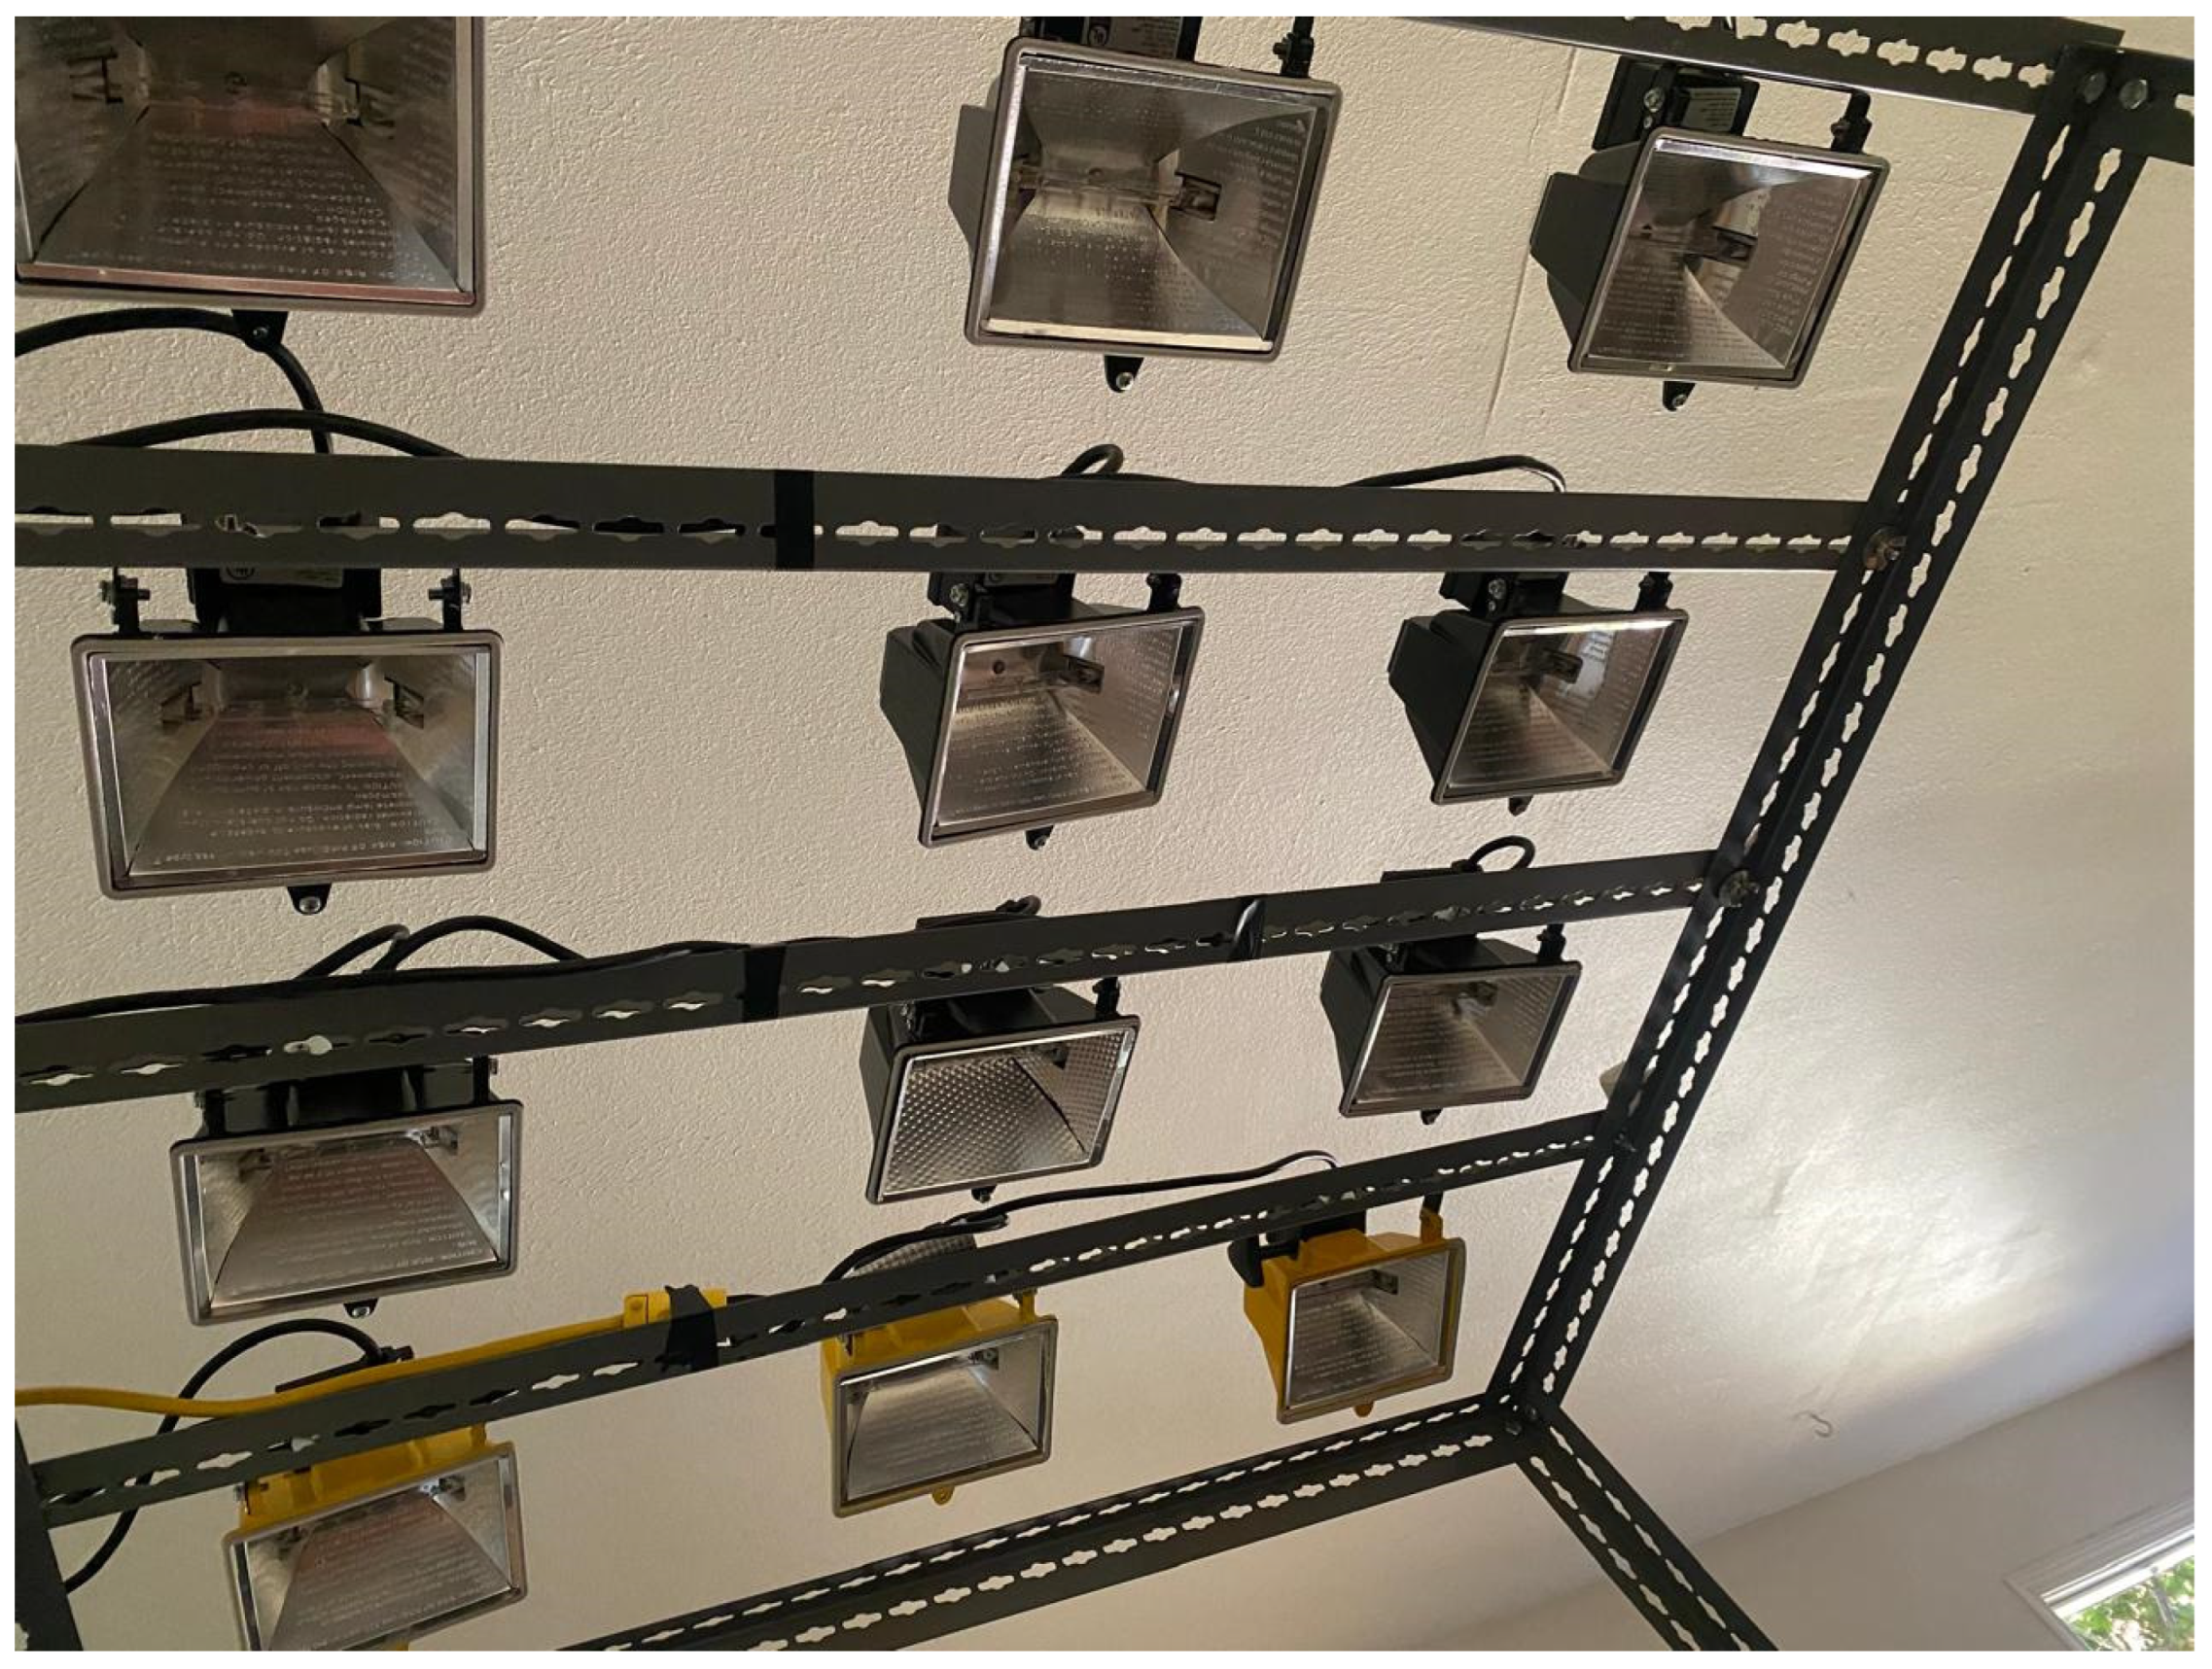
The solar simulator is mounted on a steel frame (123 cm × 123 cm × 183 cm) with adjustable height to control the irradiance level at the PV surface. The chosen steel frame is coated with gray enamel to reduce light reflection and dispersion, facilitating a more uniform light distribution. Figure 2 illustrates the physical layout of the solar simulator, including the arrangement of halogen lamps and the supporting structure used for testing. Irradiance was measured at 36 locations across the PV surface using a Vici LX107 pyranometer, with a maximum spacing of 15 cm between points, in accordance with EN-12975-2. The measured average irradiance ranges between 700 and 800 W/m2 with a spatial variation of approximately ±10.2%, which falls within the acceptable tolerance specified by EN-12975-2 for indoor testing. The entire irradiance mapping procedure was repeated three times, and the results were consistently close, confirming the stability and repeatability of the simulator’s output. Figure 3 shows an example of the irradiance mapping across the PV surface, while Figure 4 shows the solar simulator after it has been set up.

2.3. PVT System and Pulsating Mechanism

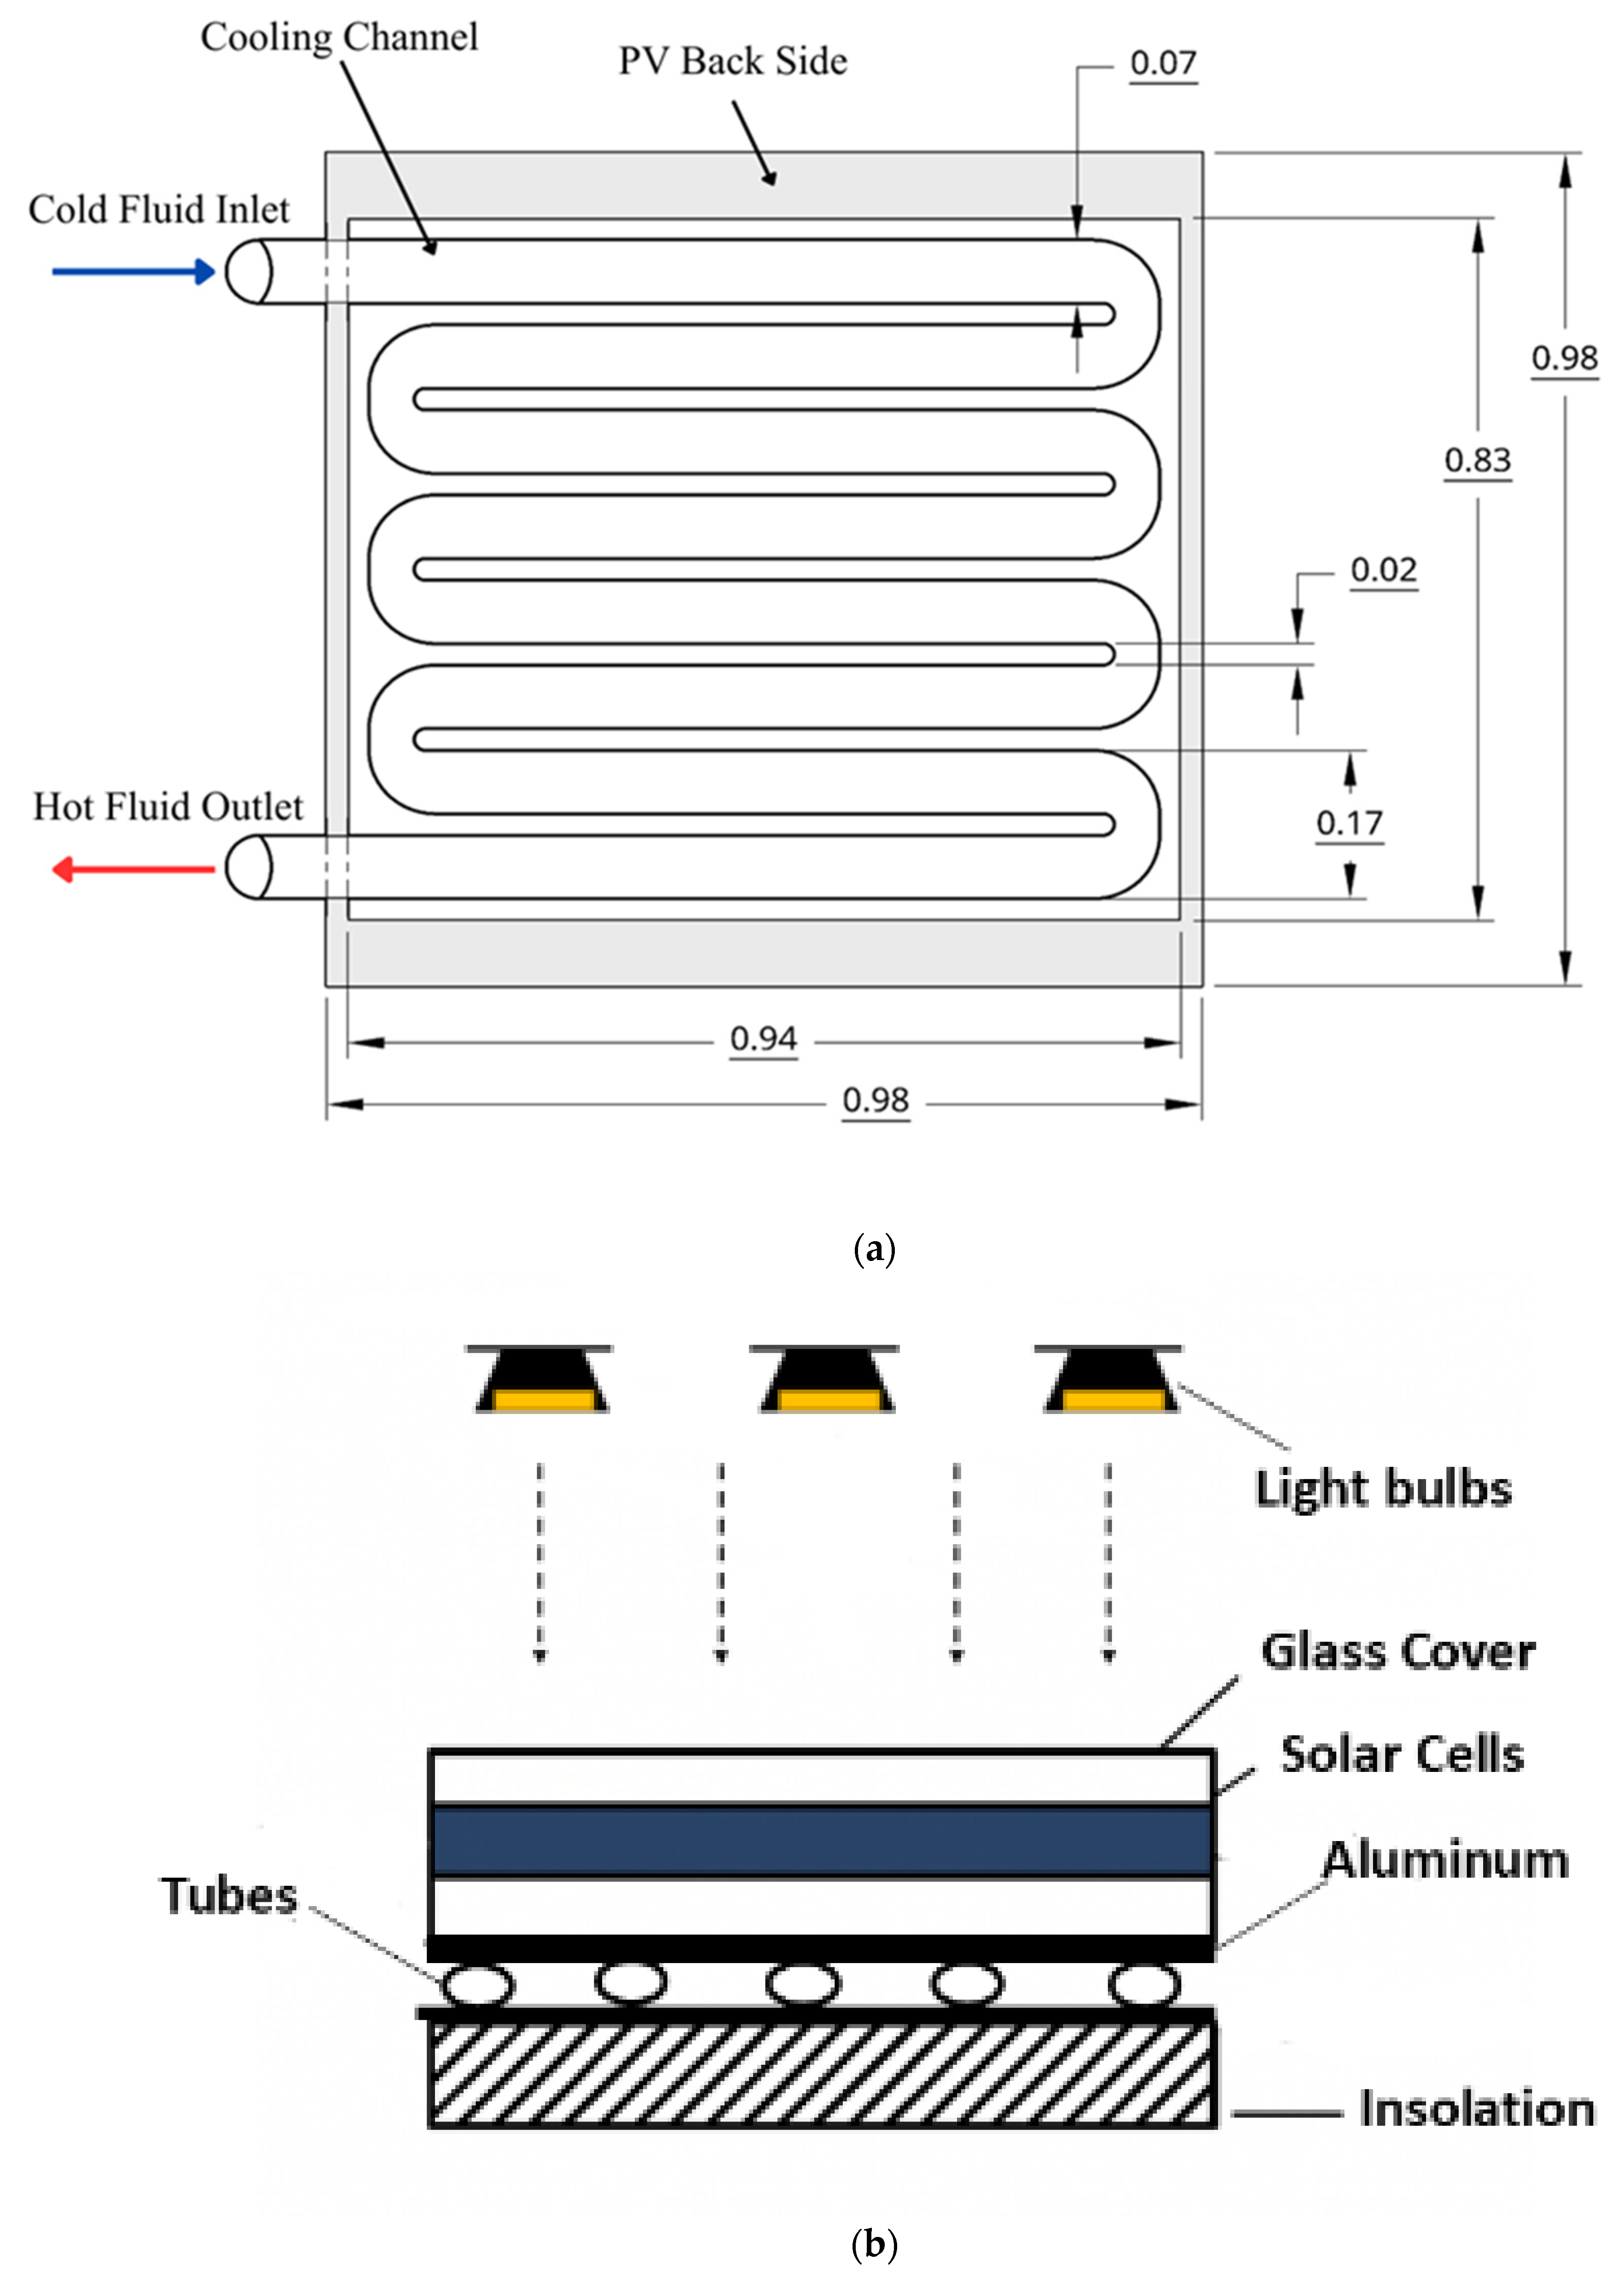
In these experiments, a standard 150 W monocrystalline silicon PV module was used, since this type of module is common in PVT applications and its electrical output is strongly affected by temperature. The module size and power rating are similar to those used in practical installations, so the setting is a good test of how well PVT cooling techniques work in real life. During testing, the module was kept within its rated operating limits to ensure reliable electrical measurements and to avoid any loss of performance over repeated indoor runs. A photovoltaic (PV) module was aligned with a cooling water channel (SDM 100, Roseville, CA, USA) mounted on its rear surface. A 0.6 mm aluminum foil was applied to the rear surface of the module to improve temperature uniformity and reduce hotspots. The aluminum cooling channel was then clamped directly onto the foil-coated rear surface to ensure firm thermal contact and mechanical stability. A 20 mm insulation layer was added behind the channel to minimize thermal losses and improve overall heat retention. The layout and internal flow path of the cooling channel and a cross-sectional schematic of the setup are shown in Figure 5. Table 3 outline the details of the cooling channel.
The thermal system includes all the components needed to maintain steady water flow through the cooling channel. Water is supplied from a 200 L open storage tank operating at atmospheric pressure. The tank is partially insulated to reduce heat loss and is equipped with a Type-K thermocouple to monitor the water temperature and ensure inlet conditions remain stable. A submersible pump placed inside the tank circulates water through the system. A bypass loop with a control valve is used to regulate the actual flow rate entering the cooling channel by redirecting excess water back to the tank. During operation, the system is designed to keep the collector pressure under 6 psi, in accordance with its rated limit. An inline water tank chiller is used to maintain the tank temperature by offsetting heat from the returning hot water coming from the cooling channel, ensuring stable thermal conditions across repeated test runs.
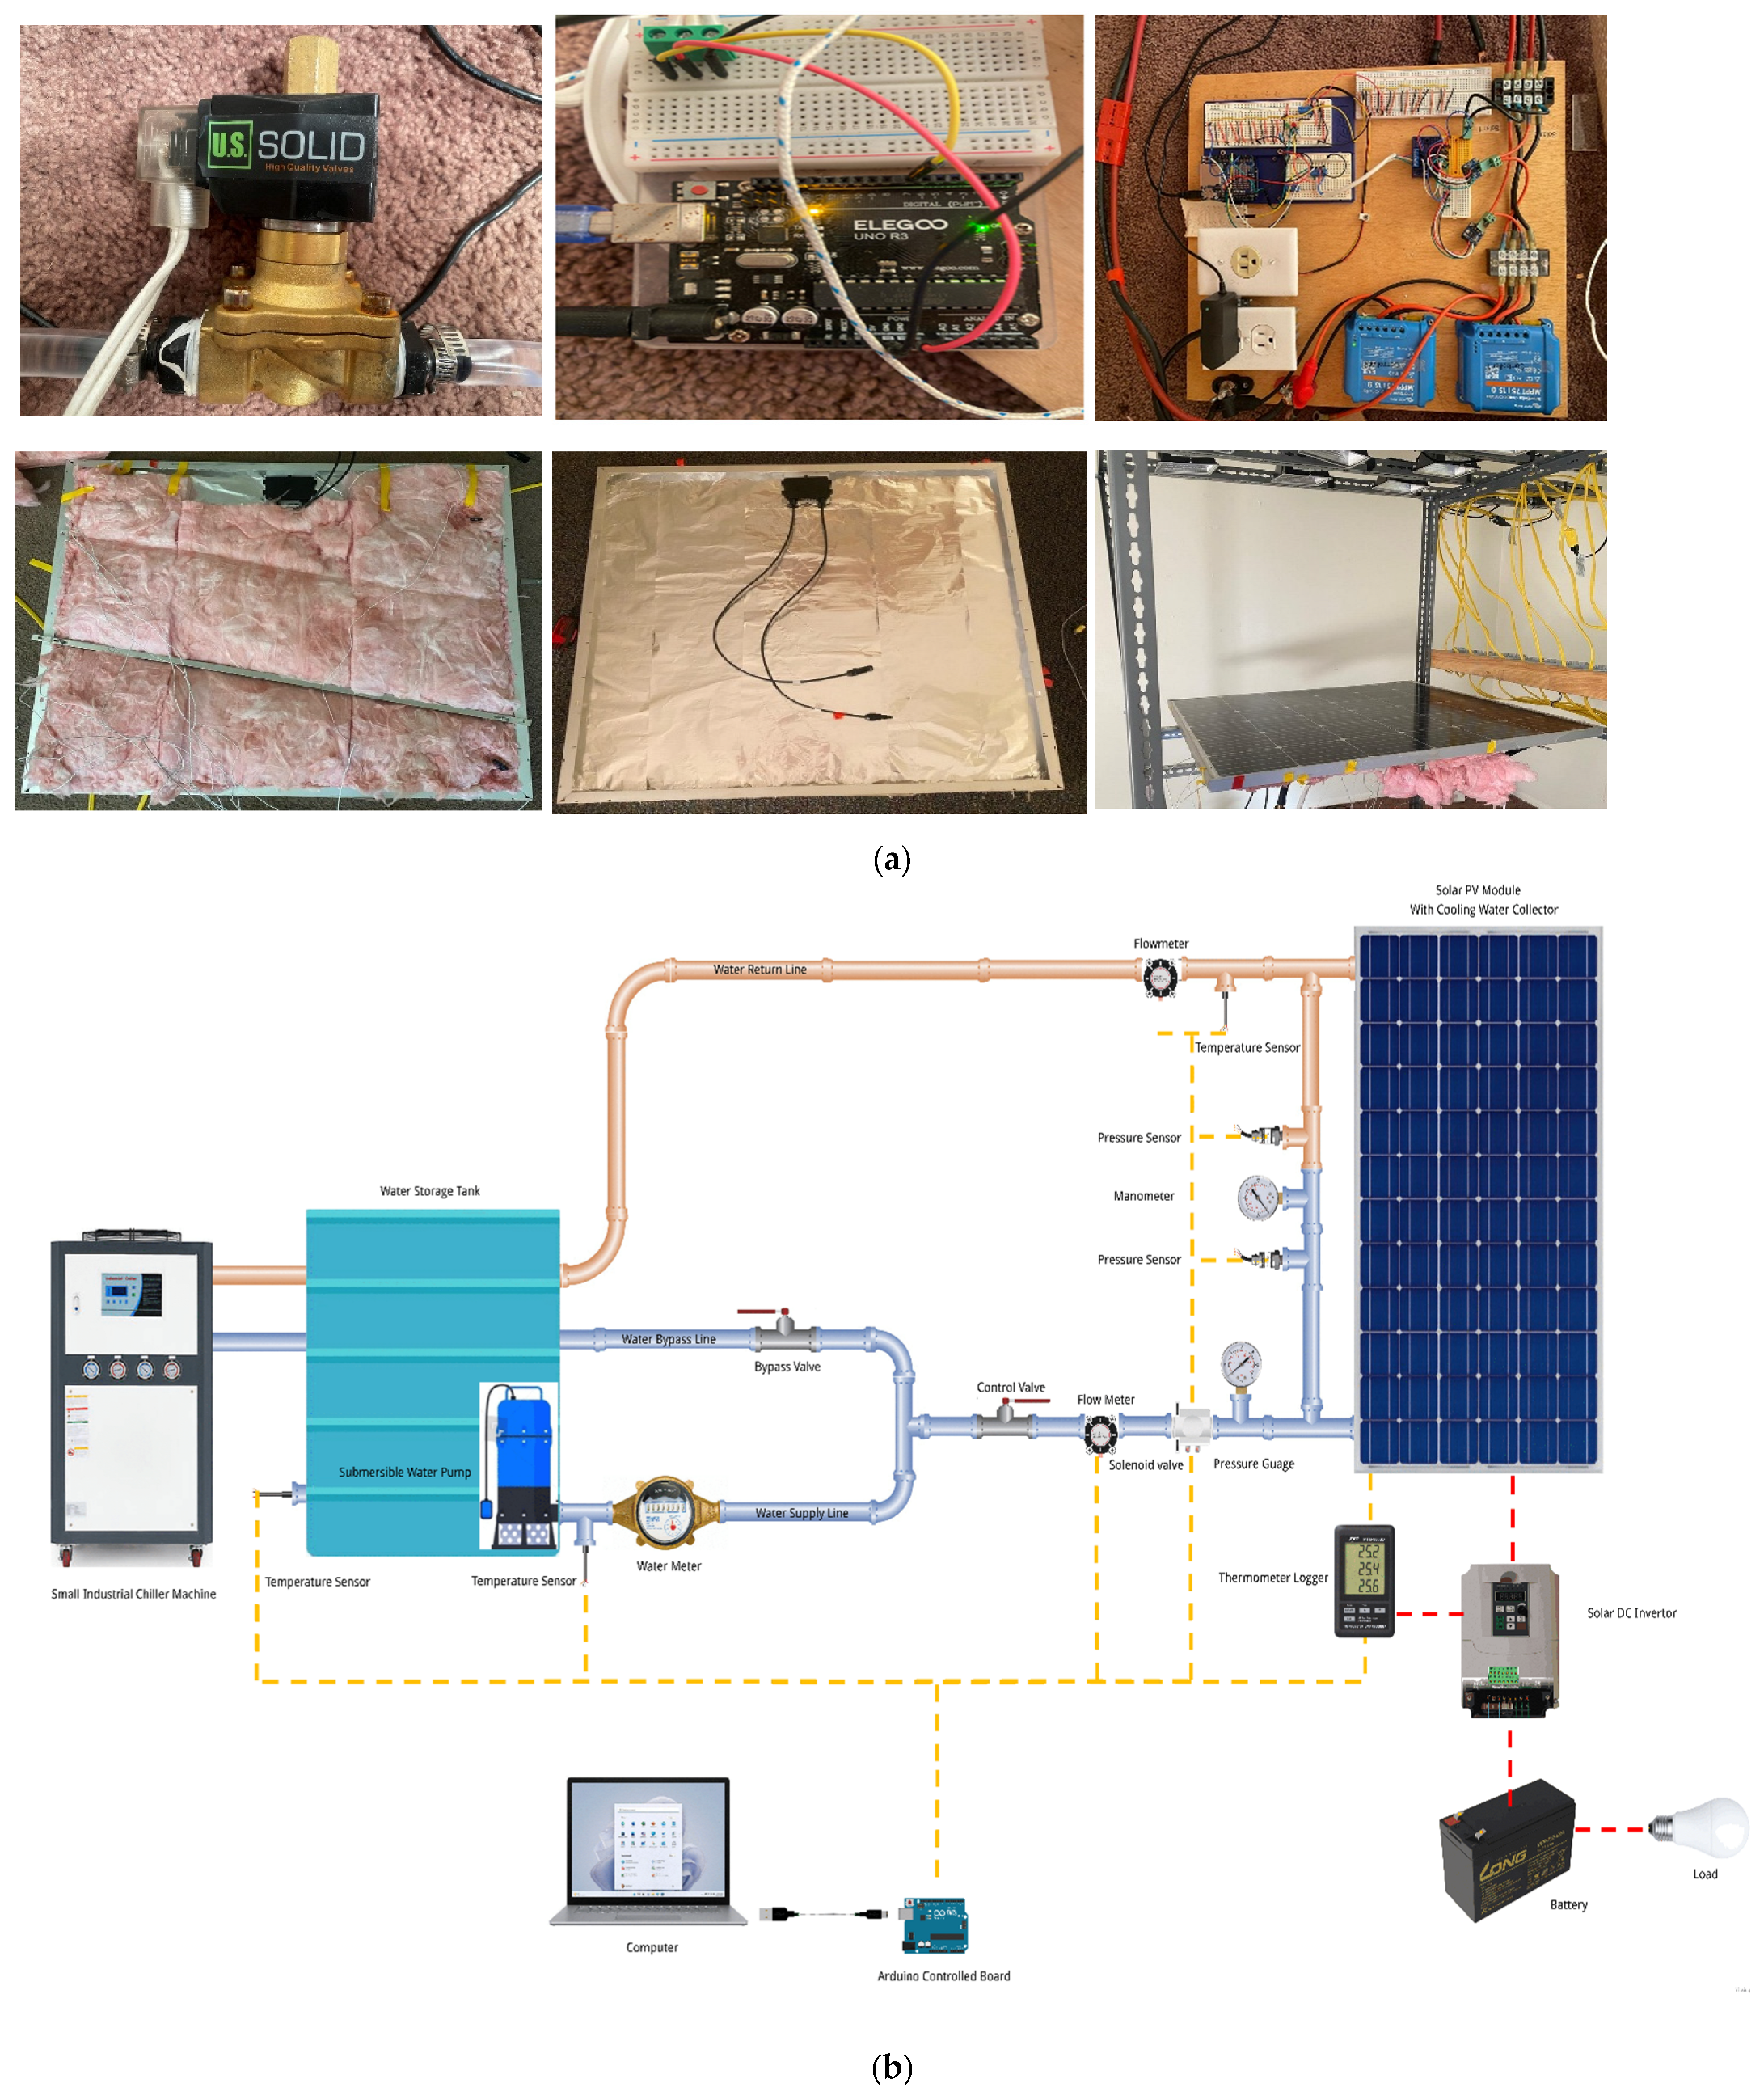
Two digital flow meters were installed at the inlet and outlet of the cooling channel to monitor the volumetric flow rate, with a measurement capacity of up to 5 L/min. Type-K thermocouples were placed at the inlet and outlet to measure the temperature difference for calculating thermal efficiency. For measuring pressure drop across the cooling channel, a Lutron PM-9100 electronic manometer was used during the experimental runs. To create a pulsating water flow in the cooling loop, a solenoid valve (U.S. Solid 1, Cleveland, OH, USA) was added to the system. The valve operates in a normally open position and alternates between open and closed states based on a square wave signal. This creates repeated on–off flow cycles that change how water enters the cooling channel, while keeping the average flow rate constant over time. The valve is controlled by an Arduino UNO microcontroller, with a HW-482 5V relay (Hong Kong, China) used to safely connect the low-voltage Arduino to the120 V AC valve. Further, a bypass system was added to regulate pressure during the closed cycles of the solenoid valve. It consists of a ball valves, pressure gauges, and return piping that redirects excess water back to the storage tank when pressure rises above a set threshold. This prevents back pressure buildup that could damage the submersible pump or disrupt flow stability. During valve closure, the bypass provides an alternate path for circulation and ensures that pressure entering the cooling channel remains below its 6 psi limit. Figure 6a shows the back side of the PVT system, including the applied insulation and the integrated pulsating mechanism used during experiment, while Figure 6b illustrates schematic flow diagram of the experimental PVT system with the pulsating flow mechanism.

2.4. Experimental Setup

The experimental setup was used to assess the thermal and electrical behavior of the PVT system under stable indoor conditions. Data were collected using an Arduino-based system and external data loggers, with all measurements recorded at 10 s intervals and processed in MATLAB R2025a. Each test lasted 60 min, with results averaged over the full duration. Ambient temperature measurements were recorded at the central location of the room, averaging around 25 °C with minimal fluctuations not exceeding ±1.5 °C. The inlet water temperature was kept between 24 °C and 26 °C using a compact chiller connected to the storage tank. Flow rate was measured using a digital flow meter (Moistenland) and manually verified using a stopwatch and a measuring container marked with volume units. K-type thermocouples were installed at key measurement points, including the inlet temperature, outlet temperature, ambient temperature, collector surface temperature, and PVT module surface temperature. To prevent any obstruction from cables that could interfere with the light beam from the solar simulator, the TPVT measurement was taken at different points on the rear side of the PV module.
Halogen lamps, which emit a high level of infrared radiation, can cause excessive heating of the PV surface if exposure is prolonged. To prevent this, each experiment was limited to 60 min, followed by a cooling period until TPVT returned to ambient temperature before starting the next run. To reduce the effects of infrared radiation and simulate real-world conditions, a 60 W axial fan was positioned 20 cm above the PVT module to generate forced convection. This setup helped prevent overheating of the PV cells and minimized infrared heat accumulation from the lamps. Air velocity around the PVT surface was measured using a vane-type anemometer (XRCLIF-818), with an average wind speed of approximately 2 m/s. Additionally, an exhaust fan was installed in the upper corner of the room to remove hot air and help keep the ambient temperature stable.
A network of Type K thermocouples was strategically positioned to monitor thermal and environmental parameters at the PV surface, water exit, and ambient environment. Temperature readings were logged using four DANOPLUS data recorders (Hong Kong, China), with surface measurements validated by an infrared thermometer. A digital anemometer (XRCLIF) was used to measure the airflow over the PV module, while a pyranometer recorded the irradiance from the solar simulator. This apparatus enabled precise monitoring of thermal and electrical activities under regulated pulse flow. The experimental setup focused on characterizing the PVT system under a solar simulator, specifically examining the influence of flow pulsation on heat extraction and power output.
To evaluate the effect of pulsating flow on the thermal and electrical performance of the PVT collector, five experiments (Exp. 3–6) were conducted. Each experiment was conducted on a separate day under the same environmental conditions. Key parameters, including irradiance and ambient temperature, were carefully monitored throughout each run to ensure consistency and allow for clear observation of the effects of pulsating flow.
Two initial tests were conducted to establish reference points for comparison. In Exp. 1, a standalone PV module operated without cooling (ṁ = 0 kg/s) and without rear insulation. This baseline configuration was used to assess the effects of thermal buildup on PV surface temperature and electrical efficiency under constant irradiance. Exp. 2 applied continuous cooling (ƒ = 0 Hz) using the rear-mounted cooling channel, which formed the full PVT system. Four mass flow rates (1, 2, 3, and 4 L/min) were applied to assess the effect of steady cooling (referred to as continuous cooling in this study) on PV temperature and overall system efficiency. Results from Exp. 2 served as the benchmark for evaluating the performance of pulsating flow conditions in Exp. 3–7.
In Experiments 3 through 6, a solenoid valve was used to generate pulsating flow in the cooling channel to investigate its effects on the system behavior. Pulsation frequencies of 0.25, 0.5, 1, and 2 Hz were tested at four mass flow rates (1, 2, 3, and 4 L/min). These frequencies were selected based on previous studies in pulsating heat transfer, as no established frequency range exists for PVT applications. Frequencies above 2 Hz were excluded to ensure proper valve actuation and maintain pulse clarity. During all tests, the inlet temperature was maintained at a constant level, which is equal to the storage tank temperature. Pressure drop across the cooling channel was recorded using the digital manometer (PM-9100, Lutron) described in Section 2.3. All thermocouples and electrical sensors (ADS1115 for voltage, INA219 for current and power) were pre-calibrated against reference instruments. The pyranometer and flow meter were used with their factory calibrations.
Flow rates ranging from 1 to 4 L/min were chosen to maintain laminar flow in the cooling system and align with standard values documented in prior water-cooled PVT research. This range provides a clear basis for evaluating the effects of pulsation without complications from turbulence. The irradiance level was kept between 700 and 800 W/m2 to represent moderate-to-high solar input under indoor testing conditions, while maintaining uniform lighting in line with EN 12975-2 guidelines.
The following assumptions were made:
  • The air velocity generated by the axial fan (2 m/s) and the irradiance from the solar simulator were considered constant during the experiments.
  • Heat transfer from the PV surface to the surface of cooling water channels occurs by conduction.
  • Any irradiance not converted into electrical energy by the PV component is absorbed and transformed into thermal energy.
  • The ambient temperature of the experiment room is uniformly maintained and consistent throughout.
  • The inlet water temperature is uniform and stable.

2.5. Theory and PVT Performance Calculations

The performance of the PVT system was assessed based on the experimental data collected from calibrated sensors positioned throughout the setup. Both thermal and electrical outputs were quantified using established energy balance formulations. The useful thermal energy extracted by the coolant was determined from the measured inlet and outlet water temperatures, flow rate, and specific heat capacity of water, providing insight into the system’s heat recovery capability. Correspondingly, the thermal efficiency was calculated to evaluate the proportion of incident solar energy converted into usable heat. These evaluations were performed using Equations (1) and (2), as referenced in [35]. Electrical performance was assessed by monitoring real-time voltage and current at the PV terminals, enabling accurate tracking of power output and maximum power point (MPP) behavior. Together, these measurements offered a comprehensive understanding of the integrated thermal-electrical response of the PVT system under different cooling and pulsation scenarios. The consistent and precise data collection framework established during the experiment ensured reliable calculation of all key performance indicators.
Q u ˙ = m ˙   C p ( T o T i )
η t h = Q u ˙ A P V T I
where is the mass flow rate (kg/s), Cₚ is the specific heat of water (J/kg·K), Tᵢ and Tₒ are the inlet and outlet fluid temperatures (°C), APVT is the collector area (m2), and I is the incident irradiance (W/m2).
The electrical power output from the PV module was determined by direct voltage and current measurements. Electrical efficiency was calculated using Equation (3) [36]:
η e l e = V P V T   I P V T A P V T I
where VPVT and IPVT are the measured PV voltage and current.
The analysis of pulsating flow was carried out using standard dimensionless parameters. The pulsating frequency ƒ was calculated as the inverse of the total pulsation period, defined by the sum of the solenoid valve’s opening time t1 and closing time t2, as shown in Equation (4) [28]. This frequency parameter is critical in characterizing the unsteady flow regime imposed on the coolant, influencing the development and disruption of thermal boundary layers within the collector. By altering ƒ, the system can transition between quasi-steady and highly dynamic flow conditions, directly affecting heat transfer rates.
ƒ = 1 ( t 1 + t 2 )  
The dimensionless frequency of the unsteady flow was expressed using the Strouhal number (St), calculated via Equation (5) [37]. Similarly, the Womersley number (α) was determined using Equation (6) [38] to describe the balance between transient inertial and viscous forces within the system. These parameters were applied across all pulsating flow conditions to capture the unsteady flow behavior introduced by periodic actuation. The combined use of St and α enabled a systematic comparison of flow behavior under different pulsation frequencies, offering insight into the thermal response and fluid transport mechanisms within the PVT collector.
S t = ƒ   D h U
α = D h 2   2 π f v
where Dh is the hydraulic diameter (m), and U is the time-averaged flow velocity (m/s), ν is the kinematic viscosity of the working fluid (m2/s). An alternative expression based on measurable parameters was also considered [39]:
α =   2 π   R e   S t
The Reynolds number was obtained using Equation (8) to assess the flow conditions within the cooling channel. Pressure losses across the collector were estimated using the Darcy–Weisbach equation [40], enabling analysis of hydraulic resistance associated with both continuous and pulsating flow configurations. These parameters were calculated for each test condition to support comparative evaluation of thermal and flow behavior across experimental cases.
R e = U   D h v  
Δ P = f   L D h   ρ   U 2 2
where ΔP is the pressure drop (Pa), L is the channel length (m), ρ is fluid density (kg/m3), and f is the Darcy friction factor.

2.6. Uncertainty Analysis

Accuracy of experimental results depends directly on the quality of the measurement instruments. Therefore, an uncertainty analysis of all measured data is necessary. The standard approach recommended by Coleman and Steele [27] was followed in this work. For a result R expressed as a function of several measured variables, the expanded uncertainty is given by:
U R   =   i = 1 J R x i   U i 2
In this work, electrical and thermal performance were evaluated from measured quantities including current, voltage, inlet and outlet fluid temperature, irradiance, and mass flow rate. Uncertainty analysis was conducted for thermal efficiency, based on temperature rise and flow rate, and for electrical efficiency, based on electrical output and irradiance.

3. Results and Discussion

3.1. Pulsating Flow’s Impact on Performance

This study examines the impact of incorporating pulsating flow into the PVT cooling loop on the performance of the PVT system, as outlined in the experimental setup described in Section 2. In this subsection, the effect of pulsating flow on PVT performance was evaluated by comparing system behavior across three cases: no cooling, continuous cooling, and pulsating cooling. For all cooling cases, the flow rate was fixed at 1 L/min. In the pulsating flow case, a frequency of 0.25 Hz was applied. Surface temperature data were recorded over a 60 min period to capture thermal behavior under each condition.
The uncertainty analysis was carried out using the propagation method outlined in Equation (10). The results, summarized in Table 4, show that the relative standard uncertainty in thermal efficiency (uTH/ η T H ) is about 3.5%, mainly due to the sensitivity to the temperature difference between inlet and outlet. In comparison, the relative uncertainty in electrical efficiency (uElec/ η E l e c ) is lower, around 1.5%, with irradiance and voltage contributing most significantly. These levels of uncertainty confirm that the experimental results are reliable for evaluating the performance of the PVT system.
Alongside the quantified uncertainty analysis, minor experimental errors can occur due to thermocouple placement and contact resistance, especially at low flow rates where temperature differences are minimal. The non-uniformity of residual irradiance and spectral mismatch in indoor solar simulators can influence absolute electrical efficiency values; however, relative comparisons between continuous and pulsating cases are still dependable. Minor timing discrepancies in solenoid valve actuation can lead to slight instantaneous variations in flow during pulsating operation; however, the average flow rate remains constant. In summary, these effects do not change the identified performance trends.
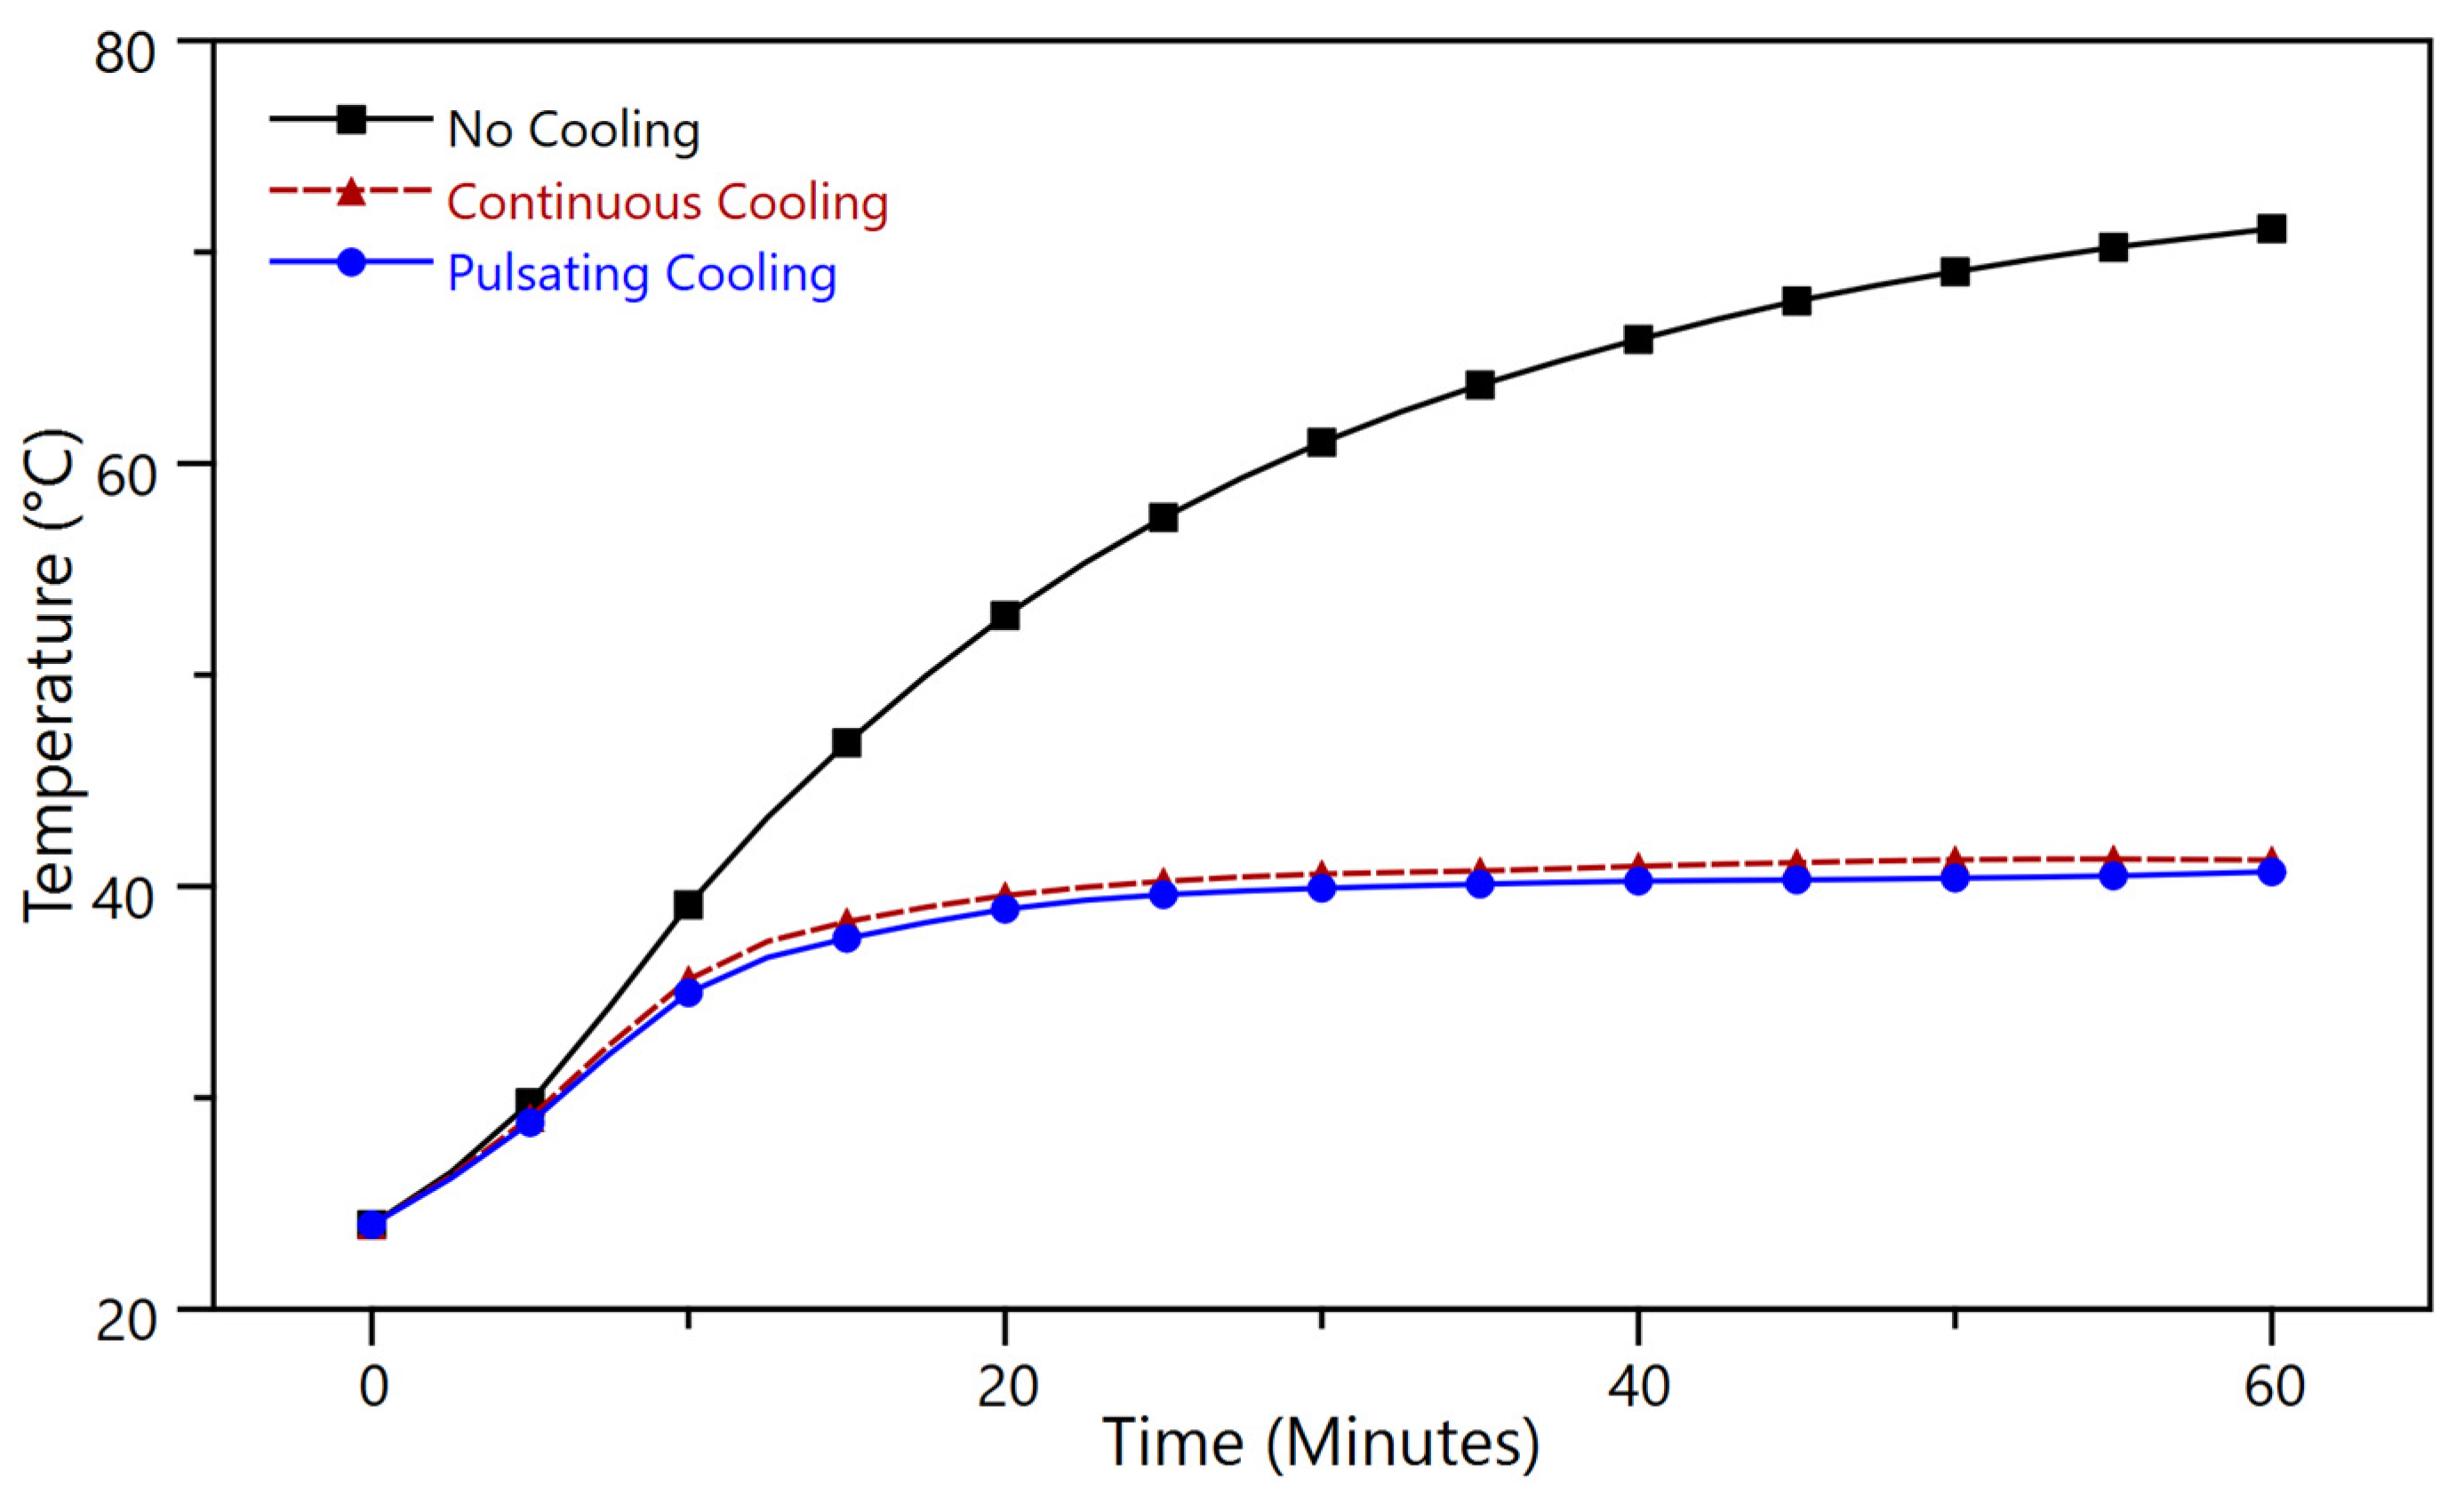
Figure 7 illustrates the increase in surface temperature across three situations, performing as the primary parameter for evaluating the effectiveness of electrical and thermal behavior in the PVT system. Without cooling, the temperature of the photovoltaic surface rapidly increased from approximately 25 °C to a peak of 72.6 °C after 60 min, following a typical exponential heating path. Continuous water cooling at a fixed flow rate (1 L/min) markedly decreased this temperature, maintaining the surface at approximately 41.3 °C. This reflects the cooling effect achieved through steady forced convection. Nonetheless, an additional enhancement was noted during pulsating flow (0.25 Hz, identical flow rate), which sustained the temperature around 40.1 °C with variations of less than ±0.1 °C during steady-state operation. The approximately 1.2 °C decrease relative to continuous flow indicates that pulsating improves convective heat transfer. Although this temperature reduction is relatively small and within the margin of experimental uncertainty, all tests were repeated multiple times under identical conditions, and the observed trend was consistently reproduced. This repeatability indicates that the measured temperature difference reflects a systematic effect of pulsating flow rather than random measurement error. This improvement is caused by occasional thinning and disruption of the thermal boundary layer, coupled with increased fluid mixing and turbulence intensity near the heat exchange surface. The findings support the belief that pulsation can enhance temperature regulation without increasing flow rate or pumping power, offering a more efficient passive enhancement method for PVT systems.
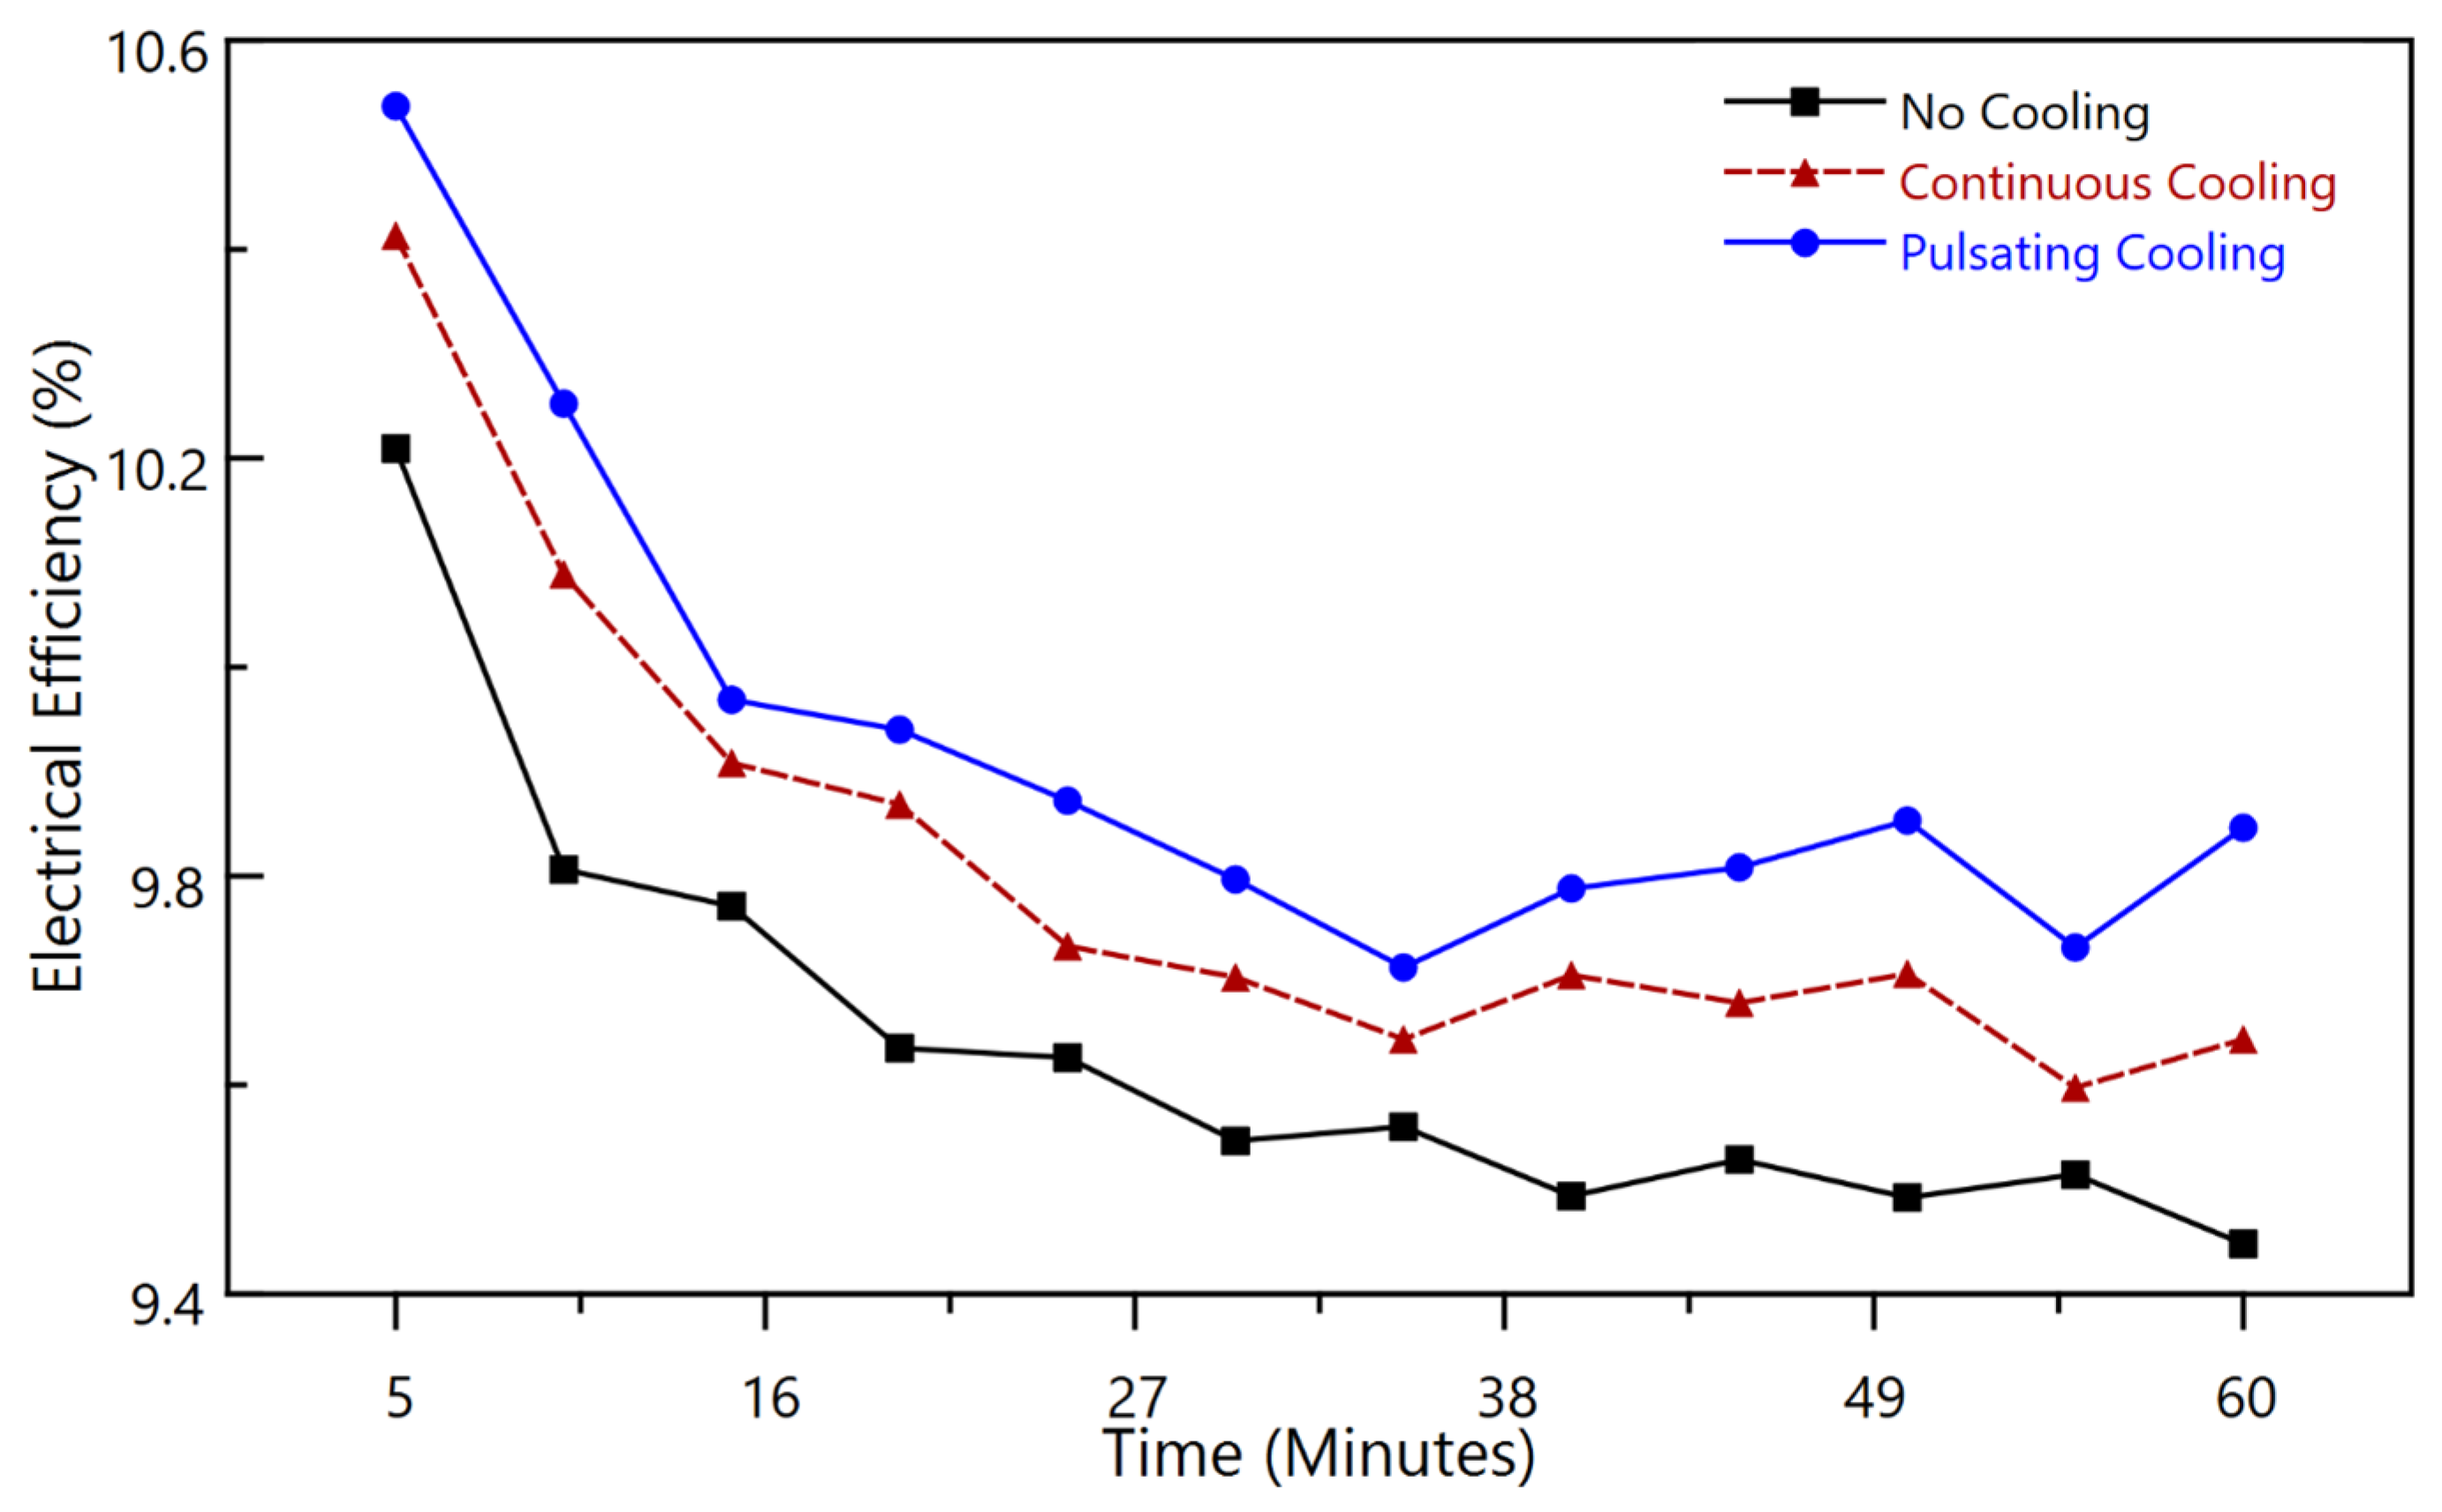
Figure 8 illustrates the variation in electrical efficiency of a photovoltaic thermal (PVT) system over a 60 min period under three different operating conditions: no cooling, continuous cooling, and pulsating cooling. At the beginning of the experiment (5 min), all cases show relatively high electrical efficiency, with values of approximately 10.22% for the uncooled system, 10.45% for continuous cooling, and the highest, 10.55%, for pulsating cooling. As time progresses, efficiency drops in all cases due to the temperature rise in the photovoltaic cells, which directly impacts their performance. However, the rate and magnitude of this decline differ significantly across the other cases. The uncooled case suffers the most, with electrical efficiency steadily declining to around 9.43% by the 60 min mark, indicating severe thermal growth. Continuous cooling reduces this heat increment, ending at approximately 9.71%, while pulsating cooling consistently delivers the best performance, stabilizing at around 9.82%. The smaller drop in efficiency under pulsating flow suggests a more stable thermal condition compared to the other cases. While the gain in electrical efficiency is relatively modest and near the margin of uncertainty, the trend mirrors the temperature response and supports the same interpretation.
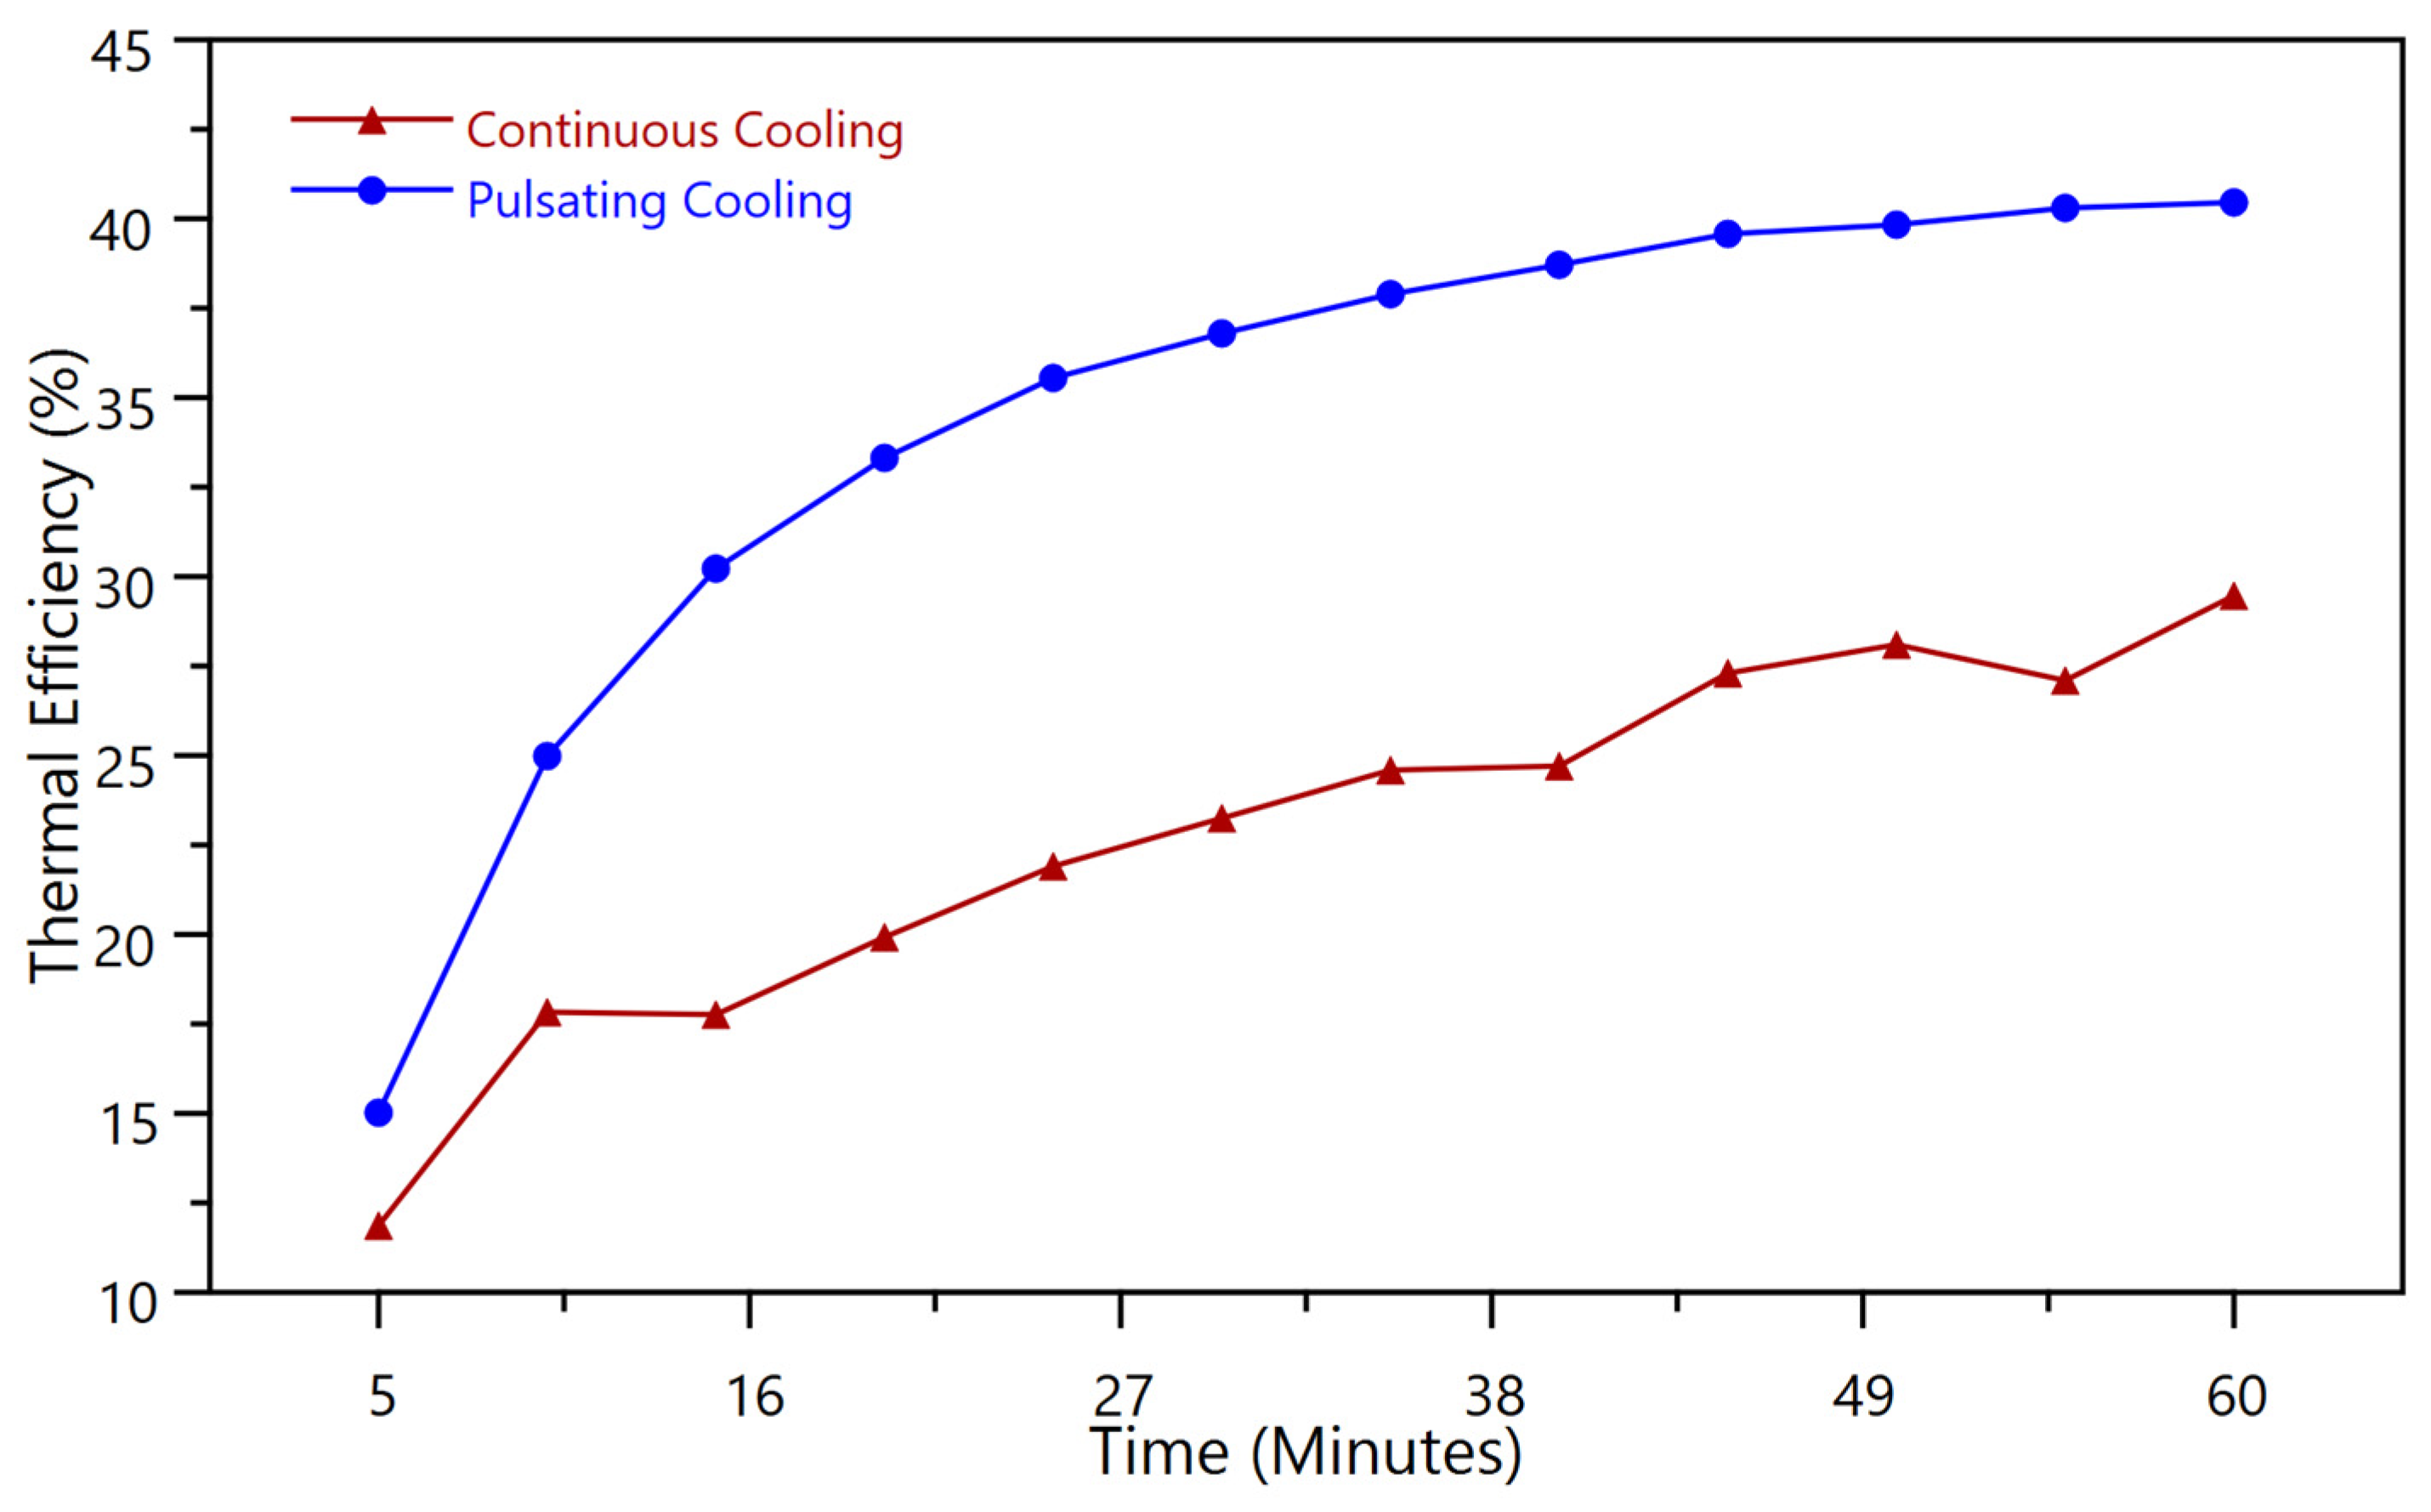
Figure 9 further reinforces the superiority of pulsating cooling by comparing its thermal efficiency to that of continuous cooling across the same time span. Pulsating cooling starts at around 15% and rapidly climbs to exceed 40% by the end of the 60 min experiment, while continuous cooling begins at about 8% and only reaches roughly 30% over the same duration. This clear performance gap grows steadily over time and reflects the higher rate of heat transfer associated with pulsating flow. The reason lies in the hydrodynamics: pulsating flow enhances thermal boundary layer disruption through cyclic acceleration, which induces transient inertial effects and localized mixing. These mechanisms continuously refresh the fluid near the absorber surface, promoting more efficient heat extraction. In contrast, continuous cooling exhibits relatively slower thermal growth, limited by the development of a stable boundary layer that gradually insulates the surface from the coolant. Overall, the results demonstrate that pulsating cooling provides a substantial enhancement in thermal efficiency compared to continuous cooling, while electrical efficiency exhibits a smaller but consistent improvement that follows the same thermal trend.

3.2. Influence of Pulsation Frequencies and Flowrates on Performance

This section examines the effect of varying pulsation frequencies and flow rates on the performance of a photovoltaic thermal (PVT) system. Experiments were conducted at four different pulsation frequencies (0.25 Hz, 0.5 Hz, 1 Hz, and 2 Hz) across four flow rates: 1, 2, 3, and 4 L/min. For each flow rate, a set of tests was performed using all four frequencies, allowing for a direct comparison of how different pulsation conditions influence PVT system performance indicators such as Reynolds Number, thermal efficiency, electrical efficiency, surface temperature, and pressure drop. The results provide insight into how pulsating flow interacts with flow rate to affect overall system behavior.
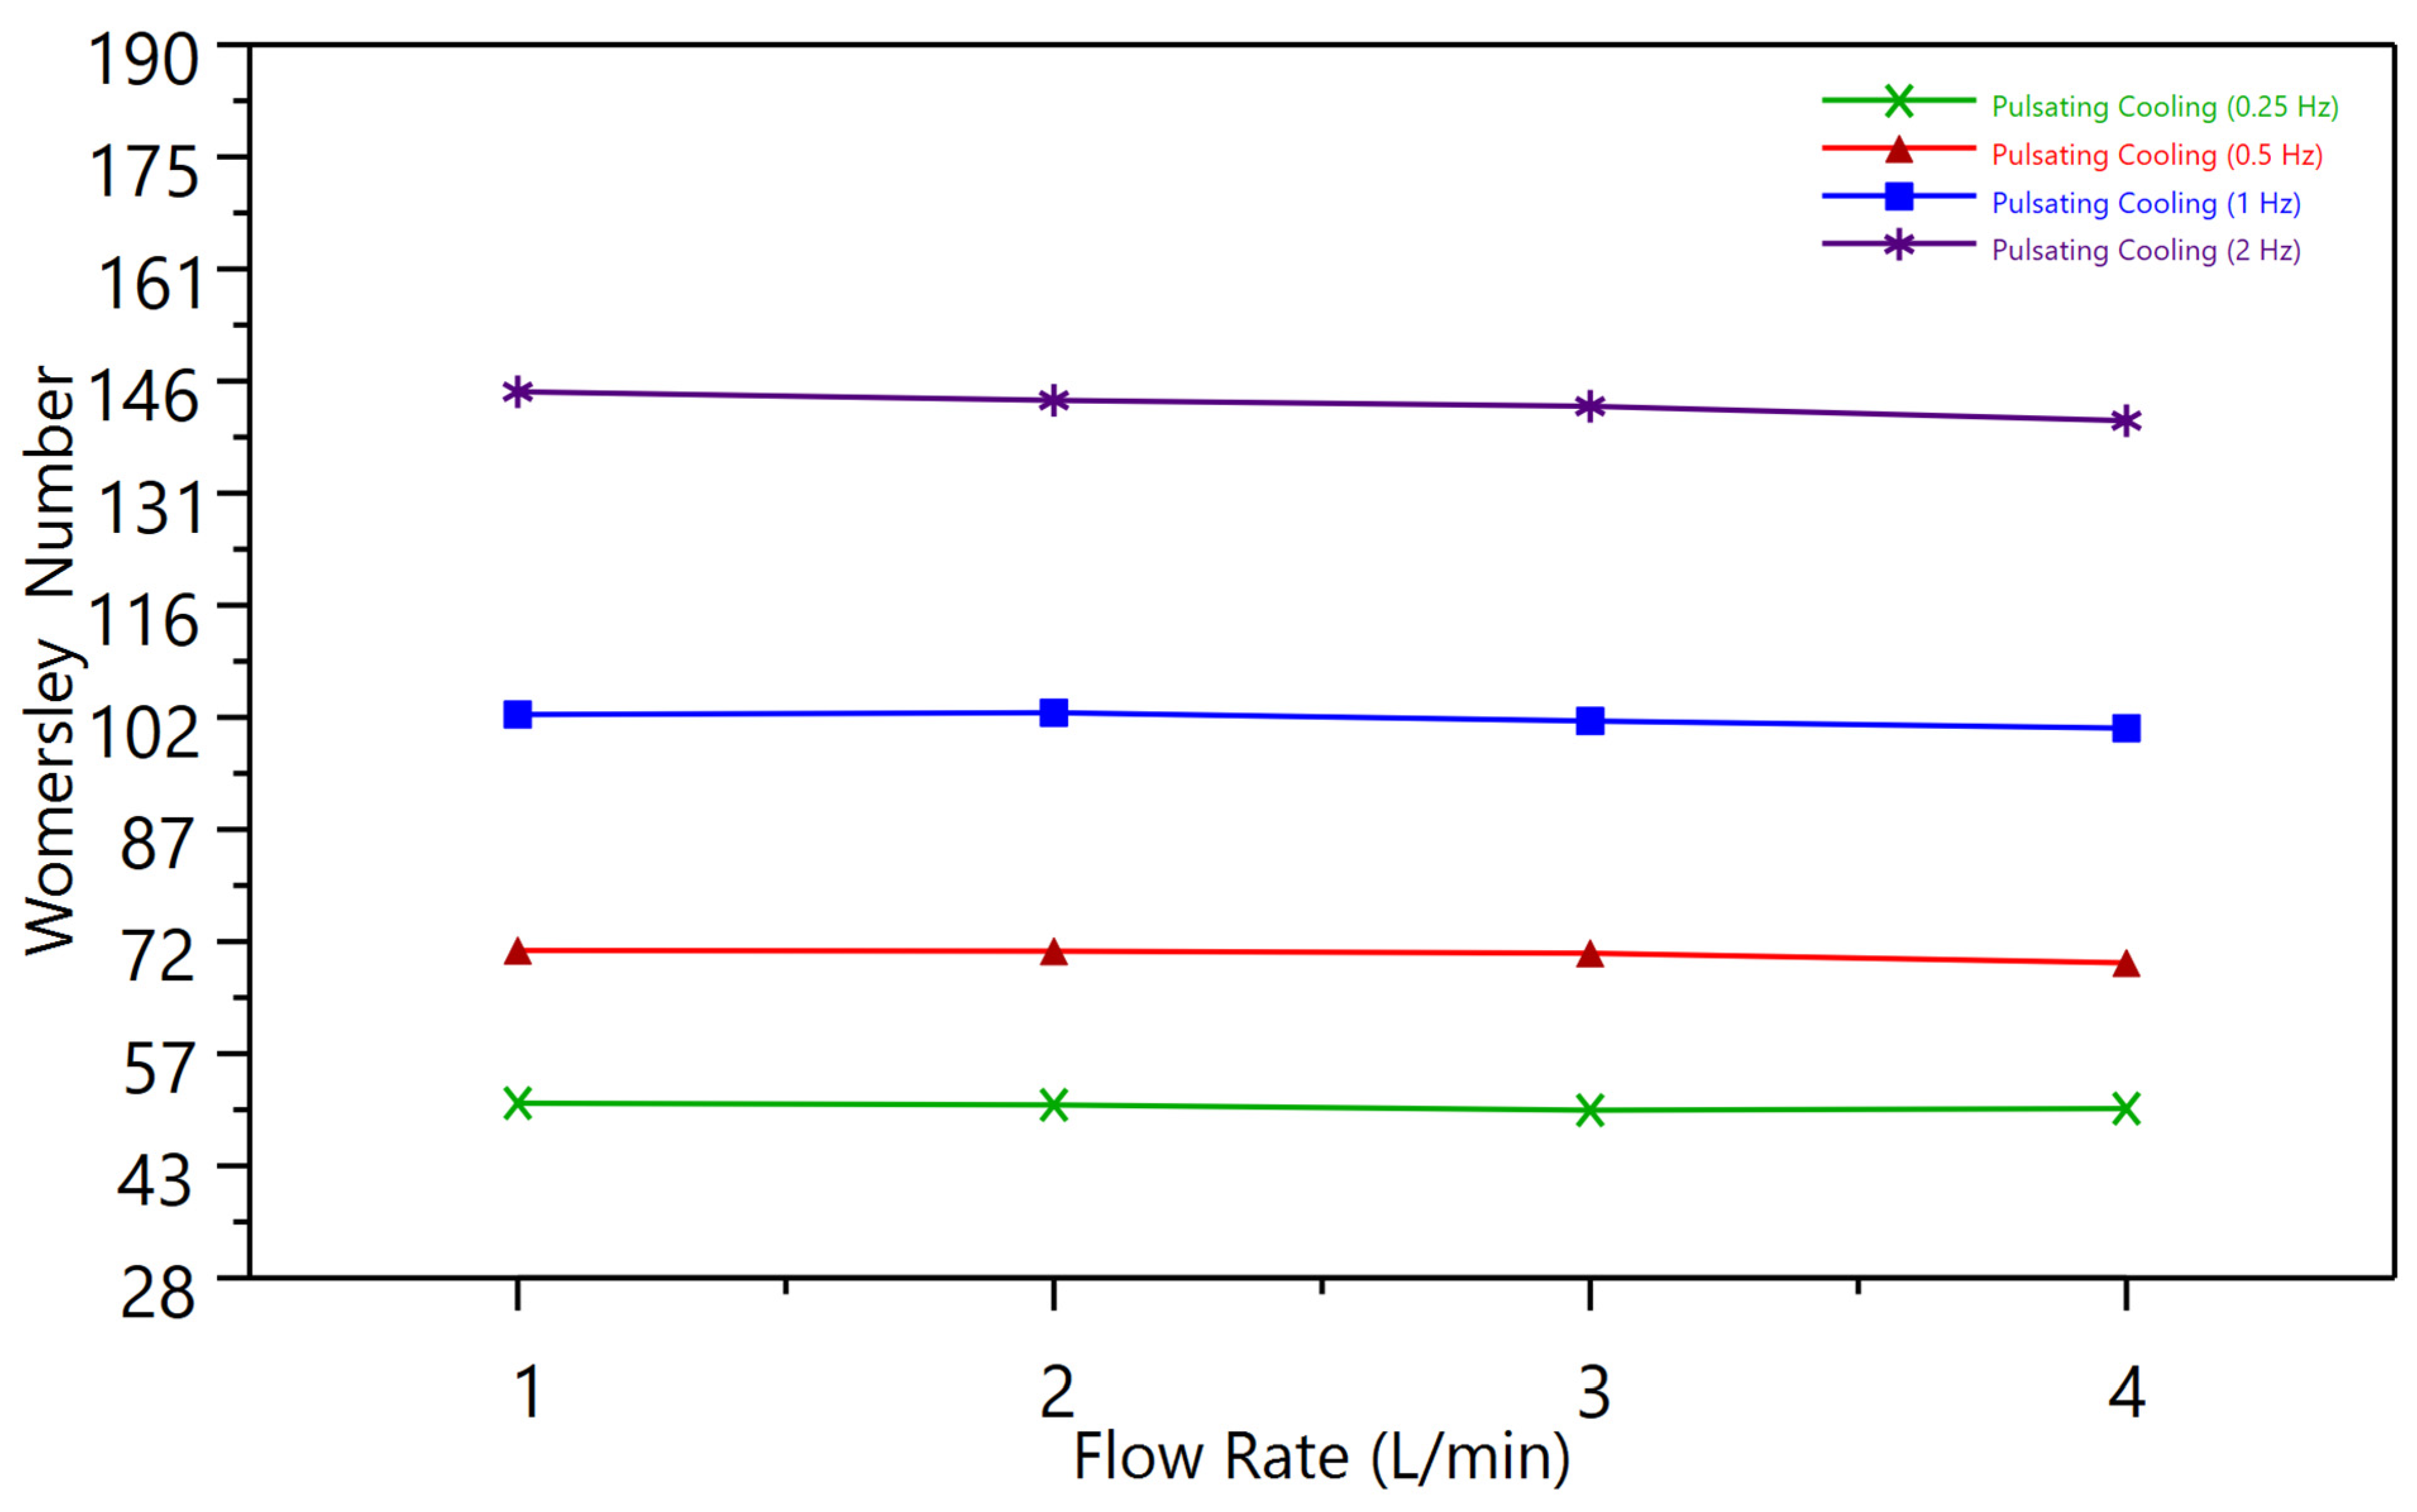
Figure 10 illustrates the relationship between the Womersley number and flow rate during pulsating cooling at frequencies of 0.25, 0.5, 1, and 2 Hz. The findings demonstrate that the Womersley number exhibits a near-constant behavior as the flow rate increases, thereby affirming its dependence predominantly on pulsation frequency and the characteristics of the fluid, rather than on the mean velocity. The analysis reveals that each frequency generates a unique, almost horizontal curve, exhibiting a systematic increase in values from approximately 50 at 0.25 Hz to roughly 145 at 2 Hz. The slight variation observed across the spectrum of flow rates indicates that alterations in bulk velocity exert minimal impact on this parameter, thereby underscoring its function as a descriptor of oscillatory flow dynamics rather than steady-state hydraulics. The distinct delineation among frequencies underscores the proportional relationship of the Womersley number with the rate of oscillation. Lower frequencies correlate with reduced unsteady inertial effects, whereas higher frequencies generate more significant oscillatory forces that influence the velocity distribution in the channel. With an increase in the Womersley number, unsteady inertial forces cause the velocity profile to flatten and disrupt the thermal boundary layer, which may result in higher wall shear and improved convective heat transfer. This study examines a frequency range that places the system well beyond the quasi-steady laminar regime, entering a domain relevant to oscillatory dynamics. This behavior is consistent with prior literature, showing that Womersley numbers exceeding the lower transitional limits modify near-wall gradients and improve thermal transport. The use of pulsating cooling in laminar PVT operation offers a way to improve performance while keeping the bulk Reynolds number relatively stable.
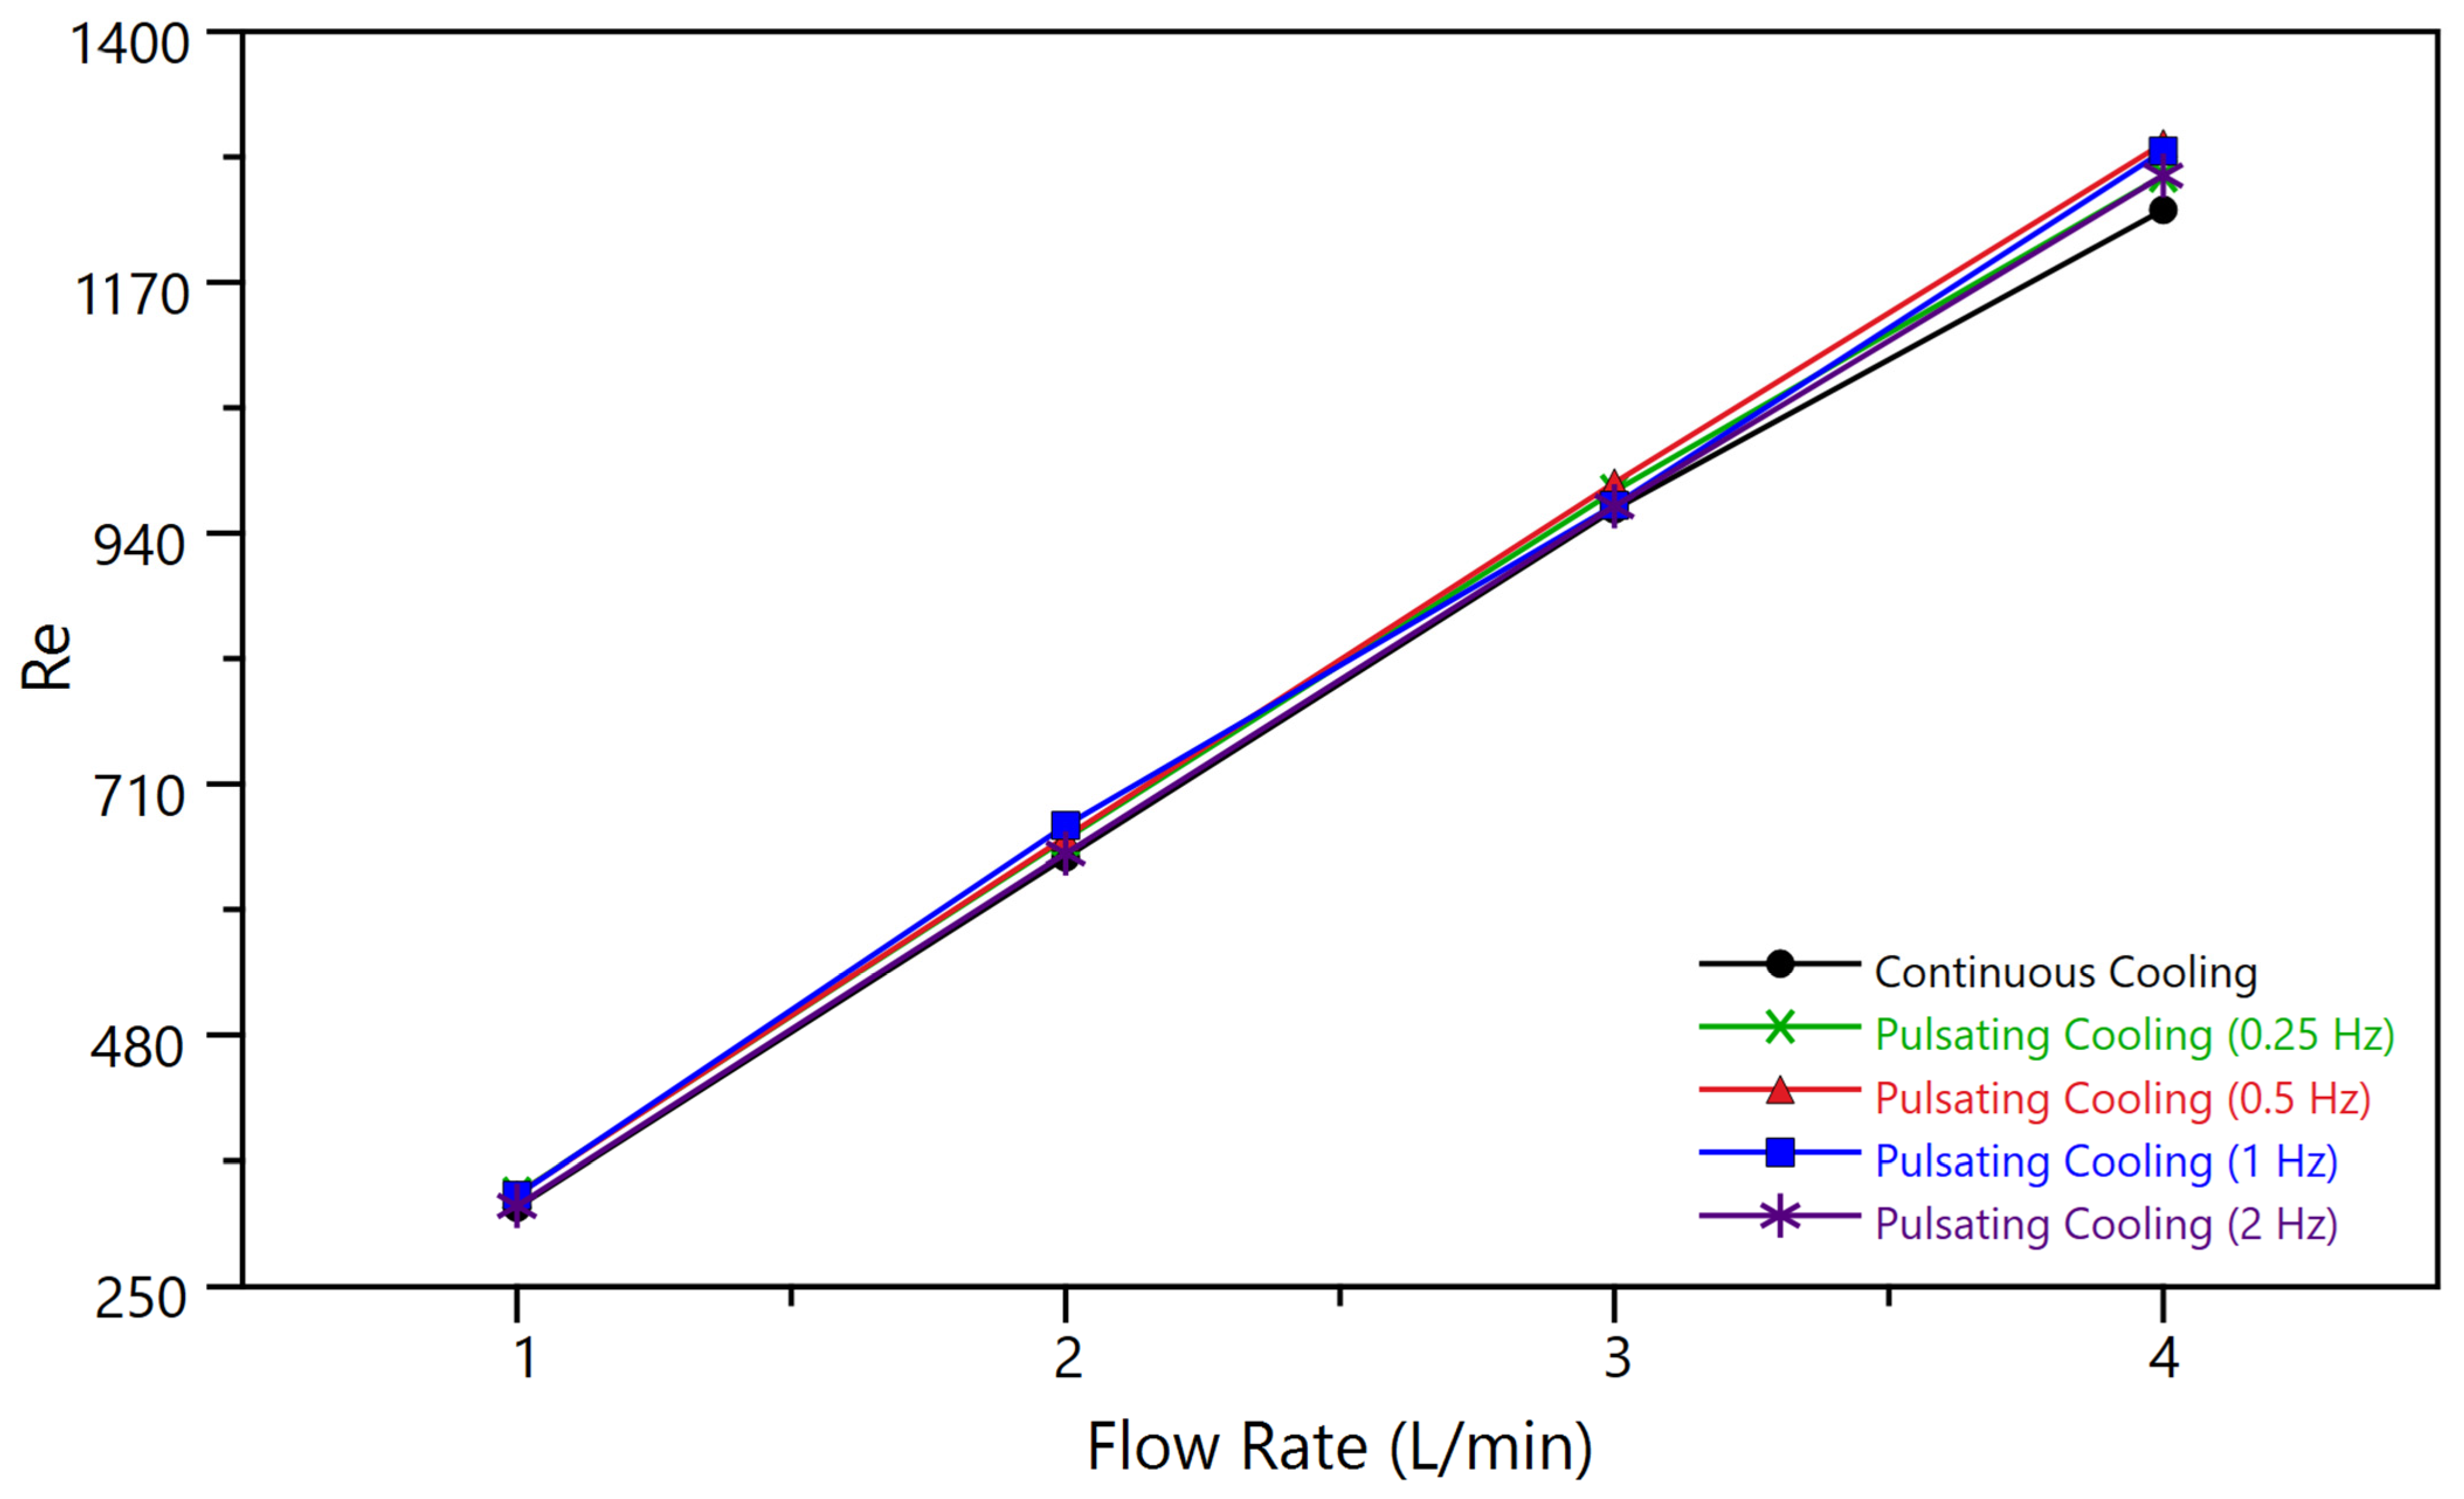
Figure 11 shows how Reynolds number changes with flow rate for continuous cooling and for pulsating cooling at frequencies of 0.25, 0.5, 1, and 2 Hz. In every case, the Reynolds number rises almost linearly with flow rate, which is expected since it scales directly with velocity. Even at the highest flow rate tested, the values remain within the laminar regime, confirming that the type of cooling does not push the flow into turbulence. Pulsating operation follows nearly the same trend as continuous flow, with only slight deviations at different frequencies. This indicates that the mean flow rate still dominates the hydraulic behavior, while pulsation adds little influence on bulk Reynolds number. The more important effect of pulsation is not on the flow regime itself, but on the way heat is transferred. In laminar flow, the thermal boundary layer limits convective performance, and disturbing this layer is one of the few ways to improve heat transport. Pulsation introduces periodic velocity fluctuations that disturb the boundary layer, stir fluid near the surface, and increase the effective heat transfer at a given Reynolds number. Among the tested frequencies, 0.5 Hz appears to provide the best balance: the oscillations are frequent enough to disrupt the boundary layer, but not so rapid that the disturbances lose their strength. Higher frequencies, such as 2 Hz, begin to resemble steady flow, while very low frequencies produce weaker enhancement. Overall, pulsation leaves the hydraulic regime essentially unchanged but can deliver noticeable thermal benefits even when the flow is laminar.
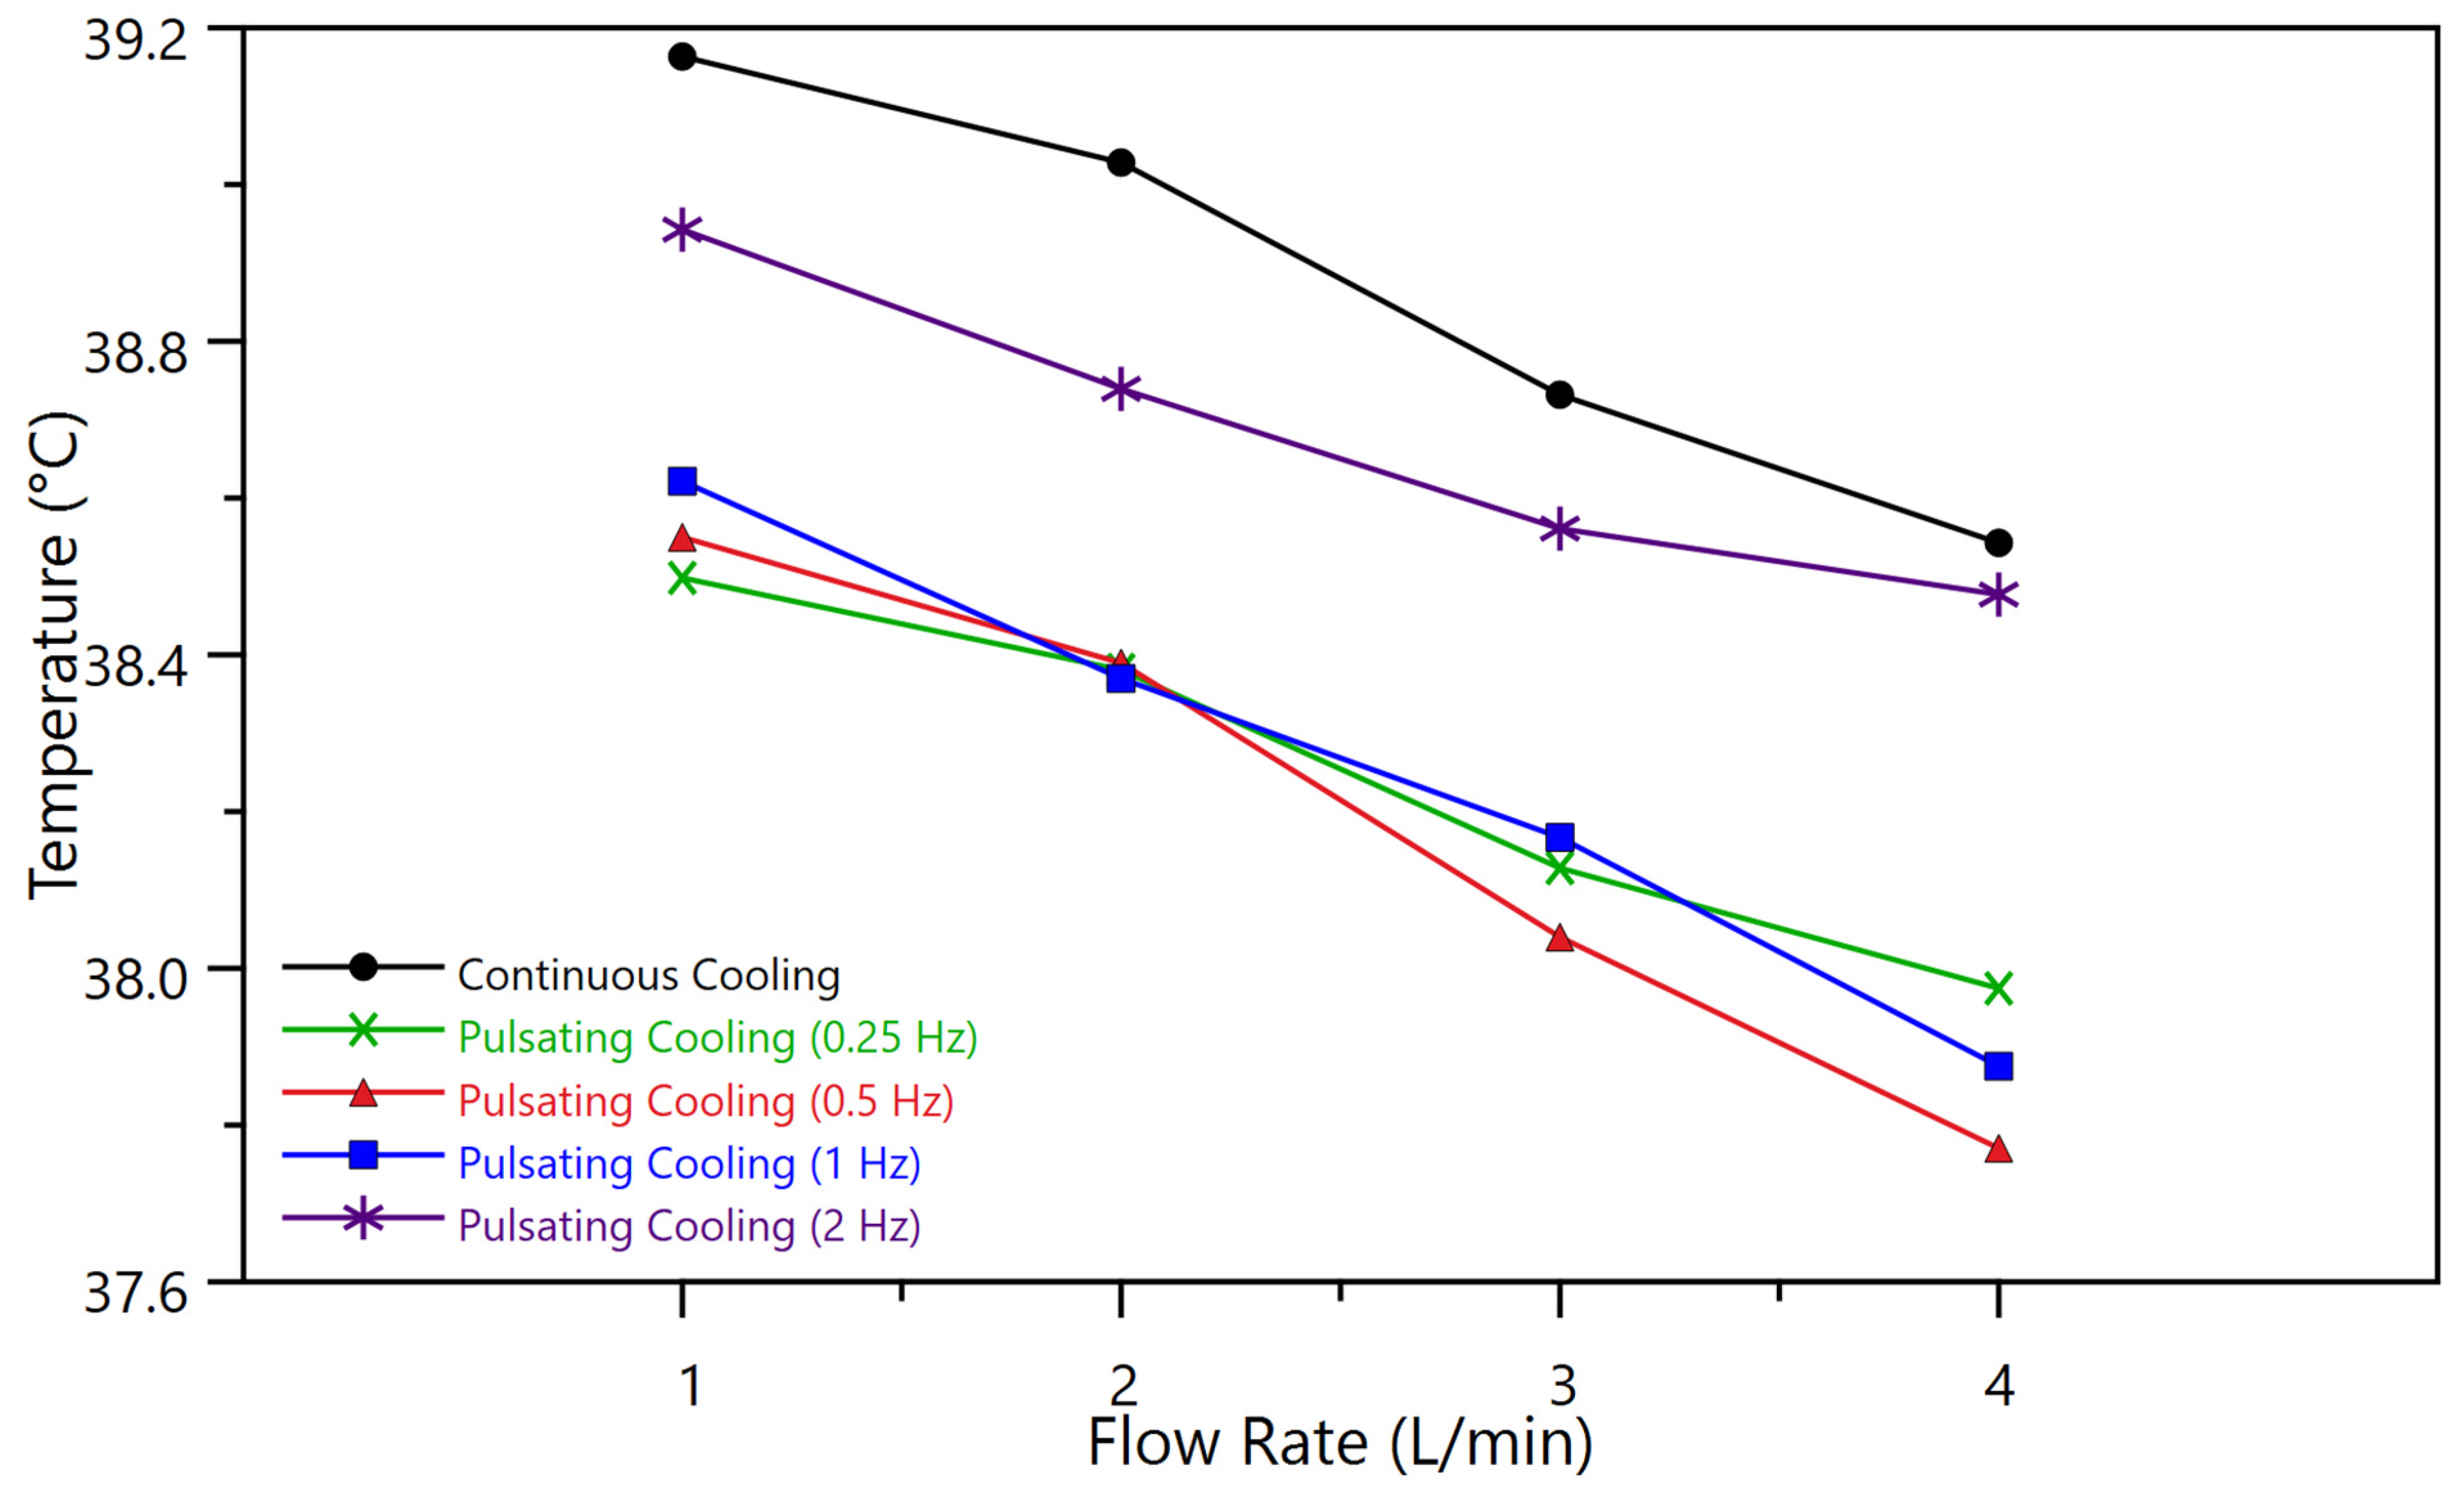
Figure 12 shows how the PVT surface temperature responds to changes in flow rate under different cooling modes, including continuous flow and pulsating flow at 0.25 Hz, 0.5 Hz, 1 Hz, and 2 Hz. As expected, increasing the flow rate consistently lowers the surface temperature in all cases due to stronger convective heat transfer. Continuous cooling results in the highest surface temperatures throughout, confirming it’s the least efficient mode. All pulsating flow cases improve cooling performance, but their effectiveness varies with frequency. At higher flow rates, 0.5 Hz delivers the lowest surface temperatures, showing it’s the most efficient setting in this range. 1 Hz follows closely behind, while 2 Hz underperforms relative to the other pulsating cases and trends closer to the continuous flow behavior. This suggests that at higher frequencies, the flow becomes too stable, losing the pulsation-induced mixing that disrupts the thermal boundary layer. The 0.25 Hz and 1 Hz curves track closely together, both providing solid improvements, but neither consistently outperforms the other across all flow rates. The overall assessment is evident: pulsating flow is effective, but its success depends on achieving the correct frequency. Excessively high values result in inefficient performance. It improves heat transfer by repeatedly interrupting the growth of the thermal boundary layer. Each acceleration phase increases wall shear and thins the layer, while the deceleration phase allows partial detachment and redevelopment. This continual regeneration keeps the boundary layer thinner than in steady laminar flow, increasing the wall temperature gradient and enhancing convection. At very high frequencies the flow cannot fully accelerate or decelerate, so the boundary-layer disruption weakens and the benefit diminishes.
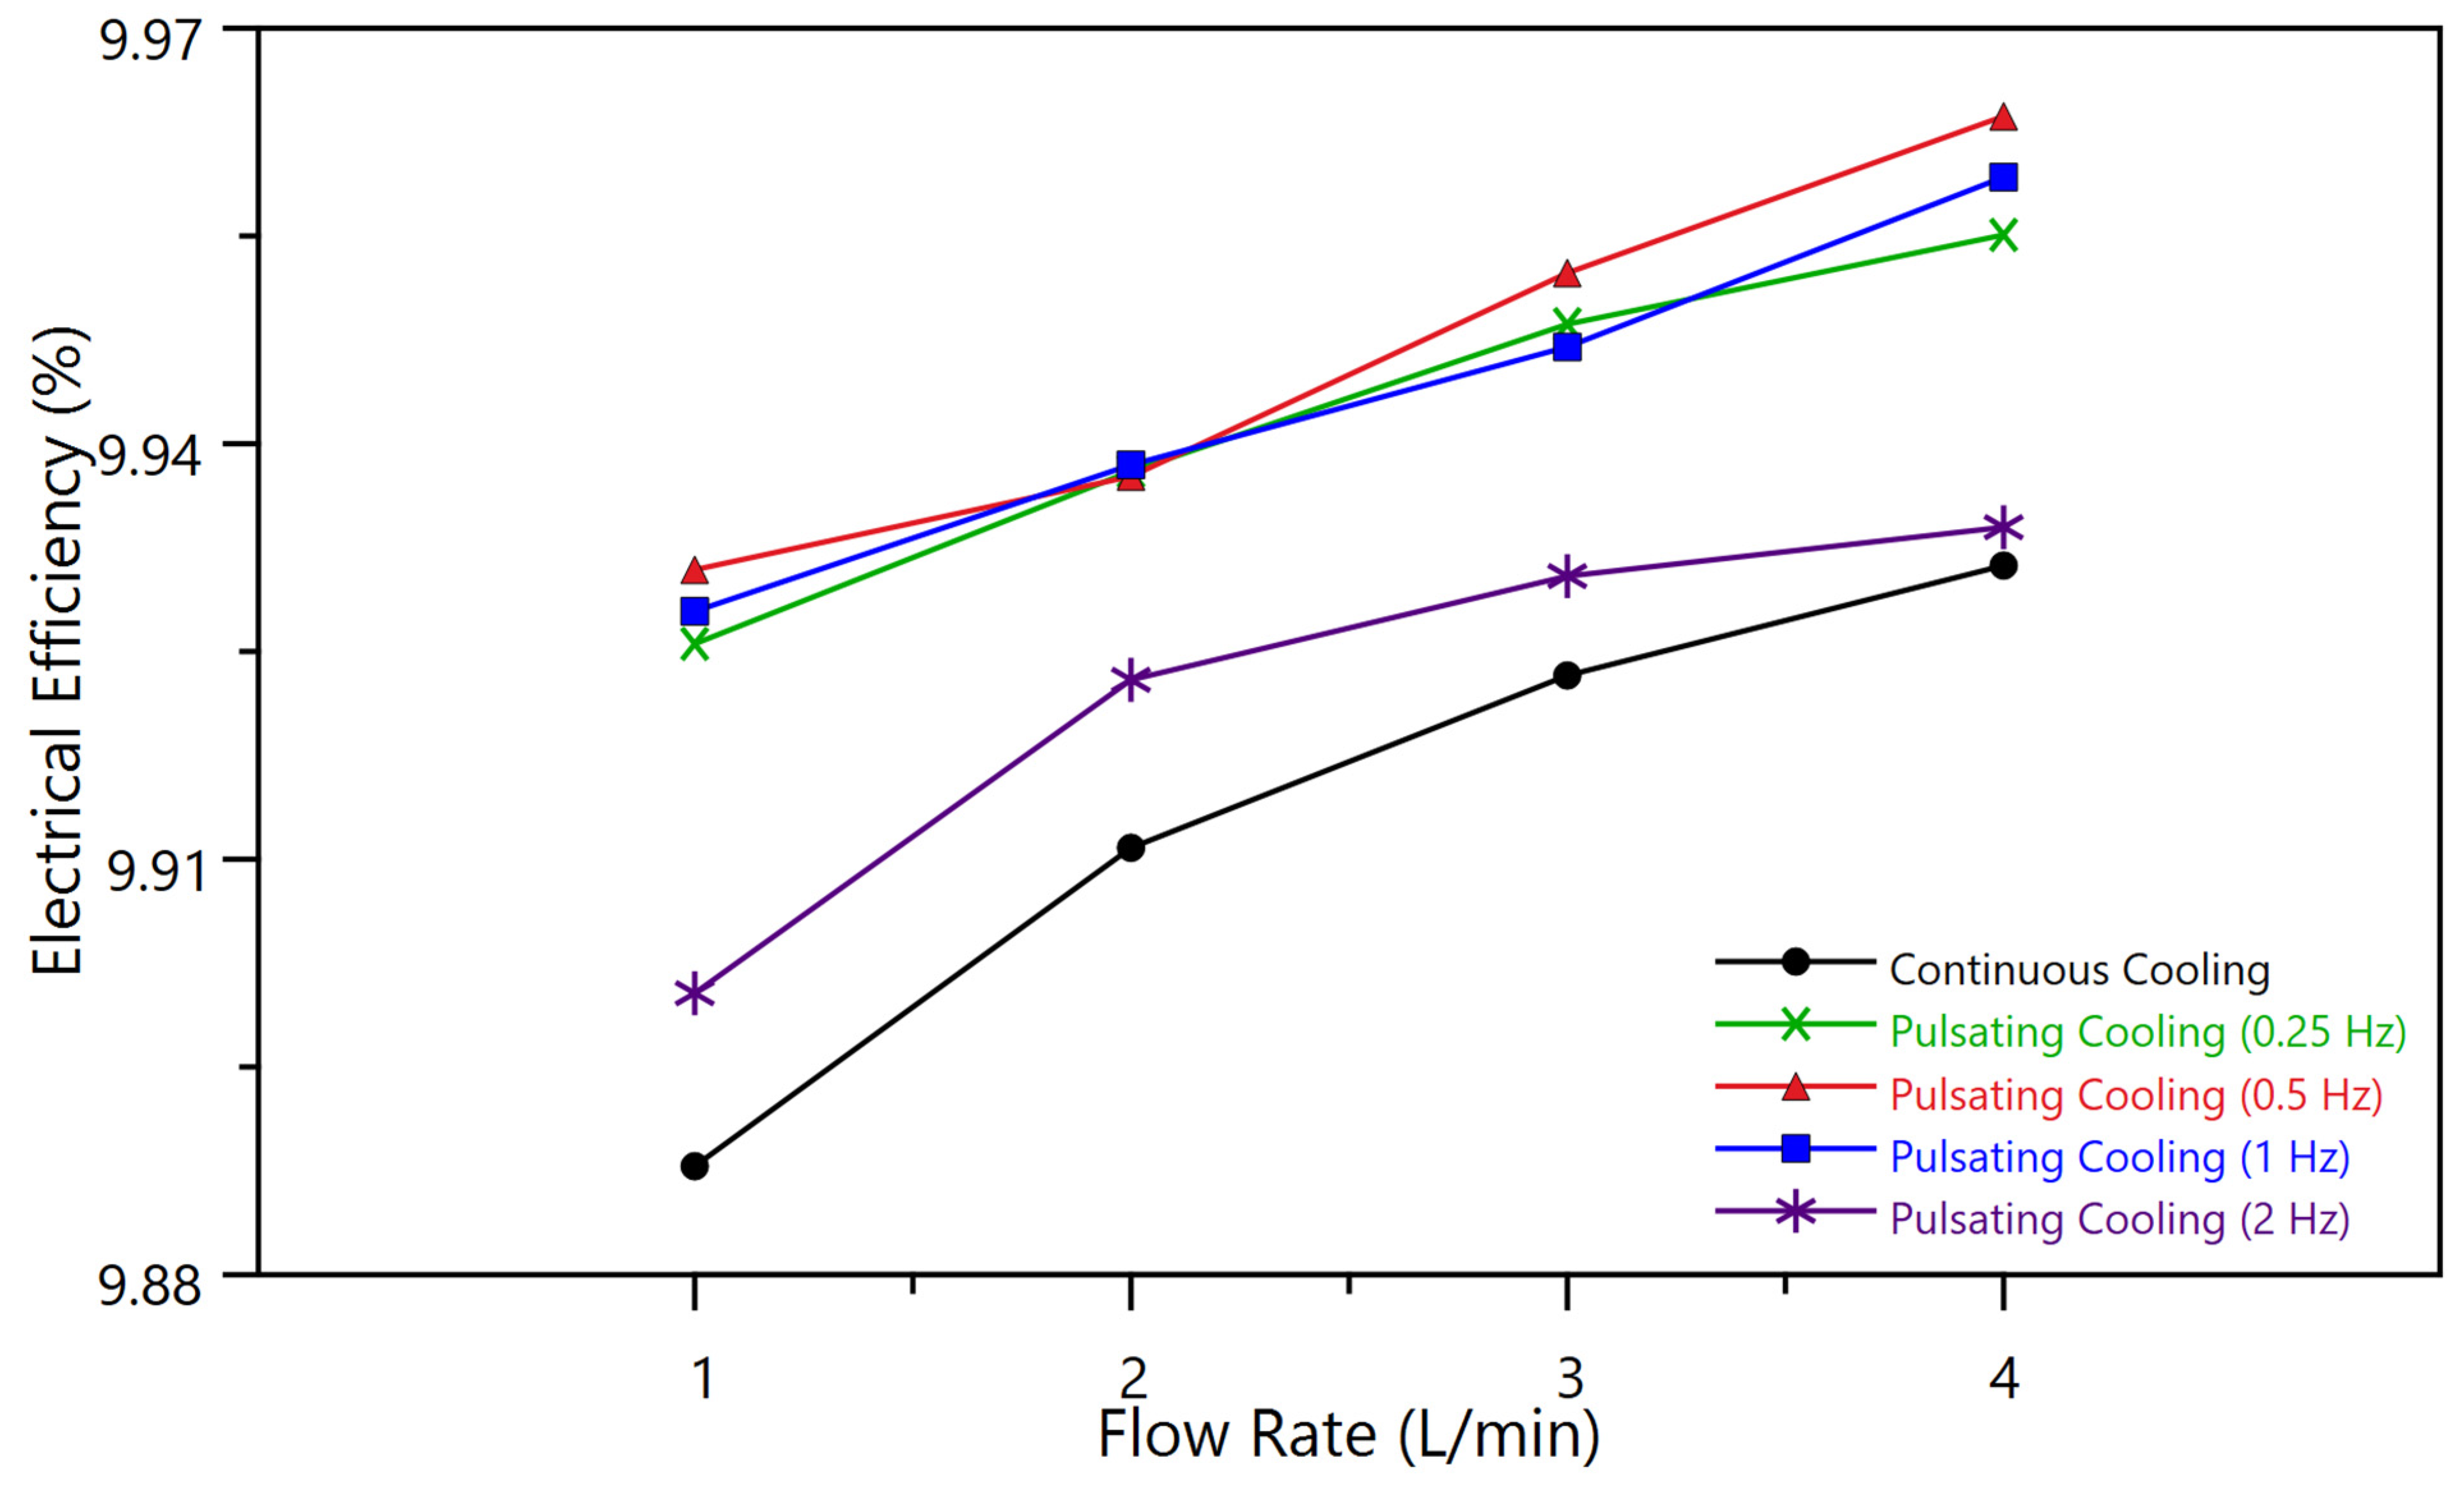
Figure 13 displays the effect of flow rate and cooling strategy on the electrical efficiency of the PVT system, comparing continuous flow with pulsating cooling at frequencies of 0.25 Hz, 0.5 Hz, 1 Hz, and 2 Hz. The general trend is straightforward: as flow rate increases, electrical efficiency improves across all cases. This is expected since better cooling reduces cell temperature, which in turn improves electrical performance. Continuous cooling consistently yields the lowest efficiencies at every flow rate, confirming it’s the least effective approach. Pulsating cooling outperforms it in all cases, but the degree of improvement depends on the pulsation frequency. At 0.5 Hz, the system achieves the highest electrical efficiency, particularly at 3 and 4 L/min, making it the optimal configuration in this dataset. The 1 Hz and 0.25 Hz cases perform nearly as well, tracking closely with 0.5 Hz, especially at intermediate flow rates. On the other hand, the 2 Hz case lags behind the other pulsating frequencies, though it still does better than continuous flow. This weaker performance at 2 Hz aligns with earlier observations from thermal data, excessive pulsation frequency starts to resemble steady-state behavior and loses its benefit. Overall, the data reinforces the conclusion that pulsating flow enhances electrical efficiency, with 0.5 Hz emerging as the sweet spot. Higher flow rates amplify the impact, but if the frequency is poorly tuned, you’re not getting the full benefit.
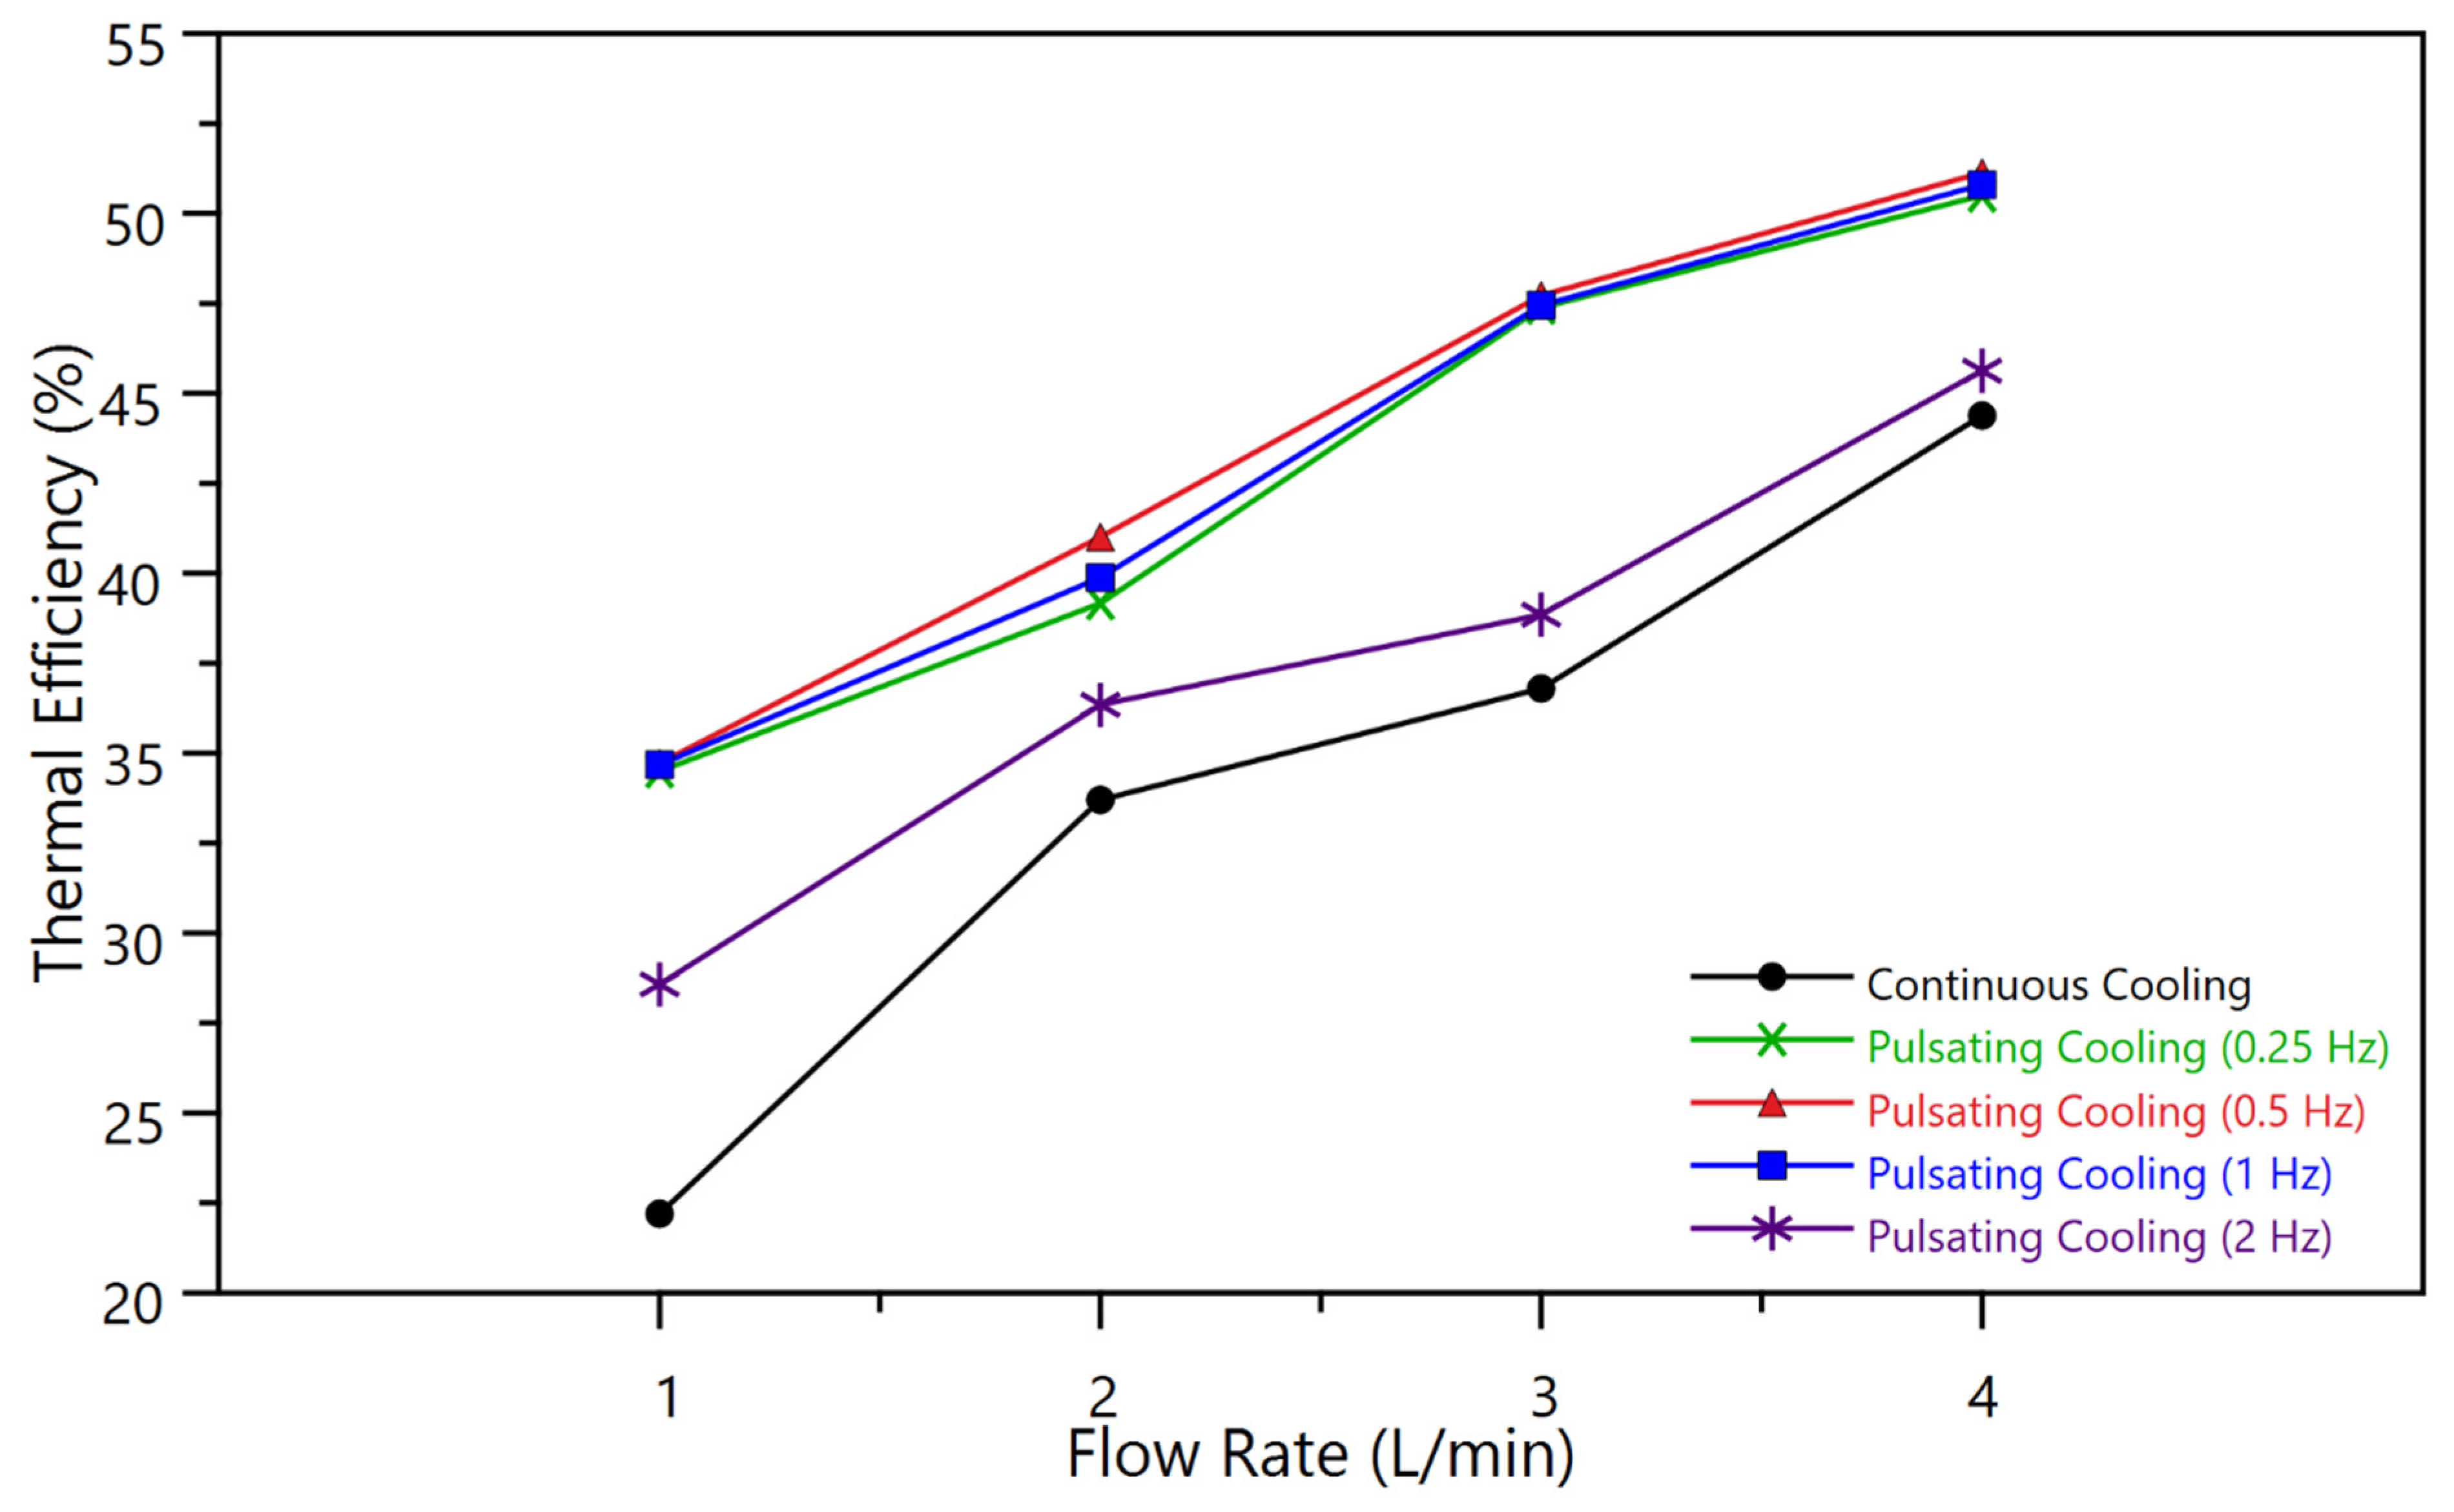
Figure 14 compares the thermal efficiency of a PVT system under continuous and pulsating cooling across flow rates from 1 to 4 L/min. The pattern is clear and consistent: thermal efficiency increases with flow rate, regardless of the cooling method. That’s expected—more flow means better heat extraction. But what stands out is how much better pulsating cooling performs compared to continuous flow. At every flow rate, all pulsating frequencies beat continuous cooling by a wide margin. The 0.5 Hz, 1 Hz, and 0.25 Hz cases all track closely and dominate the upper end of performance, particularly at 3 and 4 L/min where the differences become more pronounced. Under continuous flow cooling, the present system achieved thermal efficiencies in the range of 40–45%, which is comparable to the ~47% reported by [28] for water-cooled PVT systems under 800 W/m2 indoor irradiance. At these rates, thermal efficiency crosses the 50% mark with pulsating flow, something continuous flow never achieves. The 2 Hz case improves with flow, but it consistently trails behind the other pulsating frequencies, again showing that pushing the frequency too high dampens the unsteady effects and reduces the thermal benefit. Simply, pulsating flow works, and frequency tuning matters. If you’re after maximum thermal output, avoid the extremes and stick with mid-range pulsation like 0.5 or 1 Hz.
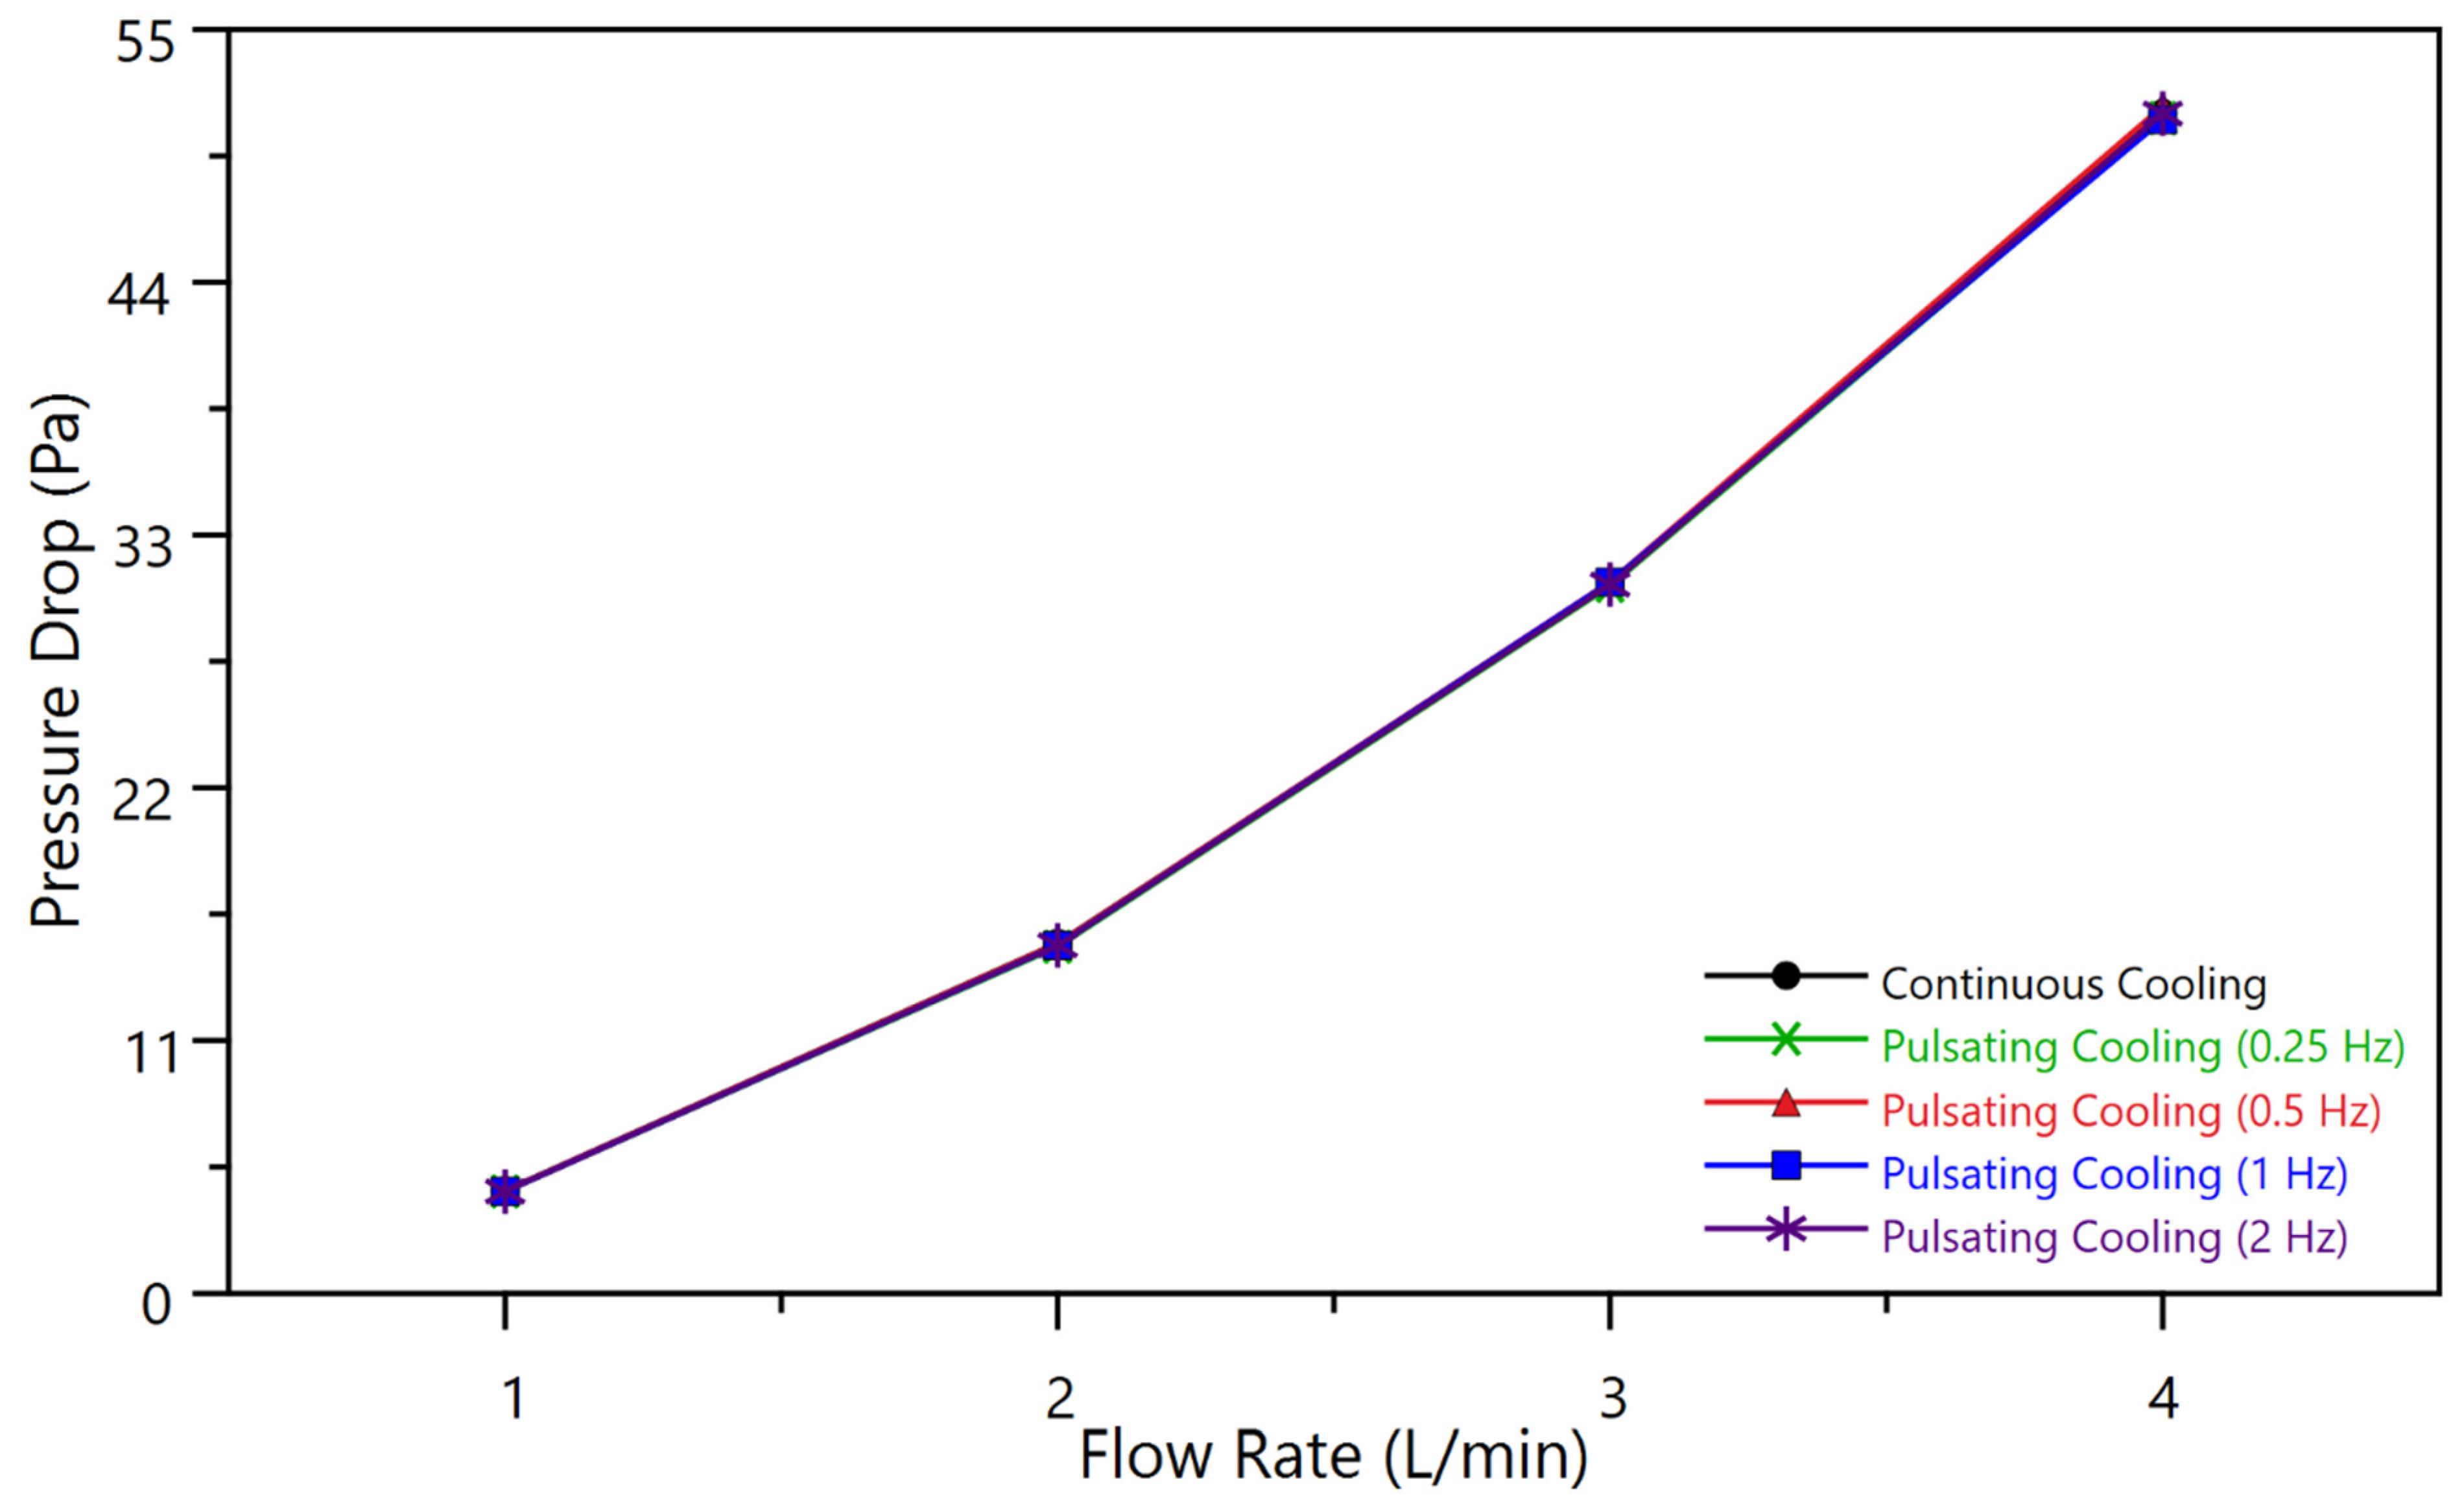
Figure 15 illustrates the average pressure drop across the cooling channel for both continuous and pulsating flow cases at frequencies of 0.25, 0.5, 1, and 2 Hz. In all instances, the pressure drop increases consistently with the flow rate, demonstrating the anticipated quadratic relationship with velocity. Values increase from approximately 4.4 Pa at 1 L/min to nearly 52 Pa at 4 L/min, indicating the hydraulic cost associated with increased throughputs. The trend exhibits smoothness and monotonicity, showing no indications of instability or regime shifts within the examined range. The significant overlap among all curves is noteworthy. Continuous cooling and all pulsating cases align closely along the same line, exhibiting no systematic deviation associated with frequency. This indicates that the introduction of pulsation does not impose a significant penalty on channel hydraulics. The primary determinant is the mean flow rate, whereas oscillatory disturbances are insufficient to affect the overall pressure loss. This outcome is advantageous from a system design perspective. The pressure drop is directly associated with the requirements for pumping power and the long-term mechanical stress experienced by the fluid circuit. The data indicate that pulsating cooling can be implemented without elevating these demands. The thermal and electrical performance advantages observed during pulsation are attained without incurring additional hydraulic costs, thereby reinforcing the argument for its implementation in photovoltaic-thermal applications.

4. Conclusions

Based on the experimental investigation conducted using an indoor solar simulator, the following conclusions can be drawn regarding the performance of the photovoltaic thermal (PVT) system under pulsating flow conditions:
  • The implementation of pulsating flow improved the thermal performance of the PVT system relative to uncooled and continuous flow configurations, while electrical performance showed a smaller but consistent improvement that followed the same thermal trend. A pulsation frequency of 0.5 Hz provided the most favorable overall behavior, yielding higher heat extraction, lower PVT surface temperatures, and stable electrical output over time. Pulsating flow promotes periodic disruption of the thermal boundary layer and enhances near-wall fluid mixing, leading to improved heat transfer without any measurable increase in pressure drop or pumping demand. Across all tested conditions, the system remained hydraulically stable.
  • Among the tested frequencies (0.25 Hz, 0.5 Hz, 1 Hz, and 2 Hz), the 0.5 Hz configuration produced the most consistent enhancement in thermal performance, particularly at flow rates between 3 and 4 L/min. Higher pulsation frequencies, such as 2 Hz, resulted in reduced thermal benefit as the flow behavior approached quasi-steady conditions, weakening boundary-layer disruption. Lower frequencies (0.25 Hz and 1 Hz) maintained effective performance, confirming that appropriate frequency selection is critical. Pulsating flow did not introduce any additional hydraulic penalty, supporting its feasibility for practical PVT cooling applications.
  • Thermal efficiency exhibited a clear and substantial improvement under pulsating flow across all tested flow rates, with values exceeding 50% at higher flow rates for the 0.5 Hz and 1 Hz cases. Improvements in electrical efficiency were comparatively modest and, in some cases, within the margin of experimental uncertainty; however, the observed trends were consistent with the corresponding reductions in PVT surface temperature. These findings indicate that the primary benefit of pulsating flow in the present system lies in enhanced thermal energy extraction rather than electrical gain.
  • This study is subject to several limitations. All experiments were conducted under controlled indoor conditions using a solar simulator, which does not capture real-world environmental variability such as fluctuating irradiance, wind effects, and ambient temperature changes. The pulsation frequency range (0.25–2 Hz) was constrained by solenoid valve response characteristics and may not represent the full effective operating spectrum. In addition, water was the only working fluid considered.
  • Future work should focus on validating the long-term reliability of pulsating components under outdoor operating conditions, particularly the durability of solenoid valves and associated control systems. Further performance gains may be achievable by combining pulsating flow with other enhancement techniques, such as nanofluids or phase change materials. The development of adaptive control strategies responsive to real-time environmental conditions would also improve the practical applicability of pulsating flow for PVT systems. Numerical investigations supporting the experimentally observed trends will be presented in a forthcoming study.

Author Contributions

Conceptualization, A.M. and A.C.; methodology, A.M.; software, A.M.; validation, A.M., A.A. and A.C.; formal analysis, A.M.; investigation, AM.; resources, A.M. and A.A.; data curation, A.A.; writing—original draft preparation, A.M. and A.A.; writing—review and editing, A.M., A.A. and A.C.; visualization, A.M. and A.A.; supervision, A.A. and A.C.; project administration, A.A. and A.C.; funding acquisition, A.M. All authors have read and agreed to the published version of the manuscript.

Funding

This research received no external funding.

Data Availability Statement

The data presented in this study are available on request from the corresponding author due to privacy reasons.

Conflicts of Interest

The authors declare no conflict of interest.

Nomenclature

Abbreviations
Q u ˙ Useful heat transferred to the fluid, W
Mass flow rate, kg/s
CpSpecific heat of water, J/kg·K
ToOutlet fluid temperature, °C
TiInlet fluid temperature, °C
APVTCollector area, m2
ILight intensity on Photovoltaic module surface, W/m2
VPVTMeasured PVT voltage, V
IPVTMeasured PVT current, A
t1Solenoid valve opening time, s
t2Solenoid valve closing time, s
UTime-averaged flow velocity, m/s
ΔPPressure drop, Pa
DhHydraulic diameter, m
LChannel length, m
fPulsation frequency, Hz
ƒDDarcy friction factor
Greek Symbols
v Kinematic viscosity, m2/s
ρ Density, kg/m3
η Efficiency
α Wormsley Number
Subscripts
thThermal
eleElectrical

References

  1. Yekinni, S.; Asiata, I.; Hakeem, O.; Mubarak, L. Solar Photovoltaic Energy System. In Nanogenerators and Self-Powered Systems; IntechOpen: London, UK, 2023. [Google Scholar] [CrossRef]
  2. Zhang, H.L.; Van Gerven, T.; Baeyens, J.; Degrève, J. Photovoltaics: Reviewing the European Feed-in-Tariffs and Changing PV Efficiencies and Costs. Sci. World J. 2014, 2014, 404913. [Google Scholar] [CrossRef] [PubMed]
  3. Pillai, U. Drivers of cost reduction in solar photovoltaics. Energy Econ. 2015, 50, 286–293. [Google Scholar] [CrossRef]
  4. Al-Ghezi, M.K.; Ahmed, R.T.; Chaichan, M.T. The Influence of Temperature and Irradiance on Performance of the photovoltaic panel in the Middle of Iraq. Int. J. Renew. Energy Dev. 2022, 11, 501–513. [Google Scholar] [CrossRef]
  5. Wang, X.; Geng, H.; He, S.; Pokhyl, Y.; Koval, K.-I. Effect of thermal expansion coefficient on the stress distribution in solar panel. Int. J. Adhes. Adhes. 2007, 27, 288–297. [Google Scholar] [CrossRef]
  6. Michael, J.; Iniyan, S.; Goic, R. Flat plate solar photovoltaic–thermal (PV/T) systems: A reference guide. Renew. Sustain. Energy Rev. 2015, 51, 62–88. [Google Scholar] [CrossRef]
  7. Hossain, M.S.; Pandey, A.K.; Selvaraj, J.; Rahim, N.A.; Rivai, A.; Tyagi, V.V. Thermal performance analysis of parallel serpentine flow based photovoltaic/thermal (PV/T) system under composite climate of Malaysia. Appl. Therm. Eng. 2019, 153, 861–871. [Google Scholar] [CrossRef]
  8. Preet, S.; Bhushan, B.; Mahajan, T. Experimental investigation of water based photovoltaic/thermal (PV/T) system with and without phase change material (PCM). Sol. Energy 2017, 155, 1104–1120. [Google Scholar] [CrossRef]
  9. Skullong, S.; Promvonge, P.; Thianpong, C.; Pimsarn, M. Heat transfer and turbulent flow friction in a round tube with staggered-winglet perforated-tapes. Int. J. Heat Mass Transf. 2016, 95, 230–242. [Google Scholar] [CrossRef]
  10. Mahdi, Z.M.; Al-Shamani, A.N.; Al-Manea, A.; Al-Zurfi, H.A.; Al-Rbaihat, R.; Sopian, K.; Alahmer, A. Enhancing photovoltaic thermal (PVT) performance with hybrid solar collector using phase change material, porous media, and nanofluid. Sol. Energy 2024, 283, 112983. [Google Scholar] [CrossRef]
  11. Namuq, S.A.; Mahdi, J.M. Boosting thermal regulation of phase change materials in photovoltaic-thermal systems through solid and porous fins. Int. J. Renew. Energy Dev. 2024, 13, 179–190. [Google Scholar] [CrossRef]
  12. Riad, A.; Amiry, H.; Touhtouh, S.; Belhora, F.; Hajjaji, A. Comparison of symmetric and asymmetric copper tubing designs for improved cooling in PV/T systems. E3S Web Conf. 2025, 601, 00107. [Google Scholar] [CrossRef]
  13. Li, F.; Sui, Y.; Lin, H.; Sui, Z.; Lee, K.; Xie, S.; Zeng, W.; Ding, Z.; Yip, H.L.; Wu, W. Self-adaptive interfacial evaporation for high-efficiency photovoltaic panel cooling. Device 2024, 3, 100569. [Google Scholar] [CrossRef]
  14. Cornago, I.; Ezquer, M.; Sorbet, F.J.; Kalms, A.; Diarce, G.; Irulegi, O.; Zaversky, F. New approach of PV and thermal modeling to develop feasible cooling solutions for PV in buildings. EPJ Photovolt. 2025, 16, 19. [Google Scholar] [CrossRef]
  15. Sohail, A.; Rusdi, M.S.; Waseem, M.; Abdullah, M.Z.; Pallonetto, F.; Sultan, S.M. Cutting-edge developments in active and passive photovoltaic cooling for reduced temperature operation. Results Eng. 2024, 23, 102662. [Google Scholar] [CrossRef]
  16. Alhamayani, A. Numerical analysis and deep learning algorithm for photovoltaic-thermal systems using various nanofluids and volume fractions at Riyadh, Saudi Arabia. Case Stud. Therm. Eng. 2024, 54, 103974. [Google Scholar] [CrossRef]
  17. Ahmed, B.O.; Ibrahim, A.; Azeez, H.L.; Dol, S.S.; Al-Waeli, A.H.A.; Jaber, M. Energy and exergy analysis of a newly designed photovoltaic thermal system featuring ribs, petal array, and coiled twisted tapes: Experimental analysis. Case Stud. Therm. Eng. 2024, 63, 105388. [Google Scholar] [CrossRef]
  18. Azeez, H.L.; Ibrahim, A.; Ahmed, B.O.; Dol, S.S.; Al-Waeli, A.H.A.; Jaber, M. Experimental investigations of heat transfer, energy, and exergy-based sustainability of a novel photovoltaic thermal system. Case Stud. Therm. Eng. 2025, 70, 106089. [Google Scholar] [CrossRef]
  19. Singh, S.; Singh, S.K.; Mali, H.S.; Dayal, R. Numerical investigation of heat transfer in structured rough microchannels subjected to pulsed flow. Appl. Therm. Eng. 2021, 197, 1359–4311. [Google Scholar] [CrossRef]
  20. Elshafei, E.A.M.; Mohamed, M.S.; Mansour, H.; Sakr, M. Experimental study of heat transfer in pulsating turbulent flow in a pipe. Int. J. Heat Fluid Flow 2008, 29, 1029–1038. [Google Scholar] [CrossRef]
  21. Davletshin, I.A.; Gazizov, I.M.; Paereliy, A.A. Heat transfer in the flow with forced pulsations in a rib-roughened channel. J. Phys. Conf. Ser. 2018, 1105, 12022. [Google Scholar] [CrossRef]
  22. Khosravi-Bizhaem, H.; Abbassi, A.; Ravan, A.Z. Heat transfer enhancement and pressure drop by pulsating flow through helically coiled tube: An experimental study. Appl. Therm. Eng. 2019, 160, 114012. [Google Scholar] [CrossRef]
  23. Naphon, P.; Wiriyasart, S. Experimental study on laminar pulsating flow and heat transfer of nanofluids in micro-fins tube with magnetic fields. Int. J. Heat Mass Transf. 2017, 118, 297–303. [Google Scholar] [CrossRef]
  24. Bayomy, A.M.; Saghir, M.Z. Heat transfer characteristics of aluminum metal foam subjected to a pulsating/steady water flow: Experimental and numerical approach. Int. J. Heat Mass Transf. 2016, 97, 318–336. [Google Scholar] [CrossRef]
  25. Nateqi, M.; Zargarabadi, M.R.; Rafee, R. Experimental investigations of spray flow rate and angle in enhancing the performance of PV panels by steady and pulsating water spray system. SN Appl. Sci. 2021, 3, 130. [Google Scholar] [CrossRef]
  26. Alizadeh, H.; Nazari, M.A.; Ghasempour, R.; Shafii, M.B.; Akbarzadeh, A. Numerical analysis of photovoltaic solar panel cooling by a flat plate closed-loop pulsating heat pipe. Sol. Energy 2020, 206, 455–463. [Google Scholar] [CrossRef]
  27. Ibrahim, K.A.; Luk, P.C.-K.; Luo, Z. Cooling of Concentrated Photovoltaic Cells—A Review and the Perspective of Pulsating Flow Cooling. Energies 2023, 16, 2842. [Google Scholar] [CrossRef]
  28. Yandri, E. Development and experiment on the performance of polymeric hybrid Photovoltaic Thermal (PVT) collector with halogen solar simulator. Sol. Energy Mater. Sol. Cells 2019, 201, 110066. [Google Scholar] [CrossRef]
  29. Alkhalidi, A.; Khawaja, M.K.; Al Kelany, A.G. Investigation of repurposed material utilization for environmental protection and reduction of overheat power losses in PV panels. Int. J. Photoenergy 2019, 2019, 2181967. [Google Scholar] [CrossRef]
  30. Ghadiri, M.; Sardarabadi, M.; Pasandideh-Fard, M.; Moghadam, A.J. Experimental investigation of a PVT system performance using nano ferrofluids. Energy Convers. Manag. 2015, 103, 468–476. [Google Scholar] [CrossRef]
  31. Yang, D.J.; Yuan, Z.F.; Lee, P.H.; Yin, H.M. Simulation and experimental validation of heat transfer in a novel hybrid solar panel. Int. J. Heat Mass Transf. 2012, 55, 1076–1082. [Google Scholar] [CrossRef]
  32. Spectra of the Different Indoor Light Sources. (a) Xenon Lamp, (b) | Download Scientific Diagram. Available online: https://www.researchgate.net/figure/Fig-2-Spectra-of-the-different-indoor-light-sources-a-Xenon-lamp-b-incandescent_fig1_330372622 (accessed on 29 March 2024).
  33. Kovacs, P. Quality Assurance in Solar Heating and Cooling Technology: Report of Project Achievements. 2012. Available online: https://www.diva-portal.org/smash/record.jsf?pid=diva2:963373 (accessed on 14 April 2024).
  34. Fischer, S.; Drück, H. Standards and Certification Schemes for Solar Thermal Collectors, Stores and Systems—An Overview about the Latest Developments. Energy Procedia 2014, 57, 2867–2871. [Google Scholar] [CrossRef][Green Version]
  35. Alhamayani, A.; Al-lehaibi, M. The effect of adding hybrid nanoparticles (Al2O3–TiO2) on the performance of parabolic trough solar collectors using different thermal oils and molten salts. Case Stud. Therm. Eng. 2024, 59, 104593. [Google Scholar] [CrossRef]
  36. Alhamayani, A. CNN-LSTM to Predict and Investigate the Performance of a Thermal/Photovoltaic System Cooled by Nanofluid (Al2O3) in a Hot-Climate Location. Processes 2023, 11, 2731. [Google Scholar] [CrossRef]
  37. Haibullina, A.; Khairullin, A.; Balzamov, D.; Ilyin, V.; Bronskaya, V.; Khairullina, L. Local Heat Transfer Dynamics in the In-Line Tube Bundle under Asymmetrical Pulsating Flow. Energies 2022, 15, 5571. [Google Scholar] [CrossRef]
  38. Yuan, B.; Zhang, Y.; Liu, L.; Wei, J.; Yang, Y. Experimental research on heat transfer enhancement and associated bubble characteristics under high-frequency reciprocating flow. Int. J. Heat Mass Transf. 2020, 146, 118825. [Google Scholar] [CrossRef]
  39. Ye, Q.; Zhang, Y.; Wei, J. A comprehensive review of pulsating flow on heat transfer enhancement. Appl. Therm. Eng. 2021, 196, 117275. [Google Scholar] [CrossRef]
  40. Coleman, H.W.; Steele, W.G. Experimentation, Validation, and Uncertainty Analysis for Engineers, 4th ed.; John Wiley and Sons: Hoboken, NJ, USA, 2018. [Google Scholar]
Figure 1. Comparison of spectra from various halogen light sources with the standard solar spectrum [32].
Thermo 06 00011 g001
Figure 2. (a) Arrangement of halogen lamps. (b) Frame of the solar simulator.
Thermo 06 00011 g002
Figure 3. Solar simulator irradiance mapping.
Thermo 06 00011 g003
Figure 4. Solar simulator setup.
Thermo 06 00011 g004
Figure 5. (a) Layout and internal flow path of the Sundrum Solar SDM 100 cooling channel mounted behind the PV module (all dimensions in m). (b) Cross-sectional schematic of the setup.
Thermo 06 00011 g005
Figure 6. (a) Experimental setup of the PVT system with pulsating mechanism. (b) Schematic flow diagram of the experimental PVT system with the pulsating flow mechanism.
Thermo 06 00011 g006
Figure 7. PVT surface temperature over a 60 min period across three operational cases: no cooling, constant water cooling, and pulsating water cooling.
Thermo 06 00011 g007
Figure 8. Electrical efficiency of a photovoltaic thermal (PVT) system over a 60 min period under three different operating cases: no cooling, continuous cooling, and pulsating cooling.
Thermo 06 00011 g008
Figure 9. Thermal efficiency of a photovoltaic thermal (PVT) system over a 60 min period under two different operating cases: continuous cooling, and pulsating cooling.
Thermo 06 00011 g009
Figure 10. Womersley number versus pulsation frequency across all tested volumetric flow rates (1–4 L/min).
Thermo 06 00011 g010
Figure 11. Reynolds number versus flow rate for both continuous and pulsating cooling cases at various frequencies.
Thermo 06 00011 g011
Figure 12. PVT surface temperature versus flow rate for both continuous and pulsating cooling cases at various frequencies.
Thermo 06 00011 g012
Figure 13. Electrical efficiency versus flow rate for both continuous and pulsating cooling cases at different frequencies.
Thermo 06 00011 g013
Figure 14. Thermal efficiency versus flow rate for continuous and pulsating cooling cases at various frequencies.
Thermo 06 00011 g014
Figure 15. Pressure drop versus flow rate for both continuous and pulsating cooling cases at different frequencies.
Thermo 06 00011 g015
Table 1. Summary of Prior Studies on Pulsating Flow for Heat Transfer Enhancement.
InvestigatorsFluid TypePulsator Type & LocationFlow Conditions and SetupMain Findings
Elshafei et al. [20]Air (electrically heated)Butterfly valve (downstream)Re = 10,900–37,000, f = 6.6–68 Hz, straight copper tubeHeat transfer varied with Re and pulsation frequency
Davletshin et al. [21]Air (electrically heated)Flap valve (downstream)Re ≤ 4.3 × 10⁴, f = 0–100 Hz, long rectangular channel with aluminum ribsUp to 30% heat transfer gain near ribs
Khosravi-Bizhaem et al. [22]Water (electrically heated)Solenoid valve (upstream)Re = 2000–9500, f = 2–10 Hz, Helically coiled tubes with different curvaturesOptimal f = 4 Hz, ~20% improvement in convective heat transfer at low Re
Naphon & Wiriyasart [23]Nanofluid (electrically heated)Peristaltic pump, upstream of micro-fins tubes 160 W heat input, Re < 2400, f = 10–20 Hz, micro-fin tubes22.2% higher Nusselt number at 20 Hz
Bayomy & Saghir [24]Water (electrically heated) Valve (upstream)13.8 W/cm2 heat input, flow velocity = 0.7 m/s, f = 0.04–0.1 Hz, foam heat sinkNusselt number increased by 14% over steady flow
Nateqi et al. [25]Water spray, (heated by direct sun exposure)Solenoid valve for water control (downstream)f = 0.2 Hz, on solar panel surfaceEfficiency improved by 16.84% compared to non-cooled PV, reduction in water use by 50%
Alizadeh et al. [26]Water, flat plate closed-loop pulsating heat pipeFlat plate closed-loop pulsating heat pipe; pulsation induced by thermal phase changeSimulated small scale PV panel (1.5 W) under variable simulated solar irradiationTemperature of PV reduced by 22.2 °C; efficiency improved by 35.3% at 1235 W/m2
Ibrahim et al. [27]WaterSolenoid valve (downstream)f = 0.5 Hz, 0.4 m cooling channel, single concentrated solar cell under sun simulatorSlight temperature drop from 30.10 °C to 30.05 °C; power improved until reach flow rate of 1.7 L/min
Table 2. Electrical equipment and accuracy.
InstrumentAccuracy/Sensitivity
ADS1115 Analog/INA219 current sensorCurrent: 1%; Voltage: 2%
Thermocouple Thermometer (Scottsdale, AZ, USA)±0.1 °C
Solar Charge Controller (Victron SmartSolar MPPT 75/15, Almere, The Netherlands)Not provided
Anemometer (XRCLIF-818, Mainland, China)2% ± 0.2 m/s
Pyranometer (LX107, Vici, Shenzhen, Chnia)±10 (W/m2)
Flow Meter (Moistenland, Mainland, China)<3%
Manometer (PM-9100, Lutron, Taipei, Taiwan)±2% F.S.
Table 3. PV module and cooling channel specifications.
Cooling Channel
TypeSUNDRUM SOLAR SDM 100
Maximum Operating Press6 psi
Operating Temperature Range10–90 °C
Channel Length (m)6
Channel Diameter (m)0.075
PV Module
TypeDOKIO
Maximum Power (Pmp)150 Watts
Maximum Power Voltage (Vmp)18 V
Maximum Power Current (Imp)8.33 A
Open Circuit Voltage (Voc)22.50 V
Short Circuit Current (Isc)8.58 A
Area of Module (A)0.97 m2
Nominal Operating Cell Temp −45 °C to 80 °C−45 to 80 °C
Number of Cells36 (mono crystalline type)
Table 4. Uncertainties of measured and calculated parameters.
ParameterRelative Uncertainty (%)
Mass flow rate1.73
Irradiance (G)0.75
Voltage (V)1.16
Current (I)0.58
uTH/ η T H 3.5
uElec/ η E l e c 1.5
Disclaimer/Publisher’s Note: The statements, opinions and data contained in all publications are solely those of the individual author(s) and contributor(s) and not of MDPI and/or the editor(s). MDPI and/or the editor(s) disclaim responsibility for any injury to people or property resulting from any ideas, methods, instructions or products referred to in the content.