Article

Experimental Study of the Cross-Influence of Frost Morphology and Defrost Strategy on the Performance of Tube-Fin Evaporators of Household Refrigerators

by
Luiz P. B. Braun
1,
Rodrigo G. Reis
1,
Carlos A. R. Nascimento
2,
Alexsandro S. Silveira
1 and
Christian J. L. Hermes
1,*
1
POLO Laboratories—Cooling Systems Division, Department of Mechanical Engineering, Federal University of Santa Catarina, Florianópolis 88040-535, SC, Brazil
2
LATAM System Engineering—Food Preservation, Electrolux do Brazil S.A., Curitiba 81520-620, PR, Brazil
*
Author to whom correspondence should be addressed.
Thermo 2025, 5(3), 32; https://doi.org/10.3390/thermo5030032
Submission received: 27 June 2025 / Revised: 8 August 2025 / Accepted: 26 August 2025 / Published: 2 September 2025
(This article belongs to the Special Issue Frosting and Icing)

Abstract

This study is aimed at evaluating the combined influence of running conditions that affect frost morphology and defrost strategies on the thermal-fluid-dynamic performance of tube-fin ‘no-frost’ evaporators. To this end, two purpose-built experimental apparatuses were designed and constructed, one based upon a fully instrumented two-door bottom-mount ‘combi’ refrigerator with independent temperature and humidity control in both compartments, and another devised specifically for testing evaporator–heater assemblies under controlled frosting and defrosting cycles. Frost accumulation was studied for different surface temperatures and air humidity levels, revealing that higher humidity and lower surface temperatures led to lower frost density and thermal conductivity. Defrosting operations were analyzed for two different psychrometric conditions using three control strategies: step, ramp and pulse-width modulation (PWM). The ramp strategy yielded the highest defrost efficiency, reaching 36.7% in milder frost conditions, while the step strategy led to lower defrosting times. Such findings support the optimization of evaporator design and defrost strategies to improve energy efficiency in household refrigerating appliances.

1. Introduction

Refrigeration is an integral part of daily life for much of the global population and is essential for maintaining our current lifestyles. The refrigeration sector accounts for approximately 17% of global electricity consumption [1] and 10% of greenhouse gas emissions, amounting to about 5170 megatons of CO2 equivalent (MteqCO2) in 2023 [2]. Domestic refrigeration, in-turn, contributes approximately 448 MteqCO2, with 95.8% of these emissions being indirect and mainly due to electricity consumption [2].
Frost accumulation on the evaporator is a significant factor impacting energy consumption in household refrigerating appliances. Frost forms when moist air enters the cabinet due to door openings and subsequently builds-up on the evaporator’s cold surfaces [3]. The accumulated frost mass increases the thermal resistance between the evaporator surface and the air while also adding more airflow resistance by reducing the effective free flow passage, therefore affecting the forced convection heat transfer [4]. Figure 1 depicts the additional thermal resistance imposed by the frost layer on the evaporator surface.
Several authors have used experimental and numerical approaches to investigate the frost formation on tube-fin evaporators. The effects of frost accretion on the performance of the evaporators have been comprehensively investigated, albeit most studies did not consider the coupling between evaporator and fan [5,6,7], a crux in evaporator performance depletion [8,9,10,11]. Notwithstanding, only refs. [8,10] considered mixture of flows with different psychrometric conditions at the evaporator inlet. This condition is important in a single-evaporator two-door refrigerator—probably the refrigerating appliance most sold globally—as the return air from the frozen- and fresh-food compartments have significant differences in terms of temperature and humidity and reach the evaporator with a non-uniform flow distribution along its width.
As can be seen in Figure 1, the frost thickness directly affects the frost thermal resistance. A common method to quantify it, also employed in this work, is measuring the increasing pressure drop over the evaporator. Novel methods, such as estimating frost thickness using acoustic signals, have been proposed [12]. However, these methods do not provide qualitative information regarding the frost. To obtain such information, visualization has been employed [13,14,15,16,17], allowing a qualitative comparison between different frost layers to gather quantitative information about the frost thickness. In addition, frost accretion is fundamentally dependant on psychrometric conditions, surface temperature and characteristics [18,19,20,21,22,23].
As a result of the cooling capacity depletion due to frost accretion, periodic defrosting processes are required to maintain system performance [24]. Modern domestic refrigerators, particularly those equipped with forced air circulation, incorporate automatic defrosting cycles to do so [25]. Among the defrost methods, electric heater defrosting is the most used in domestic refrigeration due to its simplicity and low cost. Common heater types include distributed and radiant models [26]. A significant drawback of this method is the inefficiency associated with heat dissipation to unintended components, such as the evaporator structure, cabinet liners, and surrounding air, leading to increased post-defrost recovery time and higher energy consumption [27]. In this context, the so-called defrost efficiency, η d ,
η d = E f E h = m f i s l + c p f 0 T f t W ˙ h d t
is a key metric for assessing the effectiveness of the process, being defined as the ratio of energy required to melt the accumulated frost ( E f ) to the total energy consumed during the defrosting operation ( E h ) [9].
Increasing defrost efficiency is a priority for both industry and consumers, as it directly impacts energy consumption and food preservation. Previous studies have spanned a wide range of η d for domestic refrigerating appliances and proposed different methods to enhance it, as summarized in Table 1. Whereas some methods involve modifications to air circulation within the cabinet [28,29,30], others suggest controlling the refrigeration system operation before and after the defrost cycle to mitigate indoor temperature increases [31].
A simpler approach involves modifying the heater design [9,34], with non-uniform resistance heaters that deliver higher power in areas with greater frost accumulation, improving η d . Nonetheless, such approaches increase manufacturing costs and require precise knowledge of frost deposition patterns for each evaporator design, limiting production standardization. Concurrently, recent studies have proposed new control strategies, such as steps reduction and pulsating power [26,38]. Such approach has been shown to increase η d while promoting little to no increase in the manufacturing cost.
On one hand, a limited number of studies regarding frost formation were conducted within the operating ranges of a domestic refrigerator and considering the complexity of airflow (mal)distribution to and from compartments with different psychrometric conditions. On the other hand, the combined effect of frost morphology and defrost heater control strategy need to be further investigated for household appliances operating range. In this context, the present study firstly investigates the in-situ influence of different operating parameters on the evaporator frosting in a two-door bottom-mount refrigerator aimed at understanding their impact of frost characteristics on evaporator performance. Later, the combined influence of frost morphology and heater control strategy on the defrost efficiency is evaluated by means of a purpose-built wind-tunnel facility designed to emulate actual household refrigeration conditions. Test results are analyzed and defrost tests are further explored with image capture and treatment.

2. Experimental Work

2.1. Apparatuses

Two independent test rigs were developed: one designed to characterize frost formation under typical household appliance conditions, and another to evaluate defrost efficiency of different heaters and strategies applied to an evaporator covered by a fairly uniform frost layer. Due to their similar physical configuration and operating protocol, a detailed description of the frost formation rig suffices to convey an extensive understanding of the methodology, including that of the defrost rig. Details specific to the latter are provided later.
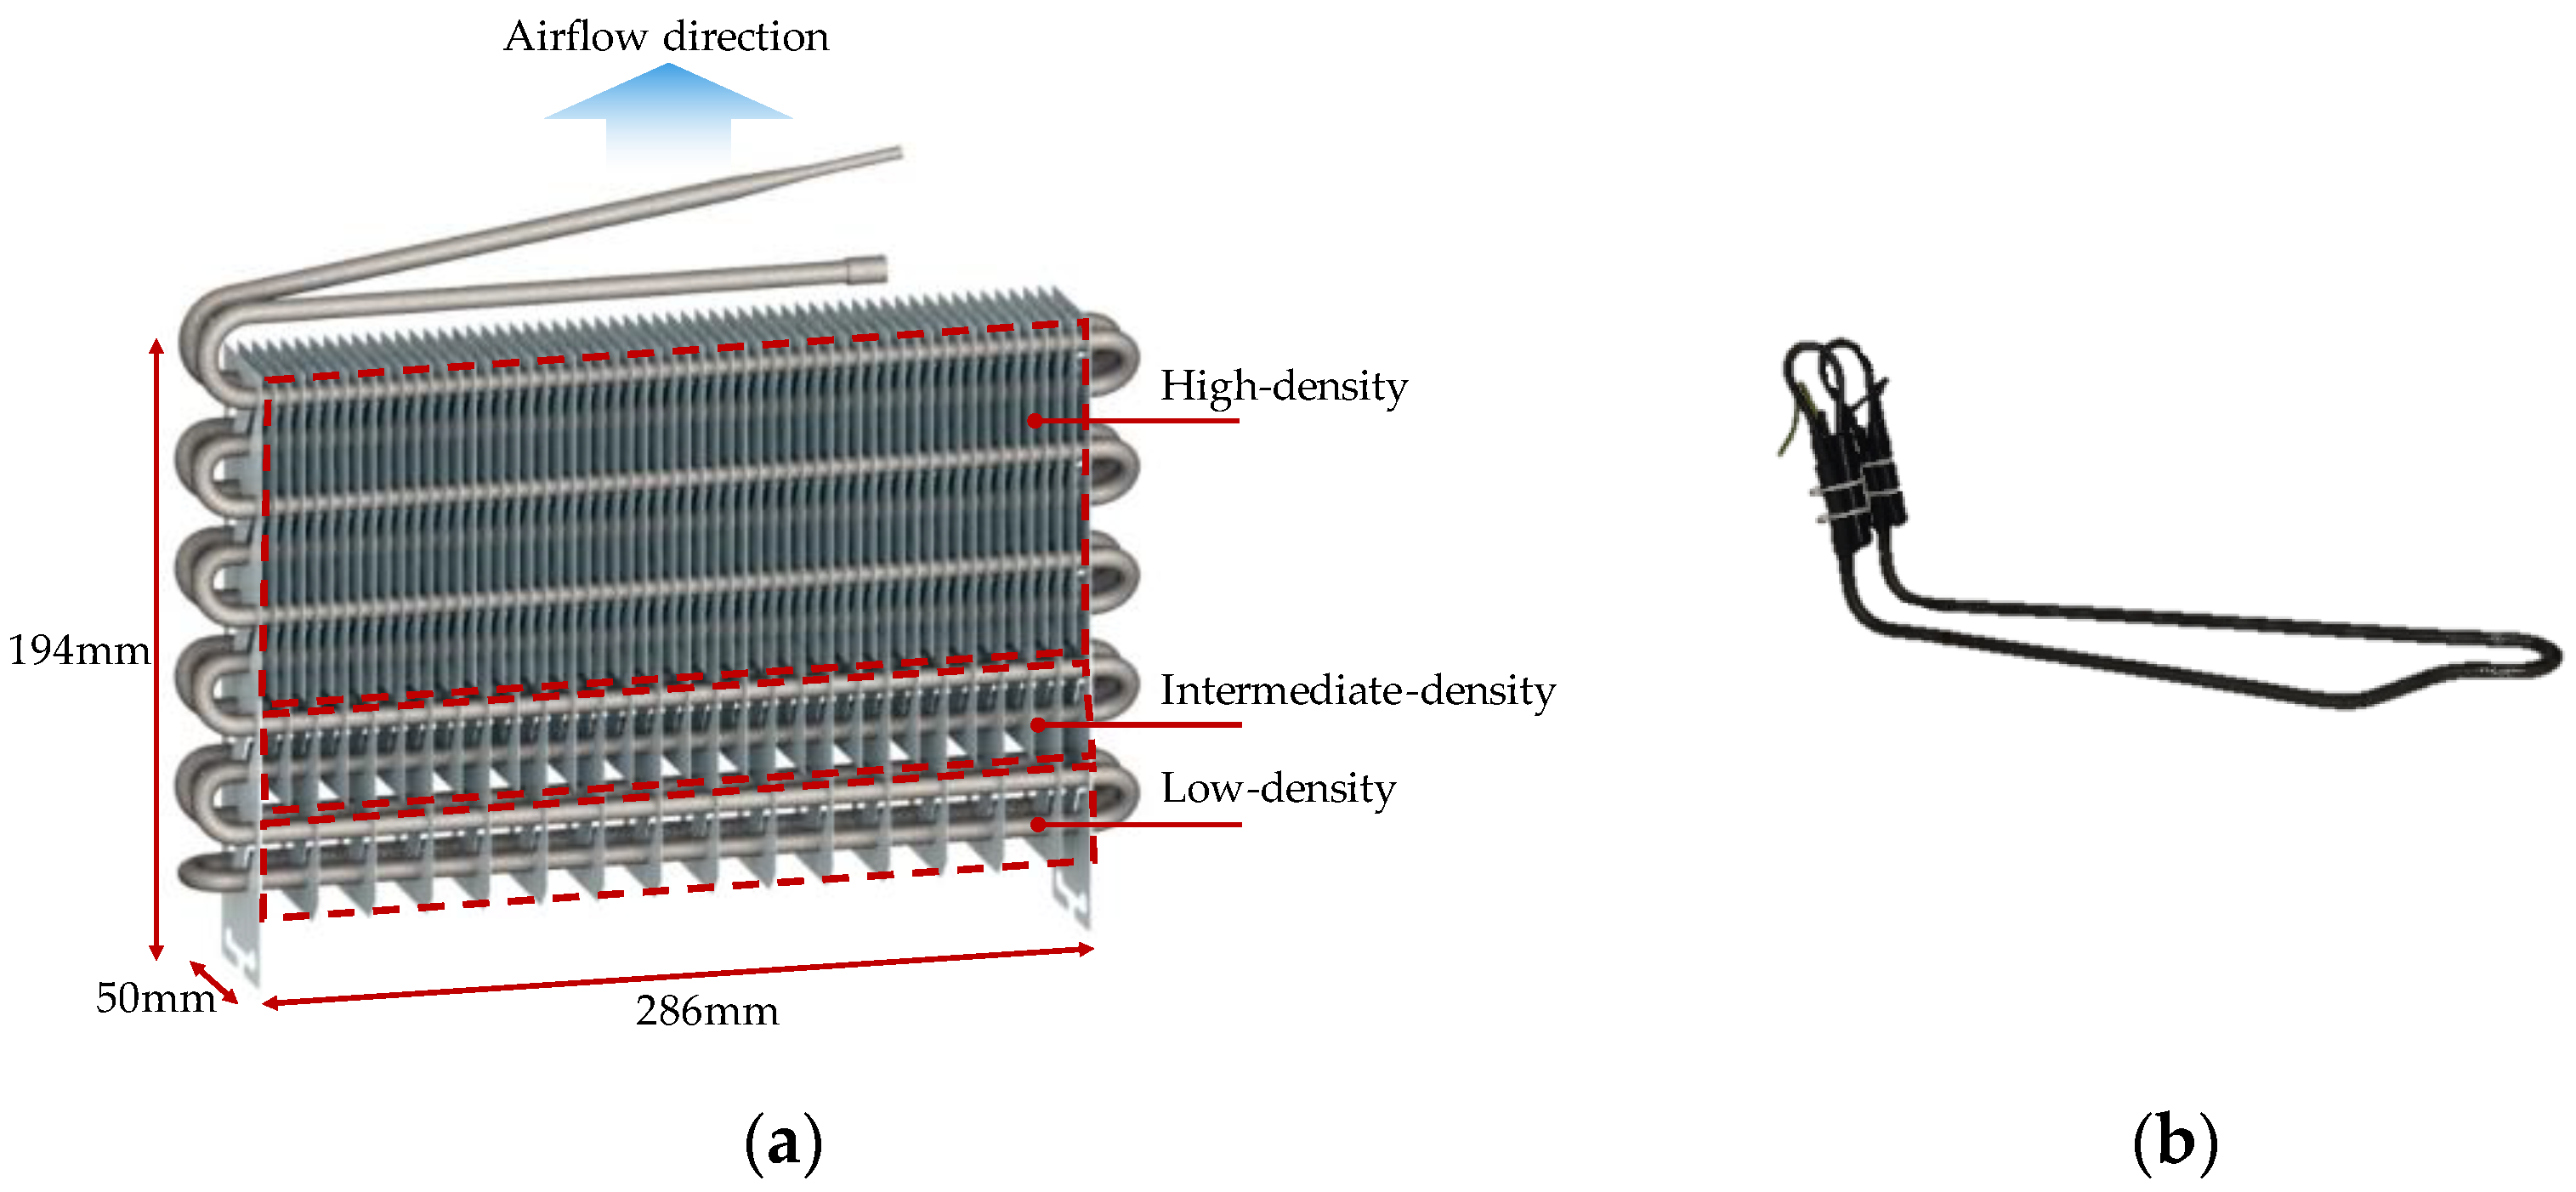
The evaporator under analysis is a ‘no-frost’ tube-fin aluminum evaporator with 10 × 2 tubes and three different fin densities: 210 fins/m in the high-density region, 105 fins/m in the intermediate density region and 52 fins/m in the low-density region. Figure 2a depicts the evaporator, along with its main dimensions, whereas Figure 2b shows the ‘calrod’ radiant defrost heater used in both test rigs.

2.1.1. Frost Formation Rig

The test rig was based upon a two-door ‘combi’ refrigerator, whose refrigeration system was replaced by an external refrigerating loop with a thermostatic bath that pumps chilled water–ethylene glycol solution (brine) to the evaporator, as depicted in Figure 3. The pump speed was regulated by means of a frequency inverter so that the flow rate led to a ~1 °C temperature difference between the evaporator inlet and outlet. This modification ensures a nearly uniform temperature distribution across the coil surface and eliminates the periodic transients typical of refrigerant dry-out present in the original cycle configuration.
For the sake of setting the psychrometric conditions inside both compartments, ultrasonic humidifiers were employed to emulate the routine of door openings—without introducing their inherently transient disturbances—whereas electric heaters were required because frost accumulation on the evaporator reduces heat transfer rate thus affecting the temperatures of both compartments. Accordingly, the rig was designed with excess cooling capacity, which is offset by the heat generated by the heaters, thereby enabling operation at constant compartment temperatures.
All control systems were implemented in a closed loop. For temperature regulation, feedback was provided by three type-T thermocouples (with ±0.2 °C uncertainty) in the fresh-food compartment and two in the frozen-food compartment (also known as the freezer). Humidity control relied on readings from two relative-humidity (RH) transducers (±0.9% uncertainty over the 0–90% range), one in each compartment. Additionally, a heater in the thermostatic bath maintained the solution temperature, with voltage control feedback by a thermocouple measuring the evaporator surface temperature. Altogether, five independent control systems were used, each one employing an independent PI controller.
The airflow was supplied to the compartments using the refrigerator original axial fan and fluid-dynamic circuit. Through wind-tunnel testing an operating airflow of 49 m3/h was measured, with only 10% directed to the fresh-food compartment. The airflow from this compartment reaches the evaporator inlet at the middle region, whereas the freezer airflow is returned by the sides, a common arrangement in such applications.
The pressure difference on the air side of the evaporator was measured using a differential pressure transducer with a full-scale range of 62.5 Pa and an accuracy of 0.16 Pa. This measurement was obtained through the difference between the average of two pressure taps—one in each compartment—and a tap at the evaporator outlet.
Experiments were conducted with evaporator surface temperatures of −25 °C and −15 °C, fresh-food compartment relative humidities of 40%, 65%, and 90%, and freezer humidities of 75% and 85%. The fresh-food compartment was maintained at 4 °C in all tests, while the freezer was kept at −18 °C for the −25 °C evaporator surface tests, and −8 °C for the −15 °C tests. Table 2 presents the experiments matrix, where the inlet air absolute humidity was determined via mass conservation at the evaporator inlet, accounting for the flow-rate proportions of each compartment, whereas the supersaturation degree was calculated from:
ω s u p   =   ω a     ω s a t , T s

2.1.2. Defrost Rig

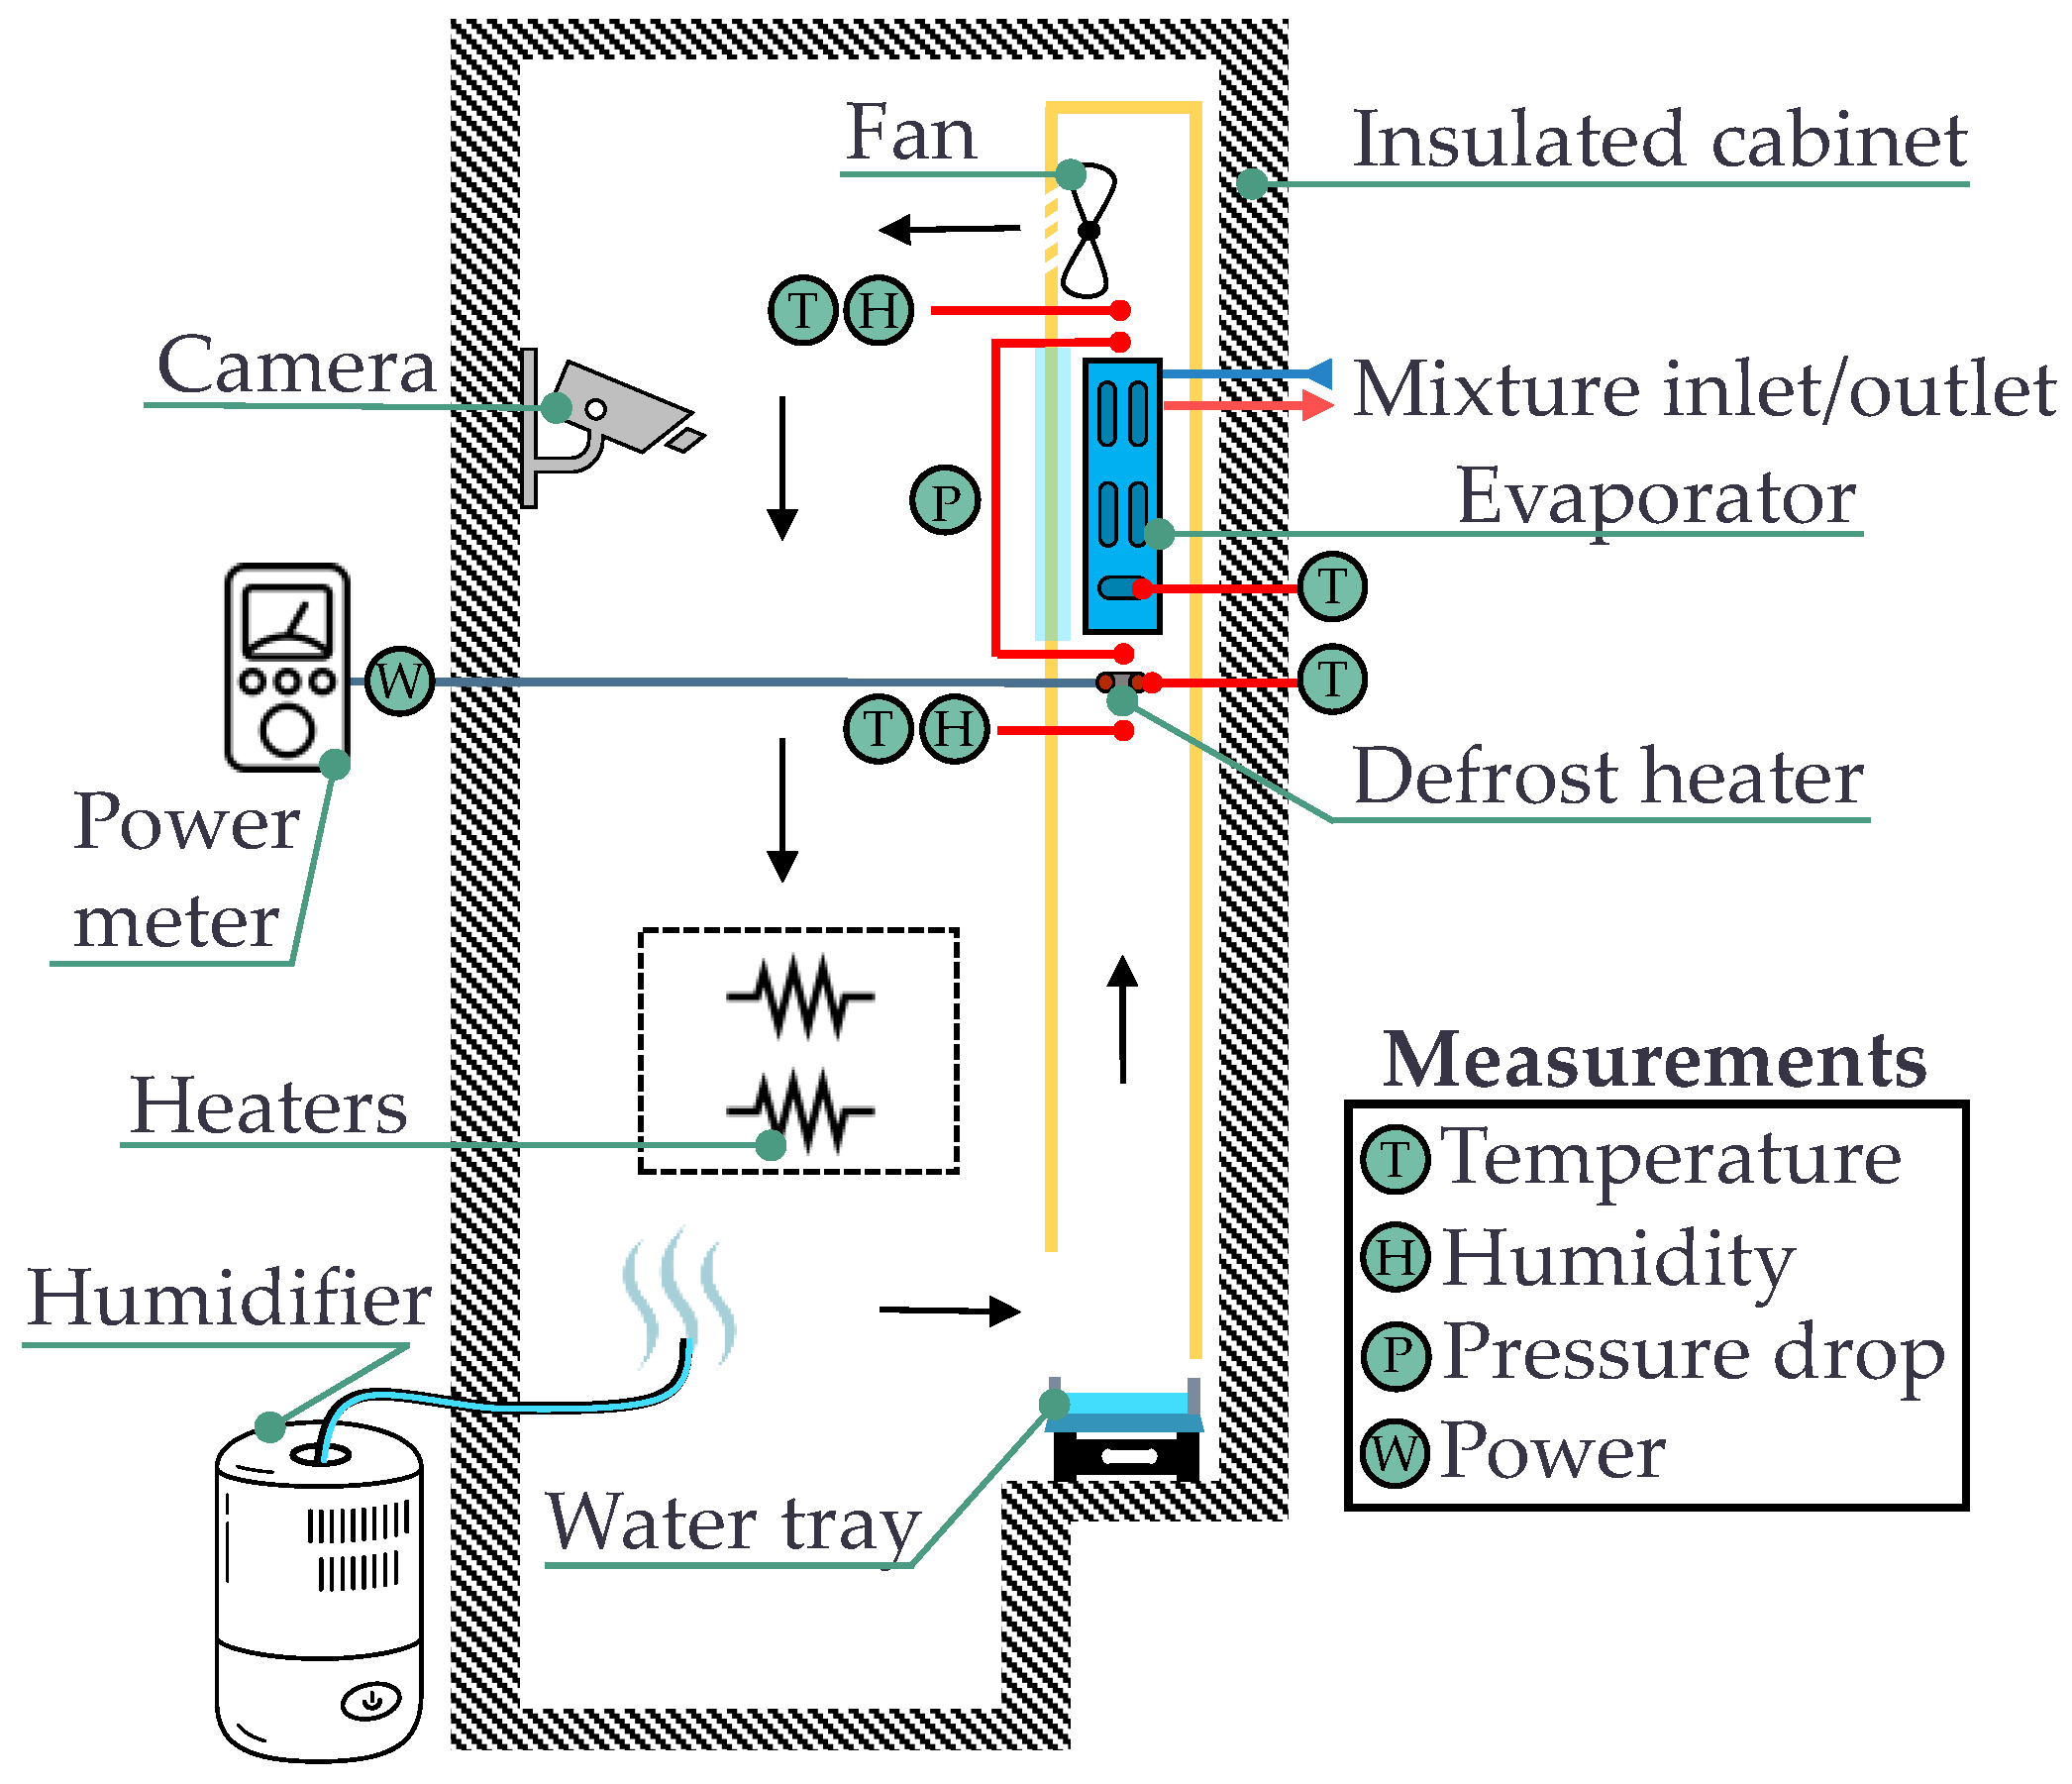
In contrast to the frost formation rig, the defrost rig only took advantage of the thermally insulated walls of an all-freezer cabinet to house a vertical open-loop wind tunnel with a test section capable of providing a uniform airflow distribution over the evaporator, thus avoiding effects of heterogeneous frost distribution. Furthermore, the test section was fitted with a 40 mm thick triple-glass window, enabling a full visualization of frost deposition and defrost evolution over the evaporator surface using a camera positioned in the internal part of the door, as illustrated in Figure 4.
The modifications on the refrigerant circuit and the control systems for temperature and humidity mirrored those implemented for the frost formation rig, with water–ethylene glycol solution being the coolant in the evaporator. Three type-T thermocouples (±0.2 °C) placed at the evaporator inlet provided the air inlet temperature ( T a ), one relative humidity probe (±0.8% uncertainty over 0–100% range) measured the air inlet relative humidity ( ϕ a ) and the same model of differential pressure transducer was employed to measure the pressure drop over the evaporator. The heater surface temperature ( T s ) was also measured at 7 evenly distributed points at the upper region (facing the evaporator) using K-Type thermocouples (±0.2 °C). The 125 W heater power consumption was measured by a digital power meter (±0.1% full scale), which also integrated the power over the defrost time to provide the total energy consumed. All tests were performed with the very same evaporator used on the frost formation rig.
The energy distribution over the evaporator was calculated based on the thermal capacities of each component, namely frost (sensible and latent), aluminum and brine. The coil temperature was measured at the bottom (4 thermocouples), middle (4) and top (2) regions, since each region has a different fin density. The mass was measured for each region and the total heat transferred to the coil was the sum for all regions (506 g total mass). A sensible heat for the brine was calculated with the coolant mass contained inside the tubes (211 g), while the sensible and latent heat of the frost were calculated based on the frost mass obtained from each experiment. The energy that enters the cabinet through the walls (thermal load) was calculated based on the temperature difference between the cabinet and the ambient, since the cabinet UA value was previously determined by means of the so-called reverse heat loss method and found to be equal to 1.58 W/K.
Three heater control strategies were evaluated: Step, where the heater operates at its nominal power over the entire defrost period; Ramp, where the power decreases linearly; and PWM (Pulse Width Modulation), where the heater turns on and off periodically. The relative humidity was controlled at 90% in all experiments, although two different surface temperatures were employed, as shown in Table 3, resulting in different frost morphologies with different physical properties. Defrost efficiency uncertainty calculations are summarized in Appendix A.

2.2. Procedure

The standard test procedure followed three stages: pulldown, frost formation, and defrost. During the initial pulldown stage, the refrigerator doors are closed, and the hydraulic pump is activated so that the coolant circulates through the evaporator, lowering the compartment temperatures. After the air and surface temperatures have been stable at the setpoint for at least 15 min, the humidifiers are activated and controlled, initiating the frost deposition over the evaporator surface. As frost accumulates, the air-side pressure drop across the evaporator increases, and the airflow rate decreases. Therefore, a pressure drop is a natural indicator not only to initiate defrost but also to terminate the frosting stage so that once reaching the stopping criterion the evaporator is substantially blocked and has near-zero excess cooling capacity, making further compartment control unfeasible. For the frost formation rig, it was observed that such a condition was obtained when the measurements exceeded 23 Pa. As the defrost rig had a different fluid-dynamic circuitry and fan, the stopping criterion was 36 Pa.
Upon meeting the termination criterion for the frosting stage, the brine circulation is interrupted, the fan and humidifiers are turned off and defrost is initiated. In the case of the frost formation rig, the original radiant heater placed right below the heat exchanger was operated at its rated power of 125 W until the evaporator top surface reached 10 °C. For the defrost rig, in turn, the heater was controlled according to the desired strategy until the top portion of the heat exchanger reached 0 °C. The difference between the criteria lies in the fact that the frost formation rig simulated a common defrost stopping criteria for household appliances, where an above 0 °C temperature is used to ensure complete defrost, while the defrost rig focused on interrupting the defrost as soon as all the frost was melted, which was visually verified.
In the frost formation rig, the defrost water tray is outside the cabinet, then at the end of the experiments, after a 10-min period, the water collected was measured using a digital scale with 0.01 g accuracy. On the other hand, in the defrost rig the tray is located below the test section, so that the cabinet remains closed until the internal temperature reaches around 7 °C before weighing the water mass. This procedure was established to collect all the water contained in the evaporator during the defrost.

2.3. Image Acquisition

To visualize frost growth on and defrosting of the evaporator, a 40 mm triple-glass window was installed in the wind-tunnel structure in the defrost rig. A Canon EOS T100 digital camera was mounted on the cabinet door, with its focus, framing, and exposure time calibrated through validation tests and kept constant across all experiments. The images were acquired using a homemade Python 3.11 code based on OpenCV package, capturing photos at intervals of 5 s during frost formation and 1 s during defrosting, and then compiling them into a video.
The software also allows for image cropping and binarization, enabling the real-time estimation of the evaporator local fin passage fraction ( σ f i n ), which is defined as the ratio of the air free flow passage area (reduced by frost and fins) to the total frontal (cross-sectional) area of the evaporator, differing from the conventional free flow passage ratio ( σ ), which also considers tube obstructions. Since σ f i n and σ evolve similarly over time due to frost accretion, σ f i n provides a reliable indicator of evaporator blockage evolution.
The captured images were used to visually assess the frost formation pattern, uniformity and the defrost behaviour. They were treated using Otsu’s thresholding algorithm [39] to obtain quantitative data regarding evaporator blockage through the binarization of the captured images. The process involves selecting image regions optimized for binarization, prioritizing sections that avoid parallax errors and excluding tubes. These cropped areas undergo the binarization procedure that classifies pixels as black ( P B ), representing the air passage, or white ( P W ), indicating the area blocked by frost or fins, according to an established threshold [40]. The ratio of black pixels to total pixels in a cropped area represents the local fin passage fraction, yielding
σ f i n = A p a s s a g e A t o t a l = A p a s s a g e A p a s s a g e + A f i n + A f r o s t P B P B + P W
which can be extrapolated to estimate the global fin passage fraction for different fin densities.
Since a large portion of the evaporator could be visualized in real time, preliminary tests were performed to correlate the melting of the frost with the evaporator surface temperature, therefore establishing a stopping criterion for defrosting. Additionally, it was possible to visually confirm that the frost deposition pattern was homogeneous throughout the evaporator. Given the homogeneous frost deposition pattern, this method provides an effective means to monitor evaporator blockage dynamically.

3. Results and Discussion

3.1. Frost Formation Results

Table 4 summarizes the results obtained for frost formation tests described in Table 2. A factorial regression was conducted to better understand the combined effects of surface temperature and compartment humidity on the accumulated frost mass ( m f ). To this end, all independent variables were expressed in the following dimensionless form:
X * = 2 X X m i n X m a x X m i n 1
where X is a generic variable, X m a x and X m i n are its maximum and minimum values, respectively, and X * is the dimensionless normalization, ranging from −1 to +1. The experimental data were fitted to the following expression:
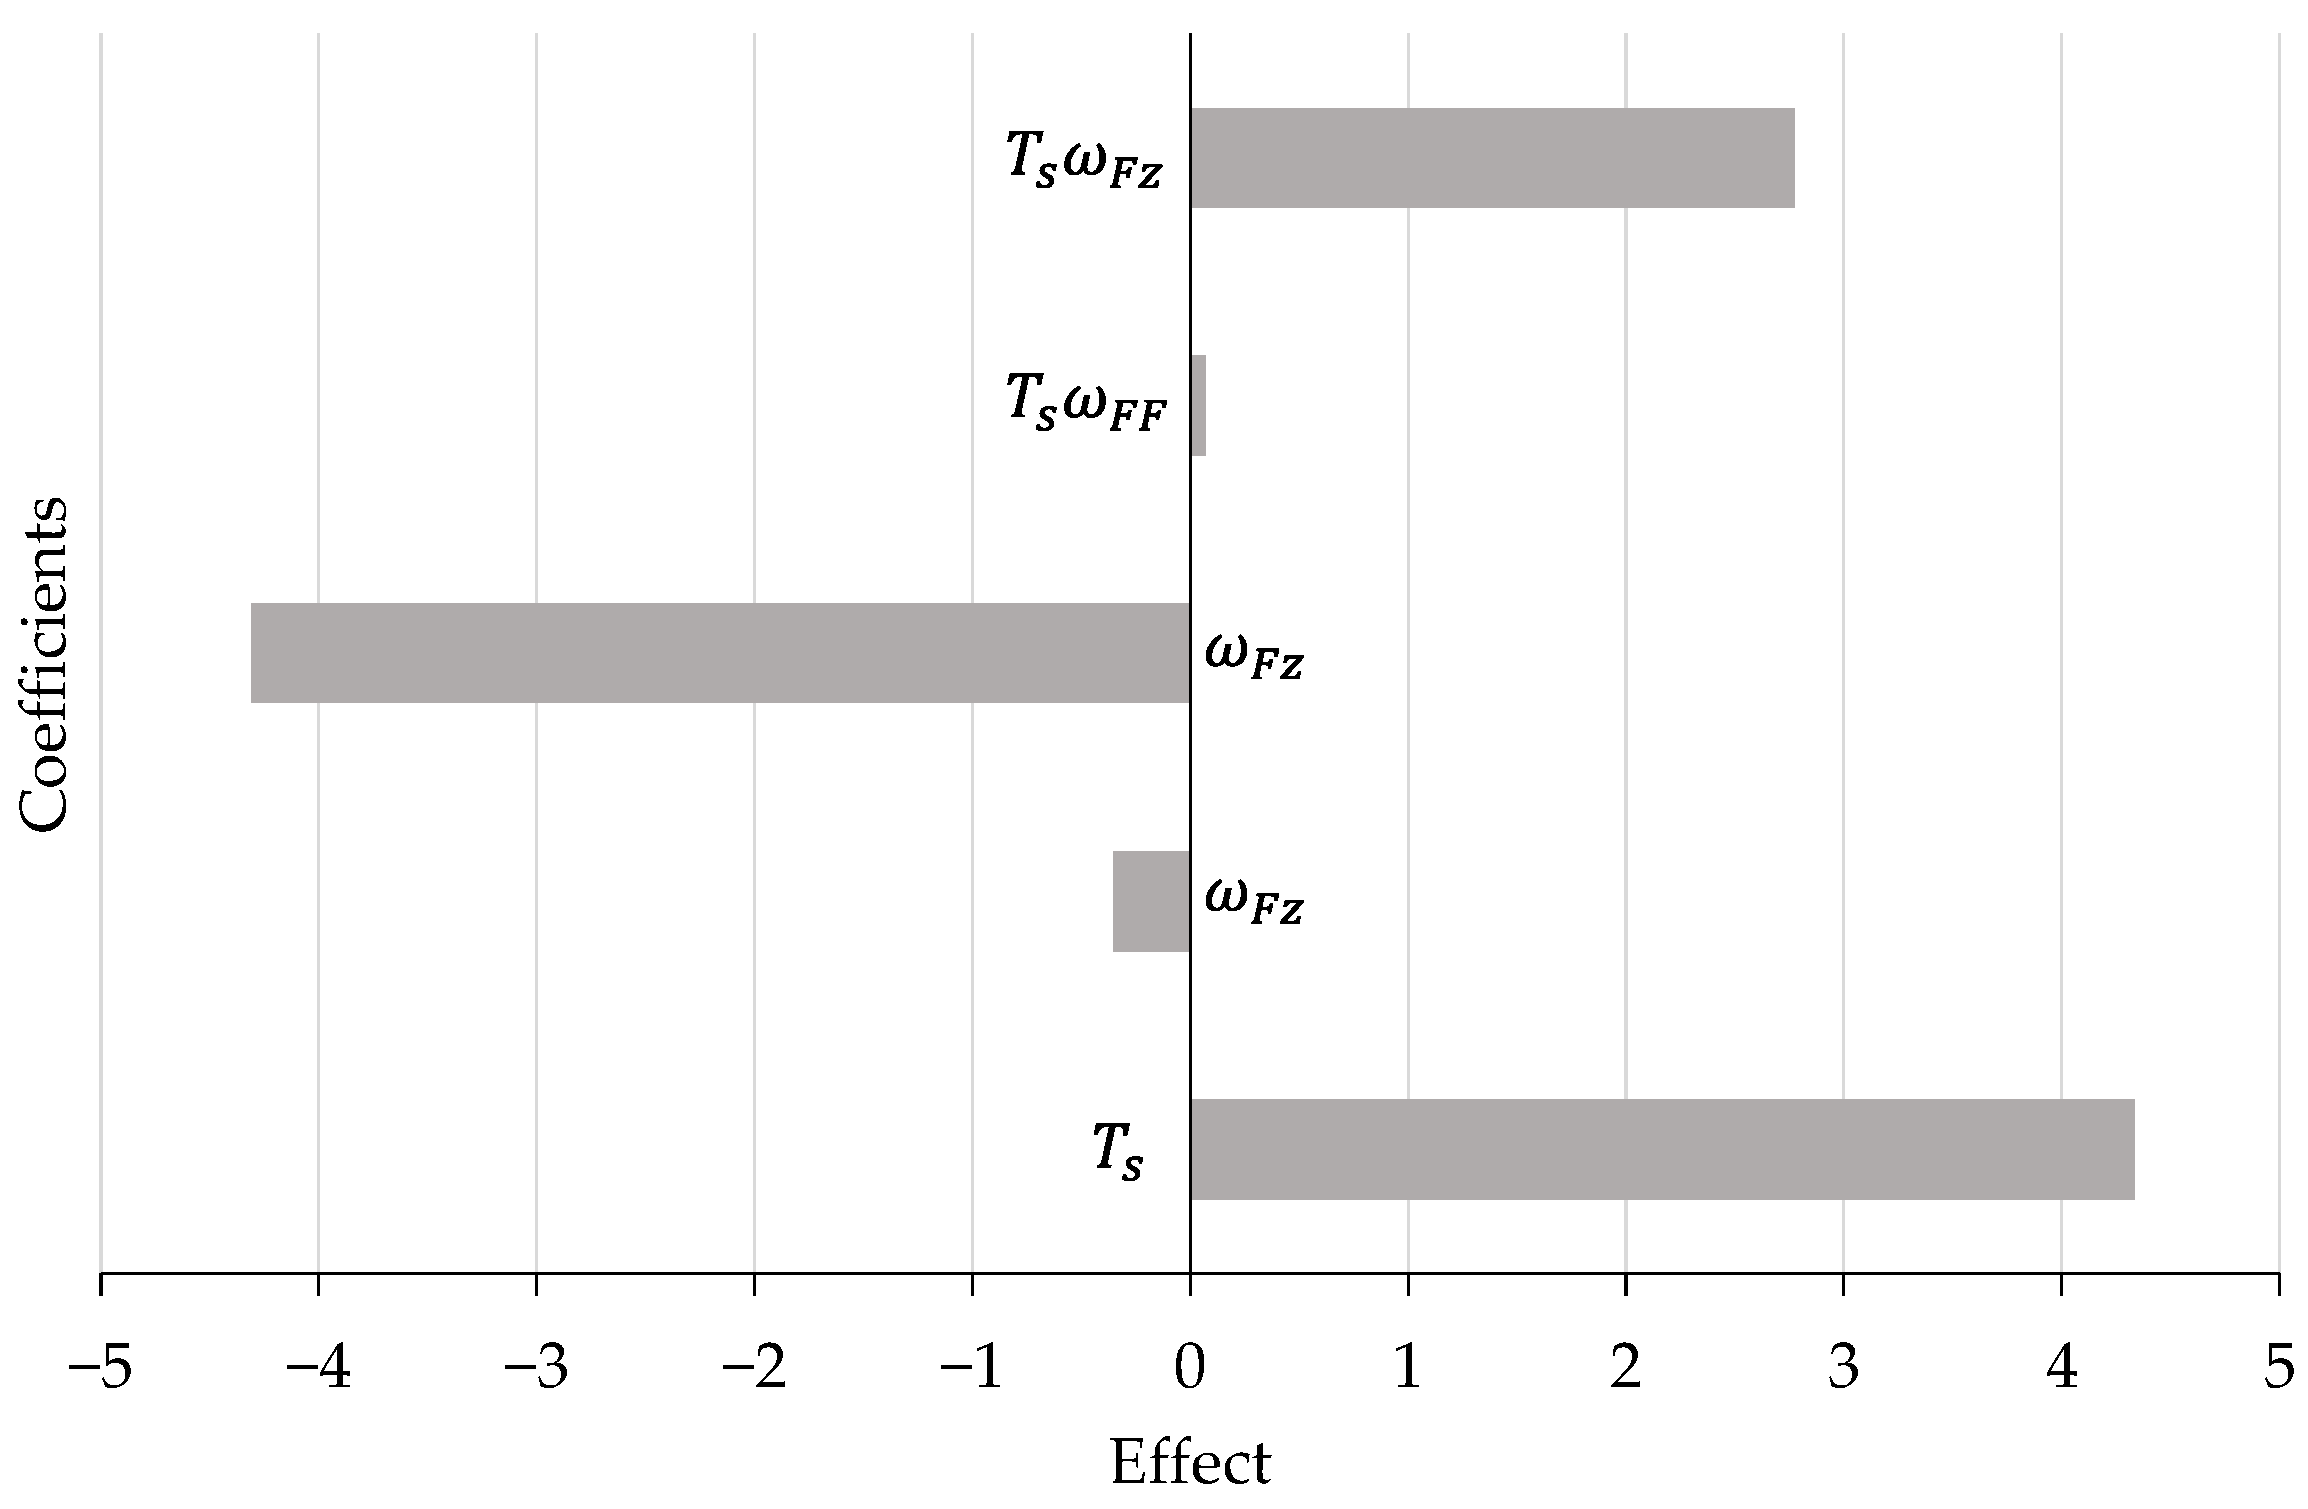
m f * =   a 0   +   a 1 T s *   +   a 2 ω F F *   +   a 3 ω F z *    +   a 4 ω F F * T s *   +   a 5 ω F z *   T s *
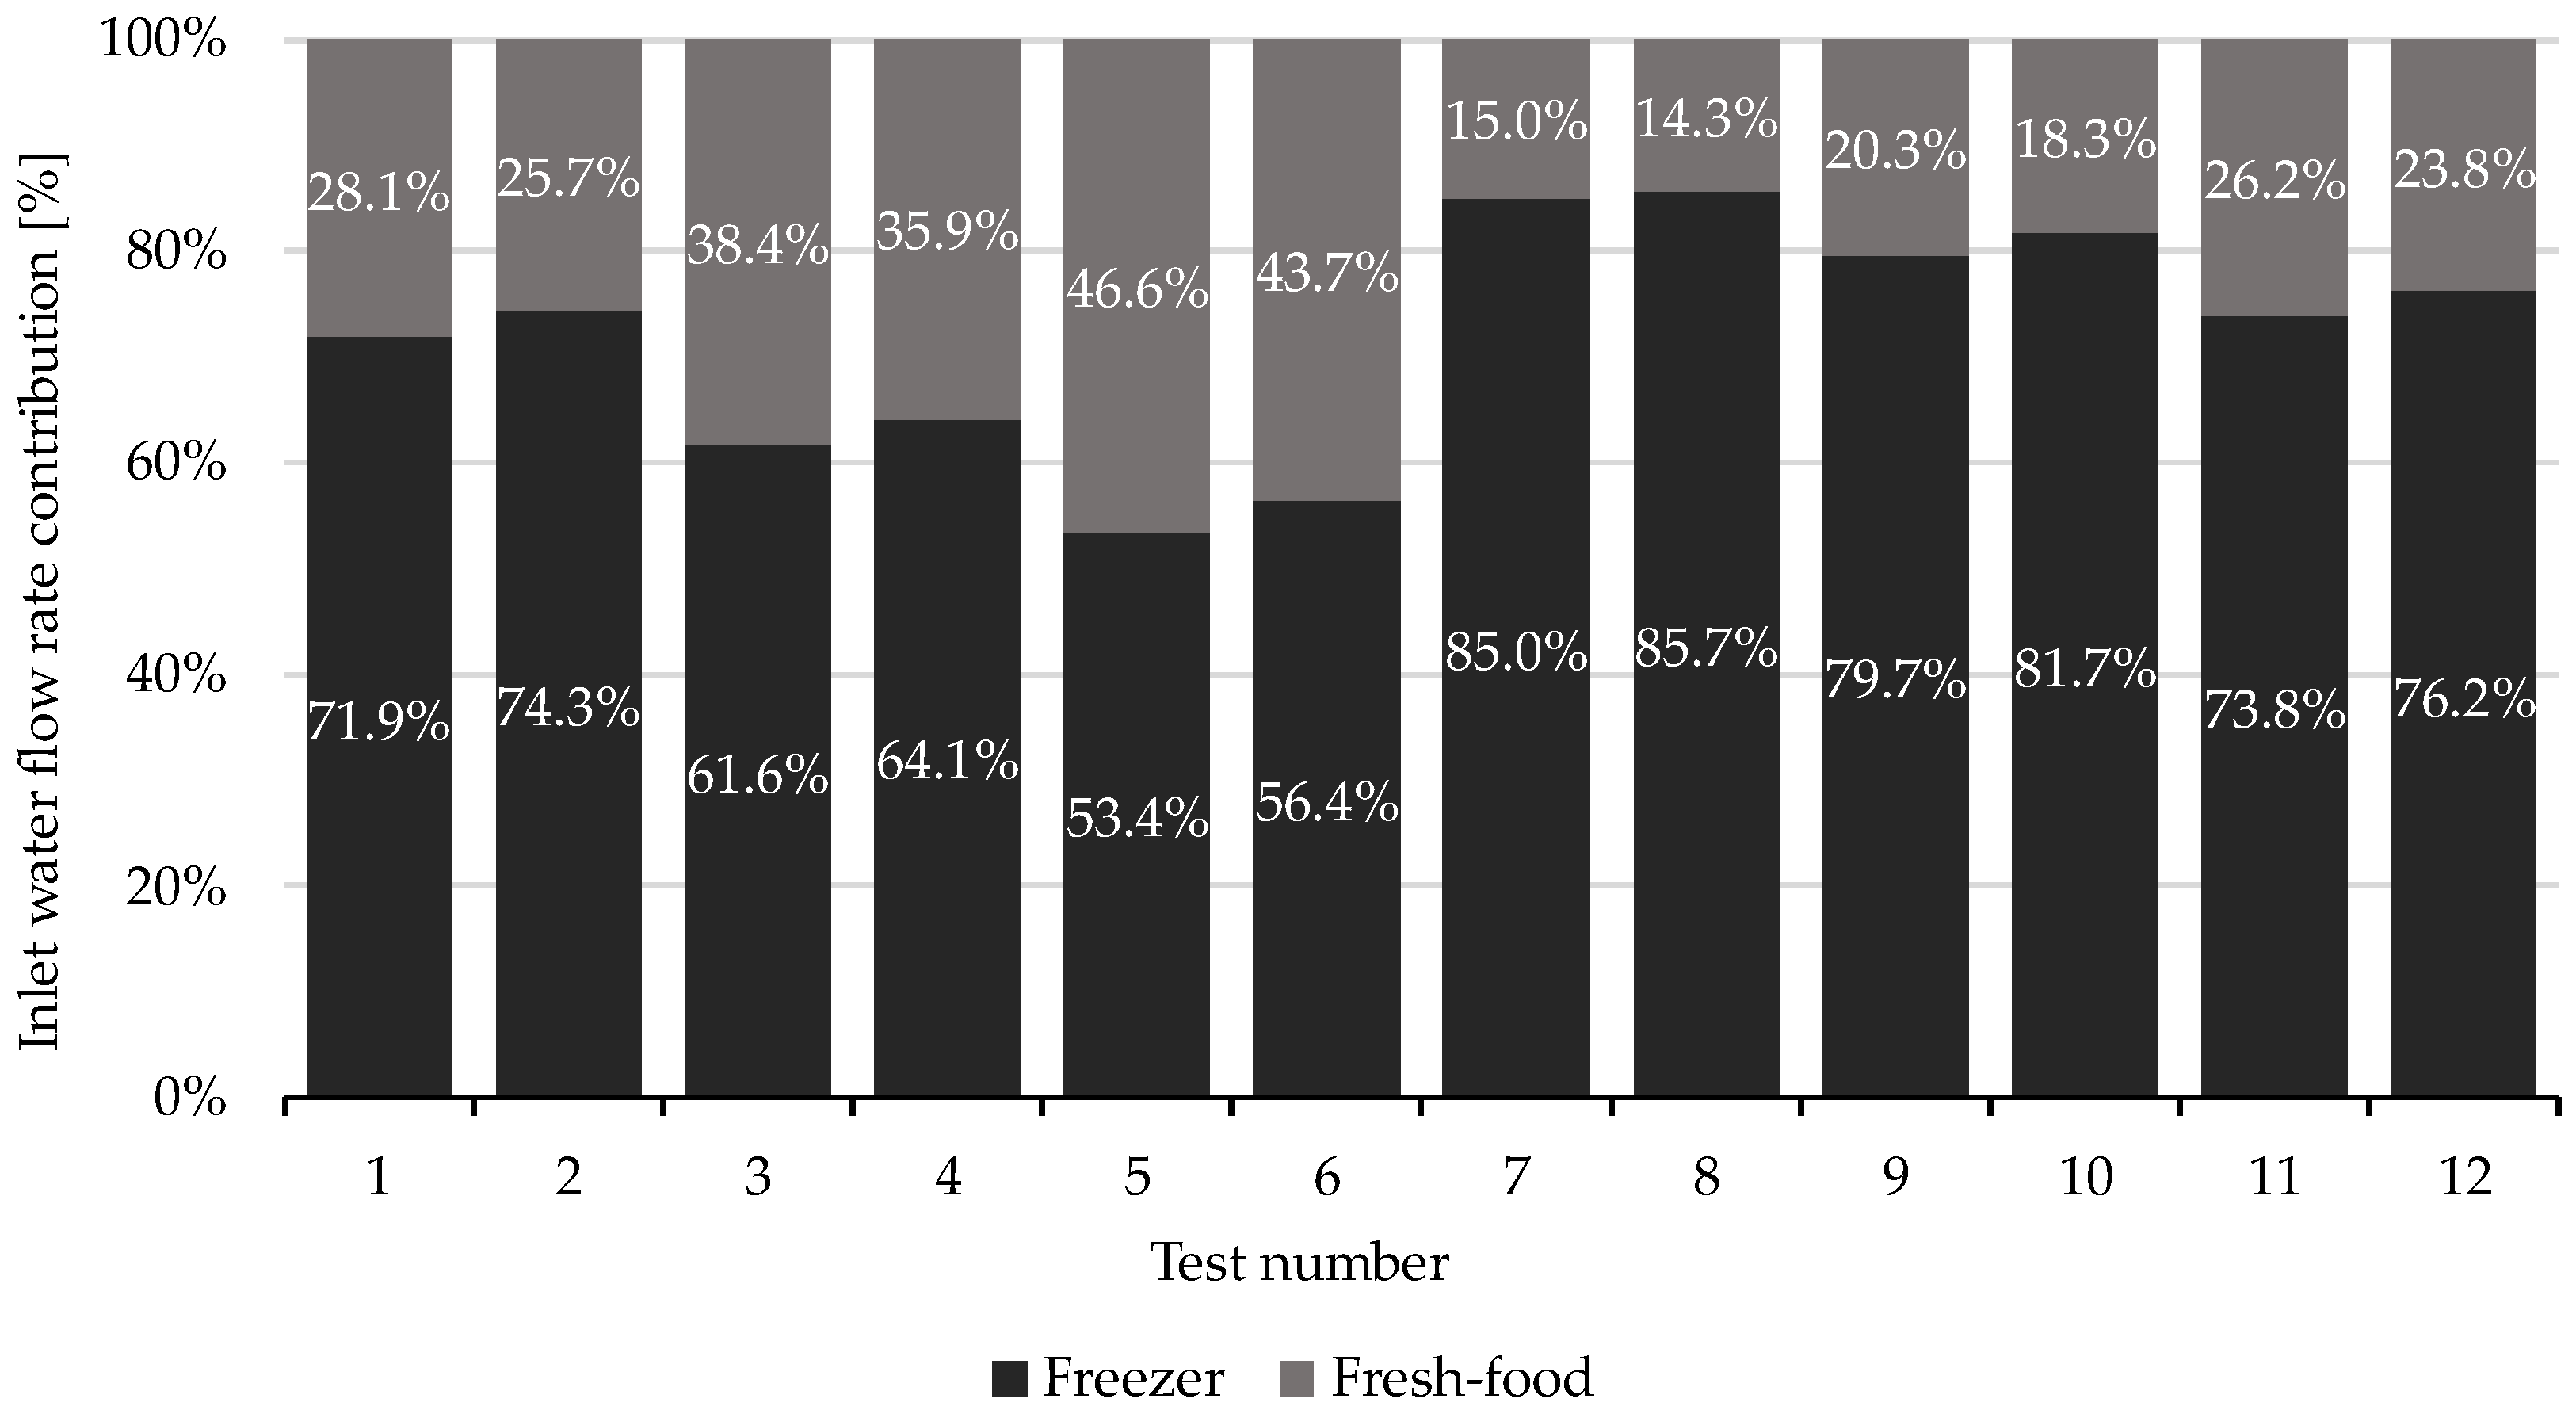
where the coefficients values are compared in Figure 5, indicating that the surface temperature and freezer humidity are the most influential factors affecting the accumulated frost mass. While the former has a direct effect on frost morphology [41], the influence of the latter is attributed to the higher airflow rate directed towards this compartment, and consequently, a larger water flow rate reaching the evaporator, even though the absolute humidity is naturally lower in this compartment, as illustrated in Figure 6.
As a result, the freezer contributes more significantly to the degree of supersaturation. The cold airstream of this compartment also tends to form frost layers at a higher growth rate, accelerating the test termination thus resulting in a lower mass accumulation. It is important to note that this outcome depends upon the product design, as variations in the fluid-dynamic circuit configuration lead to different airflow distributions between compartments.
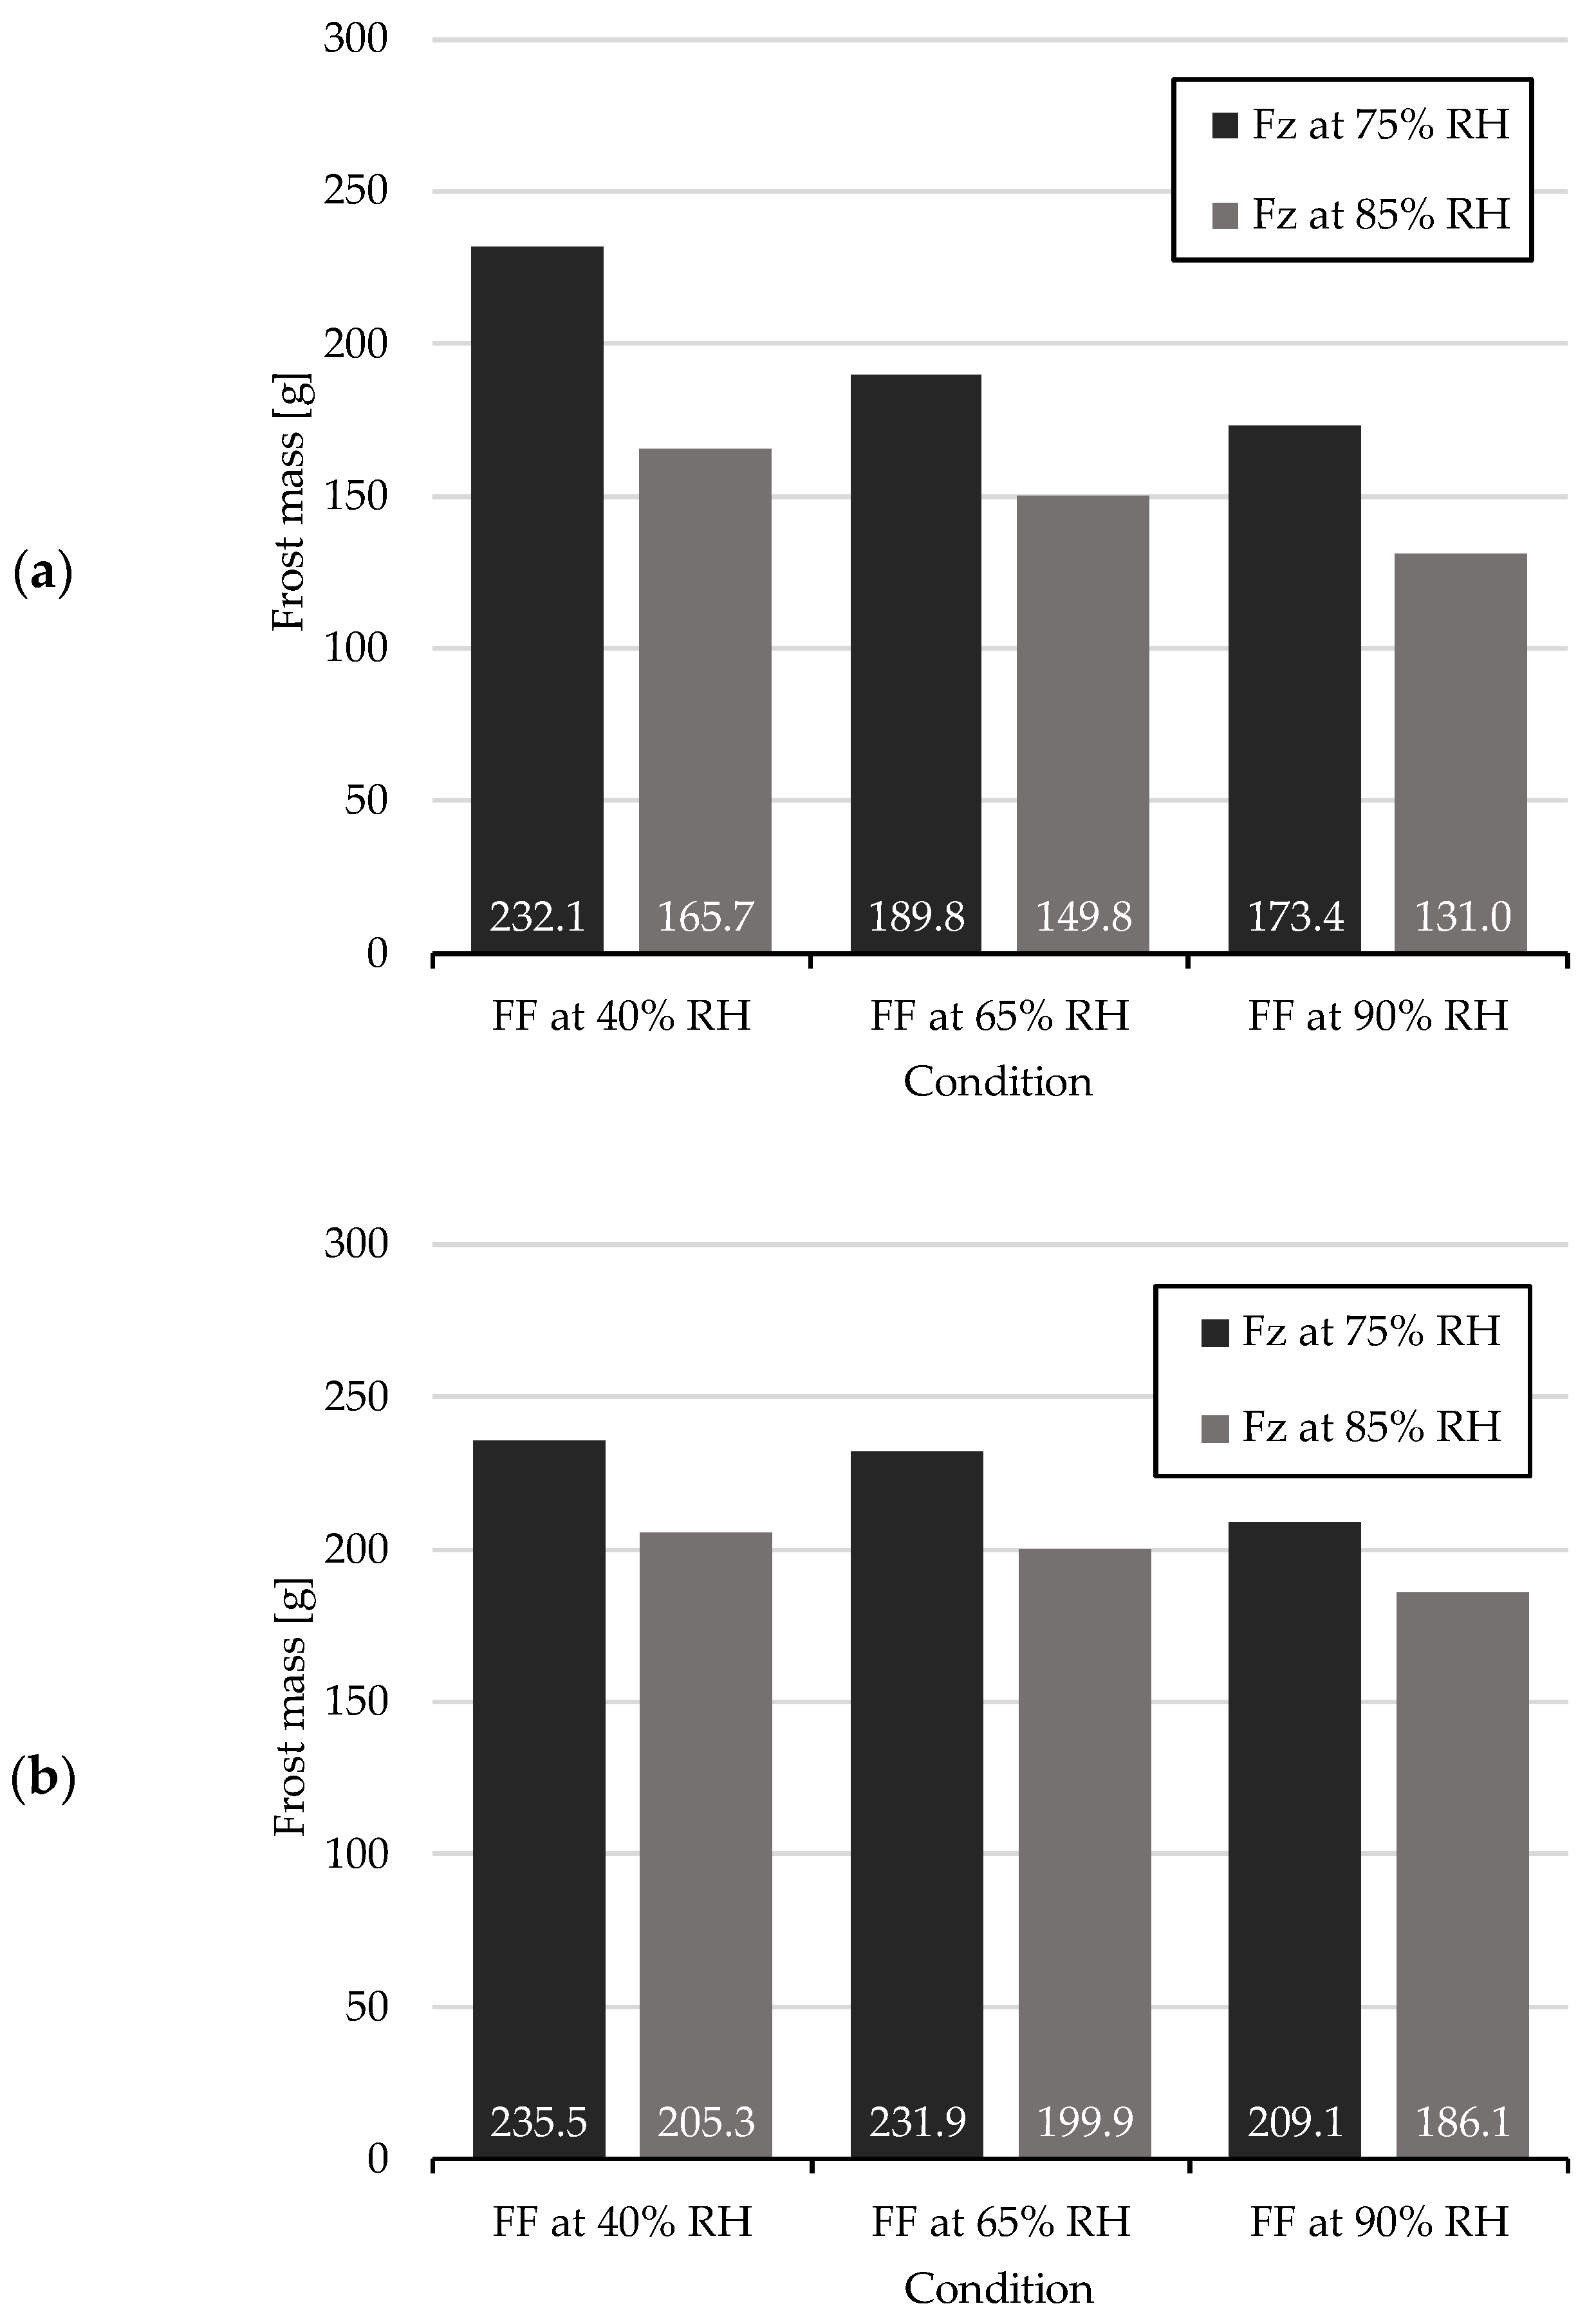
Figure 7 reveals a trend of decreasing accumulated frost mass with increasing humidity in both compartments. Since the frost formation stage is terminated by an air-side pressure drop criterion, it can be inferred that the total volume of frost remains approximately constant at the end of each test. Accordingly, increasing compartment humidity leads to a higher frost growth rate and lower frost density. This behaviour is corroborated by the results from [42], which also considers the interaction between fan performance curves and the rising air-side pressure drop.
In addition, the comparisons in Figure 7 indicate a general increase in frost mass across all test conditions as the surface temperature rises from −25 °C to −15 °C, once again implying an increase in frost density. This phenomenon can be attributed to the abrupt transition between different frost growth regimes depending on the surface temperature, as mapped in pioneering studies such as [41,43]. These transitions result in distinct frost morphologies, each associated with different thermophysical properties. As described in the correlations proposed by [44,45], increased frost density leads to higher thermal conductivity, thereby enhancing heat diffusion through the frost layer.

3.2. Defrost Results

To ensure a fair comparison of defrost efficiency among the different strategies, it was essential to maintain consistent frost mass and thermophysical properties across all tests. The frosting data in Table 5, now obtained by means of the defrost rig, shows the average psychrometric conditions under which the frost was formed for the six tests performed according to Table 3. It is worth noting that the temperature and humidity data, as well as the total frost mass, were very similar between tests in the same condition. Therefore, any observed differences in defrost efficiency within the same test condition (Condition A—Tests #1, #2 and #3; Condition B—Tests #4, #5 and #6) can be attributed to the control strategy applied, rather than to variations in frost characteristics.
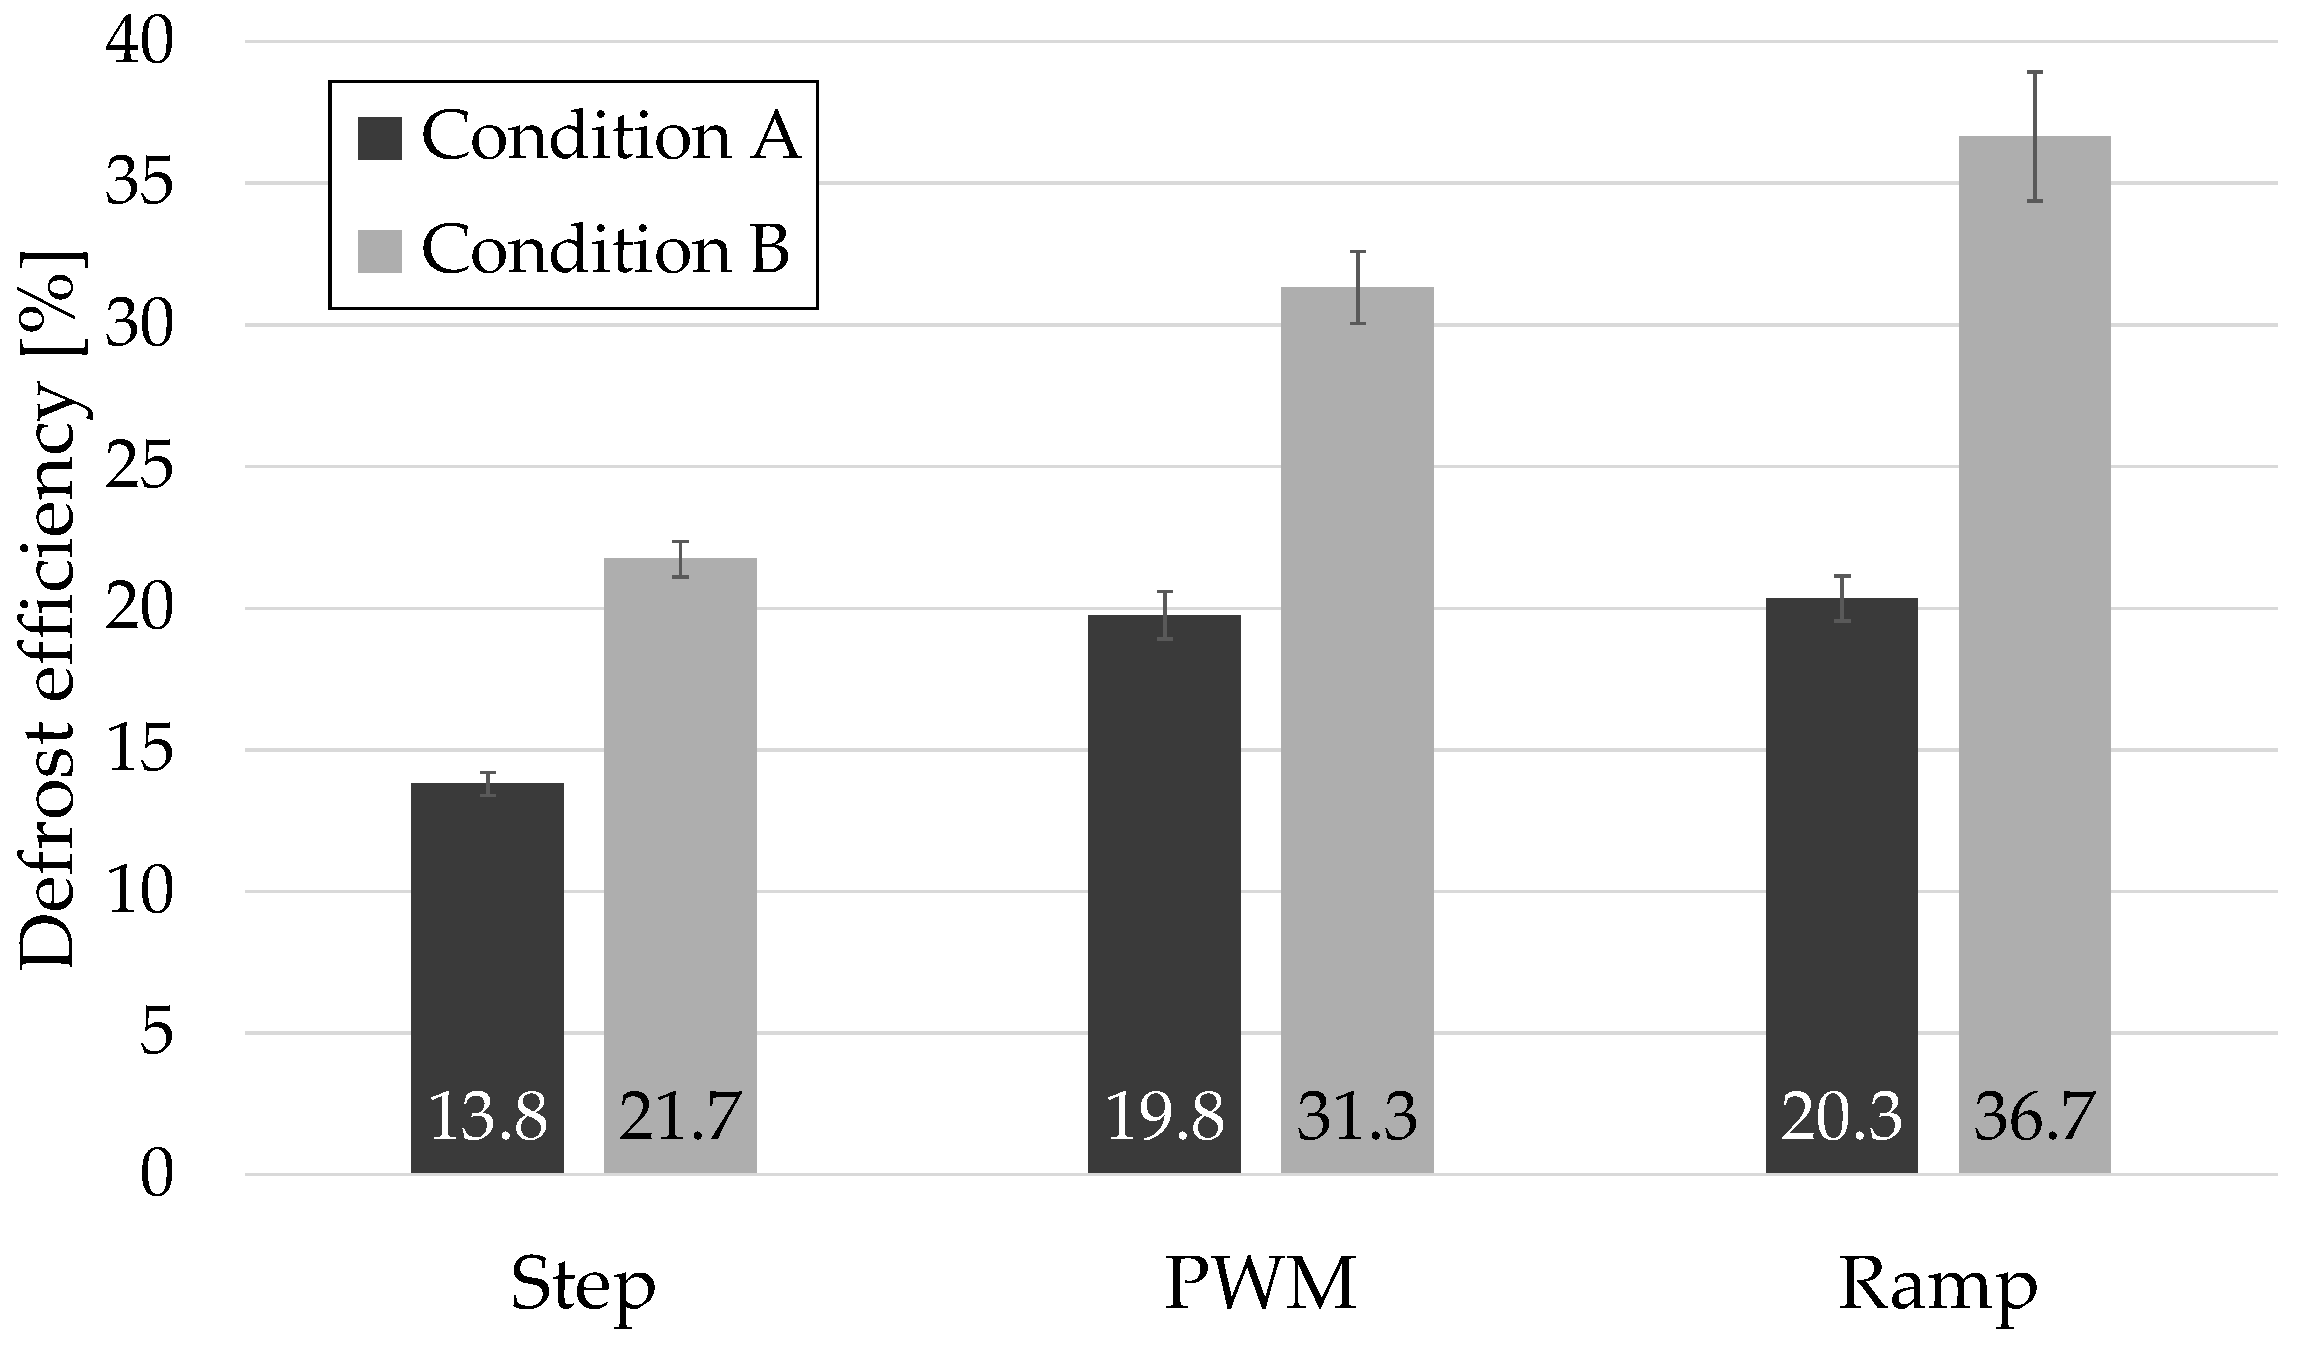
Figure 8 summarizes the defrost efficiency for each test. As can be seen, the figures obtained under condition B were approximately 50% higher than those observed in condition A, regardless of the control strategy. This highlights the significant influence of higher frost density and mass at the warmer condition, emphasizing the general preference for operating at higher temperatures to reduce frost accumulation. Although relative humidity was not varied in these tests, it is expected that lower humidity levels would also promote denser frost formation (as seen in Section 3.1), potentially enhancing defrost efficiency. Among the strategies, the Ramp consistently delivered the highest efficiencies, reaching a maximum of 36.7% under condition B—a 69% improvement compared to the Step in the same condition. Under condition A, the improvement was 48%. The PWM ranked second, with efficiency gains of 44% in condition B and 43% in condition A relative to the Step, also representing a significant enhancement in energy utilization.
Also in Table 5, it is noted that the heater surface maximum temperature ( T h , m a x ) is also dependent on the heater control strategy, with Ramp and PWM presenting a ~30 °C and ~60 °C reduction in comparison with the Step. Since the heater surface temperature must follow safety standards, a reduction in its value represents an additional gain from the Ramp and PWM strategies.
While defrost efficiency provides a useful indication of the energy introduced into the refrigerated compartment by the defrost heater—energy that the refrigeration system must later remove—it does not explicitly account for defrost duration. In fact, if no external power were supplied and defrost occurred naturally by raising the entire cabinet temperature above freezing, the efficiency calculated by Equation (1) would theoretically tend toward infinity. Additionally, heat infiltration through the cabinet structure increases as internal temperatures decrease, adding another factor in selecting the optimal defrost strategy.
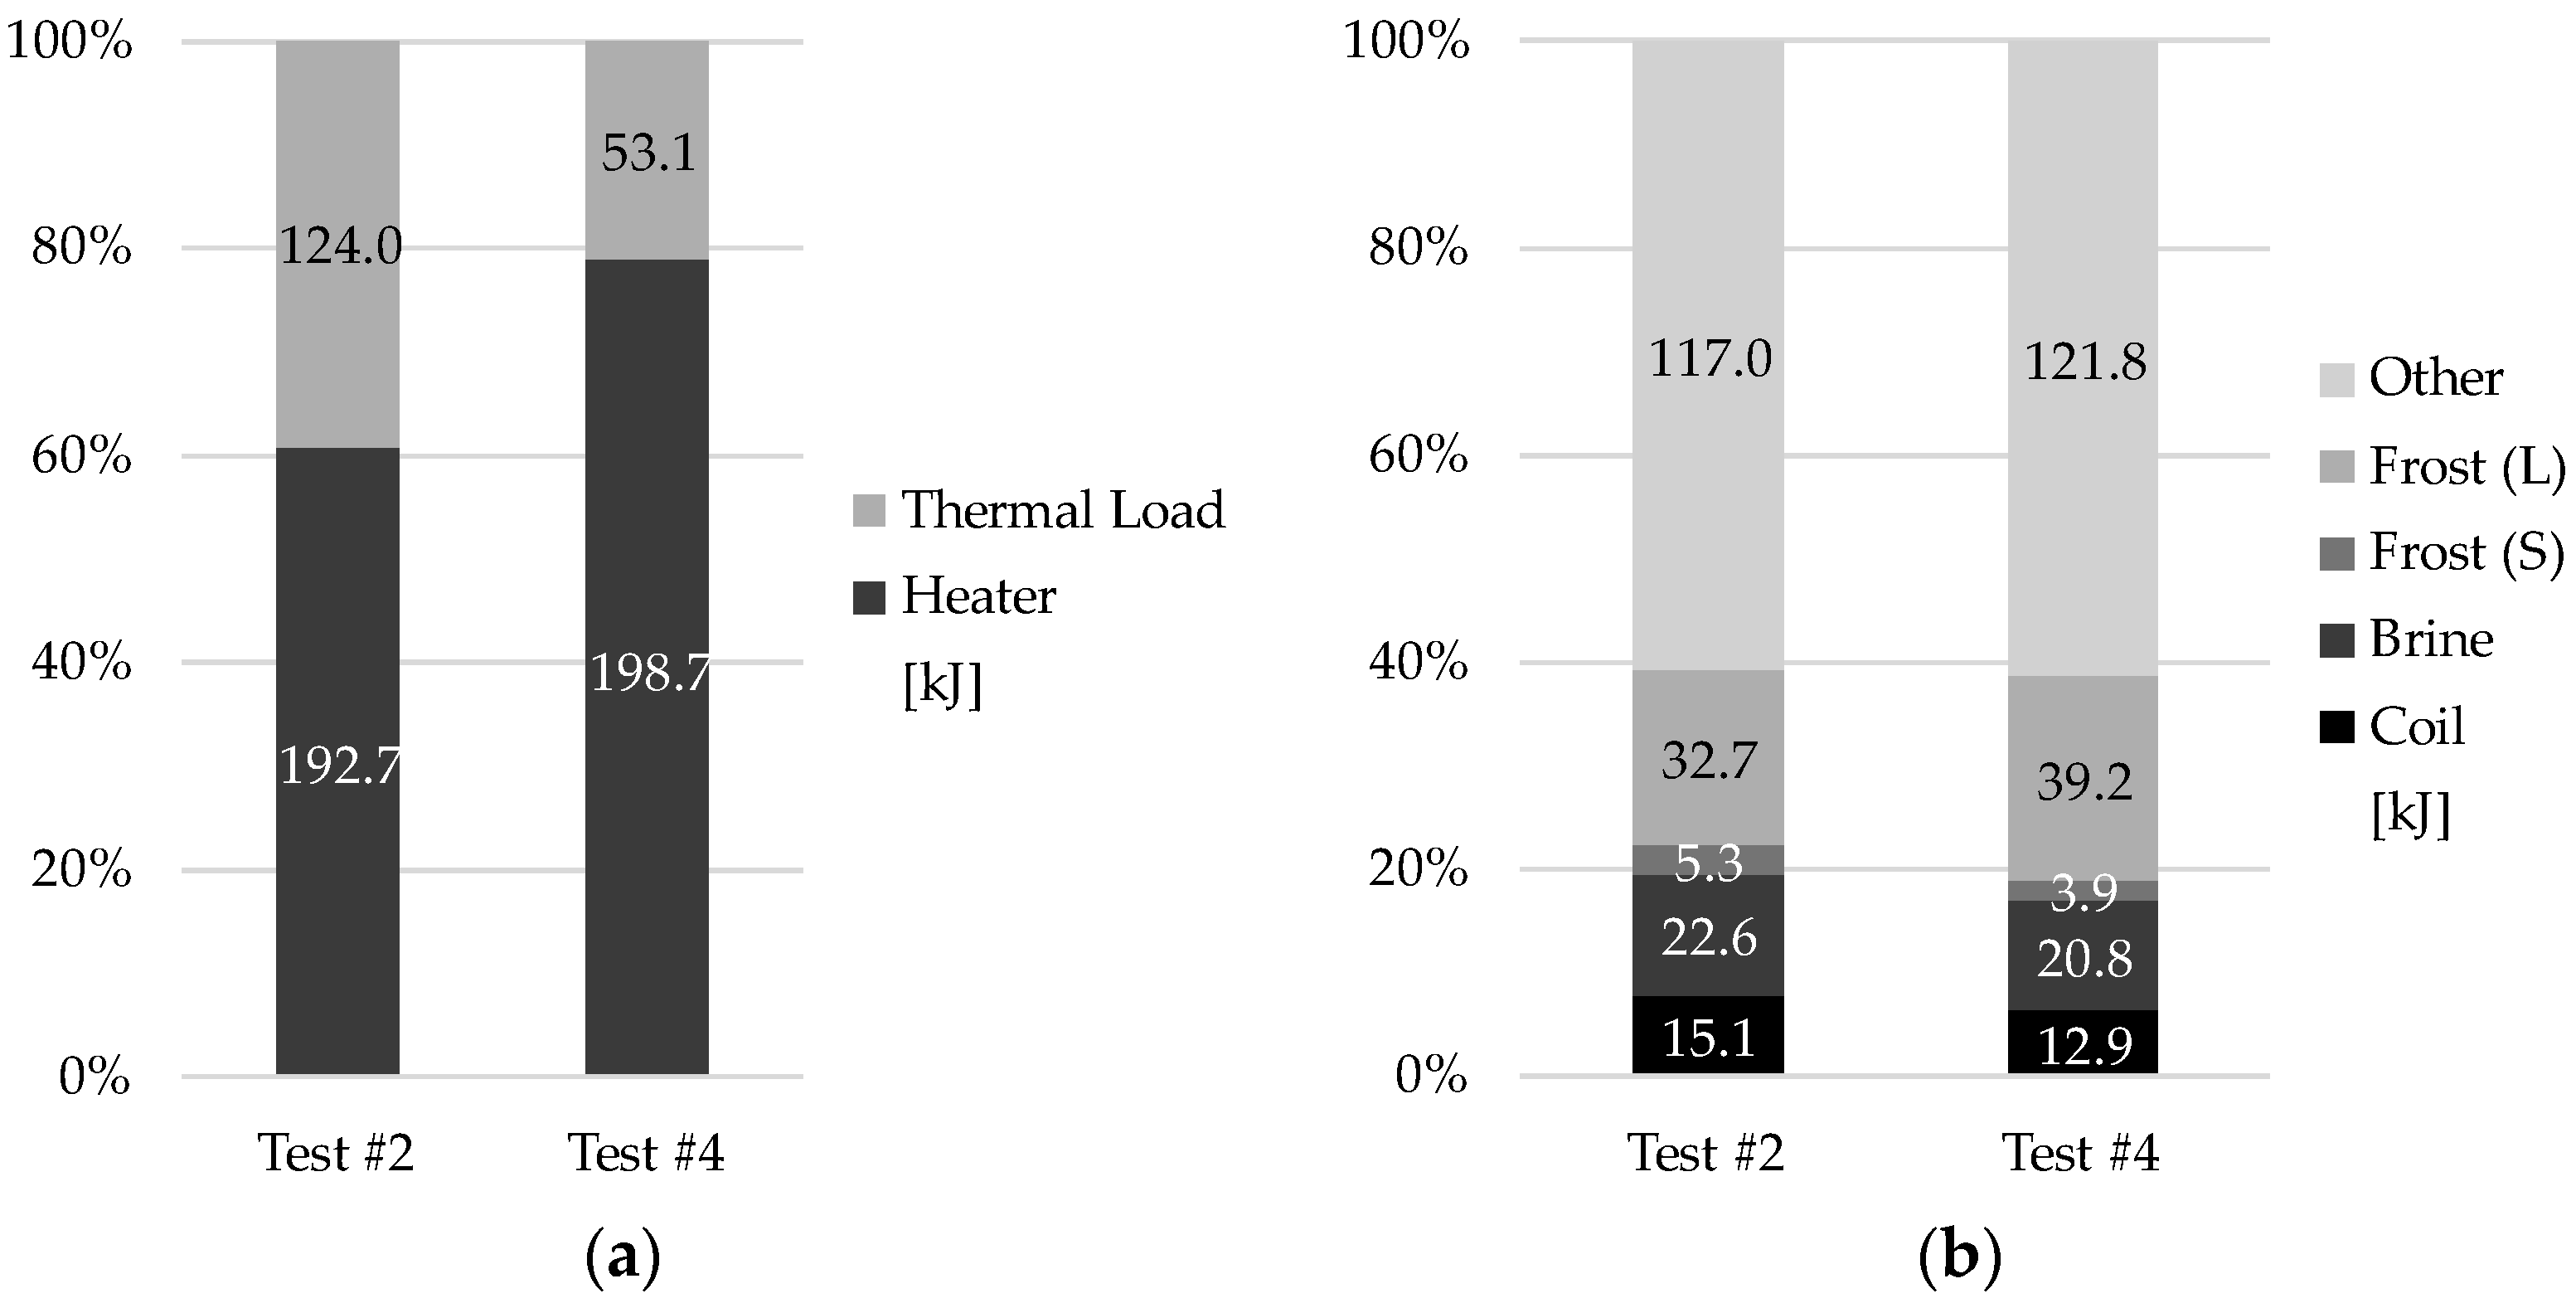
Figure 9a shows the total energy that enters the cabinet during the defrost; and Figure 9b shows the distribution of the energy in the evaporator region due to the defrost heater. Tests #2 and #4 were chosen for being the longest and shortest defrosts, respectively. Although they have very different defrost times, the total energy input by the defrost heater is very similar in both tests, indicating a much lower average defrost power in the PWM strategy, as expected. The longer defrost time, combined with lower initial cabinet temperature, causes Test #2 to have more than double energy input through the walls during defrost, compared to Test #4.
This additional thermal load directly affects the compartment temperature and must be taken into account for standardized performance tests. Furthermore, the recovery time is directly linked to the heat input during defrosting, which also affects energy efficiency. Since this work was devoted to evaluating defrost efficiency, more experiments are needed to assess the defrost strategy impact on the cabinet temperature and overall energy consumption.
When analyzing the energy distribution in the evaporator region, Figure 9b, both tests have a similar relative distribution between all evaluated components. While the evaporator tubes and fins (Coil) absorb ~7% of the energy (Test#2–Test#4) and the coolant (Brine) inside the evaporator ~11%, the frost mass stands for ~20%, being the crux. As expected, the latent heat (Frost-L) is much more significant than the sensible heat (Frost-S) in the energy required to melt the frost, suggesting that the evaporating temperature might play a minor role in the defrost efficiency. On the other hand, one should note that this variable also affects the frost morphology and, therefore, frost density and thermal conductivity, thus impacting both frosting and defrosting processes.
Additionally, it is noteworthy that roughly 60% of the energy provided by the defrost heater is used to heat the surrounding air and cabinet structure, as well as the heater itself. This energy, as well as the energy absorbed by the coil and coolant, must be removed by the cooling system during the recovery period.
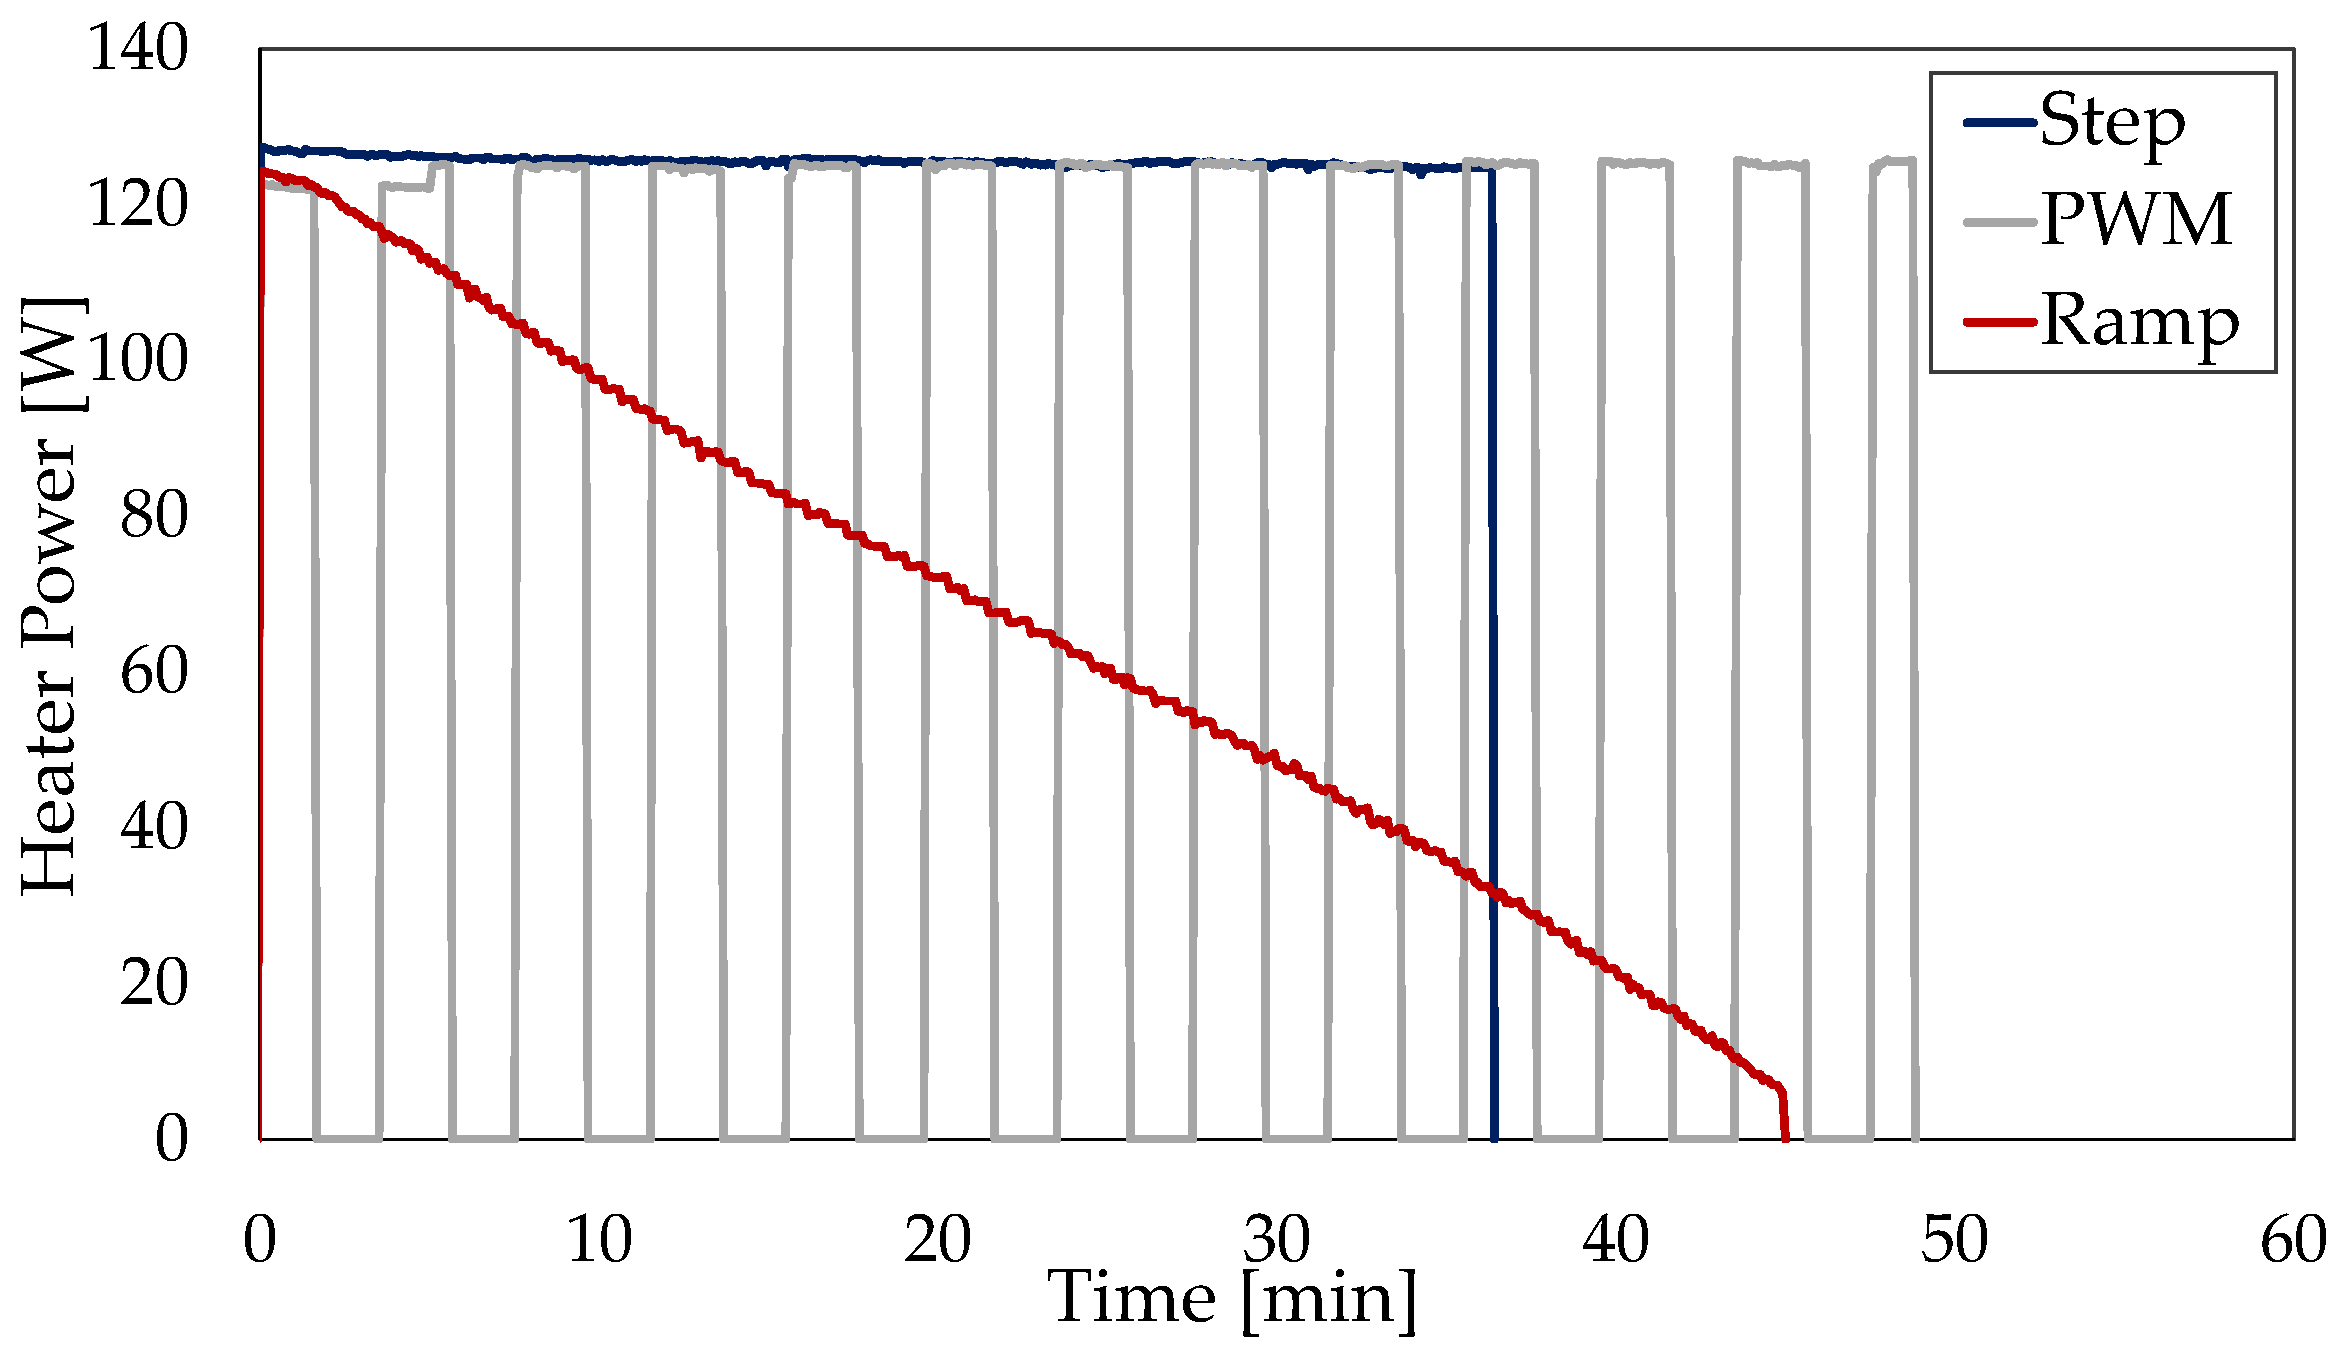
Despite the known trade-off between defrost time and efficiency, the Ramp strategy, which achieved the highest efficiency, also resulted in shorter defrost durations compared to PWM under both test conditions. This outcome is primarily due to the way power is distributed over time. Both the Ramp and PWM strategies exhibited similar average power levels, approximately half the maximum heater power. However, while the PWM delivered a nearly constant average power—being on 50% of the time within each 4-min cycle—the Ramp strategy featured a progressive reduction in power as the defrost operation evolved, as can be seen in Figure 10, which depicts the defrost power profiles.
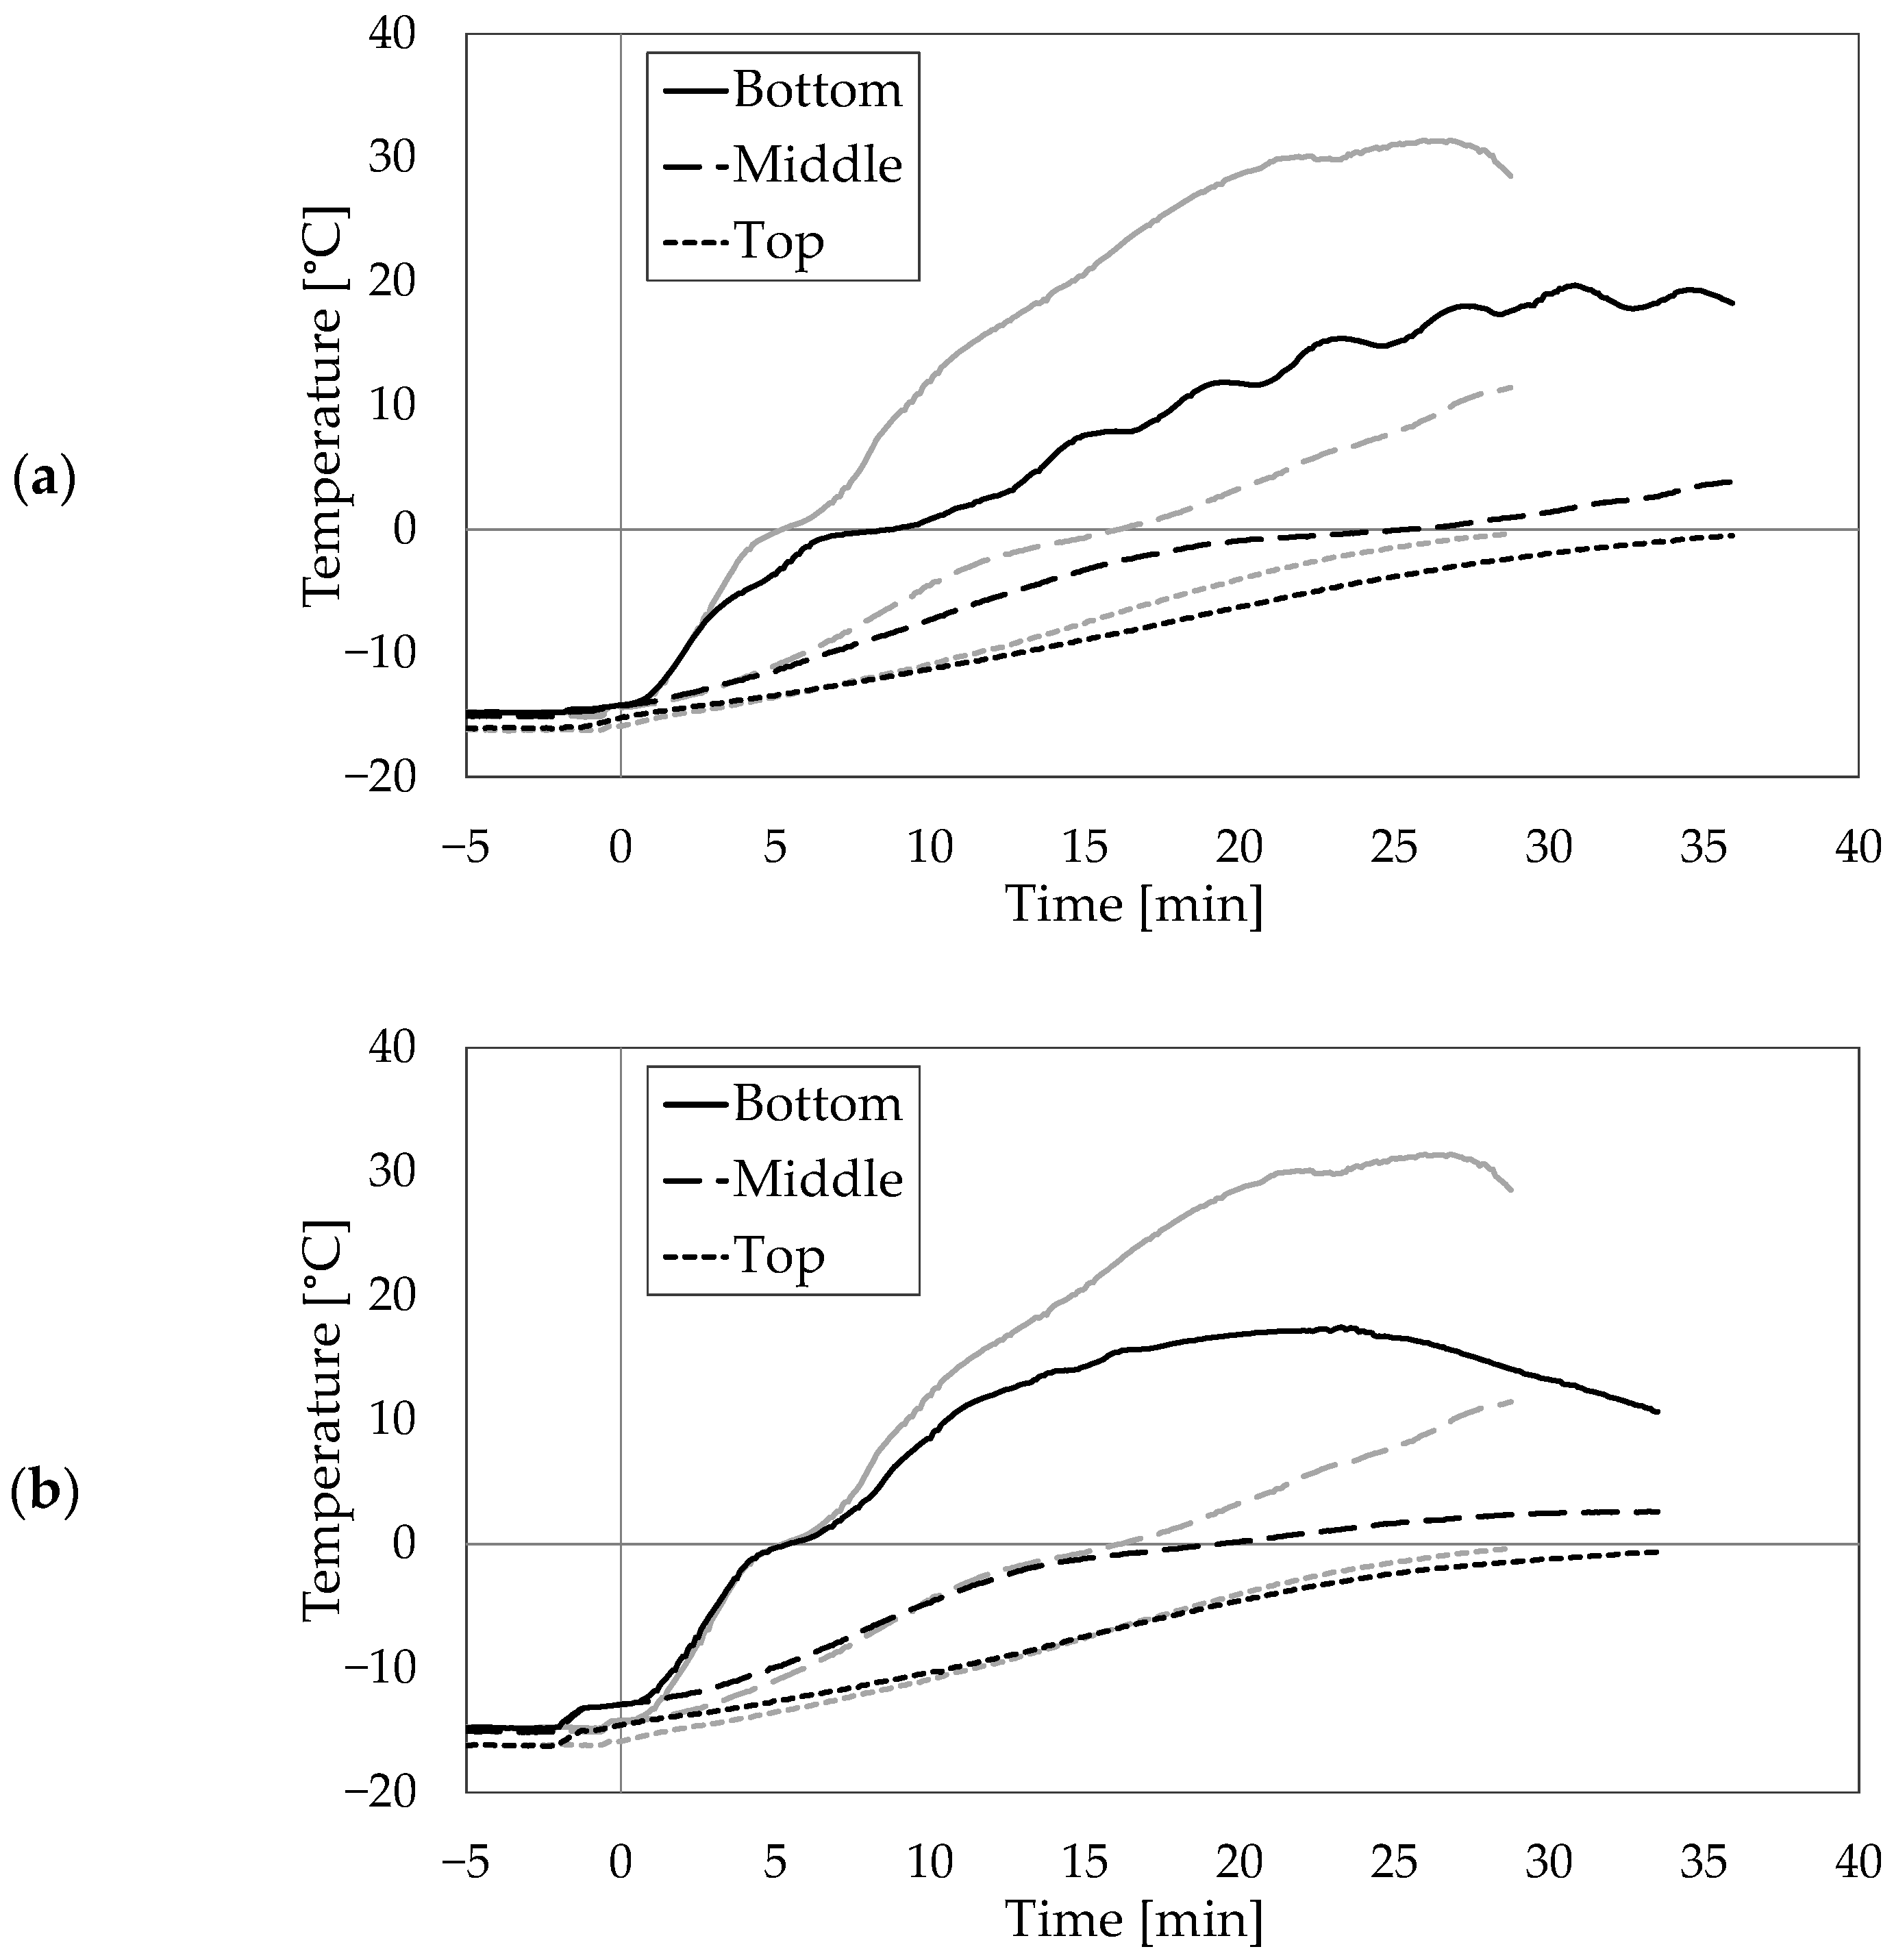
Analyzing the defrost process based on the defrost stages proposed in [46], the results show that the Ramp strategy delivered more energy during the diffusion stage and the early phase of the permeation stage. Most of the energy savings occurred towards the end of the permeation and during the drying phase. This behaviour aligns with the physical process: as frost mass decreases over time, the energy requirement drops. Additionally, water movement within the frost layer and heat conduction through both the evaporator and the frost layer contribute increasingly to the defrost process, reducing the need for external heating. In contrast, maintaining constant power, as in the Step strategy, led to significant temperature rises at the bottom of the evaporator, as illustrated in Figure 11, as that is closer to the heater. In Figure 10, zero-time is the beginning of the defrost and the lines end 100 s after defrost termination for each strategy. The evaporator surface temperatures in the tests in Condition A present similar behaviour.
For PWM, the lower average power was present from the very beginning of the defrost. While this reduction is beneficial in the later stages, it delays the early stages of defrost when the frost mass remains nearly constant, resulting in longer defrost durations without significant efficiency gains.

3.3. Evaporator Visualization

Four sections of the evaporator were selected for binarization, as depicted in Figure 12. The sections in the central and top regions contain the same fins, allowing to capture a trend of frost thickness over the evaporator length in the airflow direction. The pictures in the plot are the binarized images from the top-right section for different time instants.
Since the fin pitch is approximately constant in all the cropped images, the difference in σ f i n   between the centre and top portions is likely explained by decreasing frost thickness along the fins in the airflow direction (from the bottom to the top of Figure 12), since the centre part has more frosting potential due to a higher humidity difference between the surface and the air. For similar operating conditions (i.e., ambient and cabinet temperatures), the behaviour of σ f i n due to frost accretion will be similar, making it a reliable indicator of the evaporator blockage and, consequently, a robust defrost start trigger.
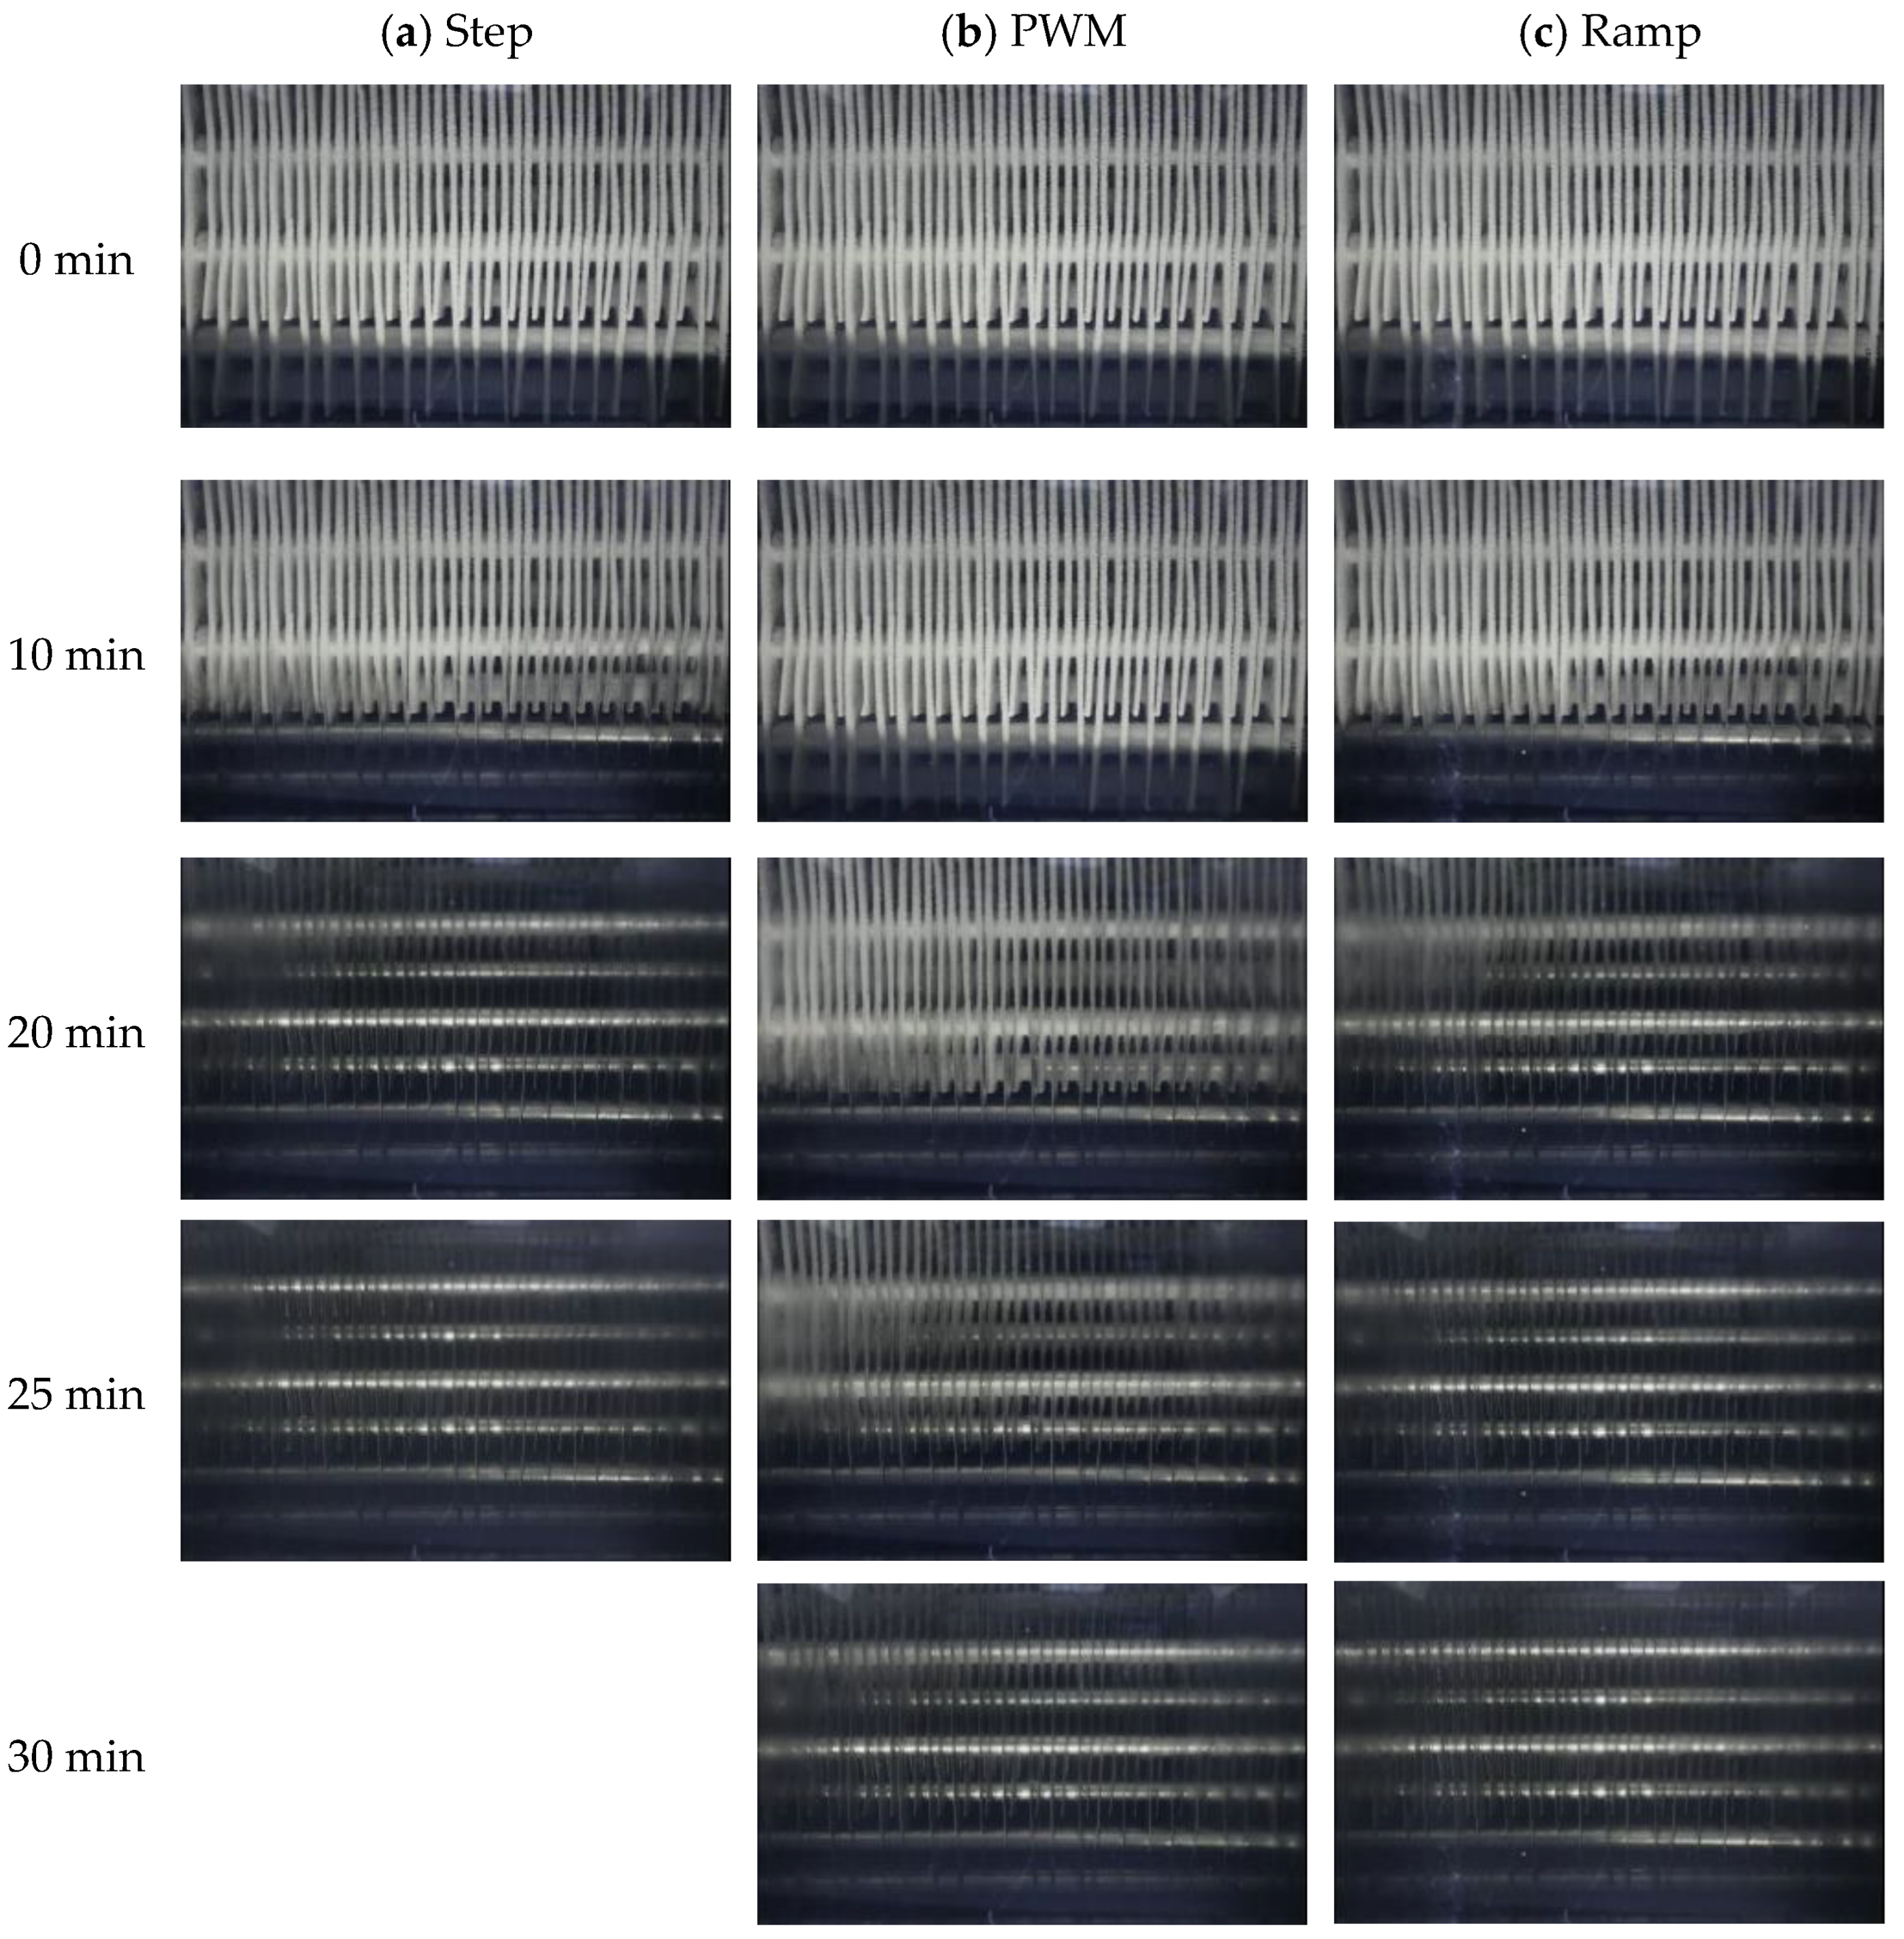
The complete visualization of the evaporator during defrosting, illustrated in Figure 13, allows for the establishment of a tight defrost termination criterion, as it was possible to directly correlate the temperature in the top region of the evaporator with the complete frost melt. Additionally, it is possible to see how frost melting occurs for the different strategies. The Ramp strategy is very similar to the Step until around 10 min, and only then starts to lag due to the increasing reduction in heater power. The test with the PWM strategy accumulated consistently more frost due to its lower average power since the defrost started. It is noteworthy that the initial frost accumulation is identical between the tests, indicating robustness in the frost formation phase.

4. Final Remarks

The present study combined two simultaneous experimental investigations focused on advancing evaporator frosting and defrosting processes in household refrigerators. The former examined the influence of operational variables on frost accumulation by independently controlling humidity and temperature in both compartments of a ‘fan-and-damper’ refrigerator—a configuration that remains among the most widely used in household refrigeration globally. The latter assessed the energy efficiency of the electric defrost process using different control strategies and frost morphologies.
The development of custom-built test benches in both studies enabled strict control of surface temperature, airflow characteristics, and psychrometric conditions. A significant methodological achievement was the reproducibility of frost mass and air-side pressure drop under repeatable test protocols. Results from both studies consistently showed that higher surface temperatures lead to denser frost morphologies with higher thermal conductivity, which favour defrosting performance. In contrast, increased humidity resulted in more porous, less dense frost, reducing thermal conductivity and extending defrost periods.
From the airflow study in the frost-formation rig, it was verified that the freezer compartment—responsible for approximately 90% of the airflow—plays a dominant role in frost accumulation, while the fresh food compartment had marginal influence. The defrost test rig showed that the ramp strategy delivered the highest defrost efficiency, reaching a maximum of 36.7% under mild frosting conditions (Condition B), followed by the PWM and step strategies. Although the Ramp and PWM strategies had the best efficiencies, they also required longer defrosting times.

Author Contributions

Conceptualization, C.J.L.H. and C.A.R.N.; methodology, C.J.L.H. and A.S.S.; formal analysis, L.P.B.B. and R.G.R.; investigation, L.P.B.B. and R.G.R.; resources, C.J.L.H. and A.S.S.; data curation, L.P.B.B. and R.G.R.; writing—original draft preparation, L.P.B.B. and R.G.R.; writing—review and editing, L.P.B.B., R.G.R. and C.J.L.H.; supervision, A.S.S.; project administration, C.J.L.H.; funding acquisition, C.A.R.N. All authors have read and agreed to the published version of the manuscript.

Funding

The financial support from Electrolux and Embrapii (Grant No. PPOL-2206.0033), and the funding provided by the INCT Program (CNPq Grant No. 404023/2019-3; FAPESC Grant No. 2019TR0846) are duly acknowledged.

Acknowledgments

The authors are thankful to Marcelo Campani (Electrolux) for championing this research project, and to Breno Borges and Henrique Eberth, former undergrad students at POLO, for their help with the experimental setups and runs.

Conflicts of Interest

The authors declare no conflicts of interest.

Nomenclature

Roman Symbols
AArea [m2]
hConvective heat transfer coefficient [W/m2-K]
EEnergy [kJ]
XGeneric Variable
mMass [g]
PPixel
WPower [kW]
cpSpecific heat [kJ/kg-K]
TTemperature [°C]
tTime [s]
uUncertainty [variable unit]
i s l Water latent heat of fusion [kJ/kg]
Greek Symbols
ω Absolute humidity [-]
η Efficiency [-]
δ Thickness [m]
σ Passage fraction [-]
ϕ Relative Humidity [-]
Subscripts
aAir
BBlack
sCoil surface
dDefrost
hDefrost heater
FzFreezer
FFFresh-Food
fFrost
bMeasurement instrument
satSaturation
rStandard deviation
supSupersaturation
WWhite
Superscripts
*Dimensionless normalized variable

Appendix A

Repeatability tests were performed on both test rigs. In the frost formation test rig, satisfactory repeatability was obtained on the frost mass for the same psychrometric condition. The defrost test rig also underwent repeatability tests, indicating a consistent defrost efficiency for the same conditions. The defrost mass was also repeated, as can be observed from the results in Table 5. After the initial validation of both rigs, each test was performed once. The uncertainty of the defrost efficiency was calculated based on standard uncertainty propagation. Taking Equation (1) for the defrost efficiency, the propagated uncertainty of this variable was calculated as indicated by Equation (A1).
u η d = i η d X i 2 u X i 2
The uncertainty σ for each variable X i was calculated with Equation (A2), where u r is the standard deviation and u b is the instrument uncertainty. The standard deviation was obtained from the raw data, saved every 5 s during the tests, and instrument uncertainty was obtained from the calibration reports and datasheets, and is available in Section 2.1 for each instrument.
u X i = u r , X i 2 + u b , X i 2
To obtain the final uncertainty for the defrost efficiency, the value obtained with Equation (1) was multiplied by the appropriate Student t-factor value, considering 95% two-sided confidence interval and 1 degree of freedom. The assumption that the results would resemble a normal distribution for the same psychrometric conditions was based on the repeatability of the frost mass and the deterministic nature of the physical phenomenon of frost formation. The uncertainties of the physical properties were not considered.

References

  1. UNEP; IEA. Cooling Emissions and Policy Synthesis Report; United Nations Environment Programme: Nairobi, Kenya; International Energy Agency: Paris, France, 2020; Available online: https://backend.orbit.dtu.dk/ws/portalfiles/portal/247572967/Full_Cooling_Synthesis_Report.pdf (accessed on 15 May 2025).
  2. Green Cooling Initiative. Global Greenhouse Gas Emissions from the RAC Sector; Green Cooling Initiative: Eschborn, Germany, 2024; Available online: https://www.green-cooling-initiative.org/country-data#!total-emissions/all-sectors/absolute (accessed on 15 May 2025).
  3. Na, B.; Webb, R.L. A fundamental understanding of factors affecting frost nucleation. Int. J. Heat Mass Transf. 2003, 46, 3797–3808. [Google Scholar] [CrossRef]
  4. Stoecker, W.F. How frost formation on coils affects refrigeration systems. Refrig. Eng. 1957, 65, 42–46. [Google Scholar]
  5. Ogawa, K.; Tanaka, N.; Takeshita, M. Performance improvement of plate fin-and-tube heat exchangers under frosting conditions. ASHRAE Trans. 1993, 99, 762–771. [Google Scholar]
  6. Jhee, S.; Lee, K.; Kim, W. Effect of surface treatments on the frosting/defrosting behavior of a fin-tube heat exchanger. Int. J. Refrig. 2002, 25, 1047–1053. [Google Scholar] [CrossRef]
  7. Zhang, P.; Hrnjak, P.S. Air-side performance evaluation of three types of heat exchangers in dry, wet and periodic frosting conditions. Int. J. Refrig. 2009, 32, 911–921. [Google Scholar] [CrossRef]
  8. Silva, D.L.; Hermes, C.J.L.; Melo, C. Experimental study of frost accumulation on fan-supplied tube-fin evaporators. Appl. Therm. Eng. 2011, 31, 1013–1020. [Google Scholar] [CrossRef]
  9. Knabben, F.T.; Hermes, C.J.L.; Melo, C. In-situ study of frosting and defrosting processes in tube-fin evaporators of household refrigerating appliances. Int. J. Refrig. 2011, 34, 2031–2041. [Google Scholar] [CrossRef]
  10. Borges, B.N.; Melo, C.; Hermes, C.J.L. Transient simulation of a two-door frost-free refrigerator subjected to periodic door opening and evaporator frosting. Appl. Energy 2015, 147, 386–395. [Google Scholar] [CrossRef]
  11. Pegallapati, A.S.; Ramgopal, M. Effect of heat transfer area distribution on frosting performance of refrigerator evaporator. Int. J. Heat Mass Transf. 2021, 175, 121317. [Google Scholar] [CrossRef]
  12. Ambriz, Y.A.A.; Ledesma, S.; Flores, J.M.B.; Mariscal, I.C.; Ojeda, D.L.A. Frost thickness estimation in a domestic refrigerator using acoustic signals and artificial intelligence. Exp. Sys. App. 2022, 201, 117071. [Google Scholar] [CrossRef]
  13. Xu, B.; Han, Q.; Chen, J.; Li, F.; Wang, N.; Li, D.; Pan, X. Experimental investigation of frost and defrost performance of microchannel heat exchangers for heat pump systems. Appl. Energy 2013, 103, 180–188. [Google Scholar] [CrossRef]
  14. Lee, W.; Kwon, O.K. Image processing for frost thickness measurement in fin-and-tube heat exchangers. Therm. Sci. Eng. Prog. 2021, 24, 100937. [Google Scholar] [CrossRef]
  15. Ambriz, Y.A.A.; Ledesma, S.; Ojeda, D.L.A.; Flores, J.M.B. Accurate classification of frost thickness using visual information in a domestic refrigerator. Int. J. Refrig. 2023, 145, 256–263. [Google Scholar] [CrossRef]
  16. Shangwen, L.; Mengije, S.; Long, Z.; Xuan, Z.; Keke, S.; Jun, S. Experimental investigation of frost characteristics on vertical cold plate under forced convection influenced by surface temperature. Appl. Therm. Eng. 2023, 234, 121318. [Google Scholar] [CrossRef]
  17. Rahman, H.; Akbar, H.; Malik, A.N.; Nawaz, T.; Lazoglu, I. Effective image processing-based technique for frost detection and quantification in domestic refrigerators. Int. J. Refrig. 2024, 160, 217–228. [Google Scholar] [CrossRef]
  18. Kim, K.; Lee, K.S. Frosting and defrosting characteristics of a fin according to surface contact angle. Int. J. Heat Mass Transf. 2011, 54, 2758–2764. [Google Scholar] [CrossRef]
  19. Wang, F.; Liang, C.; Zhang, X. Visualization study of the effect of surface contact angle on frost melting process under different frosting conditions. Int. J. Refrig. 2016, 64, 143–152. [Google Scholar] [CrossRef]
  20. Sommers, A.D.; Napora, A.C.; Truster, N.L.; Caraballo, E.J.; Hermes, C.J.L. A semi-empirical correlation for predicting the frost density on hydrophilic and hydrophobic substrates. Int. J. Refrig. 2017, 74, 313–323. [Google Scholar] [CrossRef]
  21. Hou, Z.; Yang, Z.; Zhao, Y.; Zhao, X.; Sun, B.; Wang, G.; Xie, T. Study on the anti-frosting performance of hydrophobic fin with non-toxic for the R600a frost-free refrigerator. Appl. Therm. Eng. 2024, 238, 122033. [Google Scholar] [CrossRef]
  22. Piucco, R.O.; Hermes, C.J.L.; Melo, C.; Barbosa Júnior, J.R. A study of frost nucleation on flat surfaces. Exp. Therm. Fluid Sci. 2008, 32, 1710–1715. [Google Scholar] [CrossRef]
  23. Wang, Z.; Cui, W.; Li, L.; Zhan, C.; Zhang, Y. A numerical study of heterogeneous nucleation of ice crystals and frost layer growth on horizontal cold surfaces. Int. J. Heat Mass Transf. 2024, 228, 125604. [Google Scholar] [CrossRef]
  24. Silva, D.L.; Hermes, C.J.L.; Melo, C. Optimal defrost cycle for the air cooler revisited: A case study of fan-supplied tube-fin evaporators. Int. J. Refrig. 2018, 89, 142–148. [Google Scholar] [CrossRef]
  25. Hermes, C.J.L.; Boeng, J.; Da Silva, D.L.; Knabben, F.T.; Sommers, A.D. Evaporator frosting in refrigerating appliances: Fundamentals and applications. Energies 2021, 14, 5991. [Google Scholar] [CrossRef]
  26. Melo, C.; Knabben, F.T.; Pereira, P.V. An experimental study on defrost heaters applied to frost-free household refrigerators. Appl. Therm. Eng. 2013, 51, 239–245. [Google Scholar] [CrossRef]
  27. Bansal, P.; Fothergill, D.; Fernandes, R. Thermal analysis of the defrost cycle in a domestic freezer. Int. J. Refrig. 2010, 33, 589–599. [Google Scholar] [CrossRef]
  28. Yin, H.; Yang, Z.; Chen, A.; Zhang, N. Experimental research on a novel cold storage defrost method based on air bypass circulation and electric heater. Energy 2012, 37, 623–631. [Google Scholar] [CrossRef]
  29. Li, Z.; Zhao, D.; Ding, G.; Ren, T.; Miao, S.; Han, X.; Noda, T. Improving defrosting performance by controlling frost distribution to match defrosting heat distribution in frost-free household refrigerators. Int. J. Refrig. 2017, 77, 136–148. [Google Scholar] [CrossRef]
  30. Zhao, R.; Huang, D.; Peng, X.; Qiao, L. Comprehensive measures to enhance electric heater defrosting (EHD) performance for household frost-free refrigerators. Int. J. Refrig. 2020, 111, 1–8. [Google Scholar] [CrossRef]
  31. Modarres, F.G.; Rasti, M.; Joybari, M.M.; Nasrabadi, M.R.F.; Nematollahi, O. Experimental investigation of energy consumption and environmental impact of adaptive defrost in domestic refrigerators. Measurement 2016, 92, 391–399. [Google Scholar] [CrossRef]
  32. Knabben, F.T.; Melo, C. An experimental study on the effect of a new defrosting strategy on the energy consumption of household refrigerators. In Proceedings of the International Refrigeration and Air Conditioning Conference; Purdue: West Lafayette, IN, USA, 2016; p. 1580. [Google Scholar]
  33. Yoon, Y.; Jeong, H.; Lee, K. Adaptive defrost methods for improving defrosting efficiency of household refrigerator. Energy Convers. Manag. 2018, 157, 511–516. [Google Scholar] [CrossRef]
  34. Jeong, H.; Byun, S.; Kim, D.R.; Lee, K. Power optimization for defrosting heaters in household refrigerators to reduce energy consumption. Energy Convers. Manag. 2021, 237, 114127. [Google Scholar] [CrossRef]
  35. Zhao, R.; Wang, Z.; Huang, D.; Shen, W.; Hu, H.; Tang, X. Electric-heater defrosting performance of frost-free refrigerator-freezer and its improvement by step-reduction power. Appl. Therm. Eng. 2023, 226, 120147. [Google Scholar] [CrossRef]
  36. Wang, T.; Chen, H.; Zheng, P.; Zhao, Y.; Yang, P.; Liu, Y. Experimental study on high-efficiency defrosting control logic for frost-free household refrigerators. Appl. Therm. Eng. 2025, 278, 127289. [Google Scholar] [CrossRef]
  37. Safikhani, H.; Esmaeili, F.; Rezvani, S. Extracting a smart model for determining defrost time in household refrigerators using a combination of CFD, experimental data, and GMDH type artificial neural network. Int. J. Refrig. 2025, 176, 52–65. [Google Scholar] [CrossRef]
  38. Zhang, S.; Yang, Z.; Wang, Y.; Zhao, Y.; Shu, Y.; Zhao, X.; Sun, B.; Wang, G.; Xie, T. Defrost characteristics and performance improvement of electric heaters in R600a frost-free refrigerators. Thermal Sci. Eng. Prog. 2025, 58, 103219. [Google Scholar] [CrossRef]
  39. Otsu, N. A threshold selection method from gray-level histograms. IEEE Trans. Syst. Man Cybern. 1979, 9, 62–66. [Google Scholar] [CrossRef]
  40. Melo, F.S.; Cardoso, R.P.; Hermes, C.J.L. Quality and quantity trade-offs in clear ice making. Int. J. Refrig. 2024, 161, 94–100. [Google Scholar] [CrossRef]
  41. Kobayashi, T. On the habit of snow crystals artificially produced at low pressures. J. Meteorol. Soc. Jpn. 1958, 36, 193–208. [Google Scholar] [CrossRef]
  42. Da Silva, D.L. Frost formation on fan-supplied tube-fin evaporators: A visual and numerical analysis. In Proceedings of the International Refrigeration and Air Conditioning Conference; Purdue: West Lafayette, IN, USA, 2012; p. 1164. [Google Scholar]
  43. Nakaya, U. Snow Crystals: Natural and Artificial; Harvard University Press: Cambridge, MA, USA, 1954; p. 522. [Google Scholar]
  44. Na, B.; Webb, R.L. New model for frost growth rate. Int. J. Heat Mass Transf. 2004, 47, 925–936. [Google Scholar] [CrossRef]
  45. Negrelli, S.; Hermes, C.J.L. A semi-empirical correlation for the thermal conductivity of frost. Int. J. Refrig. 2015, 58, 243–252. [Google Scholar] [CrossRef]
  46. Mohs, W.F.; Kulacki, F.A. Heat and Mass Transfer in the Melting of Frost, 1st ed.; Springer: Cham, Switzerland, 2015. [Google Scholar] [CrossRef]
Figure 1. Schematic of the increasing thermal resistance between surface and air due to the frost accretion.
Thermo 05 00032 g001
Figure 2. Representations of the (a) ‘no-frost’ evaporator; (b) ‘calrod’ defrost heater.
Thermo 05 00032 g002
Figure 3. Schematic representation of the frost formation rig.
Thermo 05 00032 g003
Figure 4. Schematic representation of the defrost rig.
Thermo 05 00032 g004
Figure 5. Influence of each variable according to the coefficients of Equation (5).
Thermo 05 00032 g005
Figure 6. Inlet water flow rate contribution of each compartment.
Thermo 05 00032 g006
Figure 7. Accumulated frost mass with different relative humidities. Evaporator surface at (a) −25 °C, (b) −15 °C.
Thermo 05 00032 g007
Figure 8. Defrost efficiency for each control strategy and psychrometric condition.
Thermo 05 00032 g008
Figure 9. Energy distribution during defrost period: (a) Total energy entering the cabinet; (b) energy distribution in the evaporator region.
Thermo 05 00032 g009
Figure 10. Defrost heater power consumption during defrost for different strategies.
Thermo 05 00032 g010
Figure 11. Evaporator surface temperature in different evaporator regions for tests in Condition B: (a) Step (grey) and PWM (black); (b) Step (grey) and Ramp (black).
Thermo 05 00032 g011
Figure 12. Evaporator visualization during frost formation for Test#6.
Thermo 05 00032 g012
Figure 13. Evaporator visualization during defrost for tests in Condition B with different heater control strategies: (a) Step; (b) PWM; (c) Ramp.
Thermo 05 00032 g013
Table 1. Summary of key experimental studies on defrost efficiency.
AuthorsRef.YearHeater Type η d RangeProposed Optimization
Bansal et al.[27]2010Radiant30%Setup
Knabben et al.[9]2011Distributed-Setup
Yin et al.[28]2012Radiant26–78%Setup
Melo et al.[26]2013Distributed, Radiant and Glass tube27–48%Control
Knabben and Melo[32]2016Distributed and Radiant-Setup and Control
Modarres et al.[31]2016Distributed-Control
Li et al.[29]2017Radiant29–41%Setup
Yoon et al.[33]2018Distributed and Radiant21–37%Control
Zhao et al.[30]2020Radiant-Setup
Jeong et al.[34]2021Distributed and Radiant14–32%Setup
Zhao et al.[35]2023Radiant12–16%Control
Wang et al.[36]2025Radiant-Control
Safikhani et al.[37]2025Radiant-Control
Zhang et al.[38]2025Distributed and Radiant27–38%Setup
Table 2. Frost formation test conditions.
Test
[-]
T s [°C] T a , F z [°C] ϕ F F
[%]
ϕ F z
[%]
ω F F
[g/kg]
ω F z
[g/kg]
ω s u p
[g/kg]
1−25−1840752.000.580.33
2−25−1840852.000.650.40
3−25−1865753.260.580.46
4−25−1865853.260.650.53
5−25−1890754.530.580.58
6−25−1890854.530.650.65
7−15−840752.001.430.47
8−15−840852.001.620.64
9−15−865753.261.430.60
10−15−865853.261.620.77
11−15−890754.531.430.72
12−15−890854.531.620.90
Table 3. Defrost test conditions.
Test
[-]
Control Strategy ω a [g/kg] T a [°C] T s [°C]
1Step0.69−18−24
2PWM0.69−18−24
3Ramp0.69−18−24
4Step1.72−8−15
5PWM1.72−8−15
6Ramp1.72−8−15
Table 4. Summary of frost formation results.
Test
[-]
Frost Formation Time
[h]
Defrost Duration
[min]
m f
[g]
118.2443.75232.13
210.8039.00165.65
312.2041.25189.82
48.8837.25149.83
58.4135.08173.44
66.1134.17130.98
714.6941.67235.51
89.1838.83205.33
913.1239.58231.93
108.7037.08199.88
119.2136.92209.11
127.1535.50186.05
Table 5. Defrost test rig results.
FrostingDefrosting
Test
[-]
T a
[°C]
T s
[°C]
ω a
[%]
m f
[g]
StrategyDuration η d
[%]
T h , m a x
[°C]
1−17.9−24.50.7097.1Step36 min20 s13.9 ± 0.4264
2−17.9−24.10.7098.0PWM48 min45 s19.8 ± 0.8207
3−18.0−24.10.6994.1Ramp44 min55 s20.3 ± 0.8239
4−8.0−15.01.69117.5Step26 min45 s21.7 ± 0.6266
5−8.3−15.11.66115.1PWM33 min55 s31.3 ± 1.3209
6−8.1−15.31.69122.4Ramp31 min30 s36.7 ± 2.3230
Disclaimer/Publisher’s Note: The statements, opinions and data contained in all publications are solely those of the individual author(s) and contributor(s) and not of MDPI and/or the editor(s). MDPI and/or the editor(s) disclaim responsibility for any injury to people or property resulting from any ideas, methods, instructions or products referred to in the content.