Article

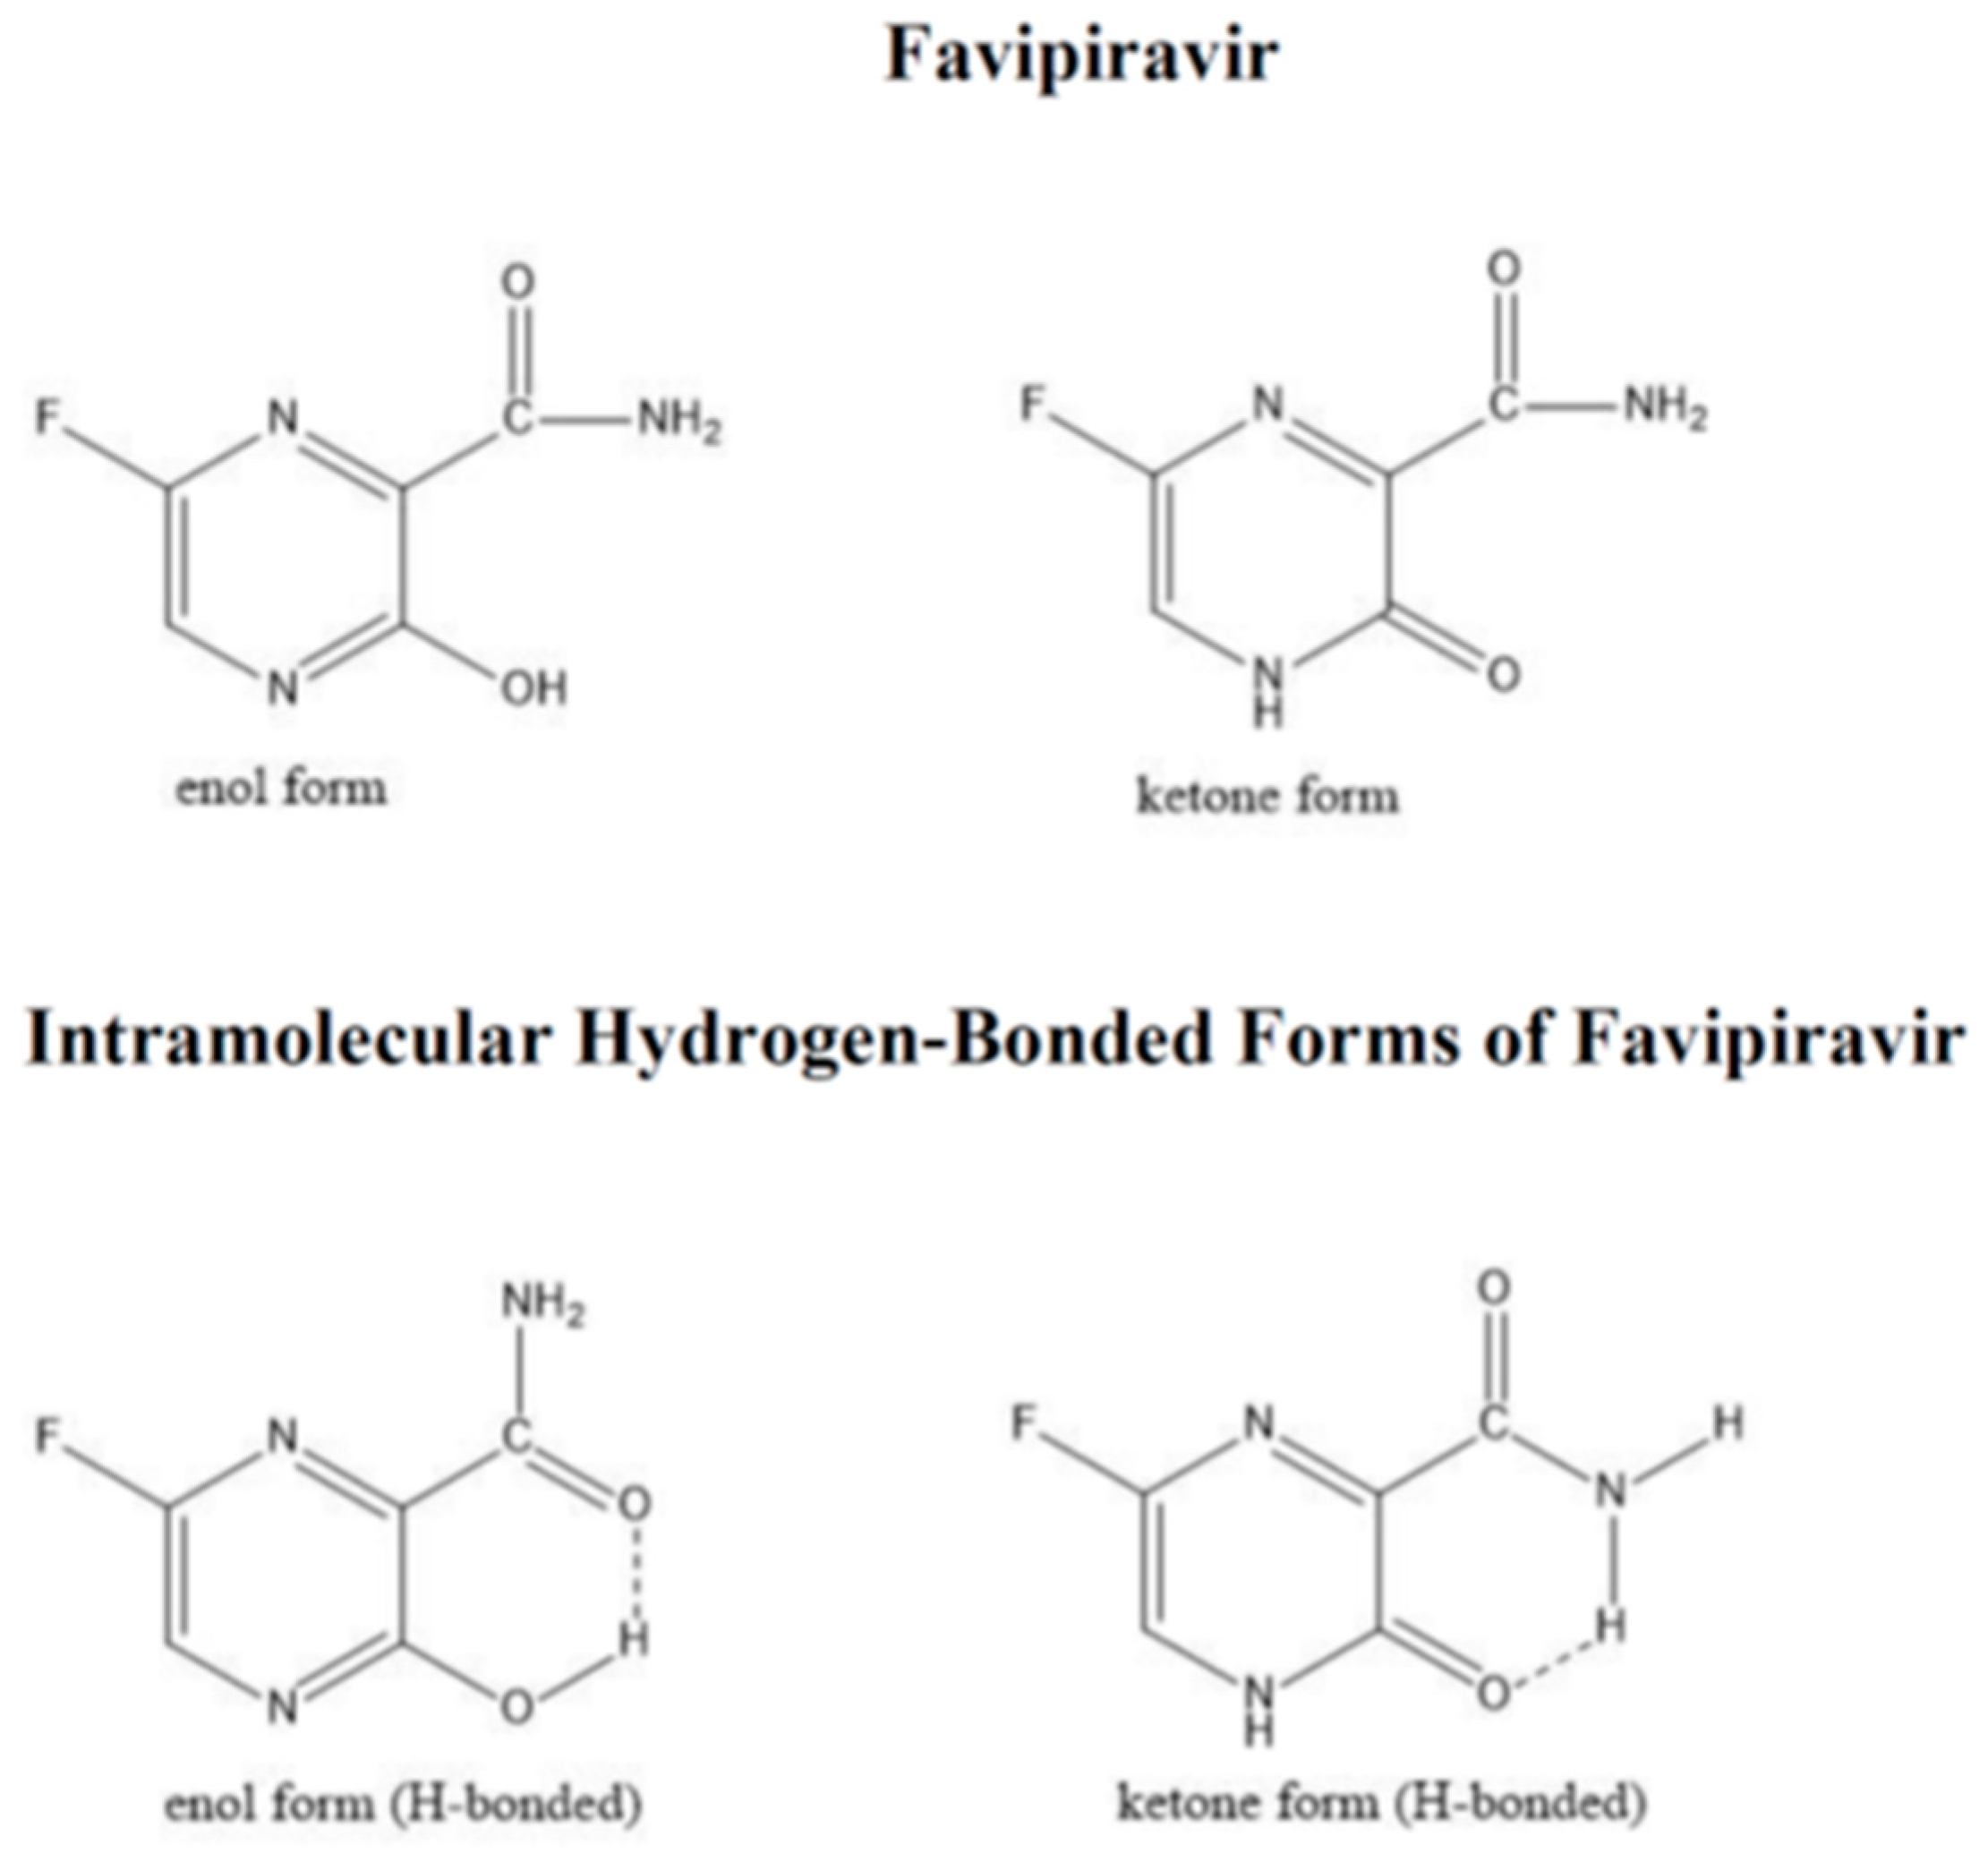
Abraham Model Solute Descriptors for Favipiravir: Case of Tautomeric Equilibrium and Intramolecular Hydrogen-Bond Formation

Department of Chemistry, University of North Texas, Denton, TX 76203, USA
*
Author to whom correspondence should be addressed.
Thermo 2023, 3(3), 443-451; https://doi.org/10.3390/thermo3030027
Submission received: 14 July 2023 / Revised: 28 July 2023 / Accepted: 5 August 2023 / Published: 10 August 2023

Abstract

:
Experiment-based Abraham model solute descriptors are calculated based on recently published solubility data for favipiravir dissolved in 12 chemically diverse organic mono-solvents. The calculated descriptor values indicate that favipiravir engages in intramolecular hydrogen formation that renders the hydroxyl functional group on the pyrazine ring system unable to form intermolecular hydrogen bonds with the surrounding solvent molecules. Our study further shows that the existing group contribution and machine learning methods provide rather poor estimates of the experiment-based solute descriptors of favipiravir. Poor estimation likely occurs, in part, because the methods fail to account for the intramolecular hydrogen-bonds that are believed to be formed. In the current study, it was found that the solute descriptors estimated using three different methods provided rather poor estimates of the observed solubility behavior of favipiravir, with the overall average standard errors between the experimental and predicted molar solubilities exceeding 0.40 log units.

1. Introduction

Advancements in computational science has led to the development of machine learning methods capable of predicting the chemical, biological and thermodynamic properties of a wide range of organic compounds based on training sets that contain expansive volumes of preferably “high-quality” experimental data. Machine learning algorithms scan the data sets, remove obvious outliers, and search for patterns between the known observations/data and input parameters, which may be deduced from molecular structure considerations. The published models have provided reasonably accurate estimates of the standard molar Gibbs energies and enthalpies of the formation of organic compounds [1,2,3,4], water-to-octanol partition coefficients [5,6,7], ADMET (absorption, distribution, metabolism, excretion and toxicology) properties of potential drug candidates [8,9,10], gas-chromatographic retention indices/factors on select polar and mid-polar stationary phases [11], logarithms of acid dissociation constants (pKa) [12,13] and enthalpies of solvation of a variety of compounds dissolved both in water and in approximately thirty organic mono-solvents [14,15,16].
Our interest in machine learning primarily focuses on the different methods available on the internet to estimate the six Abraham model solute descriptors and the data sets used in training the various models. Solute descriptors refer to the dissolved solute’s ability to interact with its immediate solubilizing environment. For example, the A and B descriptors measure the ability of the dissolved solute to act as a hydrogen-bond donor and acceptor, respectively; the E solute descriptor denotes the excess molar refraction of the given solute referenced to that of a linear alkane of comparable molecular size; the L descriptor is the logarithm of the solute’s experimental gas-to-hexadecane partition coefficient at 298.15 K; the S descriptor represents a combination of the polarizability and the electrostatic polarity of the solute; the V descriptor is the calculated McGowan molecular volume of the solute. Knowledge of the solute enables one to estimate the molar solubility ratios of the given solute molecule in more than 130 different organic mono-solvents for which predictive Abraham model expressions have been published.
We are particularly interested in the applicability of each method regarding its ability to estimate the experiment-based solute descriptor values for organic compounds with structural features that may not be adequately represented in the data set(s) used to train the model. As far as we can surmise, the training set for the solute descriptors was a private set of numerical values provided by Abraham in April 2016 for inclusion on the UFZ-LSER website [17]. Our private database is more extensive in that it includes not only the compounds and descriptor values from the earlier Abraham data set, but also values for many additional compounds that we have calculated over the past seven years.
Our previous experience involving internet-available machine learning methods, as well as using select group contribution methods, is that the software programs often overestimate the A solute descriptor of compounds that exhibit intramolecular hydrogen-bond formation. The compounds whose descriptor values are to be estimated are specified through their canonical Smiles codes, which give the arrangement of atoms within the given molecule. The inputted Smiles code does not contain all of the subtle structural features within the molecule that determine its chemical and biological properties. For example, the estimated solute descriptors from the group contribution method available on the UFZ-LSER website [17], E = 2.34; S = 2.46; A = 1.28; B = 1.14; V = 1.8615; and L = 11.352, were obtained using the canonical SMILES code, C1=CC=C2C(=C1)C(=O)C3=C(C=CC(=C3C2=O)O)O for 4,5-dihydroxyanthraquinone-2-carboxylic acid. The group contribution and machine learning estimation methods of Chung and coworkers [14] yielded solute descriptor sets of (E = 2.32; S = 2.37; A = 1.44; B = 0.96; V = 1.8615; and L = 11.368) and (E = 2.49; S = 2.17; A = 1.11; B = 0.87; V = 1.8615; and L = 11.327), respectively. The estimated A solute descriptor from each of the three different methods fell in the range of A = 1.11 to A = 1.44, which would be reflective of the single –COOH and two –OH functional groups contained within the molecule. Analysis of the measured solubility data of 4,5-dihydroxyanthraquinone-2-carboxylic acid dissolved in 11 organic solvents yielded a different set of descriptor values: E = 2.340, S = 2.195, A = 0.755, B = 0.596, V = 1.8615, and L = 11.073 [18]. The much smaller calculated experiment-based A solute descriptor of A = 0.755 is comparable to the experimental-based values observed for substituted-benzoic acids with a single –COOH group. The two phenolic hydrogens on the –OH functional group are likely involved in intramolecular H-bond formation with the lone pairs of electrons on the oxygen atom on the neighboring >C=O group, as neither hydroxyl proton appears to contribute to the overall H-bond donating character. Two additional dihydroxyanthraquinone compounds, 1,4-dihydroxyanthraquinone and 1,8-dihydroxyanthraquinone, had experiment-based A solute descriptor values of zero [19], again suggesting that the hydroxyl protons were not available to engage in H-bond formation with the surrounding solvent molecules. Much larger estimated A solute descriptor values of A = 0.82 [17] were calculated for both of the dihydroxyanthraquinone compounds using their canonical Smiles codes. The Smiles code failed to properly capture the solute’s ability to engage in intramolecular H-bond formation.
Cui et al. [20] recently reported mole fraction solubilities for favipiravir (more formerly named 6-fluoro-3-hydroxypyrazine-2-carboxamide) dissolved in dichloromethane, butanone, acetonitrile, N,N-dimethylformamide, three alcohol acetate (methyl acetate, ethyl acetate and butyl acetate) and four alcoholic (methanol, ethanol, 1-propanol, 2-propanol, 1-butanol) solvents in the temperature range of 293.15 K to 333.15 K. Favipiravir is not only an important antiviral agent approved by several countries for the treatment of influenza and COVID-19 [21], but it also exhibits keto-enol tautomerism with the possibility to form intramolecular hydrogen-bonds. Figure 1 depicts the two tautomeric forms of the molecule suggested by both DFT quantum-chemical computational studies and molecular spectroscopic measurements [22]. The enol tautomer was found to be substantially more stable in the gas phase and in most organic mono-solvents. The fluorine substituent on the pyrazine ring, along with the presence of the carboxamide group, further stabilizes the enol tautomer. The tautomeric proton in the enol form is part of strong intramolecular hydrogen bonding, while the NH proton in the keto form is available for interaction with strong proton acceptor solvents like water [23]. X-ray crystallographic studies provided further support for intramolecular H-bond formation in the case of the enol tautomer [24]. In our search of the published literature, we found no evidence of intramolecular H-bond formation in the case of the keto tautomer; however, the number of published papers is limited. As primary and secondary amides can act as H-bond donors [25], we include, in Figure 1, a possible intramolecular hydrogen-bonded species for the keto tautomer.
The keto–enol tautomeric equilibrium exhibited by favipiravir, combined with the possibility of intramolecular hydrogen-bond formation, provides the opportunity for us to further test the ability of the existing machine learning and group contribution methods to predict the experiment-based solute descriptors for compounds not included in each method’s training data set. In the current study, we determined the solute descriptors for favipiravir based on the experimental solubility data reported by Cui et al. [20]. The calculated experimental-based solute descriptors are then compared to the estimated values obtained using the software available on the UFZ-LSER [17] and MIT [26] websites. As noted above, the spectroscopic measurements and quantum-chemical computation studies indicate that the enol tautomer is the most stable form of favipiravir, so we are particularly interested in the estimated solute descriptors that the two software programs provide based on the SMILES code of the enol. We have included in our comparisons the solute descriptors for the keto tautomer as well in order to ascertain how large the difference is between the solute descriptors of the two tautomeric forms. Smiles codes are generated from the given molecular structure; therefore, it is imperative that the most stable tautomeric form of favipiravir be used in the estimations. Several published papers have depicted the molecular structure in the enol form [20,27,28], while other publications have contained only the keto tautomer [29,30,31]. Scifinder Scholar [32] also depicts the structure as the keto tautomer with the chemical name being given as 6-fluoro-3,4-dihydro-3-oxo-2-pyrazinecarboxamide. It is easy to see how an inexperienced researcher might simply input the molecular structure found in one’s literature reading.

2. Solute Descriptor Calculations

Calculation of Abraham model solute descriptors might possibly provide indirect evidence to reinforce the earlier DFT quantum-chemical calculations [22] regarding which tautomeric form of favipiravir is present in organic solvents, and whether the molecule exhibits intramolecular hydrogen-bond formation. In instances where intramolecular hydrogen bonding occurs, the experiment-based A solute descriptor value is expected to be significantly diminished to below what would be expected based solely on structural considerations. The Abraham model solute descriptors are easily calculated through regressing the experimental logarithms of the molar solubility ratios, log (CS,organic/CS,water) and log (CS,organic/CS,gas), in accordance to Equations (1) and (2) [18,19,33,34,35]:
log (CS,organic/CS,water) = cp + ep × E + sp × S + ap × A + bp × B + vp × V
log (CS,organic/CS,gas) = ck + ek × E + sk × S + ak × A + bk × B + lk × L
where the three subscripts (“organic”, “water” and “gas”) inside the logarithmic terms on the left-hand side of both mathematical expressions identify the phase to which the given solute molar concentration pertains. The capitalized alphabetical characters represent the solute descriptors that were defined in the manuscript’s Introduction. The lowercase alphabetical characters that precede each solute descriptor refer to the complementary solvent properties, which are not the focus of the current study. Readers are directed to several review articles and book chapters for a more detailed discussion of the Abraham model [36,37,38,39,40,41].
The calculated numerical values of the solute descriptors should provide an indication of how favipiravir exists in solution, as either the enol tautomer, the keto tautomer or an intramolecular hydrogen-bonded species. The A and/or B descriptor values will likely be the most informative as these are the ones most directly related to the hydrogen-bonding character. The calculation of the solute descriptors requires that the published mole fraction solubilities be expressed as molar solubilities. The conversion is accomplished by dividing the numerical values of xS,organic by the ideal molar volume of the saturated solution (i.e., CS,organicxS,organic /VSaturated solution). The molar volume of the saturated solution is a weighted mole fraction average of the molar volumes of favipiravir and the organic mono-solvent (ie., Vsaturated solution = xS,organic VSolute + (1 − xS,organic) VSolvent). The molar volume of favipiravir was estimated to be Vsolute = 0.09963 Liter. The calculated logarithms of the molar solubilities in the 12 organic solvents, along with the logarithm of the measured water-to-octanol partition coefficient (log P = 0.72 [42]), are tabulated in Table 1.
Listed in Table 2 are the numerical values of the equation coefficients for the Abraham model log (CS,organic/CS,water) and log (CS,organic/CS,gas) for the 12 different organic mono-solvents in which the favipiravir solubility was measured. Coefficients for the practical water-to-1-octanol partition coefficient and its accompanying “practical” gas-to-1-octanol partition coefficient correlations are given in the rows labeled 1-octanol (wet). A direct partitioning experiment is where the solute is distributed between an aqueous phase (saturated with 1-octanol) and an organic phase (saturated with water). Equations for the remaining five alcohol solvents, butanone, acetonitrile, N,N-dimethylformamide and three alkyl acetate solvents pertain to “dry” anhydrous organic mono-solvents. The Abraham model equations for dichloromethane were obtained by combining the experimental molar solubility data, the gas-to-liquid partition coefficients calculated from the infinite dilution activity coefficients and the practical water-to-dichloromethane partition coefficients. The small quantity of water in the dichloromethane phase in the practical partitioning system did not appear to affect the organic solvent’s solubilizing properties.
The molar solubility data given in Table 1, combined with the experimental water-to-octanol partition coefficient, provide us with 26 experimental values and mathematical equations to use in the solute descriptor computations. The two correlations describing the gas-to-water solute transfer processes, log (CS,water/CS,gas), that are given as the last entry in each of the two sections of Table 2—labeled “Equation (1) coefficients” and “Equation (2) coefficients”—can also be used in the solute descriptor computations. The first of the gas-to-water equations contains the V solute descriptor, while the second gas-to-water expression uses the L solute descriptor.
In total, 28 mathematical equations are available for calculating the 6 solute descriptors (E, S, A, B, V and L) for favipiravir. This number is more than sufficient to obtain a set of numerical values with predictive capabilities. The number of values to be calculated is further reduced by two because the McGowan characteristic volume, V, can be computed solely from the molecular formula and number of the chemical bonds in the molecule, as described elsewhere [43]. The E solute descriptor can be estimated using the software on the UFZ-LSER website [17]. As noted in the introduction, the software on the UFZ-LSER website can estimate all of the Abraham model solute descriptors from the canonical smiles code; however, the estimated values are not always very good for the S, A, B and L solute descriptors. The estimated values for the V and E solute descriptors, however, are much better. The values of V and E that we obtained using the canonical Smiles code for the enol tautomer (c1c(nc(c(n1)O)C(=O)N)F) are V = 0.9670 and E = 1.030 [17]. Nearly identical values of V = 0.9670 and E = 1.040 [17] were calculated from the canonical Smiles code of the ketone tautomer (FC1=CNC(C(C(N)=O)=N1)=O). The calculated value of the McGowan volume [43] will be the same for both tautomers because the enol and ketone forms contain the same number of chemical bonds, as well as the same number of carbon, hydrogen, oxygen, nitrogen and fluorine atoms. A value of E = 1.030 was used in the following calculations.
As part of our data analysis, we must also calculate the aqueous molar solubility, CS,water, and the gas phase concentration, CS,gas. These latter two molar solute concentrations are needed to calculate the molar solubility ratios that appear on the right-hand side of Equations (1) and (2), (CS,organic/CS,water) and (CS,organic/CS,gas). The 28 Abraham model expressions constructed from the molar solubility data in Table 1 and the equation coefficients from Table 2 were then solved simultaneously to give: E = 1.030; S = 1.284; A = 0.278; B = 0.639; V = 0.9670; L = 5.154; log CS,water = −2.283 and log CS,gas = −8.492. The overall standard error associated with the regression analysis was SE = 0.096 log units. Individual standard errors between the observed and back-calculated molar solubility ratios based on Equations (1) and (2) were SE = 0.097 and SE = 0.097, respectively.

3. Results

The small experiment-based A and B solute descriptors suggest that the favipiravir exhibits strong intramolecular H-bond formation in the 12 organic solvents for which mole fraction solubilities have been measured. It will be interesting to learn if the numerical values estimated using the group contribution and machine learning methods account for the possibility of intramolecular H-bond formation in the calculations. Solute descriptors were estimated for both the enol and ketone tautomers; the results are given below:
Enol tautomer:
UFZ-LSER estimation [17]: E = 1.03; S = 1.42; A = 0.80; B = 1.10; V = 0.9670; and
L = 5.302
Group contribution estimation [26]: E = 1.152; S = 1.554; A = 0.398; B = 1.012;
V = 0.9669; and L = 5.920
Machine learning estimation [26]: E = 1.160; S = 1.674; A = 0.624; B = 0.884; V = 0.9669;
and L = 6.093
Ketone tautomer:
UFZ-LSER estimation [17]: E = 1.04; S = 1.24; A = 0.69; B = 1.17; V = 0.9670; and
L = 5.283
Group contribution estimation [26]: E = 1.304; S = 1.898; A = 0.617; B = 1.264;
V = 0.9669; and L = 6.451
Machine learning estimation [26]: E = 1.203; S = 1.758; A = 0.691; B = 0.975; V = 0.9669;
and L = 6.153
Of the three estimation methods considered, the group contribution method on the MIT website provides the best set of estimated values, at least as far as the A solute descriptor is concerned. The B solute descriptor value, however, is significantly overestimated. Each set of estimated solute descriptors were used to predict the experimental molar solubility ratios. Predictions were made by letting the log CS,water and log CS,gas values float to their “optimized” values for each of the six estimated sets of solute descriptors. None of the six sets of estimated solute descriptors were able to predict the observed values to a standard error of less than 0.40 log units.
As part of our computations, we reanalyzed the experimental values in Table 1 using an assumed value of E = 1.152, which is the estimated value for the enol tautomer based on the group contribution method available on the MIT website [26]. The reanalysis yielded values of S = 1.321; A = 0.280; B = 0.648; V = 0.9669; L = 5.342, which were only slightly different than those obtained by assuming an E descriptor value of E = 1.040. Irrespective of which of the two numerical values are assumed for the E solute descriptor, one still obtains much smaller A and B descriptor values than expected. We attribute the smaller values to intramolecular hydrogen-bond formation, which is in accordance with the earlier DFT quantum-chemical calculations described in the published paper by Antonov [23].
In conclusion, our intent is to point out that the predictive methods for solute descriptors cannot properly account for intramolecular H-bond formation if the phenomenon was not learned during the training or if the input parameters—which for the three models considered here, were the canonical Smiles code—do not alert the method that intramolecular H-bond formation does occur. The data sets need to include a sufficient number of compounds exhibiting intramolecular hydrogen-bond formation for proper learning to take place. In the current paper, we have provided one additional example of an organic molecule that can exhibit intramolecular H-bond formation, in addition to possible keto-enol tautomerism. Tautomerism is important in the drug discovery process as it has been reported that approximately one-fifth of the molecules in drug discovery data sets exhibit tautomerism [44]. It is our hope that freely available group contribution and machine learning methods will reach the point where users can identify molecules that exhibit intramolecular H-bond formation as part of the structural input parameters and/or features. Based on our past experiences, we identify molecules that are likely candidates for intramolecular hydrogen-bond formation as those that contain H-bond donor and acceptor sites in sufficiently close proximity, such that the hydrogen-bond formation results in either a five- or six-membered ring. Users of such predictive methods should also be aware that poor predicted values might occur if structural information for the incorrect tautomeric form is used as an input parameter.

Author Contributions

Writing—original draft preparation, writing—review and editing, W.E.A.J.; formal data analysis, E.Y. All authors have read and agreed to the published version of the manuscript.

Funding

This research received no external funding.

Data Availability Statement

Data are contained within the article.

Acknowledgments

E.Y. thanks the University of North Texas’s Texas Academy of Mathematics and Science (TAMS) program for providing a summer research scholarship award.

Conflicts of Interest

The authors have no conflict of interest to declare.

References

  1. Yalamanchi, K.K.; van Oudenhoven, V.C.O.; Tutino, F.; Monge-Palacios, M.; Alshehri, A.; Gao, X.; Sarathy, S.M. Machine learning to predict standard enthalpy of formation of hydrocarbons. J. Phys. Chem. A 2019, 123, 8305–8313. [Google Scholar] [CrossRef]
  2. Trinh, C.; Meimaroglou, D.; Lasala, S.; Herbinet, O. Machine learning for the prediction of the thermo-chemical properties (enthalpy and entropy of formation) of a molecule from its molecular descriptors. Comp. Aided Chem. Eng. 2022, 51, 1471–1476. [Google Scholar] [CrossRef]
  3. Alshehri, A.S.; Tula, A.K.; You, F.; Gani, R. Next generation pure component property estimation models: With and without machine learning techniques. AIChE J. 2022, 68, e17469. [Google Scholar] [CrossRef]
  4. Grambow, C.A.; Li, Y.-P.; Green, W.H. Accurate thermochemistry with small data sets: A bond additivity correction and transfer learning approach. J. Phys. Chem. A 2019, 123, 5826–5835. [Google Scholar] [CrossRef] [PubMed] [Green Version]
  5. Kenney, D.H.; Paffenroth, R.C.; Timko, M.T.; Teixeira, A.R. Dimensionally reduced machine learning model for predicting single component octanol-water partition coefficients. J. Cheminform. 2023, 15, 9. [Google Scholar] [CrossRef] [PubMed]
  6. Kang, X.; Hu, B.; Perdana, M.C.; Zhao, Y.; Chen, Z. Extreme learning machine models for predicting the n-octanol/water partition coefficient (Kow) data of organic compounds. J. Environ. Chem. Eng. 2022, 10, 108552. [Google Scholar] [CrossRef]
  7. Sun, L.; Zhang, M.; Xie, L.; Gao, Q.; Xu, X.; Xu, L. In silico prediction of boiling point, octanol-water partition coefficient, and retention time index of polycyclic aromatic hydrocarbons through machine learning. Chem. Biol. Drug Des. 2023, 101, 52–68. [Google Scholar] [CrossRef]
  8. Pozzan, A. QM Calculations in ADMET Prediction. Methods Mol. Biol. 2020, 2114, 285–305. [Google Scholar] [CrossRef]
  9. Ferreira, L.L.G.; Andricopulo, A.D. ADMET modeling approaches in drug discovery. Drug Discov. Today 2019, 24, 1157–1165. [Google Scholar] [CrossRef] [PubMed]
  10. Tian, H.; Ketkar, R.; Tao, P. ADMETboost: A web server for accurate ADMET prediction. J. Mol. Model. 2022, 28, 408. [Google Scholar] [CrossRef]
  11. Matyushin, D.D.; Sholokhova, A.Y.; Buryak, A.K. Deep learning-based prediction of gas chromatographic retention indices for a wide variety of polar and mid-polar liquid stationary phases. Int. J. Mol. Sci. 2021, 22, 9194. [Google Scholar] [CrossRef]
  12. Wu, J.; Kang, Y.; Pan, P.; Hou, T. Machine learning methods for pKa prediction of small molecules: Advances and challenges. Drug Discov. Today 2022, 27, 103372. [Google Scholar] [CrossRef]
  13. Yang, Q.Q.; Li, Y.; Yang, J.D.; Liu, L.; Zhang, L.; Luo, S.; Cheng, J.-P. Holistic prediction of the pKa in diverse solvents based on a machine-learning approach. Solvation free energy and enthalpy. Angew. Chem. Int. Ed. 2020, 59, 19282–19291. [Google Scholar] [CrossRef] [PubMed]
  14. Chung, Y.; Vermeire, F.H.; Wu, H.; Walker, P.J.; Abraham, M.H.; Green, W.H. Group contribution and machine learning approaches to predict Abraham solute parameters, solvation free energy, and solvation enthalpy. J. Chem. Inf. Model. 2022, 62, 433–446. [Google Scholar] [CrossRef]
  15. Jaquis, B.J.; Li, A.; Monnier, N.D.; Sisk, R.S.; Acree, W.E., Jr.; Lang, A.S.I.D. Using machine learning to predict enthalpy of solvation. J. Solut. Chem. 2019, 48, 564–573. [Google Scholar] [CrossRef]
  16. Fowles, D.J.; Palmer, D.S. Solvation entropy, enthalpy and free energy prediction using a multi-task deep learning functional in 1D-RISM. Phys. Chem. Chem. Phys. 2023, 25, 6944–6954. [Google Scholar] [CrossRef] [PubMed]
  17. Ulrich, N.; Endo, S.; Brown, T.N.; Watanabe, N.; Bronner, G.; Abraham, M.H.; Goss, K.-U. UFZ-LSER Database v 3.2.1 [Internet], Leipzig, Germany, Helmholtz Centre for Environmental Research-UFZ. 2017. Available online: http://www.ufz.de/lserd (accessed on 27 May 2023).
  18. Sinha, S.; Yang, C.; Wu, E.; Acree, W.E., Jr. Abraham solvation parameter model: Examination of possible intramolecular hydrogen-bonding using calculated solute descriptors. Liquids 2022, 2, 131–146. [Google Scholar] [CrossRef]
  19. Acree, W.E., Jr.; Smart, K.; Abraham, M.H. Abraham model solute descriptors reveal strong intramolecular hydrogen bonding in 1,4-dihydroxyanthraquinone and 1,8-dihydroxyanthraquinone. Phys. Chem. Liq. 2018, 56, 416–420. [Google Scholar] [CrossRef]
  20. Cui, X.; Yan, Y.; Zhang, X. Solubility determination, model correlation, thermodynamic analysis, molecular dynamic simulation of Favipiravir in twelve pure solvents. J. Mol. Liq. 2023, 348, 122208. [Google Scholar] [CrossRef]
  21. Joshi, S.; Parkar, J.; Ansari, A.; Vora, A.; Talwar, D.; Tiwaskar, M.; Patil, S.; Barkate, H. Barkat, Role of favipiravir in the treatment of COVID-19. Int. J. Infect. Dis. 2021, 102, 501–508. [Google Scholar] [CrossRef]
  22. Deneva, V.; Slavova, S.; Kumanova, A.; Vassilev, N.; Nedeltcheva-Antonova, D.; Antonov, L. Favipiravir-tautomeric and complexation properties in solution. Pharmaceuticals 2023, 16, 45. [Google Scholar] [CrossRef]
  23. Antonov, L. Favipiravir tautomerism: A theoretical insight. Theor. Chem. Acc. 2020, 139, 145. [Google Scholar] [CrossRef] [PubMed]
  24. Shi, F.; Li, Z.; Kong, L.; Xie, Y.; Zhang, T.; Xu, W. Synthesis and crystal structure of 6-fluoro-3-hydroxypyrazine-2-carboxamide. Drug Discov. Ther. 2014, 8, 117–120. [Google Scholar] [CrossRef] [PubMed] [Green Version]
  25. Seo, M.; Park, J.; Kim, S.M. Self-assembly driven by an aromatic primary amide motif. Org. Biomol. Chem. 2012, 10, 5332–5342. [Google Scholar] [CrossRef]
  26. Solvation Tools. Available online: https://rmg.mit.edu/database/solvation/search/ (accessed on 15 July 2023).
  27. Megahed, S.M.; Habib, A.A.; Hammad, S.F.; Kamal, A.H. Experimental design approach for development of spectrofluorimetric method for determination of favipiravir; a potential therapeutic agent against COVID-19 virus: Application to spiked human plasma. Spectrochim. Acta, Part A 2021, 249, 119241. [Google Scholar] [CrossRef]
  28. Wang, X.; Wang, L.; Yao, C.; Xie, G.; Song, S.; Li, H.; Qu, Y.; Tao, X. Novel formulations of the antiviral drug favipiravir: Improving permeability and tabletability. Cryst. Growth Des. 2021, 21, 3807–3817. [Google Scholar] [CrossRef]
  29. Deyab, M.A.; El-Shamy, O.A.A.; Thabet, H.K.; Ashmawy, A.M. Electrochemical and theoretical investigations of favipiravir drug performance as ecologically benign corrosion inhibitor for aluminum alloy in acid solution. Sci. Rep. 2023, 13, 8680. [Google Scholar] [CrossRef]
  30. Pari, A.A.; Yousefi, M. Interactions between favipiravir and a BNC cage towards drug delivery applications. Struct. Chem. 2022, 33, 159–167. [Google Scholar] [CrossRef]
  31. Mishra, G.P.; Panigrahi, D. Computational studies of drugs for possible action against Covid-19 infections. J. Drug Deliv. Ther. 2020, 10, 99–105. [Google Scholar] [CrossRef]
  32. SciFinder; Chemical Abstracts Service: Columbus, OH. Available online: https://scifinder.cas.org (accessed on 28 July 2023).
  33. Green, C.E.; Abraham, M.H.; Acree, W.E., Jr.; De Fina, K.M.; Sharp, T.L. Solvation descriptors for pesticides from the solubility of solids: Diuron as an example. Pest Manag. Sci. 2000, 56, 1043–1053. [Google Scholar] [CrossRef]
  34. Abraham, M.H.; Green, C.E.; Acree, W.E., Jr.; Hernandez, C.E.; Roy, L.E. Descriptors for solutes from the solubility of solids: Trans-stilbene as an example. J. Chem. Soc. Perkin Trans. 2 1998, 2677–2682. [Google Scholar] [CrossRef] [Green Version]
  35. Abraham, M.H.; Benjelloun-Dakhama, N.; Gola, J.M.R.; Acree, W.E., Jr.; Cain, W.S.; Cometto-Muniz, J.E. Solvation descriptors for ferrocene, and the estimation of some physicochemical and biochemical properties. New J. Chem. 2000, 24, 825–829. [Google Scholar] [CrossRef]
  36. Jalan, A.; Ashcraft, R.W.; West, R.H.; Green, W.H. Predicting solvation energies for kinetic modeling. Annu. Rep. Prog. Chem. Sec. C Phys. Chem. 2010, 106, 211–258. [Google Scholar] [CrossRef]
  37. Clarke, E.D.; Mallon, L. The determination of Abraham descriptors and their application to crop protection research. In Modern Methods in Crop Protection Research; Jeschke, P., Krämer, W., Schirmer, U., Witschel, M., Eds.; Wiley: New York, NY, USA, 2012. [Google Scholar]
  38. Clarke, E.D. Beyond physical properties—Application of Abraham descriptors and LFER analysis in agrochemical research. Bioorg. Med. Chem. 2009, 17, 4153–4159. [Google Scholar] [CrossRef]
  39. Poole, C.F.; Ariyasena, T.C.; Lenca, N. Estimation of the environmental properties of compounds from chromatographic properties and the solvation parameter method. J. Chromatogr. A 2013, 1317, 85–104. [Google Scholar] [CrossRef]
  40. Poole, C.F.; Atapattu, S.N. Recent advances for estimating environmental properties for small molecules from chromatographic measurements and the solvation parameter model. J. Chromatogr. A 2023, 1687, 463682. [Google Scholar] [CrossRef]
  41. Endo, S.; Goss, K.-U. Applications of polyparameter linear free energy relationships in environmental chemistry. Environ. Sci. Technol. 2014, 48, 12477–12491. [Google Scholar] [CrossRef]
  42. Moshikur, R.M.; Ali, K.; Wakabayashi, R.; Moniruzzaman, M.; Goto, M. Favipiravir-based ionic liquids as potent antiviral drugs for oral delivery: Synthesis, solubility, and pharmacokinetic evaluation. Mol. Pharm. 2021, 18, 3108–3115. [Google Scholar] [CrossRef]
  43. Abraham, M.H.; McGowan, J.C. The use of characteristic volumes to measure cavity terms in reversed phase liquid chromatography. Chromatographia 1987, 23, 243–246. [Google Scholar] [CrossRef]
  44. Martin, Y.C. Experimental and pKa prediction aspects of tautomerism of drug-like molecules. Drug Discov. Today Technol. 2018, 27, 59–64. [Google Scholar] [CrossRef]
Figure 1. The top two molecular structures represent the enol and ketone tautomers of favipiravir. The bottom two molecular structures depict potential intramolecular hydrogen-bond formation, which is shown by the dashed lines between the hydrogen and oxygen atoms.
Thermo 03 00027 g001
Table 1. Logarithms of the published experimental molar solubilities, log CS,organic, and logarithms of the water-to-1-octanol partition coefficient, log P, for favipiravir dissolved in select organic solvents at 298.15 K.
Solventlog CS,organicLog P
1-Octanol (wet) 0.72
Methanol−1.428
Ethanol−1.373
1-Propanol−1.581
2-Propanol−1.594
1-Butanol−1.493
Acetone−1.203
Acetonitrile−1.450
Dichloromethane−1.377
N,N-Dimethylformamide−0.827
Methyl acetate−1.292
Ethyl acetate−1.396
Butyl acetate−1.412
Table 2. Abraham Model Equation Coefficients in Equation (1) and Equation (2) for Various Processes.
Solventcesablv
Equation (1) Coefficients
1-Octanol (wet)0.0880.562−1.0540.034−3.4600.0003.814
Methanol (dry)0.2760.334−0.7140.243−3.3200.0003.549
Ethanol (dry)0.2220.471−1.0350.326−3.5960.0003.857
1-Propanol (dry)0.1390.405−1.0290.247−3.7670.0003.986
1-Butanol (dry)0.1650.401−1.0110.056−3.9580.0004.044
2-Propanol (dry)0.0990.344−1.0490.406−3.8270.0004.033
Methyl acetate (dry)0.3510.223−0.150−1.035−4.5270.0003.972
Ethyl acetate (dry)0.3280.314−0.348−0.847−4.8990.0004.142
Butyl acetate (dry)0.2890.336−0.501−0.913−4.9640.0004.262
Acetone (dry)0.3130.312−0.121−0.608−4.7530.0003.942
Acetonitrile (dry)0.4130.0770.326−1.566−4.3910.0003.364
N,N-Dimethylformamide (dry)−0.305−0.0580.3430.358−4.8650.0004.486
Dichloromethane (dry)0.3190.102−0.187−3.058−4.0900.0004.324
Gas-to-water−0.9940.5772.5493.8134.8410.000−0.869
Equation (2) Coefficients
1-Octanol (wet)−0.1980.0020.7093.5191.4290.8580.000
Methanol (dry)−0.039−0.3381.3173.8261.3960.7730.000
Ethanol (dry)0.017−0.2320.8673.8941.1920.8460.000
1-Propanol (dry)−0.042−0.2460.7493.8881.0760.8740.000
1-Butanol (dry)−0.004−0.2850.7683.7050.8790.8900.000
2-Propanol (dry)−0.048−0.3240.7134.0361.0550.8840.000
Methyl acetate (dry)0.134−0.4771.7492.6780.0000.8760.000
Ethyl acetate (dry)0.171−0.4031.4282.7260.0000.9140.000
Butyl acetate (dry)0.154−0.4391.2232.5860.0000.9530.000
Acetone (dry)0.127−0.3871.7333.0600.0000.8660.000
Acetonitrile (dry)0.192−0.5721.4920.4600.8470.9650.000
N,N-Dimethylformamide (dry)−0.391−0.8692.1073.7740.0001.0110.000
Dichloromethane (dry)−0.007−0.5952.4612.0850.4180.7380.000
Gas-to-water−1.2710.8222.7433.9044.814−0.2130.000
Disclaimer/Publisher’s Note: The statements, opinions and data contained in all publications are solely those of the individual author(s) and contributor(s) and not of MDPI and/or the editor(s). MDPI and/or the editor(s) disclaim responsibility for any injury to people or property resulting from any ideas, methods, instructions or products referred to in the content.

