
A New Look at Physico-Chemical Causes of Changing Climate: Is the Seasonal Variation in Seawater Temperature a Significant Factor in Establishing the Partial Pressure of Carbon Dioxide in the Earth’s Atmosphere?


Abstract
1. Introduction
2. Background
2.1. Thermodynamics of CO2 in Seawater
2.2. Effects of Temperature on Physical K Values Controlling Steady State Conditions
3. Materials and Methods
3.1. Modelling Strategy and Assumptions
- K0 = [CO2]/fCO2 ≈ [CO2]/[pCO2, atm] relating the CO2 dissolved in seawater and air
- KB = [B(OH)4−][H+]/[B(OH)3] for borate alkalinity
- Kw = [H+][OH−] for dissociation of water
- K1 = [H+][HCO3−]/[CO2] for interconversion of CO2 and bicarbonate
- K2 = [H+][CO3−Ω2−]/[HCO3−] for interconversion of bicarbonate and carbonate
- Ksp = [Ca2+][CO32−] as solubility product of calcite or anhydrous CaCO3
- (i)
- Thermal modelling is not designed to match reality with respect to seasonal dates. Fortnightly periods are used, each period assumed to be separated from the previous by an equal increment in temperature. The primary purpose of the modelling is to estimate effects of temperature variation on carbonate chemistry by season, approximating months and seasons by maxima and minima in temperature or CO2 concentration. The qualitative results in terms of DIC concentrations or alkalinity are then employed for reasoning regarding causes and effects.
- (ii)
- Calcite dissolution in winter and precipitation in summer are assumed to be balanced with CO2 emission to the atmosphere in autumn and winter and absorption in spring and summer. This required an estimate of 65 m depth for the mixing zone in which oscillations of calcite and DIC concentrations occur. Each meter depth (cubic meter) is assumed to contain about 1000 (near 1025) kg of seawater per square meter of surface, so approximately 1000 times molal values are given for each meter of depth, or some 65 times this amount for the entire surface mixed layer.
- (iii)
- Equal increments of calcite dissolution and precipitation are given numerically as fortnightly jumps, with adjustments to K values recalculated separately for changes in temperature and then atmospheric pCO2. The procedure makes inputs of carbonic alkalinity from calcite dissolution and then solves a quadratic equation for bicarbonate concentration, relating this to carbonate and CO2 concentration based on the new equilibrium constants with the incremental change in temperature. The quadratic equation is generated by equalities for carbonate concentration based on bicarbonate (Equation (10)).
- (iv)
- While the Thermal hypothesis is focussed on inorganic chemistry, it is not assumed that biogenic calcification and calcite dissolution is completely independent, or that processes of advection and convection in seawater do not contribute to these processes. Such processes may be essential in contributing to the scale of the abiotic processes proposed in Figure 2. Deciding the relative contributions to seasonal calcification and calcite dissolution may require future research given that we aim to show how physical effects of seasonal temperature variation may be needed to fully explain the relationship between the boundary layers of the ocean and the atmosphere.
3.2. Software
3.3. Solving Thermal Carbonic Concentrations
4. Results
4.1. Thermodynamics and Van’t Hoff Estimation of Enthalpy
4.2. Modelling the Thermal Hypothesis
4.3. Oscillation of pCO2 on Mauna Loa
4.4. Larger Oscillations at Point Barrow, Alaska
4.5. Comparing Cape Grim, Tasmania and Sites at Mauna Loa and Point Barrow
5. Discussion
5.1. Deciphering the Station ALOHA Data Sets as Establishing Non-Equilibrium between Air and Seawater
H2CO3 + CO32− → 2HCO3−
→ H2O + CO2
Ca2+ + CO32− → CaCO3
5.2. Interpreting Stoichiometry of Reaction between Bicarbonate and Calcium Ions
< = > CaCO3 + ΨCO32− + (1 + Ψ)(CH2O + O2) + 2(1 + Ψ)H+
5.3. Absence of Similar Data in the Southern Hemisphere
5.4. Weighing the Available Evidence
5.5. Ambivalence of the Anticorrelation with 13CO2
6. Conclusions
Supplementary Materials
Author Contributions
Funding
Data Availability Statement
Acknowledgments
Conflicts of Interest
References
- Harvey, L.D. Global Warming. The Hard Science; Prentice Hall: Harlow, UK, 2000. [Google Scholar]
- Emerson, S.; Hedges, J. Carbonate Chemistry. In Chemical Oceanography and Marine Carbon Cycle; Cambridge University Press: Cambridge, UK, 2008; pp. 101–133. [Google Scholar]
- Prentice, I.C.; Farquhar, M.J.R.; Fasham, M.L.; Goulden, M.L.; Heimann, M.; Jarmilla, V.J.; Kheshgi, H.S.; Le Quere, C.; Scholes, R.J.; Wallace, D.W.R. The carbon cycle and atmospheric carbon dioxide. In Climate Change, Chapter 3 The Scientific Basis, Contribution to the Third Assessment Report of the IPCC; Cambridge University Press: Cambridge, UK, 2001. [Google Scholar]
- Pales, J.C. The concentration of atmospheric carbon dioxide in Hawaii. J. Geophys. Res. 1965, 70, 6053–6076. [Google Scholar] [CrossRef]
- Keeling, C.D.; Wahlen, M.; van der Plicht, J. Interannual extremes in the rate of rise of atmospheric carbon dioxide since 1980. Nature 1995, 375, 666–670. [Google Scholar] [CrossRef]
- Foucher, P.Y.; Chédin, A.; Armante, R.; Boone, C.; Crevoisier, C.; Bernath, P. Carbon dioxide atmospheric profiles retrieved from space observation using ACE-FTS solar occultation instrument. Atmos. Chem. Phys. 2011, 11, 2455–2470. [Google Scholar] [CrossRef]
- Williams, N.L.; Juranek, L.W.; Feely, R.A.; Russell, J.L.; Johnson, K.S.; Hales, B. Assessment of the carbonate chemistry seasonal cycles in the Southern Ocean from persistent observational platforms. J. Geophys. Res. Oceans 2018, 123, 4833–4852. [Google Scholar] [CrossRef]
- Dore, J.E.R.; Sadler, D.W.; Church, M.J.; Karl, D.M. Physical and biogeochemical modulation of ocean acidification in the central North Pacific. Proc. Nat. Acad. Sci. USA 2009, 106, 12235–12240. [Google Scholar] [CrossRef] [PubMed]
- Barker, S.; Ridgwell, A. Ocean acidification. Nature Educ. Know. 2012, 3, 21. [Google Scholar]
- DeVries, T.; Holzer, M.; Primeau, F. Recent increase in oceanic carbon uptake driven by weaker upper ocean overturning. Nature 2017, 542, 215–218. [Google Scholar] [CrossRef]
- Mackay, D. Multimedia Environmental Models; The Fugacity Approach, 2nd ed.; Lewis Publishers: Boca Raton, FL, USA, 2001; p. 166. [Google Scholar]
- Dickson, A.G.; Sabine, C.L.; Christian, J.R. Guide to Best Practices for Ocean CO2 Measurements; PICES Special Publication 3, North Pacific Marine Science Organization: Sidney, Canada, 2007. [Google Scholar]
- Sander, R. Compilation of Henry’s Law constants (Version 4) for water as solvent. Atmos. Chem. Phys. 2015, 15, 4399–4981. [Google Scholar] [CrossRef]
- Moore, W.J. Physical Chemistry, 4th ed.; Prentice-Hall: Hoboken, NJ, USA, 1972. [Google Scholar]
- Berner, R.A. Activity coefficients of bicarbonate, carbonate and calcium ions in sea water. Geochim. Cosmochim. Acta 1965, 29, 947–965. [Google Scholar] [CrossRef]
- Wells, R.C. The solubility of calcite in water in contact with the atmosphere, and its variation with temperature. J. Wash. Acad. Sci. 1915, 5, 617–622. [Google Scholar]
- Mucci, A. The solubility of calcite and aragonite in seawater at various salinities, temperatures, and one atmosphere total pressure. Amer. J. Sci. 1985, 283, 780–799. [Google Scholar] [CrossRef]
- Plath, D.C.; Johnson, K.S.; PytKowicz, M. The solubility of calcite—Probably containing magnesium—In Seawater. Mar. Chem. 1980, 10, 9–29. [Google Scholar] [CrossRef]
- Millero, F.J.; Graham, T.B.; Huang, F.; Bustos-Serrano, H.; Pierrot, D. Dissociation constants of carbonic acid in seawater as a function of salinity and temperature. Mar. Chem. 2006, 100, 80–94. [Google Scholar] [CrossRef]
- Kane, R.P.; de Paula, E.R. Atmospheric CO2 changes at Mauna Loa, Hawaii. J. Atmos. Terres. Phys. 1996, 58, 1673–1681. [Google Scholar] [CrossRef]
- Feely, R.A.; Doney, S.C.; Cooley, S.R. Ocean acidification: Present conditions and future changes in a high-CO2 world. Oceanography 2009, 22, 36–47. [Google Scholar] [CrossRef]
- McConnaughey, T.A.; Whelan, J.F. Calcification generates protons for nutrient and bicarbonate uptake. Ear. Sci. Rev. 1997, 42, 95–117. [Google Scholar] [CrossRef]
- ZarKogiannis, S.D.; Iwasaki, S.; Rae, J.W.B.; Schmidt, M.; Mortyn, P.G.; Kontakiotis, G.; Hertzberg, J.E.; Rikaby, R.E.M. Calcification, dissolution and test properties of modern planktonic foraminifera from the central Atlantic Ocean. Front. Mar. Sci. 2022. [Google Scholar] [CrossRef]
- Raven, J.A.; Johnston, A.M.; Kübler, J.E.; Korb, R.; McInroy, S.G.; Handley, L.L.; Walker, D.I.; Beardall, J.; Clayton, M.N.; Vanderklift, M.; et al. Seaweeds in cold seas: Evolution and carbon acquisition. Ann. Bot. 2002, 90, 525–536. [Google Scholar] [CrossRef]
- Orr, J.C.; Epitalon, J.M.; Gattuso, J.P. Comparison of ten packages that compute ocean carbonate chemistry. Biogeosciences 2015, 12, 1483–1510. [Google Scholar] [CrossRef]
- Saruhashi, K. On the equilibrium concentration ratio of carbonic acid substances dissolved in natural water. Meteor. Geophys. 1955, 6, 38–65. [Google Scholar] [CrossRef]
- Gieskes, J.M. Effect of temperature on the pH of seawater. Limnol. Oceanog. 1969, 14, 679–685. [Google Scholar] [CrossRef]
- PytKowicz, R.M. Chemical solution of calcium carbonate in sea water. Amer. Zool. 1969, 9, 673–679. [Google Scholar] [CrossRef]
- Mehrbach, C.; Culberon, C.H.; Hawley, J.E.; PytKowicz, R.M. Measurement of the apparent dissociation constants of carbonic acid in seawater at atmospheric pressure. Limnol. Oceanog. 1973, 18, 897–907. [Google Scholar] [CrossRef]
- Bailey, N.; PapakyriaKou, T.N.; Bartels, C.; Wang, F. Henry’s Law constant for CO2 in aqueous sodium chloride solutions at 1 atm and sub-zero (Ceslsius) temperatures. Mar. Chem. 2018, 2017, 26–32. [Google Scholar] [CrossRef]
- Ingle, S.E. Solubility of calcite in the ocean. Mar. Chem. 1975, 3, 301–319. [Google Scholar] [CrossRef]
- Dickson, A.G.; Millero, F.J. A comparison of the equilibrium constants for dissociation of carbonic acid in seawater media. Deep Sea Res. 1987, 34, 1733–1743. [Google Scholar] [CrossRef]
- Dickson, A.G.; Goyet, C. Handbook of Methods for the Analysis of Various Parameters of the Carbon Dioxide System in Sea Water. Version 2; ORNL/CDIAC-74; Oak Ridge National Lab: Oak Ridge, TN, USA, 1994. [Google Scholar]
- Millero, F.J. Thermodynamics of the carbon dioxide system in the oceans. Geoch. Cosmo. Acta 1995, 59, 661–677. [Google Scholar] [CrossRef]
- Millero, F.; Huang, F.; Graham, T.; Pierrot, D. The dissociation of carbonic acid in NaCl solutions as a function of concentration and temperature. Geochim. Cosmochim. Acta 2007, 71, 46–55. [Google Scholar] [CrossRef]
- Kanwisher, J. pCO2 in sea water and its effect on the movement of CO2 in Nature. Tellus 1960, 12, 209–215. [Google Scholar] [CrossRef]
- Morin, S.; Marion, G.M.; von Glasow, R.; Voisin, D.; Bouchez, J.; Savarino, J. Precipitation of salts in freezing seawater and ozone depletion events: A status report. Atmos. Chem. Phys. 2009, 8, 9035–9060. [Google Scholar] [CrossRef]
- Hu, Y.B.; Wolf-Gladrow, D.A.; Dieckmann, G.S.; Völker, C.; Nehrke, G. A laboratory study of ikaite (CaCO3·6H2O) precipitation as a function of pH, salinity, temperature and phosphate concentration. Mar. Chem. 2014, 162, 10–18. [Google Scholar] [CrossRef]
- Takahashi, T.; Olafsson, J. Seasonal variation of CO2 and nutrients in the high-latitude surface oceans: A comparative study. Glob. Biogeochem. Cycl. 1993, 7, 843–878. [Google Scholar] [CrossRef]
- Zeebe, R.E.; Westbroek, P. A simple model for the CaCO3 saturation state of the ocean: The “Strangelove”, the “Neritan” and the “Cretan” ocean. Geochem. Geophys. Geosys. 2003, 4, 1–26. [Google Scholar] [CrossRef]
- Watson, S.A.; Fabricius, K.E.; Munday, P.L. Quantifying pCO2 in biological ocean acidification experiments: A comparison of four methods. PLoS ONE 2017, 12, 1–16. [Google Scholar] [CrossRef]
- Quay, P.; Stutsman, J. Surface layer carbon budget for the subtropical N. Pacific: δ13C constraints at station ALOHA. Deep. Sea Res. 2003, 50, 1045–1061. [Google Scholar] [CrossRef]
- Chen, S.; Sutton, A.J.; Hu, C. Quantifying the atmospheric CO2 forcing ffect on surface ocean pCO2 in the North Pacific subtropical gyre in the past two decades. Front. Mar. Sci. 2021, 8, 636861. [Google Scholar]
- Morowitz, H.J. Energy Flow in Biology. Biological Organization as a Problem in Thermal Physics; Ox Bow Press: Woodbridge, VA, USA, 1968. [Google Scholar]
- Sutton, A.J.; Sabine, C.L.; Maenner-Jones, S.; Lawrence-Slavas, N.; Meinig, C.; Feely, R.A.; Mathis, J.T.; Musielewicz, S.; Bott, R.; McLain, P.D.; et al. A high-frequency atmospheric and seawater pCO2 data set from 14 open-ocean sites using a moored autonomous system. Earth Syst.Sci. Data 2014, 6, 353–366. [Google Scholar] [CrossRef]
- Smith, S.V. Parsing the Oceanic Calcium Carbonate Cycle: A Net Atmospheric Carbon Dioxide Source, or a Sink; L&O e-Books; Anderson, M.R., Ed.; Association Sciences Limnology and Oceanography (ASLO): Waco, TX, USA, 2013. [Google Scholar] [CrossRef]
- Chen-Tung, A.; PytKowicz, R.M. On the total CO2-titration alkalinity-oxygen system in the Pacific Ocean. Nature 1979, 281, 362–365. [Google Scholar] [CrossRef]
- Subhas, A.V.; Adkins, J.F.; Rollins, N.E.; Naviaux, J.; Erez, J.; Berelson, W.M. Catalysis and chemical mechanisms of calcite dissolution in seawater. Proc. Natl. Acad. Sci. USA 2017, 114, 8175–8180. [Google Scholar] [CrossRef]
- Mustaffa, N.I.H.; Latif, M.T.; Wurl, O. The role of extracellular carbonic anhydrase in biogeochemical cycling: Recent advances and climate change reponses. Int. J. Mol. Sci. 2021, 22, 7413. [Google Scholar] [CrossRef]
- Loeb, N.G.; Manalo-Smith, N.; Su, W.; Shnkar, M.; Thomas, S. CERES Top-of Atmosphere Earth radiation budget climate data record: Accounting for in-orbit changes in instrument calibration. Remote Sens. 2016, 8, 182–196. [Google Scholar] [CrossRef]
- Takahashi, T.; Sutherland, S.C.; Chipman, D.W.; Goddard, J.G.; Cheng, H.; Newberger, T.; Sweeney, C.; Munro, D.R. Climatological distributions of pH, pCO2, total CO2, alkalinity, and CaCO3 saturation in the global surface ocean, and temporal changes at selected locations. Mar. Chem. 2014, 164, 95–125. [Google Scholar] [CrossRef]
- Burton, E.A.; Walter, L.M. Relative precipitation rates of aragonite and Mg calcite from seawater: Temperature or carbonate control? Geology 1987, 15, 111–114. [Google Scholar] [CrossRef]
- Zondervan, I.; Zeebe, R.E.; Rost, B.; Riebesell, U. Decreasing marine biogenic calcification: A negative feedback on rising; Atmospheric pCO2. Glob. Biogeochem. Cyc. 2001, 15, 507–516. [Google Scholar] [CrossRef]
- Chung, S.N.; Lee, K.; Feely, R.A.; Sabine, C.L.; Millero, F.J.; Wanninkhof, R.; Bullister, J.L.; Key, R.M.; Peng, T.H. Calcium carbonate budget in the Atlantic Ocean basrd on water column inorganic carbon chemistry. Glob. Biogeochem. Cyc. 2003, 17, 1093. [Google Scholar] [CrossRef]
- Gattuso, J.; Frankignoulle, M.; Bourge, I.; Romaine, S.; Buddemeier, R.W. Effect of calcium carbonate saturation of seawater on coral calcification. Glob. Planet Change 1998, 18, 37–46. [Google Scholar] [CrossRef]
- Buitenhuis, E.T.; Hashioka, T.; Le Quéré, C. Combined constraints on global ocean primary production using observations and models. Amer. Geophys. Union 2013, 27, 847–858. [Google Scholar] [CrossRef]
- Feely, R.A.; Byrne, P.H.; Archer, J.G.; Betzer, G.; Chen, T.A.; Gendron, J.F. Land Winter-summer variations in calcite and aragonite saturation in the northeast Pacific. Mar. Chem. 1988, 25, 227–241. [Google Scholar] [CrossRef]
- Fransner, F.; Gustafsson, E.; Tedesco, L.; Vichi, M.; Hordoir, R.; Roquet, F.; Spilling, K.; Kuznetsov, I.; Eilola, K.; Mörth, C.-M.; et al. Non-Redfieldian dynamics explain seasonal pCO2 drawdown in the gulf of Bothnia. J. Geophys. Res. Ocean 2017, 123, 166–168. [Google Scholar] [CrossRef]
- Earth System Research Laboratories. The Data: What 13C tells us. The Global View. Global Monitoring Laboratory; 2017. Available online: https://gml.noaa.gov/ccgg/isotopes/c13tellsus.html (accessed on 13 July 2022).
- Yumol, L.M.; Uchikawa, T.; Zeebe, R.E. Kinetic isotope effects during CO2 hydration: Experimental results for carbon and oxygen fractionation. Geochim. Cosmochim. Acta 2020, 279, 189–203. [Google Scholar] [CrossRef]
- Wanninkhof, R. Kinetic fractionation of the carbon isotopes 13C and 12C during transfer of CO2 from air to seawater. Tellus B Chem. Phys. Meteor. 1985, 37, 128–135. [Google Scholar] [CrossRef]
- Becker, M.; Steinhoff, T.; Kortzinger, A. A detailed view of the seasonality of stable carbon isotopes across the North Atlantic. Adv. Earth Space Sci. 2018, 32, 1406–1419. [Google Scholar] [CrossRef]
- Henzler, K.; Fetisov, E.O.; Galib, M.; Baer, M.D.; Legg, B.A.; Borca, C.; Xto, J.C.; Pin, S.; Fulton, J.L.; Schenter, G.K.; et al. Supersaturated calcium carbonate solutions are classical. Sci. Adv. 2018, 4, eaa06283. [Google Scholar] [CrossRef] [PubMed]
- Broecker, W.S.; Peng, T.H. Evaluation of the 13C constraint on the uptake of fossil fuel CO2 by the ocean. Glo. Biogeochem. Cyc. 1993, 7, 619–626. [Google Scholar] [CrossRef]
- Tans, P.P.; Berry, J.A.; Keeling, R.F. Oceanic 13C/12C observations: A new window on ocean CO2 uptake. Glob. Biogeochem. Cyc. 1993, 7, 353–368. [Google Scholar] [CrossRef]
- Quay, P.D.; Tilbrook, B.; Wong, C.S. Oceanic uptake of fossil fuel CO2: Carbon-13 evidence. Science 1992, 256, 74–79. [Google Scholar] [CrossRef] [PubMed]
- Weiss, R.F.; Jahnke, R.R.; Keeling, C.D. Seasonal effects of temperature and salinity on the partial pressure of CO2 in seawater. Nature 1982, 300, 511–513. [Google Scholar] [CrossRef]
- Ciais, P.; Sabine, C.; Balu, G.; Bopp, L.; Brovkin, V.; Canadell, J.; Chahabra, A.; Defries, R.; Galloway, J.; Heimann, M.; et al. Carbon and other biogeochemical cycles. In Climate Change; The Physical Science Basis Contribution of Working Group I to Fifth Assessment Report of the IPCC; Stocker, T.F., Qin, D., Plattner, G.-K., Tignor, M., Allen, S.K., Boschung, J., Nauels, A., Xia, Y., Bex, V., Midgley, P.M., Eds.; Cambridge University Press: Cambridge, UK, 2013. [Google Scholar]
- Middelberg, J.J.; Soetaert, K.; Hagens, M. Ocean alkalinity, buffering and biogeochemical processes. Rev. Geophys. 2020, 58, e2019RG000681. [Google Scholar] [CrossRef]
- Keeling, C.D. Is carbon dioxide from fossil fuel changing man’s environment? Proc. Amer. Philosoph. Soc. 1970, 114, 10–17. [Google Scholar]
- Watterson, I.G. The diurnal cycle of surface air temperature in simulated present and doubled CO2 climates. Clim. Dynam. 1997, 13, 533–545. [Google Scholar] [CrossRef]


| (a) | |||||||||
| Temperature | K0 = Zsw | pK1 | pK2 | Kw× 1014 | pKw | Ksp × 10−7 [Ca2+][CO32−] | µmolar CO2 in seawater | ||
| K | °C | ||||||||
| 278.15 | 5 | 0.05213 | 6.042 | 9.292 | 0.855 | 14.07 | 4.309 | 21.90 | |
| 283.15 | 10 | 0.04388 | 5.984 | 9.203 | 1.443 | 13.84 | 4.317 | 18.43 | |
| 288.15 | 15 | 0.03746 | 5.931 | 9.118 | 2.380 | 13.62 | 4.315 | 15.73 | |
| 293.15 | 20 | 0.03241 | 5.882 | 9.035 | 3.839 | 13.42 | 4.300 | 13.61 | |
| 298.15 | 25 | 0.02839 | 5.837 | 8.955 | 6.063 | 13.22 | 4.272 | 11.92 | |
| Results varying with temperature estimated with software in Supplementary Materials (Item 4) | |||||||||
| (b) | |||||||||
| Temperature | pK1 | ΔH° kJ/mol | ΔG° kJ/mol | ΔS° kJ/K | pK2 | ΔH° kJ/mol | ΔG° kJ/mol | ΔS° kJ/K/mol | |
| K | °C | ||||||||
| 278.15 | 5 | 6.042 | 17.490 | 32.301 | −0.053 | 9.292 | 26.837 | 49.672 | −0.081 |
| 283.15 | 10 | 5.984 | 9.203 | ||||||
| 288.15 | 15 | 5.931 | 16.273 | 32.698 | −0.057 | 9.118 | 26.751 | 50.152 | −0.081 |
| 293.15 | 20 | 5.882 | 9.035 | ||||||
| 298.15 | 25 | 5.837 | 15.059 | 33.160 | −0.061 | 8.955 | 26.771 | 50.900 | −0.082 |
| Jan | Feb | Mar | Apr | May | Jun | Jul | Aug | Sep | Oct | Nov | Dec | ||
|---|---|---|---|---|---|---|---|---|---|---|---|---|---|
| a | CO2 | 10.70 | 10.75 | 10.81 | 10.70 | 10.60 | 10.48 | 10.40 | 10.27 | 10.19 | 10.27 | 10.38 | 10.59 |
| B | HCO3− | 1740. | 1742 | 1745 | 1740 | 1735 | 1730 | 1727 | 1720 | 1716 | 1720 | 1726 | 1735 |
| C | CO32− | 214.8 | 213.9 | 212.7 | 214.8 | 217.3 | 219.8 | 221.7 | 224.9 | 226.5 | 224.9 | 222.0 | 217.3 |
| C | Sum | 1766 | 1967 | 1968 | 1966 | 1963 | 1961 | 1959 | 1955 | 1954 | 1955 | 1958 | 1963 |
| Ab | Borate | 2262 | 2261 | 2261 | 2262 | 2262 | 2263 | 2264 | 2265 | 2265 | 2265 | 2264 | 2262 |
| Ksp | ×10−7 | 4.27 | 4.27 | 4.28 | 4.27 | 4.27 | 4.27 | 4.27 | 4.27 | 4.26 | 4.26 | 4.27 | 4.27 |
| [Ca2+] | ×[CO32−] | 4.25 | 4.24 | 4.21 | 4.25 | 4.30 | 4.35 | 4.39 | 4.45 | 4.49 | 4,45 | 4.49 | 4.3 |
| Ω | Ratio | 0.995 | 0.991 | 0.985 | 0.995 | 1.007 | 1.020 | 1.029 | 1.045 | 1.052 | 1.045 | 1.030 | 1.007 |
| pH | 8.05 | 8.05 | 8.05 | 8.05 | 8.05 | 8.05 | 8.05 | 8.05 | 8.05 | 8.05 | 8.05 | 8.05 | |
| K | Temp.. | 298. | 297.8 | 297.6 | 298.0 | 298.4 | 298.8 | 299.1 | 299.6 | 299.8 | 299.6 | 299.1 | 298.4 |
| pCO2 | ppmv | 375.1 | 375.2 | 375.3 | 375.1 | 374.9 | 374.7 | 374.5 | 374.2 | 374.0 | 374.2 | 374.5 | 374.9 |
| Ac | Alkalinity | 2170 | 2170 | 2170 | 2170 | 2170 | 2170 | 2170 | 2170 | 2170 | 2170 | 2170 | 2170 |
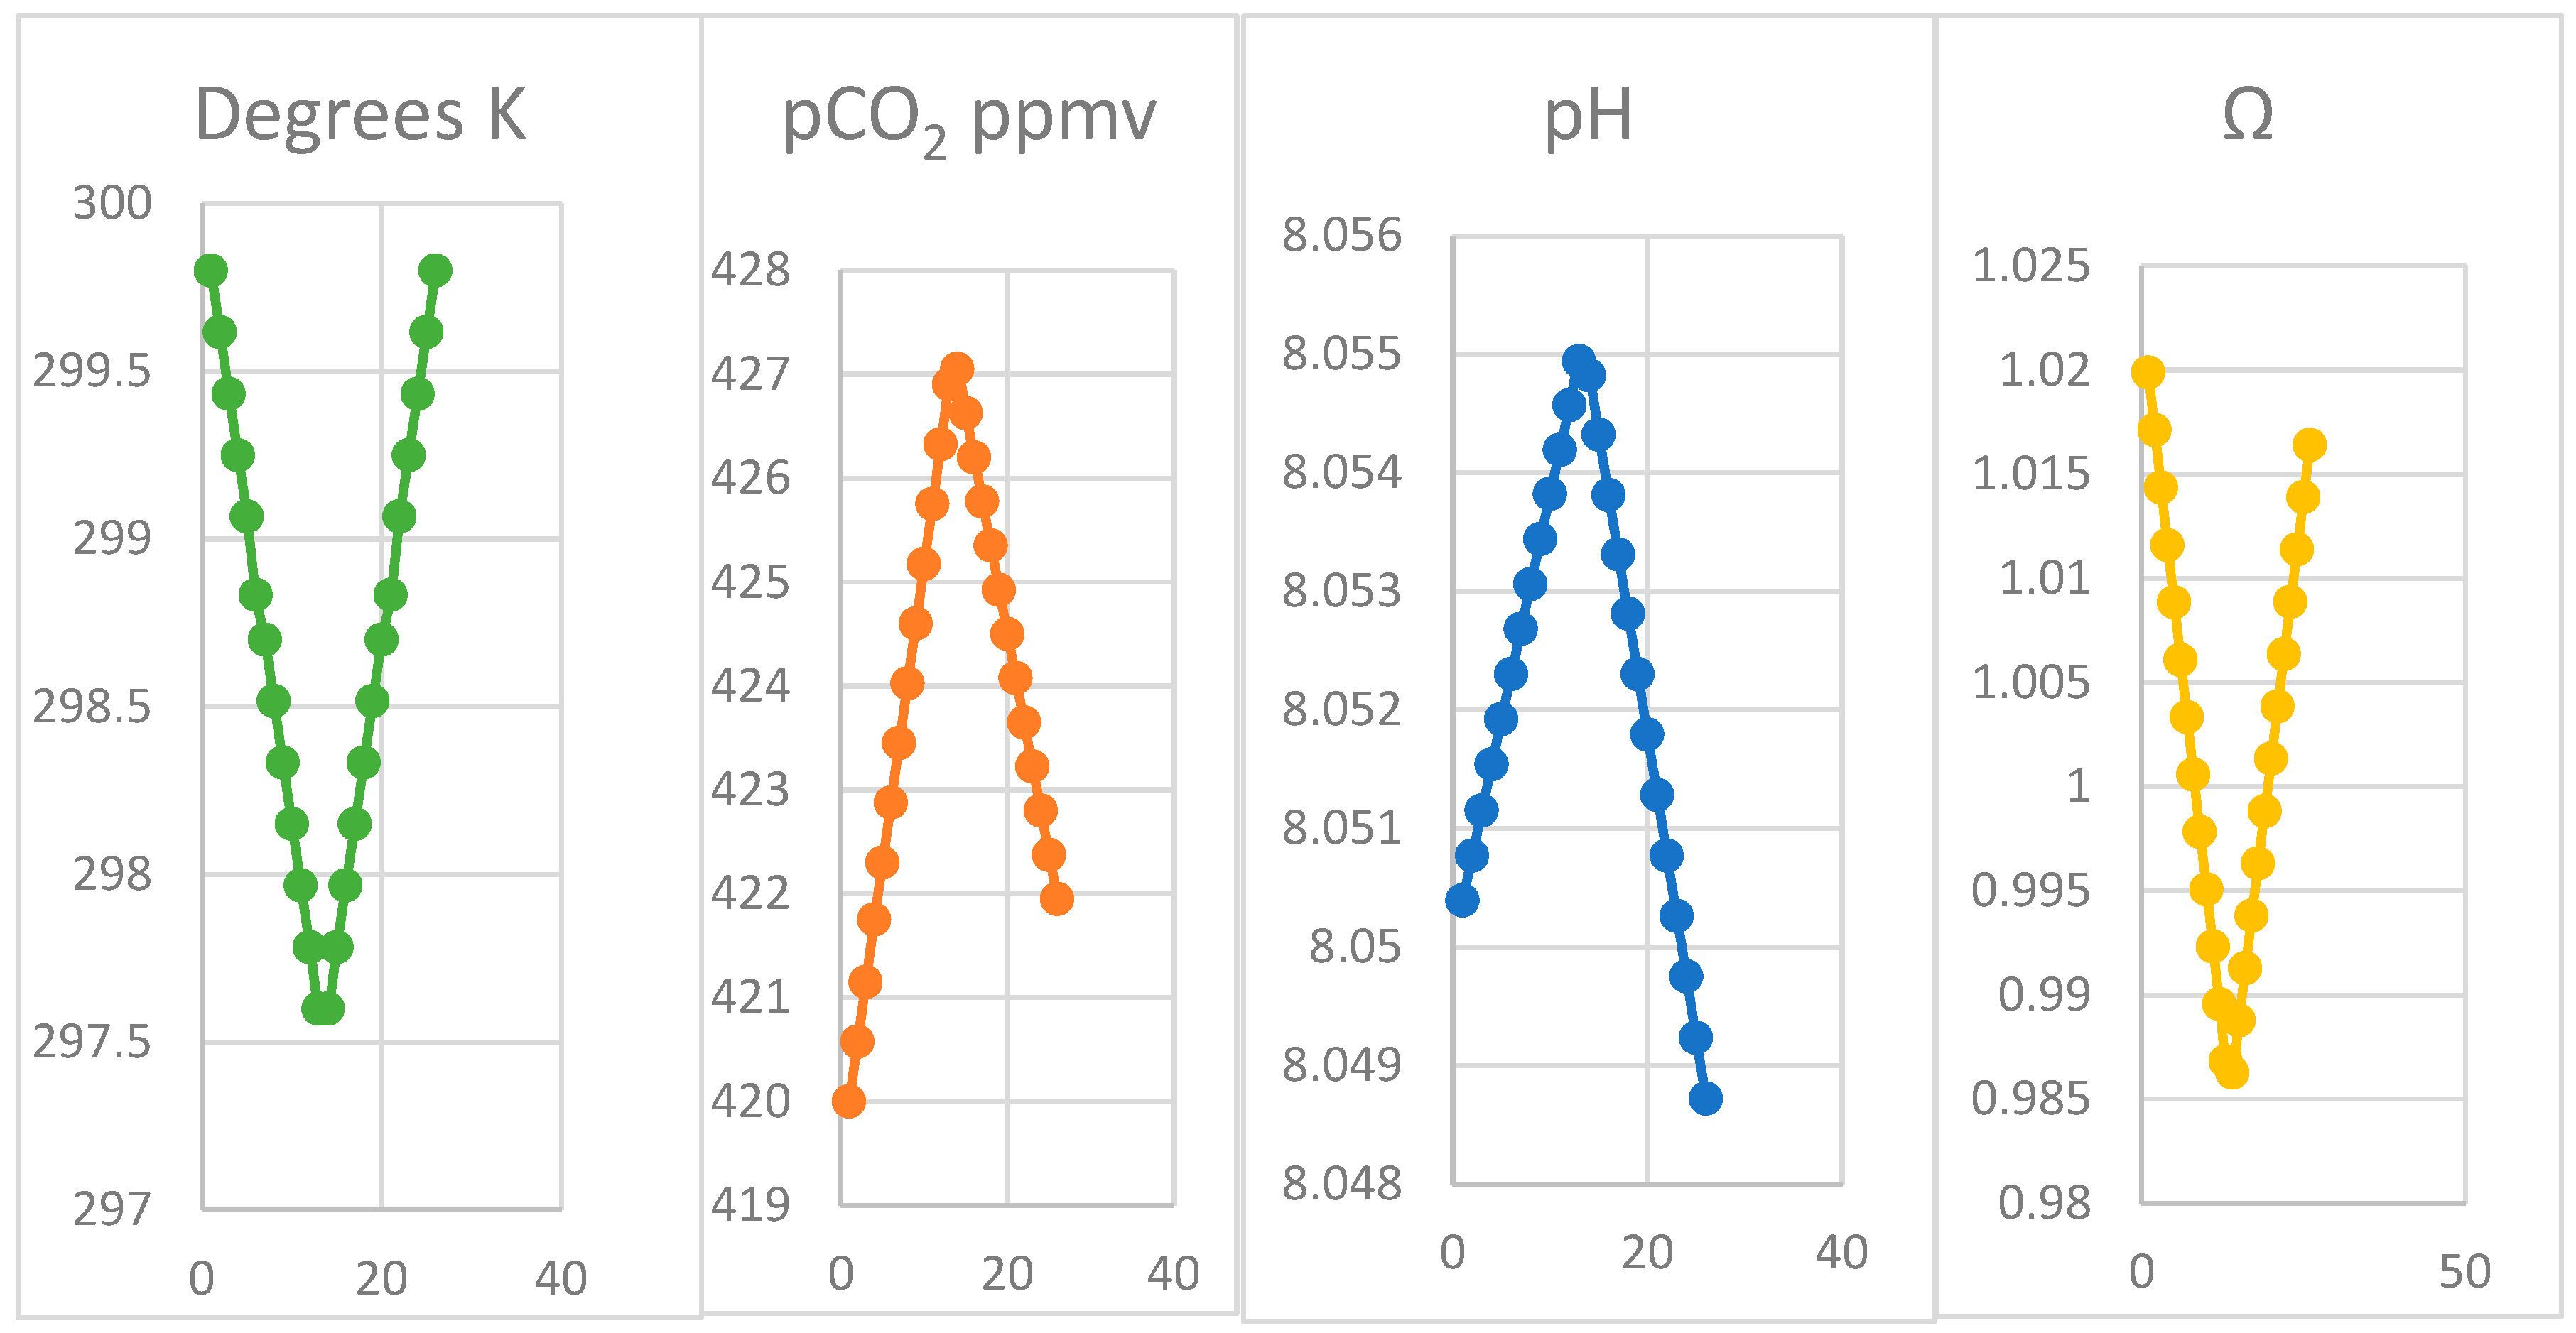
| Month | Oct | Nov | Dec | Jan | Feb | Mar | Apr | ||||||
|---|---|---|---|---|---|---|---|---|---|---|---|---|---|
| δT | 1 | 2 | 3 | 4 | 5 | 6 | 7 | 8 | 9 | 10 | 11 | 12 | 13 |
| a CO2 | 9.84 | 9.90 | 9.96 | 10.02 | 10.08 | 10.14 | 10.20 | 10.26 | 10.32 | 10.38 | 10.44 | 10.51 | 10.57 |
| b HCO3− | 1658 | 1664 | 1669 | 1675 | 1680 | 1686 | 1691 | 1697 | 1702 | 1708 | 1714 | 1719 | 1725 |
| c CO32− | 218.8 | 218.2 | 217.7 | 217.2 | 216.7 | 216.2 | 215.6 | 215.1 | 214.6 | 214.0 | 213.5 | 213.0 | 212.5 |
| DIC | 1887 | 1892 | 1897 | 1902 | 1907 | 1912 | 1917 | 1922 | 1927 | 1932 | 1938 | 1943 | 1948 |
| Ac | 2096 | 2107 | 2104 | 2109 | 2113 | 2118 | 2122 | 2127 | 2131 | 2136 | 2141 | 2145 | 2150 |
| Ab | 2191 | 2195 | 2199 | 2203 | 2207 | 2212 | 2216 | 2220 | 2224 | 2228 | 2233 | 2237 | 2241 |
| Ω | 1.017 | 1.014 | 1.011 | 1.008 | 1.006 | 1.003 | 1.000 | 0.997 | 0.995 | 0.992 | 0.989 | 0.987 | 0.984 |
| K | 299.8 | 299.6 | 299.4 | 299.3 | 299.1 | 298.8 | 298.7 | 298.5 | 298.3 | 298.2 | 298.0 | 297.8 | 297.6 |
| pCO2 | 420.0 | 420.6 | 421.2 | 421.8 | 422.3 | 422.9 | 423.5 | 424.0 | 424.6 | 425.2 | 425.8 | 426.3 | 426.9 |
| pH | 8.050 | 8.051 | 8.051 | 8.052 | 8.052 | 8.052 | 8.053 | 8.053 | 8.053 | 8.054 | 8.054 | 8.055 | 8.055 |
| (a) | ||||||||||
| Temperature | K0 = Zsw | Zair | Kaw = Zair/Zsw | Ksp × 10−7 [Ca2+][CO32−] | µCO2× 10−27 J | µM CO2 in dry air | ||||
| K | °C | |||||||||
| 278.15 | 5 | 0.05213 | 0.04324 | 0.8295 | 4.309 | −9.1660 | 18.16 | |||
| 283.15 | 10 | 0.04388 | 0.04248 | 0.9681 | 4.317 | −9.3482 | 17.84 | |||
| 288.15 | 15 | 0.03746 | 0.04174 | 1.1143 | 4.315 | −9.5307 | 17.53 | |||
| 293.15 | 20 | 0.03241 | 0.04103 | 1.2660 | 4.300 | −9.7135 | 17.23 | |||
| 298.15 | 25 | 0.02839 | 0.04034 | 1.4029 | 4.272 | −9.8966 | 16.94 | |||
| Zair shows inverse variation in temperature, at 420 ppmv; Zsw includes variation in solubility of CO2 in seawater; software in Supplementary Materials (Item 4). | ||||||||||
| (b) | ||||||||||
| Temperature | Kaw | ΔH° kJ/mol | ΔG° kJ/mol | ΔS° kJ/K | Ksp× 10−7 | ΔH° kJ/mol | ΔG° kJ/mol | ΔS° kJ/K/mol | ||
| K | °C | |||||||||
| 278.15 | 5 | 0.8295 | 20.234 | 0.249 | 0.071 | 4.309 | +2.241 | 34.198 | −0.121 | |
| 283.15 | 10 | 0.9681 | 4.317 | |||||||
| 288.15 | 15 | 1.1143 | 18.950 | −0.263 | 0.064 | 4.315 | +0.302 | 35.125 | −0.123 | |
| 293.15 | 20 | 1.2660 | 4.300 | |||||||
| 298.15 | 25 | 1.4029 | 14.923 | −0.709 | 0.059 | 4.272 | −0.970 | 36.042 | −0.125 | |
Publisher’s Note: MDPI stays neutral with regard to jurisdictional claims in published maps and institutional affiliations. |
© 2022 by the authors. Licensee MDPI, Basel, Switzerland. This article is an open access article distributed under the terms and conditions of the Creative Commons Attribution (CC BY) license (https://creativecommons.org/licenses/by/4.0/).
Share and Cite
Kennedy, I.R.; Runcie, J.W.; Zhang, S.; Ritchie, R.J. A New Look at Physico-Chemical Causes of Changing Climate: Is the Seasonal Variation in Seawater Temperature a Significant Factor in Establishing the Partial Pressure of Carbon Dioxide in the Earth’s Atmosphere? Thermo 2022, 2, 401-434. https://doi.org/10.3390/thermo2040028
Kennedy IR, Runcie JW, Zhang S, Ritchie RJ. A New Look at Physico-Chemical Causes of Changing Climate: Is the Seasonal Variation in Seawater Temperature a Significant Factor in Establishing the Partial Pressure of Carbon Dioxide in the Earth’s Atmosphere? Thermo. 2022; 2(4):401-434. https://doi.org/10.3390/thermo2040028
Chicago/Turabian StyleKennedy, Ivan R., John W. Runcie, Shuo Zhang, and Raymond J. Ritchie. 2022. "A New Look at Physico-Chemical Causes of Changing Climate: Is the Seasonal Variation in Seawater Temperature a Significant Factor in Establishing the Partial Pressure of Carbon Dioxide in the Earth’s Atmosphere?" Thermo 2, no. 4: 401-434. https://doi.org/10.3390/thermo2040028
APA StyleKennedy, I. R., Runcie, J. W., Zhang, S., & Ritchie, R. J. (2022). A New Look at Physico-Chemical Causes of Changing Climate: Is the Seasonal Variation in Seawater Temperature a Significant Factor in Establishing the Partial Pressure of Carbon Dioxide in the Earth’s Atmosphere? Thermo, 2(4), 401-434. https://doi.org/10.3390/thermo2040028