Communication

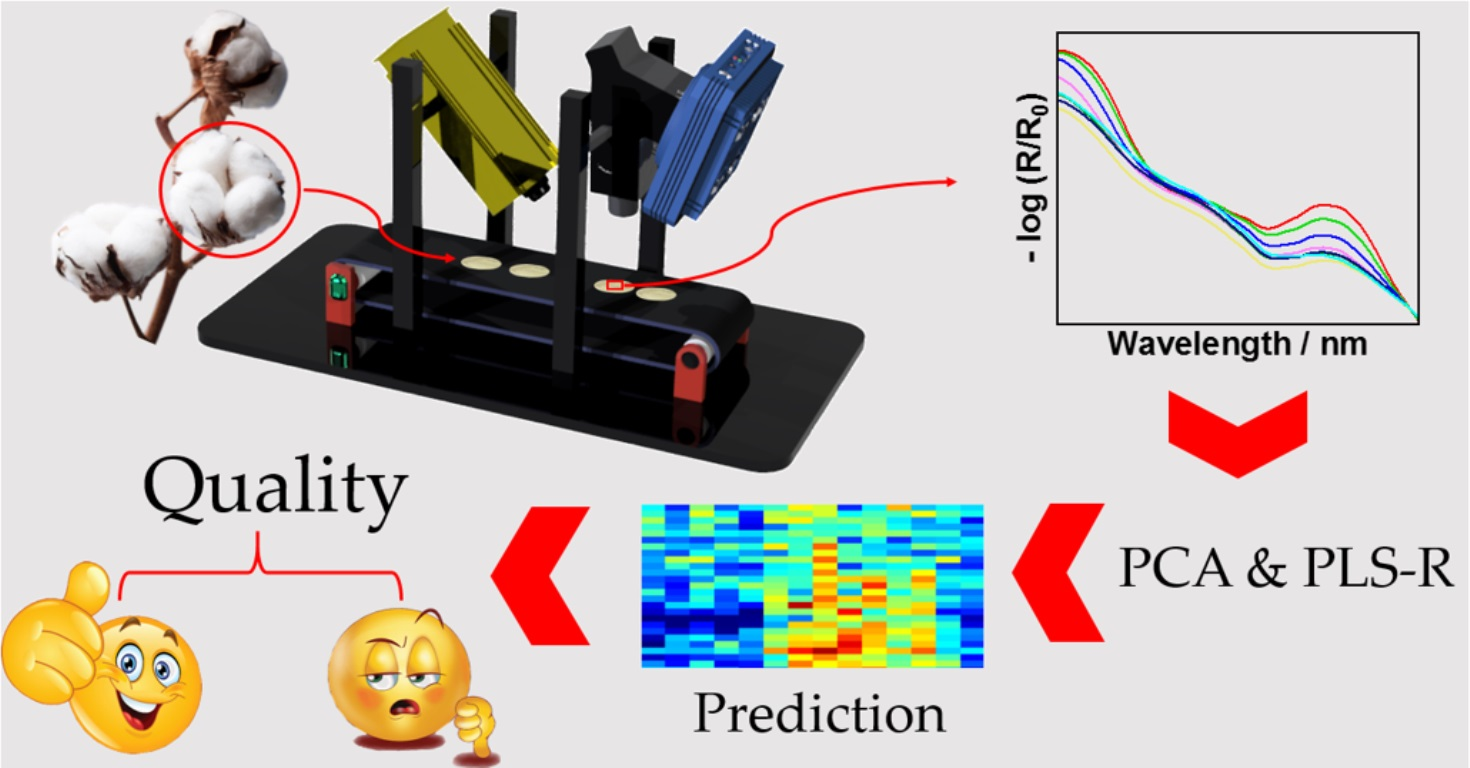
Applying UV Hyperspectral Imaging for the Quantification of Honeydew Content on Raw Cotton via PCA and PLS-R Models

1
Process Analysis and Technology PA & T, Reutlingen University, Alteburgstraße 150, 72762 Reutlingen, Germany
2
Institute of Physical and Theoretical Chemistry, Eberhard Karls University Tübingen, Auf der Morgenstelle 18, 72076 Tübingen, Germany
3
Texoversum Faculty Textile, Reutlingen University, Alteburgstraße 150, 72762 Reutlingen, Germany
*
Author to whom correspondence should be addressed.
These authors contributed equally to this work.
Textiles 2023, 3(3), 287-293; https://doi.org/10.3390/textiles3030019
Submission received: 19 April 2023 / Revised: 24 June 2023 / Accepted: 30 June 2023 / Published: 4 July 2023

Abstract

:
Cotton contamination by honeydew is considered one of the significant problems for quality in textiles as it causes stickiness during manufacturing. Therefore, millions of dollars in losses are attributed to honeydew contamination each year. This work presents the use of UV hyperspectral imaging (225–300 nm) to characterize honeydew contamination on raw cotton samples. As reference samples, cotton samples were soaked in solutions containing sugar and proteins at different concentrations to mimic honeydew. Multivariate techniques such as a principal component analysis (PCA) and partial least squares regression (PLS-R) were used to predict and classify the amount of honeydew at each pixel of a hyperspectral image of raw cotton samples. The results show that the PCA model was able to differentiate cotton samples based on their sugar concentrations. The first two principal components (PCs) explain nearly 91.0% of the total variance. A PLS-R model was built, showing a performance with a coefficient of determination for the validation (R2cv) = 0.91 and root mean square error of cross-validation (RMSECV) = 0.036 g. This PLS-R model was able to predict the honeydew content in grams on raw cotton samples for each pixel. In conclusion, UV hyperspectral imaging, in combination with multivariate data analysis, shows high potential for quality control in textiles.

Graphical Abstract

1. Introduction

Cotton is widely regarded as an essential natural material in various textile products, from fabrics to clothing [1,2]. It is considered one of the most imported and exported materials worldwide [3]. Therefore, an assessment of the cotton quality is needed. Cotton contamination is one of the most significant problems for quality [1,4,5,6,7,8,9,10]. The most relevant impurities in raw cotton arise from insects producing honeydew. Honeydew is sugar-rich, excreted by whiteflies and aphids, and causes stickiness during manufacturing [11]. Therefore, it can cause problems during processing, and the final product shows low quality. Modern techniques and methods have appeared due to the increasing demand for higher processing and quality control. These include off-line methods such as thermogravimetric analysis and single-point spectroscopy. However, these techniques are slow and time-consuming [12,13,14,15,16,17,18]. In contrast, in- and on-line methods, such as hyperspectral imaging, are non-destructive and rapid, enabling real-time data acquisition and analysis [3]. Hyperspectral imaging is a type of spectroscopic imaging that allows for the collection and analysis of massive amounts of data spanning a wide wavelength range. It involves both spectral and spatial information at high resolutions. Hyperspectral imaging generates large amounts of data, requiring multivariate data analysis techniques such as principal component analysis (PCA) and partial least squares regression (PLS-R) [19]. PCA can identify and visualize groups within data clusters, while PLS-R is used to build quantitative models and generate data clusters. It is also helpful for evaluating the robustness of these models, making it a powerful tool for data analysis. Combining these two techniques is often required to analyze and interpret the results of high-resolution hyperspectral imaging effectively [3,5,20,21,22,23]. In a previous study, we developed a method using UV imaging to predict the quantity of honeydew on cotton samples. The approach involved using a xenon-arc lamp to quantify the amount of honeydew in the UV-A and UV-B ranges. However, it could not accurately detect the honeydew in the UV-C range due to the lamp’s intensity limitations [19]. In this study, we overcome this limitation by using a deuterium lamp as a light source. Mechanically cleaned cotton was soaked with in a sugar- and protein-containing solution at different concentrations that are typical for honeydew. Chemometric models such as PCA and PLS-R were established using UV hyperspectral images. The cotton samples were categorized by sugar concentration using PCA, while PLS-R was used to correlate UV spectra with sugar concentration. The PLS-R model accurately predicted the amount of honeydew in grams on the raw cotton samples.

2. Materials and Methods

2.1. Chemicals and Preparation of Solutions and Samples

The sugar and protein solutions applied to the cotton samples were formulated to mimic natural honeydew [24,25,26]. First, 0.2 g of each macronutrient (glucose, fructose, sucrose, melezitose, trehalose, and protein) was weighed and dissolved in 10 mL of deionized water. A sixfold serial dilution was prepared in 50 mL volumetric flasks by mixing 25 mL of the previous solution with 25 mL of deionized water for 2 min at each dilution step (Table 1).
In total, 24 mechanically cleaned cotton samples were prepared with a weight of 0.3 g ± 1 mg of each sample. The samples were dried in a vacuum oven (Vacutherm VT 6130 M, Thermo Fisher Scientific Inc., Waltham, MA, USA) at 30 °C and 50 mbar for 8 h to remove absorbed humidity. Then, 4 mL of the aforementioned solution was used to soak three samples per concentration. The samples were dried again in a desiccator at room temperature for one month.
Raw cotton samples were collected by ICA Bremen GmbH (Bremen, Germany) to test the model’s predictive power. The samples were chosen according to their honeydew content in the levels light, strong, and very strong [19]. The sample types were named from A to F, and there was one mechanically cleaned (CLN) sample. Of the samples, A had the highest concentration of sugar and protein solution (4 wt %), and G had the lowest concentration (0.0625 wt %) (Table 1). The average ratios of sugar mass to dried cotton mass (msugar/mcotton) remaining on the samples were calculated after drying the samples for one month (Table 1). The term macronutrients is omitted when describing the solution and replaced with the short term “sugar” for the sample nomenclature.

2.2. UV Hyperspectral Imaging Setup and Data Processing

Compared to our previous studies [19,20,21], the illumination of the hyperspectral imaging setup was modified; for the present study, a deuterium lamp (SL 3, StellarNet Inc., 24 V, 65.04 W, Tampa, FL, USA) was used, providing a higher illumination strength in the UV-C region compared to the xenon-arc lamp (e.g., an intensity difference for the deuterium lamp of around 230 higher than the xenon-arc lamp). Thus, the PTFE tunnel covering the convey belt for increasing the illumination strength was no longer necessary.
A multivariate data analysis was carried out using “Aspen UnscramblerTM, version 10.5.1” (Aspen Technology Inc., Bedford, MA, USA). The PCA model was calculated with mean centering, cross-validation, and the NIPALS algorithm. A PLS-R model for the sugar concentrations was processed with mean centering, a category variable with eight segmented cross-validations, and the kernel algorithm.

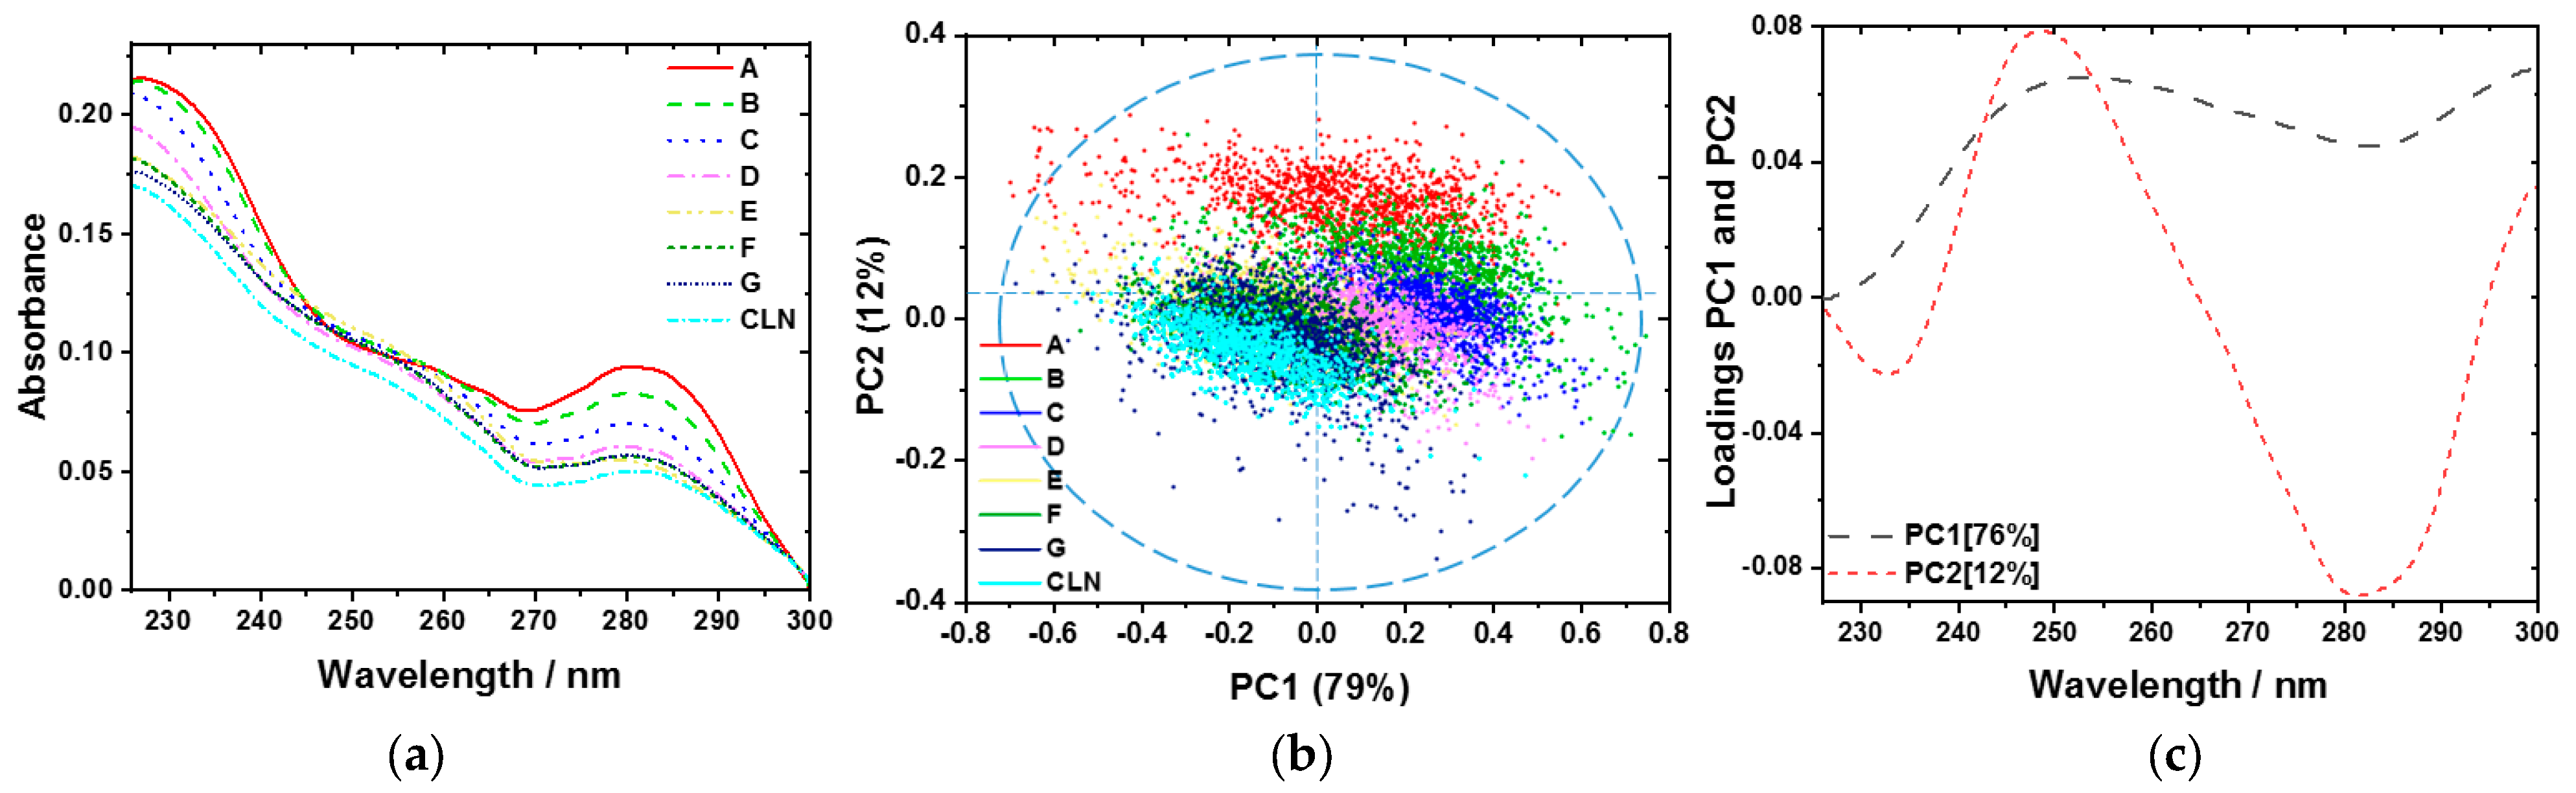
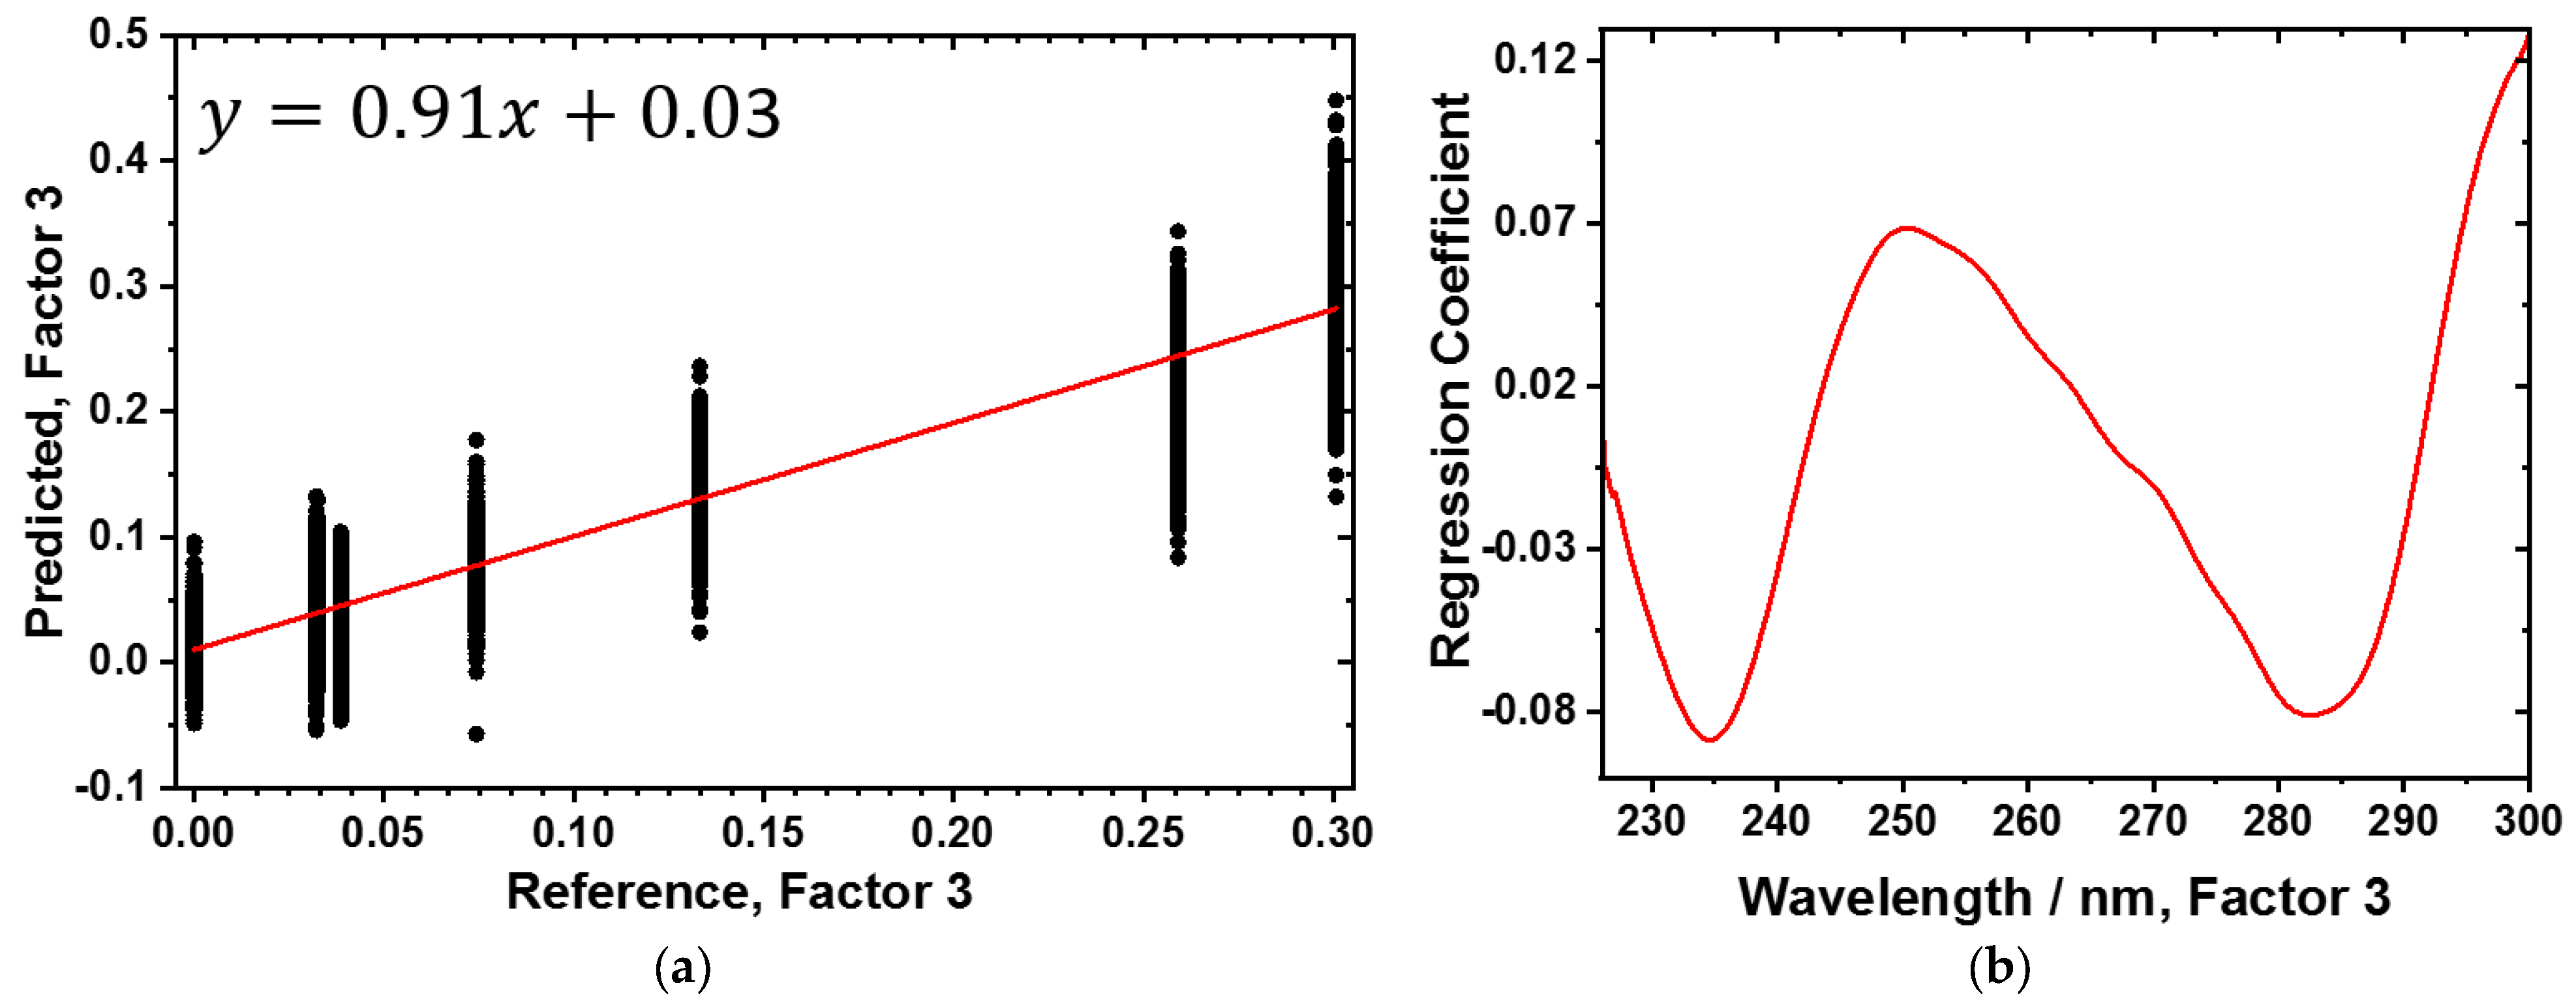
3. Results and Discussion

The averaged absorbance spectra in terms of reflectance after a linear baseline correction are shown in Figure 1a. The spectra show an almost linear decrease in the reflectivity for all sugar concentrations. In the range of 275 nm and 295 nm are broad bands showing clear dependences on the sugar concentration. These bands can be assigned to protein, cellulose, and lignin. A much weaker band between 230–255 nm corresponds to the presence of pectin and DNA [27,28,29,30].
Figure 1b,c present the cotton samples’ PCA model at each sample pixel with different sugar concentrations. Figure 1b shows the scores plot for the first (79.0%) and second (12.0%) principal components (PCs). These PCs explain nearly 91.0% of the total variance.
The PCA scores enable us to distinguish different sugar concentrations on cotton. On PC1, high sugar concentrations are separated from low concentrations, while on PC2, the mechanically cleaned sample (CLN) shows a distinct separation from the samples with high sugar concentrations. Moreover, different sugar concentrations on cotton can clearly be distinguished via the PC2. An overlap naturally results from the preparation method chosen, which results in a certain inhomogeneity. With decreasing concentration, the degree of overlap between samples increases together with the variance within the samples. Each cluster shows an overlap with the two nearest sugar concentrations (higher and lower). Figure 1c shows the loadings plots for PC1 and PC2. The most significant differences between those loadings are found between 250 and 280 nm in the spectral region. The maximum influence on PC1 occurs at 250 nm, and the minimum occurs at 283 nm. Most of PC1 describes a clear dependence on the concentrations of sugar on the cotton samples. PC2 has a maximum at 249 nm and a minimum at 282 nm. These bands represent the chromophores, pectin, and DNA in the cotton fibers [2,27].
PLS-R was utilized as a technique for quantitative spectroscopic analysis. A PLS-R model was developed using a calibration sample set of 24 samples to establish a correlation between the spectral information and the sugar content. The PLS-R model’s performance was tested using cotton samples (Table 1) with different concentrations of sugar solutions.
The PLS-R model for the X- and Y-variables explained 91% of the variance. Three PLS-R factors were sufficient to describe the correlation between the spectra and the sugar content. In order to describe the efficiency of the PLS-R model, the coefficient of determination (R2) and root mean square error (RMSE) were calculated. The RMSE and R2 are two statistical measures used to evaluate how well a linear regression model fits a dataset. The RMSE measures the accuracy of the model’s predictions, while the R2 measures how well the model’s predictor variables explain the variation in the response variable [31]. The accuracies of the calibration and validation were evaluated using the R2 for the calibration R2c = 0.9 and validation R2cv = 0.91 models. The quality of the models were evaluated according to values of the error of calibration, RMSEC = 0.03 g, and the error of cross-validation, RMSECV = 0.036 g. High R2c and R2cv values are achieved with extremely low RMSEC and RMSECV values.
Figure 2 presents the PLS-R model for cotton samples soaked with different concentrations of sugar. For model building and understanding the PLS-R factor loadings, loading weights for all three factors are displayed in the Supplementary Materials (Figure S1). Figure 2a displays the correlations between the predicted and reference values, whereas the regression coefficients for the three-factor model are illustrated in Figure 2b. the samples F and G have similar ratios, 0.0324 and 0.0321 (msugar/mcotton); hence, they overlap in the regression coefficient plot. Two negative bands at 235 nm and 282 nm and one positive band at 250 nm can be assigned to protein and pectin absorbances [3,27].
The PLS-R model was used to predict the honeydew content for each pixel of a hyperspectral image. Three raw cotton samples of three grades of honeydew contamination (light, strong, and very strong) were collected, and the resulting distribution maps are shown in Figure 3. The distribution maps present a clear lateral classification of different ratios of msugar/mcotton, and the predicted ratios decrease from the very strong samples to the light samples. The sugar content is highly correlated with the honeydew amount. The analysis reveals a highly variable distribution of honeydew across all samples. Some regions present minimal contamination, while others, including areas/pixels in the light samples, exhibit up to 0.1 msugar/mcotton ratio, comparable to those found in the very strong samples. The observed inhomogeneity in honeydew distribution suggests that our soaking method for the sugar solution is a realistic approach, as it induces a comparable level of variability. However, the inhomogeneity seems to be even higher in the raw samples, as shown in Figure 3.

4. Conclusions

UV hyperspectral imaging (225–300 nm) was combined with multivariate data analysis to successfully identify and quantify honeydew on raw cotton samples. Therefore, a reference sample set based on cotton samples was prepared and imaged in UV.
The samples were soaked with solutions containing sugar and proteins at different concentrations to mimic honeydew. A PCA model enabled the classification of the cotton samples according to their sugar concentrations. The PLS-R model was able to predict laterally resolved honeydew content pixel by pixel in grams on raw cotton samples. The analysis reveals that the raw cotton samples have an inhomogeneous distribution of honeydew. Therefore, the chosen soaking method closely approximates the distribution patterns observed in the raw samples. The results were obtained by analyzing samples labeled as light, strong, and very strong contaminated with honeydew. This combination of hyper-spectral imaging with multivariate data analysis represents a high potential technique for detecting honeydew contamination in real-time.

Supplementary Materials

The following supporting information can be downloaded at: https://www.mdpi.com/article/10.3390/textiles3030019/s1, Figure S1. X-loading weights and x-loadings for factor 1 (a,b), factor 2 (c,d), and factor 3 (e,f), respectively.

Author Contributions

Conceptualization, M.A.K. and M.K.; methodology, M.A.K. and M.K.; software, M.A.K., M.K. and F.W.; validation, M.A.K. and M.K.; formal analysis, M.A.K., M.K. and F.W.; investigation, M.A.K. and M.K.; resources, E.O. and M.B.; data curation, M.A.K., M.K. and F.W.; writing—original draft preparation, M.A.K. and M.K.; writing—review and editing, M.A.K., M.K., F.W., E.O., V.J. and M.B.; visualization, M.A.K. and M.K.; supervision M.B.; project administration, M.B. All authors have read and agreed to the published version of the manuscript.

Funding

This research received no external funding.

Data Availability Statement

The raw/processed data required to reproduce these findings cannot be shared at this time as the data also form part of an ongoing Ph.D. thesis.

Conflicts of Interest

The authors declare no conflict of interest.

References

  1. Wang, H.; Memon, H. Cotton Science and Processing Technology; Springer Nature: Singapore, 2021; Volume 5, p. 565. [Google Scholar]
  2. EN 14278-2:2004; Textiles-Determination of Cotton Fibre Stickiness-Part 2: Method Using an Automatic Thermodetection Plate Device. DIN Deutsches Institut für Normung: Berlin, Germany, 2004.
  3. Al Ktash, M.; Hauler, O.; Ostertag, E.; Brecht, M. Ultraviolet-visible/near infrared spectroscopy and hyperspectral imaging to study the different types of raw cotton. J. Spectr. Imaging 2020, 9, a18. [Google Scholar] [CrossRef]
  4. Mansuri, A.; Somani, S.; Pathak, R. Effect of Waste Control on Yarn Parameters and Yield Improvement in Spinning Mill. J. Crit. Rev. 2020, 7, 2314–2322. [Google Scholar]
  5. Jiang, Y.; Li, C. Detection and discrimination of cotton foreign matter using push-broom based hyperspectral imaging: System design and capability. PLoS ONE 2015, 10, e0121969. [Google Scholar] [CrossRef]
  6. Barotova, A.; Xurramov, A.; Raxmatullayev, S.; Ismoilova, A. Evaluation of fiber quality indexes in different varieties of cotton plants. J. Agric. Hortic. 2023, 3, 41–46. [Google Scholar] [CrossRef]
  7. Bradow, J.M.; Davidonis, G.H. Quantitation of fiber quality and the cotton production-processing interface: A physiologist’s perspective. Cotton Sci. 2000, 4, 34–64. [Google Scholar]
  8. Campbell, B.T.; Hinze, L. Cotton production, processing and uses of cotton raw material. In Industrial Crops and Uses; CABI: Wallingford, UK, 2010; pp. 259–276. [Google Scholar]
  9. Chand, N.; Fahim, M. (Eds.) Cotton Reinforced Polymer Composites; Springer: Berlin/Heidelberg, Germany, 2008. [Google Scholar] [CrossRef]
  10. Afzal, M.I. Cotton stickiness–A marketing and processing problem: Improvement of the Marketability of Cotton Produced in Zones affected by Stickiness. In Proceedings of the Final Seminar, Lille, France, 2–4 July 2001; pp. 105–111. [Google Scholar]
  11. Bi, J.; Ballmer, G.; Hendrix, D.; Henneberry, T.; Toscano, N. Effect of cotton nitrogen fertilization on Bemisia argentifolii populations and honeydew production. Entomol. Exp. Appl. 2001, 99, 25–36. [Google Scholar] [CrossRef]
  12. Ghule, A.V.; Chen, R.K.; Tzing, S.H.; Lo, J.; Ling, Y.C. Simple and rapid method for evaluating stickiness of cotton using thermogravimetric analysis. Anal. Chim. Acta 2004, 502, 251–256. [Google Scholar] [CrossRef]
  13. Was-Gubala, J.; Starczak, R. Nondestructive identification of dye mixtures in polyester and cotton fibers using Raman spectroscopy and ultraviolet-visible (UV-Vis) microspectrophotometry. Appl. Spectrosc. 2015, 69, 296–303. [Google Scholar] [CrossRef]
  14. Abidi, N.; Hequet, E. Fourier transform infrared analysis of cotton contamination. Text. Res. J. 2007, 77, 77–84. [Google Scholar] [CrossRef]
  15. Chung, C.; Lee, M.; Choe, E. Characterization of cotton fabric scouring by FT-IR ATR spectroscopy. Carbohydr. Polym. 2004, 58, 417–420. [Google Scholar] [CrossRef]
  16. Fuhrer, L. Mapping of In-Field Cotton Fiber Quality Utilizing John Deere’s Harvest Identification System (Hid). Doctoral Dissertation, University of Georgia, Athens, GA, USA, 2022. [Google Scholar]
  17. Liu, Y. Recent Progress in Fourier Transform Infrared (FTIR) Spectroscopy Study of Compositional, Structural and Physical Attributes of Developmental Cotton Fibers. Materials 2013, 6, 299–313. [Google Scholar] [CrossRef] [PubMed] [Green Version]
  18. Rodgers, J.; Beck, K. NIR characterization and measurement of the cotton content of dyed blend fabrics. Text. Res. J. 2009, 79, 675–686. [Google Scholar] [CrossRef]
  19. Al Ktash, M.; Stefanakis, M.; Wackenhut, F.; Jehle, V.; Ostertag, E.; Rebner, K.; Brecht, M. Prediction of Honeydew Contaminations on Cotton Samples by In-Line UV Hyperspectral Imaging. Sensors 2023, 23, 319. [Google Scholar] [CrossRef] [PubMed]
  20. Al Ktash, M.; Stefanakis, M.; Boldrini, B.; Ostertag, E.; Brecht, M. Characterization of Pharmaceutical Tablets Using UV Hyperspectral Imaging as a Rapid In-Line Analysis Tool. Sensors 2021, 21, 4436. [Google Scholar] [CrossRef] [PubMed]
  21. Al Ktash, M.; Stefanakis, M.; Englert, T.; Drechsel, M.S.; Stiedl, J.; Green, S.; Jacob, T.; Boldrini, B.; Ostertag, E.; Rebner, K.; et al. UV hyperspectral imaging as process analytical tool for the characterization of oxide layers and copper states on direct bonded copper. Sensors 2021, 21, 7332. [Google Scholar] [CrossRef]
  22. Boldrini, B.; Kessler, W.; Rebner, K.; Kessler, R.W. Hyperspectral imaging: A review of best practice, performance and pitfalls for in-line and on-line applications. J. Near Infrared Spectrosc. 2012, 20, 483–508. [Google Scholar] [CrossRef]
  23. Gowen, A.; Odonnell, C.; Cullen, P.; Downey, G.; Frias, J. Hyperspectral imaging—An emerging process analytical tool for food quality and safety control. Trends Food Sci. Technol. 2007, 18, 590–598. [Google Scholar] [CrossRef]
  24. Fischer, M.K.; Völkl, W.; Hoffmann, K.H. Honeydew production and honeydew sugar composition of polyphagous black bean aphid, Aphis fabae (Hemiptera: Aphididae) on various host plants and implications for ant-attendance. Eur. J. Entomol. 2005, 102, 155–160. [Google Scholar] [CrossRef] [Green Version]
  25. Hogervorst, P.A.; Wäckers, F.L.; Romeis, J. Effects of honeydew sugar composition on the longevity of Aphidius ervi. Entomol. Exp. Appl. 2007, 122, 223–232. [Google Scholar] [CrossRef]
  26. Victorita, B.; Marghitas, L.A.; Stanciu, O.; Laslo, L.; Dezmirean, D.; Bobis, O. High-performance liquid chromatographic analysis of sugars in Transylvanian honeydew honey. Bull. UASVM Anim. Sci. Biotechnol. 2008, 65, 229–232. [Google Scholar]
  27. Lottspeich, F.; Zorbas, H. Bioanalytik, 4th ed.; Spektrum, A., Ed.; Springer: Berlin/Heidelberg, Germany, 2022. [Google Scholar]
  28. Janshekar, H.; Brown, C.; Fiechter, A. Determination of biodegraded lignin by ultraviolet spectrophotometry. Anal. Chim. Acta 1981, 130, 81–91. [Google Scholar] [CrossRef]
  29. Sadeghifar, H.; Venditti, R.; Jur, J.; Gorga, R.E.; Pawlak, J.J. Cellulose-lignin biodegradable and flexible UV protection film. ACS Sustain. Chem. Eng. 2017, 5, 625–631. [Google Scholar] [CrossRef]
  30. Mach, H.; Volkin, D.B.; Burke, C.J.; Russell Middaugh, C. Ultraviolet absorption spectroscopy. In Protein Stability and Folding; Humana Press: Totowa, NJ, USA, 1995; pp. 91–114. [Google Scholar] [CrossRef]
  31. Mevik, H.; Wehrens, R. Introduction to the pls Package. J. Stat. Softw. 2023, 1–23. [Google Scholar]
Figure 1. (a) Averaged spectra recorded via UV hyperspectral imaging of raw cotton samples with sugar solutions in different concentrations: A (4 wt %), B (2 wt %), C (1 wt %), D (0.5 wt %), E (0.25 wt %), F (0.125 wt %), G (0.0625 wt %), and CLN (mechanically cleaned). PCA sugar model for the cotton samples with (b) scores on the first principal component (PC1) and second principal component (PC2) and (c) corresponding loadings (PC1—black dashes; PC42—short red dashes).
Textiles 03 00019 g001
Figure 2. Figure 2. Three-factor PLS-R model for different sugar contents in the UV region (225–300 nm). (a) Predicted vs. reference plots and (b) corresponding regression coefficients.
Textiles 03 00019 g002
Figure 3. Distribution maps of the sugar content predicted for each pixel of the UV hyperspectral imaging data from the five-factor PLS-R model on the raw cotton samples contaminated with honeydew. Each rectangle represents a single cotton sample ((a) very strong, (b) strong, and (c) light). The colored pixels (see the score value range) represent the sugar content, from low (blue) to high (red).
Textiles 03 00019 g003
Table 1. The sugar solution concentration and the weighted average sugar on cotton samples.
Sample TypeSugar Concentration/wt %msugar/mcotton
A40.4249
B20.2413
C10.1194
D0.50.0609
E0.250.02313
F0.1250.0126
G0.06250.0143
CLN--
Disclaimer/Publisher’s Note: The statements, opinions and data contained in all publications are solely those of the individual author(s) and contributor(s) and not of MDPI and/or the editor(s). MDPI and/or the editor(s) disclaim responsibility for any injury to people or property resulting from any ideas, methods, instructions or products referred to in the content.

